portland cement (total dust)
TRANSCRIPT
1
Portland Cement (Total Dust)
____________________________________________________________________________
Method Number: ID-207
Matrix Air filter and Bulk material
OSHA Permissible Exposure Limits (TWA)
10 mg/m3 Total Dust 5 mg/m3 Respirable Dust (See Section 1)
Collection Procedure:
Total dust air samples are collected on tared 5-µm pore size, 37-mm diameter polyvinyl chloride (PVC) filters. The air samples are post-weighed and submitted to the laboratory when total dust exposures exceed 10 mg/m3. A bulk sample consisting of 10 to 20 mL of Portland cement is collected to serve as reference material for laboratory quantitation.
Recommended Air Volume and rate
240 L, 1L/min for total dust air samples
Analytical Procedure:
Samples are quantitatively analyzed and qualitatively identified by X-ray techniques. Standards are prepared from the bulk material. Suspensions of the samples are deposited onto Ag membrane filters and quantitatively analyzed by measuring X-ray fluorescence (XRF) intensities for Ca, Si, Fe, and Sr in PC and by measuring the attenuation of X rays from the fluorescing Ag membrane filter. For qualitative confirmation, the common PC crystalline solid phases in the bulk and air sample dusts are compared using X-ray diffraction.
Detection Limits: 11 to 640 µg PC [Detection limits depend upon interferences present (See Sections 1.3.1. and 4.2.1.).]
Overall Analytical Error:
±22.9%
Method Classification:
Validated Analytical Method
Date: May 1991 Chemist: Mike C. Rose
Branch of Inorganic Methods Development OSHA Salt Lake Technical Center Salt Lake City, Utah-84115

2
Commercial manufacturers and products mentioned in this method are for descriptive use only and do not constitute endorsements by USDOL-OSHA.
Similar products from other sources can be substituted.
1. Introduction
This method describes the sampling and analysis of industrial hygiene total dust air samples for unfinished Portland cement (PC).
General industry often expresses the composition of materials derived from minerals as simple oxides. This convention is useful in accounting for the elemental composition of PC, but it does not describe the actual compounds present. Using this convention, the four major PC components are CaO, SiO2, Al2O3, and Fe2O3. In terms of these hypothetical components, the approximate composition of PC is as follows:
CaO 59 to 75%
SiO2 17 to 28%
Al2O3 + Fe2O3 4 to 20%
Total ~100%
(See Reference 5.1. for a ternary phase diagram that more clearly portrays the stoichiometric oxide composition of PCs.)
Typical PC compositions also include the minor elements Cr, Zn, F, Mn, P, Sr, Na, Ti, K, Mg, and S with concentrations ranging from 0.01 to several percent, respectively (5.2.).
In chemical terms, the two essential major components in PC are tricalcium silicate (Ca3SiO5) and dicalcium silicate (Ca2SiO4) (5.3.-5.5.). Additional compounds commonly present in PC include alumina (Al203), tricalcium aluminate (Ca3Al2O6), iron oxide (Fe2O3) and calcium aluminum ferrite (Ca4Al2Fe2O10) (5.1., 5.5., 5.6.).
The manufacture of PC involves heating together specifically selected ground minerals to give the desired composition of PC. The heating process produces chunks of PC called clinker. To produce commercial grade PC, the PC clinker is usually ground with a small amount of the calcium-containing mineral gypsum (CaSO42H2O) to control the rate of setting (5.1.-5.3.). The PC composition and particle-size distribution determine how the material sets up after water is added.
In crystallographic terms, Portland cement is a complex mixture; the amount of each solid phase present depends on the starting composition, thoroughness of mixing, firing conditions, and the thermal history of the material. At least 22 different solid phases have been identified. Unstable solid

3
phases can persist at room temperature; for example, PC has six distinct alite polymorphs (i.e., different Ca3SiO5 crystalline solid phases) - each stable at a different temperature range; the presence of impurities in PC allow three alite polymorphs to coexist at room temperature (5.1.). Portland cement has negligible vapor pressure, negligible aqueous solubility and a variable composition. Typical bags of commercial "Portland cement" also contain additives. Because Portland cement is a mixture and not a single compound, a representative pure bulk sample of the PC material must be collected at the time of air sampling for laboratory use to resolve this variability in composition. The bulk sample defines the particular PC composition to which the employee is exposed. Air samples are collected to determine personal exposures. Due to the variable elemental composition of PC, this method analyzes several elements by X-ray fluorescence (XRF) to quantitatively evaluate PC exposures. Due to the variable crystalline composition this method qualitatively assesses whether crystalline PC phases are present by X-ray diffraction (XRD).
The following samples g flow chart indicates the recommended treatment of these samples: Portland cement air.
This method concentrates on total dust sampling; respirable samples can also be taken to assess compliance to the OSHA 5 mg/m3 respirable dust PEL. Respirable PC exposures are determined gravimetrically in the field by the compliance officer or industrial hygienist. The respirable dust PEL for PC is identical for most respirable dusts, and any exceptions (e.g., quartz and vanadium pentoxide) are lower than 5 mg/m3. At the present time, there is no need to verify that respirable dust air samples consist only of PC. However, these respirable PC dust samples can be submitted to the laboratory for quartz analysis because quartz is a potential contaminant in PC. Refer to the quartz method 5.7. for the appropriate respirable quartz dust sampling procedure.

4
If the laboratory analyzing the samples has a controlled environment where the relative humidity (RH) is less than 80%, the XRD qualitative verification step may be performed prior to XRF quantitation. See Section 3 for procedural variations.
As previously mentioned, commercial PCs are complex mixtures. Each PC component has different physical properties. Portland cement is ground in the final stage of manufacture; therefore, one can expect different particle-size distributions for each component. When suspended in the air, the resulting differential settling of components may significantly contribute to variation in the analytical results. To compensate for the expected variation in sampling, several different analyses are performed. Samples and standards are quantitatively analyzed for PC based on Ca, Si, Fe, and Sr by XRF. The Ca and Si are major constituents occurring in the two essential calcium silicates present in PC. The trace elements Fe and Sr are in the raw materials used to produce the PC clinker; therefore, assessments of these elements also provide useful estimates for PC content. In addition, the X-ray fluorescence from the Ag membrane filter is used for a mass absorption (MA) analysis of the samples. By measuring the attenuation of X rays from the fluorescing Ag membrane filter, the overall mass of the sample can be determined. Analysis by MA is sensitive to the mean composition of the sample. Due to the potential for outliers among the five quantitative analyses, the median result of the five is the most representative measure of PC content.
Because of the potential for interferences, qualitative confirmation is a necessary step. After the XRF analyses, the prepared total dust air samples and bulk reference samples are resubmitted for qualitative verification using XRD to confirm the presence of PC crystalline solid phases. The total dust and bulk samples are also screened for quartz using OSHA Method ID-142 (5.7.). Quartz is usually a minor but common component In PC. The results for quartz analyses of total dust and bulk samples are approximate. If the PC material contains more than 1% quartz, the PEL for quartz should be considered and respirable dust samples should be obtained 5.5..
The elements Ca, Si, Fe, and Sr are widely distributed in the environment; therefore, the identification of these elements does not provide conclusive confirmation of the presence of PC. Also, mass absorption analysis by XRF provides no qualitative information. For these reasons, analytical results are reported only when there is both general quantitative agreement and qualitative XRD verification of the PC crystalline solid phases.
1.1 History
1.1.1 The previous PEL for PC was 50 million particles per cubic foot (mppcf) which required an impinger sampling method for collection. Analysis was performed by particle counting using light microscopy. The 50 mppcf PEL was equivalent to approximately 15 mg/m3. This level is the same as for particulates not otherwise regulated; therefore, the exposure could be evaluated gravimetrically. The PEL was changed in 1989 to 10 mg/m3 due to the irritant status of PC and so that gravimetric methods could be used by industrial hygienists to monitor employee exposures (5.5.). The 10 mg/m3 level, however, is less than the nuisance dust level
5
of 15 mg/m3 and entails identification to verify PC content. The PC phases can not be identified either gravimetrically or by light microscopy.
1.1.2 Classical wet-chemical techniques have been applied to the elemental analysis of PC (5.2., 5.8.). Due to limited sensitivity, these techniques are not optimal for the quantitation of low-mass air samples obtained in industrial hygiene monitoring. These wet-chemical techniques are destructive to the sample and do not offer phase identification. Although it is possible to prepare samples first for phase identification and then destructively analyze the sample by a wet method, this would involve tedious sample preparation.
1.1.3 Atomic absorption spectroscopy (AAS) offered a potential alternative method that might be adapted for low-mass air samples (5.9.). However, the identification of PC phases introduces the same complications noted in Section 1.1.2.
1.1.4 Another quantitative method investigated was a collaborative study with West Germany's Saarbergwerke Aktiengesellschaft (SA) (5.10.) using their XRD technique. Well-characterized reference materials were provided by SA. The SA XRD method required reference materials that have particle-size distributions comparable to the air samples. Potential interferences had been thoroughly identified. It was determined that the SA XRD method was appropriate for respirable dust samples, but problems may arise when attempting to quantify PC content in total dust samples. However, the XRD method was considered a suitable technique to confirm the presence of PC in total dust samples.
1.1.5 The XRD and XRF portions of this method were evaluated using the equipment described in Section 4.
1. 2. Principles
1. 2.1 X-ray fluorescence relies upon the excitation of atoms in a sample by the application of X rays of sufficient energy to cause the promotion of inner orbital electrons and subsequent decay accompanied by characteristic X-ray fluorescence.
In an energy-dispersive X-ray fluorescence (EDXRF) spectrometer, the selected energy scale (or energy span) is divided up into smaller divisions called channels in order to provide adequate energy resolution. Each channel represents an X-ray energy having a small range of values. For example, in a multichannel analyzer (MCA) having 1,000 channels, the central channel would represent X-ray energies between 5.000 and 5.010 kV when the MCA is calibrated 10 kV full scale. During an analysis, the energy of each detected X-ray photon is measured. Those photons having energies within the selected energy scale are counted by incrementing the channel in the MCA that corresponds to the measured energy. The line spectra resulting from X-ray fluorescence are broadened into peaks by the limited ability of the spectrometer to resolve X-ray photon energies. The peak shape approximates a normal (so-called Gaussian) distribution. When plotted as a function of energy, the count data result in a

6
spectrum after sufficient counts are accumulated. Profile-fitting (deconvolution) computer software can be used to determine net counts from peak areas or to resolve instances of interferences due to peak overlaps.
The approximate relationship between an element's atomic number and the energy of individual emission lines for each specific X-ray line series (e.g., the Kα line or the Lβ line) is given by Moseley's law:
E = a(Z - σ)2
Where:
E = energy of X ray a = proportionality constant Z = atomic number σ = constant for each line series
Moseley's law indicates that an element's spectral lines are a smooth function of the atomic number. The spectral lines for elements with low atomic number (light elements) occur at lower energies than the corresponding lines for elements with high atomic number (heavy elements). The peak energies and spectral group patterns provide for qualitative identification.
1.2.2 Quantitation by XRF is tailored for thin layer dust samples redeposited on Ag membrane filters. For uniform thin deposits, EDXRF produces signal intensities that are proportional to the amount of analyte present. Matrix effects are normally minimal for such samples; however, non-linear calibration curves can be used to correct for the fluorescing Ag support medium, shadowing of particles in Ag membrane filter pores, and particle-size effects. Calibration curves are further discussed in Appendix A.
Low-energy X rays are more strongly absorbed in thin layer samples than are high-energy X rays. The MA analysis in this method uses the attenuation of low-energy X rays (L series) arising from the fluorescing Ag membrane filter to determine sample mass. The fluorescence X rays from the Ag membrane filter blanks are unattenuated by sample; therefore, blanks have higher counts than the air samples in this kind of analysis and are more prone to counting error. To improve the analytical accuracy in the MA analysis, three blanks (two field blanks and one lab blank) are used.
1.2.3 The X-ray diffraction technique is based on the Bragg equation: nλ = 2d sinθ

7
Where:
n = order of diffracted beam (usually 1) λ = wavelength of the monochromatic X-ray beam (Å) d = distance between diffracting planes (Å) θ = angle between incident X-rays and the diffracting planes (in degrees)
Note: Most X-ray diffractometers are designed to scan using degrees two-theta (2θ). All 2θ angle references in this method assume a copper anode X-ray tube and a wavelength of ~1.54 Å.
1.2.4 Each crystalline substance has a unique repeating structure that extends in various directions throughout the crystal. As a result of this periodicity, crystalline substances have atoms that lie in planes parallel to one another which can participate in diffracting incident X rays. The unique repeating structure can thus be probed with X rays to determine the set of diffraction spacings (d-spacings) that uniquely characterize each substance. During X-ray diffraction analyses, the angle (measured as 2θ) is stepped in small increments. At each increment, the diffractometer pauses to count the diffracted X rays for a specified period of time. A diffraction pattern is produced by stepping the diffraction angle over a wide range. Because powder samples of crystalline substances present essentially all orientations to the X-ray beam, diffraction peaks from each different diffracting plane are reproducibly represented in the diffraction pattern.
1.2.5 Two examples of experimentally determined PC XRD patterns are included in Appendix B. Each PC has a different mixture of crystalline phases and each Ca-containing phase is subject to differing amounts of ion-exchange with Mg and Sr. Because Mg and Sr have ionic radii that differ from Ca, the ion-exchange results in variations in d-spacings that are evidenced by peak shifts in the pattern. For this reason, the experimentally determined patterns may differ from those found in published pattern libraries for pure crystalline phases. The pattern for each PC is unique and may be used like a fingerprint to identify it.
1.3 Method Performance
Two different PC standard reference materials, SRM 635 and SRM 637, were obtained from the National Institute of Standards and Technology (NIST). These were used to evaluate method performance. The detection limit (DL), recovery (R), coefficients of variation (CV and CVT), and overall error (OE) data were determined.

8
1.3.1 Method detection limits
The detection limits for Si-, Ca-, and MA-based analyses reported below were obtained for XRF instrumentation that was optimized for the analytes Si and Ca in a typical PC having a composition of 45% Ca and 10% Si. Due to the variability of trace-element composition in PC, the detection limits for Fe- and Sr-based analyses may deviate from the estimates shown. Detailed comparisons of the PC SRMs are shown in Section 4.2.
For PC samples collected on polyvinyl chloride (PVC) membranes and transferred to 25-mm Ag membrane filters, the PC detection limits are shown below. These limits are based on the analytical peaks (AP) for the major PC elements. The oxide compositions shown were obtained from the NIST Certificates of Analysis.
------ SRM 637 ------- ------ SRM 635 ------- Counting
AP DL (µg PC) % oxide DL (µg PC) % oxide Time (s)
Si Kα 11 23.1 16 18.4 200
Ca Kα 13 66.0 17 59.8 200
The range of detection limits based on trace-element analyses of PC is very susceptible to composition. The detection limits for PC from these trace elements are as follows:
Detection limits for mass absorption analyses are relatively unaffected by composition. The detection limit for simple mass absorption (MA) analysis of PC using Ag L radiation from Ag support membrane filters are as follows:
------ SRM 637 ------- ------ SRM 635 ------- Counting
AP DL (µg PC) % oxide DL (µg PC) % oxide Time(s)
Fe Kα 95 2.61 160 1.80 1,000
Sr Kα 210 0.21 640 0.09 1,000

9
SRM 637 SRM 635 Counting
AP DL (µg PC) DL (µg PC) Time (s)
MA 180 190 200
1.3.2 Recovery, coefficients of variation, and overall error:
Combined results from air sampling at low humidity (SRM 635 and 637) and at 80% RH (SRM 637):
PC Mass range (mg)
n
R
CV
CVT
OE(%)
0.6 to 7.7 26 1.001 0.103 0.114 ±22.9
1.3.3 Instrument response to the analyte:
The practical analytical range for the XRF analysis of PC elements on Ag membrane filters extends from the detection limit up to about 4 mg. For thin-film analyses by XRF, the upper end of the analytical range depends primarily upon self-absorption of X rays within the sample. In the case of PC analyses, where the matrix is held constant, the more energetic fluorescence lines have larger useful ranges. However, the same sample is analyzed using all five lines, and thereby limits the maximum sample weight to what can be practically analyzed by the low-energy lines. During the method evaluation, examination of the PC calibration curves gave the following estimates of the upper analytical limits:
Element Energy (kV) Mass PC(mg) Comments
Si Kα 1.740 5 Major element
MA 2.984 5 Ag membrane *
Ca Kα 3.691 5 Major element
Fe Kα 6.403 10 Trace element
Sr Kα 14.164 15 Trace element
* Uses fluorescence from Ag membrane (L series X rays for Ag)
10
A more conservative estimate for the upper mass per analytical sample is 4 mg. Samples exceeding 4 mg should be split into aliquots to be analyzed separately.
1.4 Advantages
1.4.1 The method provides for non-destructive analyses.
1.4.2 The sample preparation is compatible for both XRF and XRD analyses.
1.4.3 The method provides qualitative evidence of PC by comparing XRF and XRD spectral patterns of air samples to those of reference material.
1.4.4 The method can provide additional qualitative information for a large number of elements including any unexpected elements.
1.4.5 The method requires no sampling reagents and sample preparation is minimal.
1.4.6 Samples are screened gravimetrically in the field. Samples showing low exposures need not be submitted for laboratory analysis.
1.5 Disadvantages
1.5.1 Samples with high sample weights (>4 mg) must be split into aliquots during analysis.
1.5.2 The method requires expensive instrumentation and support software.
1.5.3 The method requires the collection and analysis of pure PC bulk samples for quantitative analysis and qualitative confirmation.
1.5.4 The method is not suitable for finished PC materials because comparable reference materials are usually unavailable. Preliminary studies indicate that dry commercial mixtures containing PC cannot be analyzed by this method. These include concrete, sandcrete, fast-cure leak patching mix, and mortar mix.
1.5.5 The standards and samples prepared on Ag membrane filters should be stored prior to analysis in a desiccator containing a drying agent in order to prevent sample hydration. (See Sections 4.7. and 4.8.)
1.6 Toxicology
Information contained in this section is a synopsis of current knowledge of the physiological effects of PC and is not intended to be used as a basis for OSHA policy.

11
Risks of exposure include eye, skin, and mucous membrane irritation, and may include more severe respiratory effects, all of which constitute material health impairments (5.5.)
a. Eye exposure (5.11.): Suspensions of PC in vater, when splashed into the eye, cause smarting and corneal edema. Aqueous suspensions are sufficiently alkaline to injure the corneal epithelium and conjunctiva.
b. Skin exposure (5.11.): Primary irritant dermatitis from repeated skin contact with PC includes symptoms of xerosis, eczematous lesions with vesicles, erythema, fissures, and mild scaling. Portland cement occasionally contains hexavalent chromium which may produce secondary contact sensitivity in some individuals.
c. Respiratory tract exposure (5.11.): Symptoms include cough, expectoration, exertional dyspnea, wheezing, and chronic bronchitis. Exposure can also cause chronic conjunctivitis, blepharitis, and ulcers of the nose.
Aside from irritation, PC is eventually eliminated from the tissue and is generally not considered harmful when ingested 5.5.. However, PC added to grain has been used as a rat poison; death is probably due to physical blockage of the gastrointestinal tract.
1.7 Sources of Exposure 5.11.
Portland cement, hydraulic cement, CAS: 65997-15-1
Application Source of exposure
Commercial PC Breaking-up and grinding clinker, mixing, packaging and shipping
Commercial dry mixtures; concrete, mortars, grouts, and asbestos-cement
Mixing and on-site uses for highway paving, domestic and commercial construction: structural support in mining industry
Composites During manufacture of building blocks, bricks, stone, terrazzo, stucco, foamed concrete, and pre-cast items; as a moisture sealant on pre-cast blocks
Portland cement should not be confused with refractory cements composed primarily of calcium aluminates.

12
2. Sampling
2.1 Safety Precautions
2.1.1 The sampling equipment should be attached to the worker in such a manner that it will not interfere with work performance or safety.
2.1.2 All safety practices that apply to the work area being sampled should be followed.
2.2 Equipment
2.2.1 Air sampling equipment
a. Low ash PVC membrane filter, 37-mm, 5-µm pore size [part no. 625413, Mine Safety Appliances (MSA), Pittsburgh, PA or cat. no. P-503700, Omega Specialty Instrument Co., Chelmsford, MAJ.
Note: During the preparation for analysis, the PVC membrane filter is dissolved in tetrahydrofuran (THF). Certain acrylic copolymers added to PVC filters are insoluble in THF. If the membrane filter composition is unknown, a laboratory test should be conducted with THF to determine suitability before use.
b. Cellulose back-up pads (support pads), (MSA, Pittsbutgh, PA).
c. Polystyrene 37-mm diameter closed-face cassette, (3-section, SKC part no. 225-3, SKC, Fullerton, CA).
d. Gel bands (omega Specialty Instrument Co., Chelmsford, MA) for sealing cassettes.
e. Sampling pump:
For personal samples, use a personal sampling pump that can be calibrated to within ±5% of 1 L/min with the sampling device attached.
f. Assorted flexible tubing.
g. Stopwatch and bubble tube or meter for pump calibration.
h. Analytical balance capable of 10 µg precision.

13
2.2.2 Bulk sampling equipment
Scintillation vials, 20-mL, part no. 74515 or 58515, (Kimble, Div. of Owens-Illinois Inc., Toledo, OH) with polypropylene or Teflon cap liners. If possible, submit bulk samples in these vials. Tin or other metal cap liners should not be used because chemical reaction with the sample can occur.
2.3 Sampling Technique
Note: Because PC composition is highly variable, a representative bulk sample of the pure PC material must be submitted with total dust PC air samples in order to define the particular PC composition to which the worker is exposed. Total dust PC air samples can not be quantitatively analyzed without an appropriate pure bulk sample. If a pure bulk sample can not be obtained, the industrial hygienist should sample for nuisance dust, and should not submit the air samples for PC analysis.
Note: Respirable dust samples are normally not sent to the laboratory for PC analysis; measure these gravimetrically in the field. If quartz is suspected, any air samples should be submitted for quartz analysis. [See OSHA Method ID-142 (5.7.) for further information.]
2.3.1 Air sample collection
Measure PC total dust air samples gravimetrically.
1. Desiccate and then weigh the PVC filter before sampling.
2. Place a cellulose backup pad in a cassette. Place the preweighed PVC filter on top of the backup pad. If large loadings are expected and the membrane filter has a smooth and a rough side, place the membrane filter in the cassette with the smooth side against the backup pad and use a 3-section cassette to help produce a more adherent deposit. Assemble the cassette.
3. Attach tubing between the pump and a flow calibration cassette so that the air will be drawn through the membrane filter. Do not place any tubing in front of the cassette.
4. Calibrate each sampling pump to within ±5% of the recommended sampling rate of 1 L/min with the calibration cassette attached in-line.
5. Attach a prepared cassette to the calibrated sampling pump and place in the employee breathing zone.
6. If possible, take two half-shift samples at the recommended sampling rate.

14
7. Place plastic end caps on each cassette after sampling.
8. Carefully remove the filter from the cassette, desiccate, and weigh the PVC filter sample to determine total dust exposures. Place each filter back in its cassette. Calculate the TWA exposure for each employee using the sample weight(s) collected and air volume(s) used. If the TWA exposure for any employee exceeds 10 mg/m3, submit the sample(s) to the laboratory.
2.3.2. Bulk sample collection
Always collect a sample of powdered PC from the workplace.
Concrete mix or other PC mixtures with substantial additions of gravel, sand, gypsum, or lime are generally not appropriate. Sampling these types of mixtures should be performed to determine quartz content, pH, etc.
1. Collect between 10 to 20 mL of dry homogeneous PC dust reference material representative of the PC used in the workplace. Samples from bagged PC are preferred. Accurate analytical results are dependent on a close match of the PC bulk sample to the PC dust component of the air samples.
2. Transfer the bulk material into a 20-mL scintillation vial, seal with a cap having an inert plastic liner, and wrap the cap with vinyl or electrical tape.
2.3.3 Wipe sample collection
Wipe samples are not appropriate for this method.
2.4 Sample Shipment
2.4.1 On the OSHA 91, state the type of operation sampled. List the bulk samples and cross-reference these to the appropriate air sample(s).
2.4.2 Document the operation and indicate any known or suspected substances present in the area sampled.
2.4.3. Request Portland cement analysis.
2.4.4 Submit at least two blank samples with each set of air samples.
2.4.5 Attach an OSHA-21 seal around each bulk, air, and blank sample in such a way as to secure the end caps.
15
2.4.6 Ship air and blank samples to the laboratory with appropriate paperwork.
2.4.7 Ship bulk samples separately from air samples. They should be accompanied by material safety data sheets if available. Check current shipping restrictions and ship to the laboratory by the appropriate method.
3. Analysis
This method is optimized for the analysis of PC collected on PVC filters using an EDXRF system for quantitation. A wavelength dispersive X-ray fluorescence (WDXRF) system may be used in place of an EDXRF system.
The user must decide upon the applicability of available equipment and software for this method.
As mentioned in Section 1., the XRD portion may be performed prior to the XRF portion. Because the sequence of analysis is flexible, improved laboratory efficiency may be obtained. Circumstances arise where subsequent analyses may be unnecessary:
a. Subsequent XRD verification of PC is not needed if the preliminary XRF quantitation indicates that exposures are less than the PEL. (Screening for quartz may still be advisable.)
b. Subsequent XRF quantitation is not needed if the preliminary XRD analyses do not qualitatively identify PC crystalline phases as present in the air samples.
3.1 Safety Precautions
3.1.1 Chemical
a. Tetrahydrofuran has a low flash point, -14 °C (6 °F), and is extremely flammable. Always use THF in a hood. THF is an ether which can form explosive peroxides upon exposure to air; therefore, it should be stored in closed metal containers. Always use THF-resistant gloves, a lab coat, and safety glasses when handling THF.
b. Parlodion and isopentyl acetate are flammable and should be used in a hood.
c. Handle reagents and bulk samples carefully. Use protective equipment such as: gloves, laboratory coats, safety glasses, and an exhaust hood. Wear a fit-tested respirator if necessary. Clean up spills immediately.

16
3.1.2 Radiation
a. Follow established laboratory safety guidelines. Modern X-ray fluorescence spectrometers and X-ray diffractometers have built-in safety devices and interior to prevent X-ray exposure. WARNING: These devices should not be adjusted removed, or overridden for any reason.
b. X-ray operators should wear radiation monitors. These monitors consist of badges and finger rings which are periodically analyzed to detect cumulative exposure to low-level radiation.
c. There should be a red or yellow warning light which, when lit, indicates that power is supplied to the X-ray tube. The instrument may be checked for radiation leaks using a sensitive radiation survey meter. Radiation leaks, if present, will be most easily detected when the X-ray tube is operated at the highest power design specification.
d. Periodically, have safety mechanisms checked to determine satisfactory operation. A sensitive, fixed position radiation alarm may be used as an area monitor; however, damaging radiation exposures can occur in collimated beams that do not intersect the monitor's probe.
e. Avoid inserting fingers into the sample compartment; use forceps to change samples.
3.2 Equipment
3.2.1 X-ray fluorescence spectrometer
The specific equipment used in this evaluation is described in Section 4. The spectrometer should be equipped with appropriate monitors, collimators, and secondary targets. The spectrometer used to evaluate this method included the following items:
Lucite monitor Tantalum collimator Silver secondary target with silver filter NaCl secondary target (see Section 3.6.3. step 3.)
3.2.2 X-ray diffractometer
The specific equipment used in the evaluation is described in Section 4. The automated powder diffractometer (APD) should be equipped with an output device that can provide hardcopies of scans. Other useful features include:
Spinning sample holders Support software for: Storing, recalling, and comparing spectrum files Locating peaks and determining peak intensity

17
Profile fitting Powder diffraction file library
3.2.3 The following equipment can be used:
a. Standard and sample preparation
1. Sieve, nylon, 41-µm (Spectra/Mesh N sieve, Cat. no. 08-670-202, Fisher Scientific, Springfield, NJ) or (Cat. no. 146502, Spectrum Medical Industries, Inc., Los Angeles, CA). A mini-sieve may be constructed by sandwiching the nylon mesh between the two spacer rings of a four-piece 37-mm air sampling cassette. Similar non-contaminating sieves may be used.
2. Low ash PVC membrane filters, 37-mm, 5-µm pore size [part no. 625413, Mine Safety Appliances (MSA), Pittsburgh, PA or cat. no. P-503700, Omega Specialty Instrument Co., Chelmsford, MA].
3. Analytical balance capable of 10-µg precision.
4. Centrifuge tubes, round bottom, 40-mL (Pyrex 8260).
5. Gloves, THF-resistant [such as latex gloves (Cat. no. 8852, American Pharmaseal Lab., Glendale, CA)].
6. Forceps.
7. Silver membrane filters: 25-mm diameter, 0.45-µm pore size (Cat. no. FM25-0.45, Osmonics, Inc., Minnetonka, MN).
8. Ultrasonic bath.
9. Filtration apparatus: 25-mm (Filter Holder Hydrosol Manifold, cat. no. XX25 047 00, filtering clamps, cat. no. XX10 025 03, fritted glass bases with stoppers, cat. no. XX10 025 02, and glass funnels, cat. no. XX10 025 11, Millipore Corp., Bedford, MA).
10. Liquid nitrogen cold-trap system for THF collection (dewar, polypropylene vacuum flask, liquid nitrogen, etc.).
11. Eyedropper and glass plate.
12. Hot plate, intrinsically safe (Model HP-11515B, Sybron/Thermolyne, Dubuque, IA).
13. Teflon sheet, 0.3- to 1-mm thick (cut to fit top of hot plate).
14. Plastic petri dishes (Product no. 7242, Gelman Sciences, Ann Arbor, MI).
15. Vacuum desiccator with anhydrite (CaSo4) or other drying agent.
16. Vacuum system.
b. Accessories for XRF analyses
1. Laboratory press, 12-ton (Cat. no. A14-100, Kevex, San Carlos, CA.).
18
2. Pellet die set for preparing Cl secondary target, 13-mm diameter (Cat. no. A10-401, Kevex).
3. Powder secondary target holders, 13-mm diameter (Cat. no. A00-205, Kevex).
4. Sample holders for 25-mm diameter Ag membrane filters (Cat. no. A00-213, Kevex). Note: These holders may require light machining in order to center the Ag membrane filter over the most sensitive spot.
5. Pellet die set for preparing MCA energy calibration sample, 31-mm diameter (Cat. no. AI0-403, Kevex). Note: The 13-mm diameter die set may be used instead.
6. Sample holder for 31-mm diameter MCA energy calibration sample (Cat. no. A00-214, Kevex). Note: If a 13-mm diameter pellet is used, substitute a 13-mm diameter sample holder (Cat. no. A00-212, Kevex).
7. Radiation safety monitor (S.E. International Instrumentation Model Radiation Alert Monitor 4, S.E. International Instrumentation Division, Summertown, TN).
c. Accessories for XRD analyses
1. Sample holders for 25-mm diameter Ag membrane filters (Model no. PW1813/26, Philips Electronics Instruments Co., Mahwah, NJ).
2. Radiation safety monitor, see item [b)7)] above.
3.3 Reagents (use at least reagent grade chemicals)
3.3.1 XRF MCA energy calibration
a. Titanium dioxide
b. Zinc oxide
c. Yttrium oxide
d. Boric acid (H3BO3)
3.3.2 Sample preparation
a. Tetrahydrofuran (dry).
b. Parlodion (Pyroxylin).
c. Isopentyl (Isoamyl) acetate.
d. Parlodion in isopentyl acetate, 1.5% (w/v): Dissolve 1.5 g of parlodion in isopentyl acetate and dilute to 100 mL with isopentyl acetate.

19
3.3.3 XRF secondary target
a. Sodium chloride
b. Pellet binder (Chemplex Liquid Binder, Cat. no. D12-400, Kevex).
3.4 Instrument Calibration
3.4.1 XRF calibrations
Use appropriate materials and manufacturer recommendations when calibrating specific Instrumentation and software. Examples of the calibrations performed on specific EDXRF equipment in Section 4. are given in the Standard Operating Procedure (5.12.).
1. If one is not already available, prepare an appropriate standard(s) for MCA energy calibration of the EDXRF spectrometer. For the instrumentation described in Section 4. prepare a sample consisting of a H3BO3 powder pellet containing 5 to 10% of an equimol mixture of the oxides of Ti, Zn, and Y. Place this sample in a sample holder, and then place in the EDXRF spectrometer.
2. Perform an MCA energy calibration.
a. Use excitation conditions for the Ag secondary target as described in Section 3.6.3. step 3b. Use an analysis time adequate for 2,000 count peak height on the shortest calibration peak.
b. Make a two-point MCA energy calibration using the Zn and Y Kα lines (8.631 and 14.933 kV).
3. Determine the peak-width at half-maximum for calibrating the peak profile-fitting (deconvolution) software. This calibration is not routinely needed; it is typically performed when the spectrometer is installed or when indicated by preventative maintenance checks.
3.4.2 XRD calibrations
1. Hardware 2θ calibration: This type of instrument calibration should be performed only by trained personnel. The calibration should be checked periodically using a stable reference standard consisting of polycrystalline quartz (Arkansas stone) or polycrystalline silicon.
2. Software 2θ calibration: Sample displacement errors may result in a systematic bias in 2θ peak locations. The Ag membrane filter may be used as an internal standard to correct for the sample displacement errors of thin samples. Scan either

20
the primary or secondary Ag diffraction peaks at 38.15° and 44.33° 2θ, respectively. Offset the 2θ values for the remainder of the scan for each sample by the same amount that the observed Ag line was offset from its theoretical 2θ value. For example, if the secondary Ag line that should occur at 44.33° 2θ is found at 44.45°, correct all observed lines by subtracting 0.12°.
3.5 Sample Preparation
Note: The PC standards, air samples, and blanks should be prepared using the same lot of silver membrane filters in order to reduce variability in mass absorption analyses.
3.5.1 Air samples and blanks
1. Note which air sample weights are greater than 4.0 mg.
2. Examine the filter and backup pad to determine if any breakthrough to the backup pad has occurred. If there is significant breakthrough, the sample is either not analyzed or results are reported with a disclaimer (see Section 3.10.3. for reporting results).
3. Assemble the filtering apparatus and liquid nitrogen cold trap. Connect the cold trap to the filtering apparatus to collect the waste THF. Any waste vapors should not enter the vacuum pump.
4. Center a Ag membrane filter on the fritted-glass base of the filtering apparatus. Also center the glass chimney on top of the base and secure it with a clamp.
5. Carefully transfer the respirable air sample (PVC filter) from the cassette to a round-bottom 40-mL centrifuge tube.
6. Add 10 mL of THF to each centrifuge tube to dissolve the filter and suspend the sample. Use an additional 10 mL for air samples greater than 4.0 mg. Sonicate the sample suspension for 15 min.
7. With the vacuum turned off, place 2 to 5 mL of THF in the chimney of the previously assembled vacuum filtering apparatus.
For samples <4.0 mg: Quantitatively transfer the suspension with rinses of THF to the glass chimney of the vacuum filtering apparatus. The total volume in the chimney should not exceed 20 mL.

21
8. For samples >4.0 mg: Divide up suspensions by delivering appropriate aliquots of the suspension to additional glass chimneys. Each aliquot should contain less than 4 mg of sample particulate.
9. Apply vacuum to the filtering apparatus, drawing the THF through it. This should result in a thin, even layered deposition of the sample on the Ag membrane filter. Do not rinse the chimney after the material has been deposited on the membrane filter. Rinsing can disturb the thin layer deposition just created. Vacuum should be applied for sufficient time to dry the membrane filter.
10. Carefully disassemble the chimney and clamp. Remove the Ag membrane filter from the firitted-glass base using forceps. Place 2 drops of 1.5% parlodion solution on a glass plate. Fix the dust to the membrane filter by placing the bottom side of the membrane filter in the parlodion solution. By capillary action, the membrane filter draws the parlodion solution to the analyte surface. Place a Teflon sheet on top of an intrinsically-safe hot plate which is set at the lowest setting. Place the Ag membrane filter on top of this heated Teflon sheet.
11. When dry, place the fixed sample in a labeled Petri dish.
12. Store Petri dishes holding the prepared samples and standards in a desiccator containing a drying agent.
3.5.2 Standard preparation
1. Do not grind the bulk sample. Size a representative portion of the bulk sample, using a 41-µm sieve. This results in a sample particle size of less than 41 µm (fines). Place the fines in a scintillation vial.
2. Re-sieve the material remaining on the sieve to obtain additional fines. Add the fines to the material obtained in step 1. Repeat this step until no additional fines are obtained. Cap the vial.
3. Rotate and shake the vial to mix the combined PC fines thoroughly. This is the PC stock material from which standards are prepared.
4. Weigh out six different-size aliquots of PC stock material in the range of 0.5 to 6 mg on PVC filters. Useful nominal weights are 0.5, 1.0, 2.0, 3.5, 5.0, and 6.0 mg. Carefully place each PVC filter containing the weighed PC stock material in separate, labeled, round-bottom centrifuge tubes. Standard amounts are selected to bracket the expected analytical range of the air samples. The higher standards (>3.5 mg) are useful to determine the analytical range for particular PCs.
5. Place a blank PVC filter in a labeled round-bottom centrifuge tube.

22
Note: This blank and the blanks supplied with the air sample set are used to check for contamination of sampling media and as reagent blank standards in the calibration. They may also be used to estimate the analytical detection limit for a particular PC (See Section 4.2.).
6. Prepare the six standards and blank as air samples using steps 5 through 12 in Section 3.5.1. DO NOT split standards greater than 4.0 mg; they are used to calibrate above 4.0 mg.
7. Inspect the deposit for uniformity; clumping indicates that insufficient sonication was used. Remake the standard if a significant amount of clumping occurs.
8. Place the THF waste in an explosion-resistant metal container and dispose appropriately.
3.6 Analysis - XRF
3.6.1 Assemble sample holders for the Ag membrane filters on a clean dust-free surface. Load each sample in a sample holder. Precise sample positioning is critical for reproducible instrument response and reliable intensity data.
3.6.2 The most sensitive location for the sample in the XRF is determined by trial-and-error using copper peak intensities from a small ring of fine copper wire resting on a polypropylene film. Mark tie location of the ring center with a felt-tipped pen, and reposition the sample on the polypropylene film until a maximum signal is reached. Sample holders can be customized to center the Ag membrane filters at the most sensitive spot.
Note: Si and Ca Kα lines are low energy X rays; sample holders prepared using polypropylene film will give reduced sensitivity for these lines. For this reason, sample holders without any support film are preferred.
3.6.3 Analytical conditions for quantitative XRF
(For typical analytical sensitivities see Section 4.3.) Use X-ray excitation conditions appropriate for the system and software. If calculations are not performed immediately after each scan, the spectra should be saved for later use. Conditions selected for analysis should match those used during calibration. For the spectrometer, specified in Section 4., the following conditions are recommended (Refer to Reference 5.12. for additional details.):

23
1. Use a Ta collimator.
2. Use a Lucite monitor so calibration and analytical data may be collected and used over a period exceeding one day. Correct the count data for analyses performed on subsequent days to comparable first-day intensities by using a ratio of monitor data obtained on the different days. Optimize the spectrometer to obtain a maximum counting rate which does not exceed a 50% deadtime using the Lucite monitor. Samples normally will give lower count rates than the monitor.
3. Two different instrumental conditions are used to obtain data for the monitor, samples, blanks, and standards:
a. Si, Ca, and MA
If a Cl secondary target is unavailable, prepare one by pressing a 13-mm pellet at 8 tons under vacuum from a mixture of 0.58 g powdered NaCl and 7 drops of liquid binder. Glue the pellet into a secondary target holder and install it in the secondary target wheel.
Use the Cl secondary target (as NaCl) to quantitatively analyze PC for Si, Ca, and the sample mass absorption of the Ag L lines from the fluorescing Ag membrane filter. Chlorine X rays from the secondary target efficiently fluoresce Si. Sufficient white (broad non-monochromatic) X-ray intensity is available from the NaCl to excite Ca and Ag.
Analyze Si, Ca, and MA samples as follows:
1. Operate the primary Rh target at 15 kV and 3.3 mA.
2. Samples are analyzed with the MCA set to the 10 kV energy scale.
3. Analyze for 200 s counting time
4. Use a vacuum.
b. Fe and Sr
Use a Ag secondary target for the quantitative analysis of the trace elements Fe and Sr. Analyze Fe and Sr samples as follows:
1. Operate the primary Rh target at 35 kV and 0.5 mA.
2. Analyze samples with the MCA set to the 20 kV energy scale.
3. Analyze for 1,000 s counting time.
4. Analyze samples in air.
3.7 Analysis - XRD
Note: Do not store any Ag membrane filter samples on aluminum sample holders. (See Section 4.7. for further details.)

24
3.7.1 Use X-ray power levels appropriate for the target and hardware in use. For the instrumentation described in Section 4., the following conditions are recommended:
1. Power the tube to 40 kV and 40 mA.
2. Use a sample spinner.
3. For each sample, perform scans consisting of 0.02° 2θ steps with 10-s duration. For example:
Scan (2θ) PC peaks (2θ)
27 to 36°
50 to 54°
29.5° 32.7° 34.4° 51.8°
Either multiple narrow-angle scans or a single wide-angle scan can be used.
3.7.2 Desirable XRD analyte sensitivities
(For typical analytical sensitivities see Section 4.3.2.) A minimum desirable sensitivity for integrated peak areas should approach 10 counts/µg (10,000 counts/mg).
3.7.3 Assessment of the presence of PC
An automated pattern search of a powder diffraction library such as the Joint Committee on Powder Diffraction Standards (JCPDS) powder diffraction file of the International Centre for Diffraction Data may be useful in identifying other constituents.
3.8 Interferences
3.8.1 Positive XRF interferences include background signals arising from either:
a. instrument artifacts
1. electronics
2. collimators
3. target and filter fluorescence
4. target and filter Compton and Rayleigh scatter peaks
5. escape peaks
6. sum peaks
7. sample displacement towards the secondary target and/or detector

25
b. sample matrix interferences
1. overlapping sets of M, L, and K spectral lines (MLK lines from elements other than those of interest)
2. matrix specific enhancement such as the additional florescence of Ca resulting from excitation by Ti fluorescing in a sample
The effect of most interferences can be minimized or resolved. For example, a potassium Kβ line that overlaps the calcium Kα line can be resolved through profile-fitting. Interferences arising from sample preparation materials may be resolved using blanks. Sum and escape peaks can be resolved by software. Alternate analytical lines are often available to resolve interferences. (Note: Lines from the Ta collimator can potentially interfere with the analysis of Si.)
3.8.2 XRD interferences
Other diffraction peaks may be present in the sample that may present positive interferences:
Interferent
Peaks (2θ)
Ag
28.0,
32.0°
Gypsum (CaSO4 · 2H2O)
29.2,
31.2, 33.5,
34.7, 50.5,
Anhydrite (CaSO4)
28.0,
31.5, 32.2,
52.5°
3.9 Calculations
3.9.1 XRF result calculations
The sequence of steps in calculating results from the XRF data depends on software requirements. Alternate sequences may be necessary when using different software.
1. Perform escape peak corrections.
2. Perform sum peak corrections, if available.
3. Perform background modeling and subtraction.

26
4. Identify the elements and interferences present using software tools provided with the XRF system in use.
5. Decnvolute (profile-fit) the identified elements to obtain integrated (area) counts for the analytical peaks.
6. Check for residual peaks, and repeat steps 4 and 5 until all potentially interfering peaks are accounted for.
7. If the analyses are performed over a period of more than one day, use monitor data to correct for changes in X-ray tube output.
8. Calculate the mean blank Ag L peak intensity (Iblank) for the field and reagent blanks (Section 3.5.2. step 5). Count data for three blanks are averaged in order to provide a more accurate estimate of Iblank.
9. Calculate the sample mass-absorption Ag L counts for all air samples, blanks, and standards by subtracting the net Ag L peak intensity of each from the mean blank Ag L peak intensity (i.e., Iblank - Isample).
Note: The MA calculation is not the same as blank subtraction; the order of subtraction is reversed because the Ag L peak intensity of the blank is greater than that of the samples. Another consequence of MA analysis is that blanks have a larger counting error than other samples; therefore, negative net counts are possible for blanks or lightly loaded samples.
10. For each of the five analyses (Si, Ca, MA, Fe, and Sr), tabulate the data for the theoretical µg PC and integrated peak areas for the blanks and standards. A typical example follows:
PC Si Ca MA Fe Sr
(µg) Counts
0 0 0 108 0 0
· · · · · ·
· · · · · ·
· · · · · ·
27
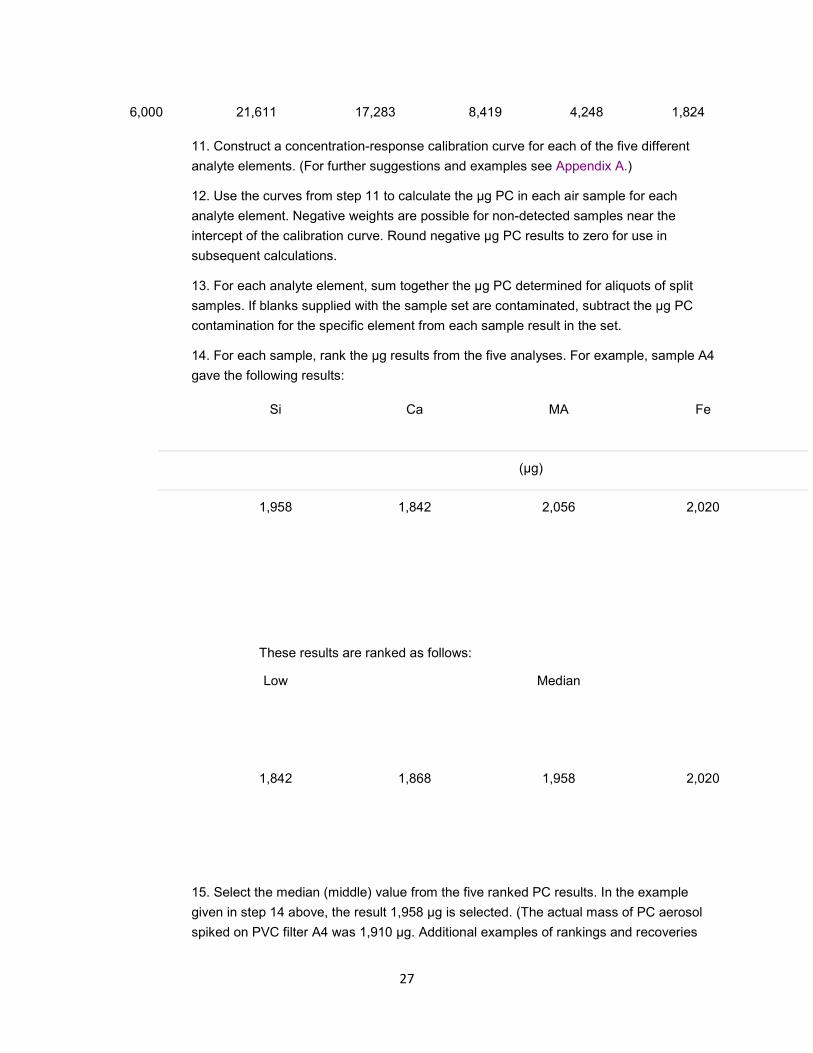
6,000 21,611 17,283 8,419 4,248 1,824
11. Construct a concentration-response calibration curve for each of the five different analyte elements. (For further suggestions and examples see Appendix A.)
12. Use the curves from step 11 to calculate the µg PC in each air sample for each analyte element. Negative weights are possible for non-detected samples near the intercept of the calibration curve. Round negative µg PC results to zero for use in subsequent calculations.
13. For each analyte element, sum together the µg PC determined for aliquots of split samples. If blanks supplied with the sample set are contaminated, subtract the µg PC contamination for the specific element from each sample result in the set.
14. For each sample, rank the µg results from the five analyses. For example, sample A4 gave the following results:
Si Ca MA Fe
(µg)
1,958 1,842 2,056 2,020
These results are ranked as follows:
Low
Median
1,842 1,868 1,958 2,020
15. Select the median (middle) value from the five ranked PC results. In the example given in step 14 above, the result 1,958 µg is selected. (The actual mass of PC aerosol spiked on PVC filter A4 was 1,910 µg. Additional examples of rankings and recoveries

28
are given in Tables 1 and 2. of Section 4.4.2.) For air samples, calculate the PC exposure (mg/m3) by dividing the median value (µg) by the sample air volume (L). If sample A4 had resulted from sampling a total air volume of 230 L, it would represent an exposure of 1,958 µg / 230 L = 8.51 mg/m3. Exposure results for PC are not final until PC is qualitatively confirmed.
3.9.2 XRD calculations
Deconvolute the XRD peak intensities and compare the diffraction patterns of standards with air samples having similar weights. X-ray diffraction peak intensities can be very sensitive to preferred orientations and particle-size distributions, and intensities may not always be comparable between samples and standards.
3.10 Reporting Results
Both XRD and XRF data are considered before reporting the results to the IH. Interpretation of XRF or XRD results requires experience and analyst interaction.
3.10.1 XRF results
1. Compare the experimental and theoretical XRF line energies to qualitatively confirm the presence of analyte elements., They should compare within ±0.01 kV or be comparable within the range of variability exhibited by standards. When instrument resolution and sensitivity permit, seek qualitative confirmation on secondary analyte lines.
Good agreement of the middle three ranked results (Section 3.9.1. step 14) provides quantitative XRF verification. Too wide a spread may indicate significant contamination by substances other than PC.
2. Compare the result by this method (Section 3.9.1. step 15) with the gravimetric result measured by the industrial hygienist.
3.10.2 XRD results
1. Match the 2 peak locations of air samples to standards in order to establish a qualitative XRD "fingerprint" of PC components. Peak locations of air samples are expected to be within ±0.1° 2θ) of the peak locations exhibited by standards.
Note: Due to ion exchange, the peak locations for the major PC phases often differ from data obtained from pure phases or patterns listed in the literature.

29
After PC is identified by XRD, report the result determined in Section 3.9.1.
2. The XRD intensities should be comparable for standards and air samples of equivalent weight having similar particle-size distributions.
3.10.3 Disclaimers
Particulate present on the backup pad constitutes some sample loss. Occasionally this may be seen and can be due to a poor cassette seal on the filter, improper positioning of the filter in the cassette, or poor quality control of the filter and/or cassette. If this type of contamination occurs, relay a note to the compliance officer indicating that some of the sampled material was found on the backup pad and the reported value may be lower than the actual exposure.
4. Validation-Backup Data
The EDXRF spectrometer used in the validation was a Kevex 770/8000 Delta system (Kevex Instruments Inc., San Carlos, CA) consisting of: Kevex 770 X-ray generator, its associated satellite box, vacuum system, helium flush system, firmware-based 8000 keyboard console, computer monitor, Digital Equipment Corporation (DEC) 11/73 computer, graphics memory, Kevex spectrum analyzer, and Toolbox II software. A wavelength dispersive X-ray fluorescence (WDXRF) system may be used in place of an EDXRF system.
The APD used in the validation was an APD 1800 (Philips Electronics Inc., Mahwah, NJ). It included an X-ray generator, long fine-focus copper target X-ray tube, proportional gas counter detector, pulse-height analyzer, graphite monochromator, 2θ compensating slit, 1° receiving slit, sample spinner, sample changer, recirculating cooling system for the X-ray tube, and associated software (Version 3.5) using the laboratory DEC VAX 750 computer.
The backup data validation contains the following protocol:
4.1. Experimental considerations
4.2. Detection limit estimates
4.3. Analyte sensitivities
4.4. Analytical data
4.5. Recovery and coefficients of variation
4.6. Overall error
4.7. Storage tests and 100% RH tests of prepared samples
4.8. Conclusions

30
4.1 Experimental Considerations
4.1.1 A 41-µm nylon sieve is used in the method (Section 4.4.1.). This effectively excludes particles larger than 41 µm from the analysis. The selection of the 41-µm nylon sieve for the preparation of the PC bulk reference materials is based on the following considerations and experiments:
a. Nylon is non-contaminating.
b. Portland cement dust is reported to range in size from 0.2 to 100 µm (5.1.).
c. Most of the major tricalcium silicate (alite) phases are in the range of 15 to 40 µm (5.1.).
d. There is a significant decrease in XRF sensitivity to the major phase elements Si and Ca for larger particles. Material passing through 400 or 325 mesh sieve (37 to 44 µm) has been considered generally applicable for XRF powder analysis of elements as light as aluminum (5.14.).
e. In a preliminary study, five different Portland cement materials were sized using the 41-µm nylon sieve. In all cases, most of the material passed through the sieve:
PC % <41 µm
SRM 635 77.6%
SRM 636 83.7%
SRM 637 96.6%
SRM 1881 95.1%
Wülfrather 94.3%
SRM 1880 ~97.%
Four SRMs (from NIST) and Wülfrather PC material (from SA) were evaluated.
The SRM 1880 was not sized in this study. However, the NIST documentation describing both SRM 1880 and SRM 1881 indicates maximum diameters of approximately 43 µm and 50 µm, respectively. A graphic representation of particle distributions (in reference 5.2.) show that SRM 1880 has a much smaller percent of particles above 41 µm than does SRM 1881.
31
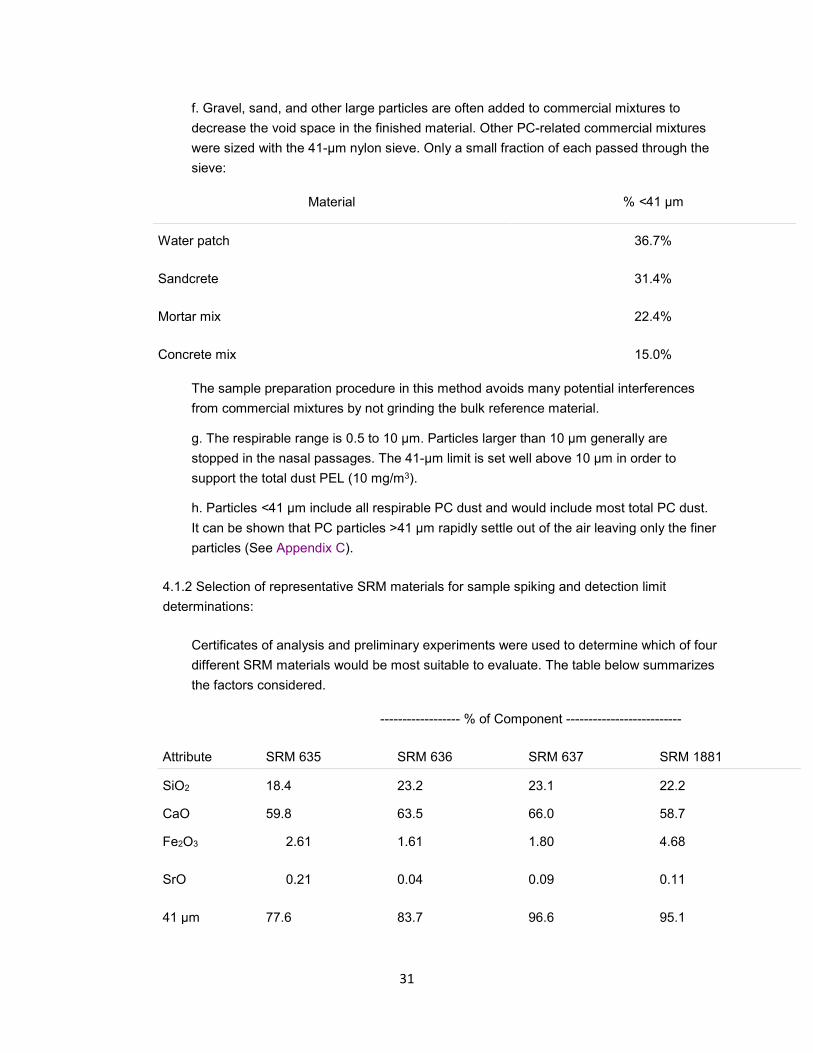
f. Gravel, sand, and other large particles are often added to commercial mixtures to decrease the void space in the finished material. Other PC-related commercial mixtures were sized with the 41-µm nylon sieve. Only a small fraction of each passed through the sieve:
Material % <41 µm
Water patch 36.7%
Sandcrete 31.4%
Mortar mix 22.4%
Concrete mix 15.0%
The sample preparation procedure in this method avoids many potential interferences from commercial mixtures by not grinding the bulk reference material.
g. The respirable range is 0.5 to 10 µm. Particles larger than 10 µm generally are stopped in the nasal passages. The 41-µm limit is set well above 10 µm in order to support the total dust PEL (10 mg/m3).
h. Particles <41 µm include all respirable PC dust and would include most total PC dust. It can be shown that PC particles >41 µm rapidly settle out of the air leaving only the finer particles (See Appendix C).
4.1.2 Selection of representative SRM materials for sample spiking and detection limit determinations:
Certificates of analysis and preliminary experiments were used to determine which of four different SRM materials would be most suitable to evaluate. The table below summarizes the factors considered.
------------------ % of Component --------------------------
Attribute SRM 635 SRM 636 SRM 637 SRM 1881
SiO2 18.4 23.2 23.1 22.2
CaO 59.8 63.5 66.0 58.7
Fe2O3 2.61 1.61 1.80 4.68
SrO 0.21 0.04 0.09 0.11
41 µm 77.6 83.7 96.6 95.1
32
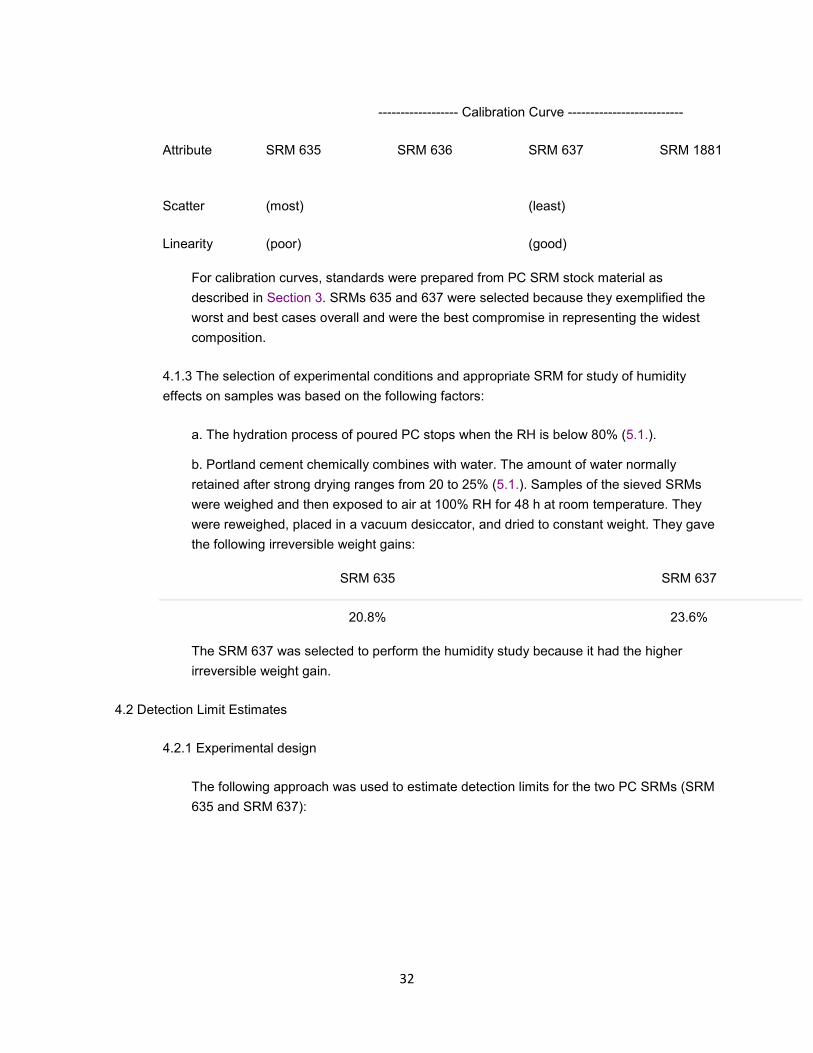
------------------ Calibration Curve --------------------------
Attribute SRM 635 SRM 636 SRM 637 SRM 1881
Scatter (most)
(least)
Linearity (poor)
(good)
For calibration curves, standards were prepared from PC SRM stock material as described in Section 3. SRMs 635 and 637 were selected because they exemplified the worst and best cases overall and were the best compromise in representing the widest composition.
4.1.3 The selection of experimental conditions and appropriate SRM for study of humidity effects on samples was based on the following factors:
a. The hydration process of poured PC stops when the RH is below 80% (5.1.).
b. Portland cement chemically combines with water. The amount of water normally retained after strong drying ranges from 20 to 25% (5.1.). Samples of the sieved SRMs were weighed and then exposed to air at 100% RH for 48 h at room temperature. They were reweighed, placed in a vacuum desiccator, and dried to constant weight. They gave the following irreversible weight gains:
SRM 635 SRM 637
20.8% 23.6%
The SRM 637 was selected to perform the humidity study because it had the higher irreversible weight gain.
4.2 Detection Limit Estimates
4.2.1 Experimental design
The following approach was used to estimate detection limits for the two PC SRMs (SRM 635 and SRM 637):

33
DL = 3 (B)1/2
S
Where:
B = blank background counts S = sensitivity (analyte counts/µg PC)
Portland cement detection limit estimates were determined for all five analyses (Si Kα, Ca Kα, MA, Fe Kα and Sr Kα). The sensitivity for each analysis can vary depending on sample composition. Standards (2-mg) of the two SRMs were used to obtain the net counts for each analyte. These spectra were background-modeled and background-subtracted prior to profile-fitting each analyte peak. Except in the case of MA analyses, the net counts for the fit peak and the analyte counts were the same. The analyte counts data used for the MA analyses were obtained by subtracting the net Ag counts of each standard from the mean net profile-fit Ag counts for the blanks.
Energy spans used in profile-fitting the standards were comparable to those used to integrate the background of the blanks.
In profile-fitting, the peak intensity affects the selection of the integration limits. The software generally selects narrower integration limits for smaller peaks. Using such narrow limits would give unrealistically low estimates for the variation in background counts. Therefore, the integration limits used to determine the background counts for blanks were based on the profile-fit integration limits used in the analysis of a 3-mg SRM 637 sample exposed to 80% RH for 4 h. (This sample had been used in the humidity study and is listed as sample T8 in Table 1.) a. X-ray tube currents were set to values that gave a maximum of 50% dead time on a Lucite monitor. Sample analysis time was 200 s for the MA analysis and for the analysis of the elements Si and Ca; and 1,000 s for

34
the trace elements Fe and Sr. The same analysis time was used for both blanks and samples.
b. The approach used to calculate detection limits is attributed to Birks (5.15.) and is given in Bertin (5.14.). [Note: Although widely used as an estimate of the qualitative detection limit, this theoretical approach may not be appropriate for samples containing significant interferences. The PC DL estimates calculated may be lower than would be obtained experimentally by other approaches. For example, at low jig levels, dust may penetrate into the Ag membrane filter with resulting shadowing and reduced sensitivity.]
The following equation (based on Poisson counting statistics) was used to estimate µg detection limits:
4.2.2 Results
The data for blank samples T1, T2, and B11 were used to calculate mean blank background count data:
Integration ------------ Blank background counts ------------
Line kV limits T1 T2 B11 Mean (Mean)1/2
Si Kα
1.560 to 1.940 442 300 354 365 19.1
Ca Kα
3.500 to 3.880 368 279 293 313 17.7
*MA 2.850 to 3.120 8,056 7,974 7,908 7,979 89.3
Fe Kα
6.180 to 6.620 1,231 1,202 **(2,018) 1,216 34.9
Sr Kα
13.860 to 14.400 1,695 1.667 1,528 1,630 40.4
The MA data are derived primarily from the Ag L peak and are not background counts; however, the MA blank data are used in the analysis to blank-correct the mass-absorption analytical data in a manner comparable to blank subtraction.
Blank sample B11 was contaminated with Fe as evidenced by the presence of a significant Fe Kα peak (~800 counts above background.) The Fe contaminant may have come from the forceps used in preparing the sample. This outlier was not used in determining the mean.
The XRF DLs derived from these data are compared and listed with sensitivities in Section 4.3.1.

35
The PC DLs for the Fe and Sr analyses can vary considerably because the amounts of these trace elements are highly variable. Because the fluorescence X rays of these elements are penetrating, particle-size effects are not expected to significantly complicate matters; the PC DL of these elements are expected to be a linear function of the composition of PCs encountered in the workplace.
The PC DLs for the Si and Ca major-element compositions are less variable because PC SiO2 and CaO compositions are expected to be in the range of the two SRMs studied. However, the PC DLs of these elements are not expected to be simple linear functions of composition because the fluorescence X rays of these elements (particularly Si) are less penetrating than those of Fe and Sr and are therefore more prone to significant particle-size effects.
The PC DL tends to be large for the MA analyses because the counting error is greater for large peaks than for the low backgrounds. Matrix composition does not appreciably affect the sensitivity for the MA analyses; therefore the PC DL for the MA analyses should not vary significantly between different PCs.
4.3 Analyte Sensitivities
4.3.1 XRF PC sensitivities
Analytical sensitivity (counts/µg PC) is matrix dependent. For the elements Fe and Sr, which produce relatively penetrating X rays, the sensitivities are roughly proportional to the concentration of analyte element; materials with smaller amounts of analyte element tend to give lower sensitivities. The Fe and Sr trace-element composition of PC varies considerably from one PC to another resulting in different sensitivities for different PCs.
Although the Si and Ca composition of PC is not as variable as that of Sr and Fe, the X rays from Si and Ca are not as penetrating as those of Fe and Sr; therefore PC analyses using the Si and Ca X rays are more susceptible to particle-size effects. In homogeneous materials, large particles generally yield sensitivities that are lower than those of small particles.
The analysis least affected by the PC composition is that based on mass absorption of the Ag L lines from the Ag membrane filter support.
For the analytical conditions described in Section 3.6., the following analyte sensitivities were found:
---- Counts/µg PC ---
--------- Composition ---------
Line SRM 635 SRM 637 SRM 635 SRM 637 Component
Si Kα 3.6 5.4 18.4% 23.1% SiO2

36
Ca Kα 3.2 4.0 59.8% 66.0% CaO
MA 1.4 1.5 --- --- mass
Fe Kα 1.1 0.67 2.61% 1.80% Fe2O3
Sr Kα 0.57 0.19 0.21% 0.09% SrO
As indicated in the equation in Section 4.2., DL and sensitivity are related. Using the analytical conditions described in Section 3.6., the two SRMs in the evaluation gave the following correspondences between sensitivities and DLs:
The data show that a low sensitivity translates as a high detection limit.
4.3.2 XRD sensitivities
Using the analytical conditions described in Section 3.7., the following are approximate sensitivity ranges observed for five different PCs (Wülfrather and SRMs 635, 636, 637, and 1881):
----- SRM 635 -----
----- SRM 637 -----
Line Counts/µg DL (µg) Counts/µg DL (µg)
Si Kα 3.6 16 5.4 11
Ca Kα 3.2 17 4.0 13
MA 1.4 190 1.5 180
Fe Kα 1.1 95 0.67 160
Sr Kα 0.57 210 0.19 640
Peak location (Degrees 2θ)
Integrated peak sensitivity (counts/µg PC)
29.5 23 to 79
32.7 28 to 76
34.4 42 to 80
51.8 15 to 55

37
4.4 Analytical Data
Due to the lack of a sophisticated aerosol generation/particle sizing system and the high cost of NIST SRM materials, certain economies had to be undertaken for the collection of PC in air during the evaluation.
4.4.1 Experimental procedure - spiked samples
1. In the industrial environment, only a small fraction of the PC in use would become suspended in the air. The analytical portion of this method requires that the standards be prepared from exhaustively sieved PC bulk. For the purpose of this experiment, the SRMs used in spiking samples were notexhaustively sieved in order to produce a variability in particulate sizes and matrix similar to what might occur in industrial hygiene sampling. Simulated air samples were prepared directly from SRM material as received from NIST; aliquots of the unsieved material were briefly shaken from a 41-µm nylon sieve into an air stream and deposited onto PVC filters. Only a small fraction of the material passed through the sieve during the 1 to 2 min of shaking. The following diagram shows the device used in preparing the simulated air samples:
Simulated "Air" Sample Preparation
Note: The diagram shown above describes the apparatus used in spiking validation samples with PC aerosol. This diagram is not intended to represent proper field sampling.

38
2. Sample collection in dry air was evaluated by collecting the suspended dust SRMs in laboratory air on tared PVC membrane filters using the device shown above (2-min sampling, 2 L/min, 30 to 40% RH). Sampling was followed by weighing to determine the net weight of PC collected. These samples are referred to as "Dry" in the tables below.
3. Any affect from humid air was evaluated by first collecting suspended dust samples of SRM 637 in dry air (as above). Next, humid air was drawn through the samples (4-h exposure, 1 L/min, 80% RH). This was followed by reweighing. The net weight gain during exposure to humid air was 0.2%. These samples are referred to as "80% RH" in the tables below.
4. As stated above, only a small portion of each aliquot of the NIST SRMs was actually delivered to each PVC filter. The proportions delivered to the filters are listed below:
SRM 635 (Dry) SRM 637 (Dry) SRM 637 (80% RH)
3.5% to 10.4% 6.7% to 21.5% 7.0% to 17.2%
4.4.2 Analytical results
Samples were prepared and then analyzed by XRF following the procedure in Section 3.
a. The tables which follow contain ranked lists of PC weights found using analyses based on the five analytes. The theoretical (gravimetric) weight of PC for each sample is also shown.
b. The recovery (R) is based on the reported median and is calculated from Found/Theoretical. The coefficient of variation (CV) is shown for each experimental group. Additional samples were analyzed along with the standards and simulated air samples in order to provide a check on reproducibility and to evaluate storage stability. These additional samples are referred to as quality assurance samples.
c. In assessing the agreement between theory and experiment, the symbol "V" locates the position of the theoretical weight in the ranked lists. When the theoretical weight is the same as one of the found weights, the "V" replaces the decimal point (e.g., the "high" value for sample All in Table 1).
The analyses that gave results that bracket the theoretical weight are indicated in the column labeled "[Ana]".

39
Table 1 SRM 637 - Recoveries
SRM 637 Dry Air Spiked Samples:
Air Theor. | ------------------ µg PC Found ----------------- |
Sample Wt.(µg) | Low |
| Reported |
| High | R [Ana]
A10* 0.0
-127.2
-69.2
-2.1
-0.1
9.0
- Si,Ca
A11* 0.0
-217.7
-38.8
-2.1
-0.1
0 0
- Ca
A1 570
-2.1
271.3
396.4
458.3
556.1
0.695 MA
A2 1,368
1,468.8
1,551.4
1,579.1
1,639.8
1,783.9
1.154 Ca
A3 1,750
1,401.8
1,774.9
1,791.4
2,003.7
2,134.4
1.024 Sr,Ca
A4 1,910
1,841.8
1,867.5
1,958.2
2,020.3
2,056.1
1.025 Sr,Si
A5 3,060
3,128.5
3,143.0
3,244.9
3,332.3
3,461.6
1.060 Sr
A6 3,400
2,633.3
3,406.9
3,463.3
3,490.2
4,012.9
1.019 Sr,MA
A7 4,340
3,653.5
4,150.5
4,212.5
4,337.1
4,640.0
0.971 Fe,Si
A8 6,500
5,386.9
6,129.5
6,272.7
6,617.9
7,131.9
0.965 Fe,MA
A9 7,670
6,525.2
7,110.8
7,361.0
7,524.3
7,544.7
0.960 Si
Mean recovery A1 to A9 = 0.986
CV = 0.126
* Samples A10 and A11 were blanks. Negative µg PC results can occur for samples with counts near the intercept of the calibration curve. They are presented here for descriptive purposes only.

40
Quality assurance (QA) samples: The following six QA samples SRM 637 standards tat had been stored 60 days on a laboratory bench:
QA Theor. | ---------------- µg PC Found -------------- |
Sample Wt.(µg) | Low |
| Reported |
| High | R [Ana]
AA1 694
578.2
621.1
732.6
780.9
819.2
1.056 Si,MA
AA2 1,103
840.9
881.0
970.6
1,033.6
1,118.5
0.880 Fe,Sr
AA3 2,242
1,891.7
2,204.5
2,295.0
2,486.7
2.495.4
1.024 Ca,Si
AA4 3,846
3,333.7
3,820.7
3,843.5
3,909.4
4,332.8
0.999 MA,Fe
AA5 4,817
4,367.3
4,494.6
4,646.4
4,748.7
4,906.6
0.965 MA,Fe
AA6 5,793
5,290.6
5,395.6
5,413.1
5,465.7
5,467.2
0.934 MA
Mean recovery QA = 0.976
CV = 0.065

41
SRM 637 Humid Air (240 min, 80% RH) Spiked Samples:
Air Theor. | ------------------ µg PC Found ---------------- |
Sample Wt.(µg) | Low |
| Reported |
| High | R [Ana]
T1* 0.0
-217.7
-125.4
-2.1
7.7
9.0
- Sr,Si
T2* 0.0
-135.8
-8.6
-2.1
-0.1
0 0
- Ca
T7 918
944.7
951.4
1,063.2
1,373.6
1,593.5
1.158 Fe
T4 1,402
1,059.4
1,292.5
1,324.6
1,399.8
1,585.3
0.945 Ca,Si
T5 1,419
1,024.7
1,188.0
1,213.1
1,281.2
1,364.4
0.855 Si
T9 2,130
1,744.2
1,939.4
2,062.3
2,126.8
2,275.2
0.968 Si,Sr
T3 2,796
2,302.0
2,329.0
2,455.2
2,545.7
2,809.7
0.878 MA,Si
T6 2,931
2,367.3
2,469.0
2,541.5
2,765.4
2,797.8
0.867 MA
T8 2,940
2,465.4
2,664.7
3,000.6
3,006.3
3,023.2
1.021 Fe,Si
Mean recovery T3 to T9 = 0.956 CV = 0.113

42
Table 1 SRM 637 - Recoveries
* Samples T1 and T2 were blanks. Negative µg PC results can occur for samples with counts near the intercept of the calibration curve. They are presented here for descriptive purposes only.
Quality assurance samples: The following four QA samples consisted of re-analysis of two recent SRM 637 standards used in the calibrations above, a re-analysis of sample A4 above, and a new 2204 µg calibration standard TT4:
QA Theor. | ---------------- µg PC Found ---------------- |
Sample Wt.(µg) | Low |
| Reported |
| High | R [Ana]
TT1 1,034
879.7
895.1
967.6
982.8
1,238.9
0.936 MA,Sr
TT2 1,910
1,081.4
1,564.6
1,804.4
1,896.6
1,969.1
0.945 MA,Si
TT3 2,204
1,598.6
1,917.3
2,140.8
2,228.4
2,307.7
0.971 Si,MA
TT4 3,395
2,477.5
2,766.8
3,253.3
3,333.3
3,351.1
0.958 Si
Mean recovery QA = 0.952 CV = 0.016

43
Table 2 SRM 635 - Recoveries
SRM 635 Dry Air Spiked Samples:
Air Theor. | ----------------- µg PC Found --------------- |
Sample Wt.(µg) | Low |
| Reported |
| High | R [Ana]
B11* 0.0
-0 0
5.5
7.2
70.6
650.6
- Sr
B12* 0.0
-0.1
-0 0
0.4
30.8
38.7
- Sr
B1 851
835.2
901.1
976.4
1,000.4
1,055.4
1.147 Fe,Ca
B2 888
820.0
864.9
898.5
910.9
1,102.7
1.012 Si,Ca
B3 1,093
1,148.6
1,168.6
1,245.5
1,304.4
1,365.6
1.140 Fe
B4 2,395
2,384.4
2,390.1
2,414.5
2,557.4
2,758.4
1.008 Ca,MA
B5 3,058
2,939.5
2,944.1
3,211.9
3,302.3
3,481.2
1.050 Sr,Ca
B6 3,117
3,237.6
3,301.7
3,366.8
3,498.1
3,650.7
1.080 Sr
B7 3,656
3,265.5
3,497.6
3,504.7
3,704.3
3,731.0
0.959 Ca,Si
B8 3,879
3,601.6
3,960.7
4,171.5
4,455.0
5,038.4
1.075 Sr,Fe
B9 7,314
6,898.9
7,184.2
7,262.7
7,486.4
7,619.7
0.993 Fe,Si
B10 7,345
6,208.4
7,110.0
7,349.5
7,684.7
7,925.7
1.001 MA,Ca
Mean recovery B1 to B10 = 1.046 CV = 0.060
* Samples B11 and B12 are blanks. Negative µg PC results can occur for samples with counts near the intercept of the calibration curve. They are presented here for descriptive purposes only.

44
Quality assurance samples: The following six QA samples are SRM 635 standards that had been stored 60 days on a laboratory bench:
QA Theor. | ---------------- µg PC Found --------------- |
Sample Wt.(µg) | Low |
| Reported |
| High | R [Ana]
BB1 623
615.0
669.1
730.6
763.8
868.4
1.173 Si,Ca
BB2 1,088
874.6
915.0
946.8
1,092.2
1,121.3
0.870 Fe,Sr
BB3 2,172
2,119.3
2,205.1
2,259.1
2,309.1
2,311.5
1.040 Sr,MA
BB4 2,964
2,515.9
2,699.2
2,706.6
2,735.7
2,763.5
0.913 Sr
BB5 4,644
3,454.5
4,267.8
4,343.5
4,440.6
4,478.8
0.935 Fe
BB6 3,848.1
4,955.4
5,039.8
5,939.5
6,412.4
868.4
0.863 Ca,Fe
Mean recovery QA = 0.966 CV = 0.124
Note: The "High" result for sample BB6 is above the useful calibration range. This outlier is automatically excluded by use of the median value.
d. An evaluation of relative bias among the five different analyses was performed. The tally or count of samples having a particular analysis (Si to Sr) at each of the five rank locations (Low to High) was determined. These are listed in the first six columns of Table 3 below. The apparent bias suggested by these tallies is listed in the "Apparent Bias" column.
An assessment was made to determine whether any of the five analyses tended to be more reliable than the others. This was performed in the following manner: For each sample, the identity of the two analyses which bracketed the theoretical result (shown in "[Ana]" columns

45
32 Air Samples and Blanks:
| ------------------ Tally ----------------- | Apparent Tally
Analysis | Low |
| Middle * |
| High | Bias Bracket
Si
1
3
4
12
12
high 15
Ca
2
11
12
3
4
low-middle 15
Ma
1
6
7
8
10
high 9
Fe
9
8
4
8
3
low-middle 10
Sr
19
4
5
1
3
low 15
Total
32
32
32
32
32
64
16 QA samples:
| -------------------- Tally ------------------- | Apparent Tally
Analysis | Low |
| Middle * |
| High | Bias Bracket
Si
6
2
4
1
3
low 7
Ca
3
6
4
2
1
low-middle 3
Ma
0
3
5
5
3
high-middle 9
Fe
2
4
2
5
3
middle 7
Sr
5
1
1
3
6
high & low 6
Total
16
16
16
16
16
32
Total 48 Air, Blank, and QA Samples:

46
of Tables 1 and 2 above) was determined. The tally for each of the analyses that bracketed the theoretical result was increased by one for each sample. For example, the Si tally was increased by one for each sample having a Si result ranked adjacent to the theoretical result. The process was analogous for the Ca, MA, Fe, and Sr analyses. There were instances where two results did not bracket the theoretical value; for these samples, the tally for the closest analysis was increased by two so that each sample would be given equal overall weighing in the tallies. The number of times a particular analysis bracketed the theoretical value is shown in the "Tally Bracket" column of Table 3 below:
Table 3
As the "Tally Bracket" results in Table 3 indicate, no single element was optimum for quantitating PC. Individually, the analyses for an element may show an apparent bias in the rank, but the median results of all the analytes taken together gave the most representative estimate of the quantity of PC present in the samples.
4.5 Recovery and Coefficients of Variation
For the simulated "air" samples, the recovery R (Found/Taken) and CV data were calculated based on the medians of the five different analyses described above. (CV for quality assurance samples are also listed separately below.) The theoretical weight of each simulated "air" sample was determined based on the net weight. Because air samples were simulated and the sampling pump was used for movement of particulate rather than for delivery of a specific volume of air, a 5% pump error estimate was included in the calculation of the total coefficient of variation (CVT) using the following equation: CVT = [ (CV)2 + (0.05)2]1/2
| --------------------- Tally ------------------ | Apparent Tally
Analysis | Low |
| Middle * |
| High | Bias Bracket
Si
7
5
8
13
15
high 22
Ca
5
17
16
5
5
low-middle 18
Ma
1
9
12
13
13
high 18
Fe
11
12
6
13
6
low-middle 17
Sr
24
5
6
4
9
low 21
Total
48
48
48
48
48
96
* Reported value

47
For the simulated "air" samples, the recovery R (Found/Taken) and CV data were calculated based on the medians of the five different analyses described above. (CV for
quality assurance samples are also listed separately below.) The theoretical weight of each simulated "air" sample was determined based on the net weight. Because air samples were simulated and the sampling pump was used for movement of particulate rather than for delivery of a specific volume of air, a 5% pump error estimate was included in the calculation of the total coefficient of variation (CVT) using the following equation: CVT = [ (CV)2 + (0.05)2]1/2
Spiked "Air" Samples:
Quality assurance samples analyzed:
Re-analysis of standards stored for two months in petri dishes on laboratory bench (These were not stored in a desiccator.):
SRM Mass range (mg) n R CV
635 0.6 to 5.8 6 0.966 0.124
637 0.7 to 5.8 6 0.976 0.065
SRM Mass range (mg) n RH (%) R CV CVT
635 0.9 to 7.3 10 Dry 1.046 0.060 0.078
637 0.6 to 7.7 9 Dry 0.986 0.126 0.136
637 0.9 to 2.9 7 80 0.956 0.113 0.124
Combined results from above:
SRMs Mass range (mg) n R CV CVT
635 & 637 0.6 to 7.7 26 1.001 0.103 0.114
SRM Mass range (mg) n R CV

48
Analysis of a spiked membrane filter sample, re-analysis of an 80% RH sample, and re-analysis of two standards:
Grand summary of all "air" and quality assurance sample results:
SRM Mass range (mg) n R CV
635 & 637 0.6 to 7.7 42 0.980 0.104
4.6 Overall Error
Overall error (OE) is defined as a combination of the contributions of bias and imprecision in recovery and is expressed as a percentage: OE = ± [ | R - 1 | + 2(CVT) ] 100%
For the "air" samples:
SRM Mass range (mg) n RH (%) OE (%)
635 0.9 to 7.3 10 Dry ±20.2
637 0.6 to 7.7 9 Dry ±28.6
637 0.9 to 2.9 7 80 ±29.2
Combined results from above:
SRMs Mass range (mg) n OE (%)
635 & 637 0.6 to 7.7 26 ±22.9
637 1.0 to 3.4 4 0.952 0.016

49
4.7 Storage Tests and 100% RH Tests of Prepared Samples
4.7.1 Procedure:
a. Standards deposited on Ag membrane filters were reanalyzed after being stored in petri dishes on a laboratory bench for 60 d (AA and BB samples shown in Tables 1 and 2, Section 4.4.2.).
b. High humidity experiments were also performed to determine the effect of 48-h exposure to 100% RH on SRM 637 standards. These were 6-mg samples on Ag membrane filters (fixed and unfixed with parlodion). During the exposure, the membrane filters were kept in upright positions in XRD sample holders (PW1813/26 with aluminum back plates, Philips) so that any change in intensity would not be due to sample handling.
4.7.2 Results:
a. The re-analysis of standards stored on a laboratory bench for 60 d did not indicate storage problems.
b. The experiments performed on SRM 637 standards exposed to 100% RH resulted in large decreases in XRD intensity (about 30 to 40%), pitting and corrosion of the aluminum back plates of the sample holders, and the appearance of a light-colored dust adhering to the backs of the Ag membrane filters. Presumably, Ca(OH)2, leached from the sample to react with the aluminum back plates. Although 100% RH is not common in controlled environments such as analytical labs, this experiment points out that prepared samples should not be stored in aluminum sample holders unless placed in a desiccator.
4.8 Conclusions
Portland cement dust consists of a variable and complex mixture of component phases. At the time of this writing, the total dust PC PEL is not limited to a legally defined particle-size distribution. Industrial exposures to PC aerosols vary with respect to both compositions and particle-size distributions. Thin-film XRF techniques are sensitive to both these effects. As a consequence, the compositional variability is echoed in the analytical results. In order to minimize variability in the reported result, the following approach was taken:
1. A representative bulk sample of PC from the workplace being sampled is sieved to a particle-size range that is typical of PC aerosols and is used to prepare standards.
2. The median result of five different analytes measured by XRF is used to provide a consensus estimate in order to resolve the effect of varying aerosol composition during sampling.

50
3. The presence of PC is confirmed qualitatively by matching the XRD patterns of the air sample to the XRD "fingerprint" for PC phases.
Impurities such as CaSO4 and uncombined CaO readily absorb moisture from the air. This evaluation indicated that minimal humidity effects are expected during sampling at <80% RH. Storage of prepared samples for 60 d in petri dishes on a laboratory bench also indicated no significant sensitivity to the ambient conditions in the laboratory; however, prepared samples exposed to 100% RH for 48 h were significantly affected. These latter samples were on Ag membrane filters and were contained in sample holders. Therefore, it is prudent to take reasonable precautions to minimize sample storage in humid air.
OSHA Method ID-207 is suitable as an adjunct to gravimetric field evaluations for the determination of PC exposures in workplace atmospheres.
5. References
5.1 Kirk, R.E. and D.F. Othmer: Encyclopedia of Chemical Technology. 3rd ed., Vol. 5. New York: John Wiley & Sons, 1979. pp. 163-193.
5.2 National Institute Standards and Technology: Standard Reference Materials: Portland Cement Chemical Composition Standards (Blending, Packaging, and Testing) (National Bureau of Standards, Special Publication 260-110, 103 pages CODEN:XNBSAV) by R. Keith Kirby and Howard M. Kanare. Washington, D.C.: U.S. Government Printing Office, 1988.
5.3 American Society for Testing and Materials: 1978 Annual Book of ASTM Standards; Part 14. Philadelphia, PA: ASTM, 1978. pp. 104-110.
5.4 American Conference of Governmental Industrial Hygienists: Documentation of the Threshold Limit Values and Biological Exposure Indices, 5th ed. Cincinnati, OH: American Conference of Governmental Industrial Hygienists (ACGIH), 1986. p. 494.
5.5 "Air Contaminants; Final Rule": Federal Register 54:12 (19 Jan. 1989). pp. 2598-2599.
5.6 Sisler, H.H., C.A. VanderWerf, and A.W. Davidson: College Chemistry A Systematic Approach, 2nd ed. New York: The Macmillan Co., 1961. p. 548.
5.7 Occupational Safety and Health Administration - Salt Lake Technical Center: OSHA Analytical Methods Manual (USDOL-OSHA-SLTC Method and Backup Report No. ID-142). Cincinnati, OH: American Conference of Governmental Industrial Hygienists (In publication).
5.8 Jugovic, Z.T.: Spectrophotometric and EDTA Methods for Rapid Analysis of Hydraulic Cement. ASTM Special Technical Publication: 985:15-25 (1988).

51
5.9 Scott, E.H.: Atomic Absorption Methods for Analysis of Portland Cement. ASTM Special Technical Publication: 985:57-72 (1988).
5.10 Occupational Safety and Health Administration - Salt Lake Technical Center: Personal communication to West Germany's Saarbergwerke Aktiengesellschaft regarding "Report on Saarberg Portland Cement Analyses." January 30, 1990, Salt Lake City, UT: USDOL-OSHA-SLTC, 1990.
5.11 National Institute for Occupational Safety and Health and Occupational Safety and Health Administration: Occupational Safety Guidelines for Chemical Hazards, Occupational Health Guideline for Portland Cement (September, 1978) [DHHS (NIOSH) Publication No. 81-123, 19811.
5.12 Occupational Safety and Health Administration - Salt Lake Technical Center: Standard Operating Procedure, Inorganic Analysis by X-ray Fluorescence Spectrometry (Semiguant-XRF). Salt Lake City, UT: USDOL-OSHA-SLTC, 1989.
5.13 Silverman, L., C.E. Billings, and H.W. First: \ Particle Size Analysis in Industrial Hygiene, New York, Academic Press, 1971. pp. 13-16.
5.14 Bertin, B.P.: Principles and Practice of X-ray Spectrometric Analysis. 2nd ed. New York: Plenum Press, 1975. pp. 529 and 738.
5.15 Birks, L.S.: X-ray Spectrochemical Analysis. 2nd ed. New York: Interscience Publishers, 1969.

52
Appendix A
Suggestions for XRF Calibration Curves for PC Analysis
(The software features described below were incorporated into custom analytical software used at the OSHA Salt Lake Technical Center.)
Least squares curve fits are commonly used to obtain calibration curves. In X-ray calibrations, the count intensity is the dependent variable, and the mass is the independent variable. The least squares approach minimizes the sum of the squares of the differences between the dependent variable data and the curve. To find the best fit for PC analytes, the analyst should evaluate power series fits for the first through fourth order curves. It is often desirable to weight the data according to the reliability of the dependent variable. The calibration data may be assigned weights inversely proportional to the intensity variance. The random error in gross intensity obeys Poisson statistics and is a significant fraction of the measurement error. The Poisson variance statistic is simply the gross intensity. For intensity measurements with a low background, the Poisson variance statistic may be approximated by the net intensity.
Caution: When creating PC calibration curves, do not over-weight the lower standards; the counting error is not the only source of error in the measurement. In the evaluation of the PC method (Section 4.), the adjusted Poisson weights varied from 1,000 (maximum) for blanks to about 2 for the highest standard.
For the MA analysis of PC using the fluorescence X rays from the Ag membrane filter, the weighting is not simply related to the net counts; net counts are calculated from silver line intensities (i.e., Iblank - Isample). In the method evaluation, the Ag data were weighted equally.
For a wide variety of PC SRMs and building construction materials encountered in the preliminary evaluation, a monotonic positive S-shaped (sigmoidal or ogival) curve often best described the calibration data for each analytical line. An example sigmoidal curve is shown below:

53
Three regions of interest are shown above:
Region 1 (low sample weights) shows reduced sensitivity as the result of two causes:
a. Fine particulates may penetrate into the surface pores of the Ag membrane filter. The Ag acts to shield particulates from a portion of the incident X rays and also absorbs a portion of the fluorescence X rays from the particulates (shadowing).
b. Profile-fitting (deconvolution) software tends to compute smaller peak widths for low intensity peaks.
Region 2 (moderate sample weights) shows an approximately linear response to sample mass. For layers that are only a few particles deep, the sensitivity is dependent upon the particle-size distribution and the concentrations of all elements in the particles (the matrix).
Region 3 (high sample weights) shows reduced sensitivity due to partial absorption of both incident and fluorescence X rays within thick dust layers.
When preparing PC calibration curves, the analyst must decide upon the most appropriate fit. The fit selected should be monotonic (have a single-valued inverse) in the analytical range. If a curve maximum is found in the range of standards suggested, the analyst should consider reducing the analytical range, replicating standards, or trying another curve fit.
The simplest mathematical models are represented by first- or second-order fits. First- and second-order models often provide adequate fits for analyses experiencing small deviations from linearity. Two such instances are analyses based on the higher-energy fluorescence X rays or analyses based on material having a large weight fraction of small particles.
The simplest power series function that may describe a sigmoidal curve is third order. Occasions may arise when a fourth-order fit may be the best selection.
Caution: Additional small random (non-systematic) errors due to variations in sample preparation, etc. are expected. Although a fourth-order fit may intersect all the data points, a lover order fit is generally preferred in order not to bias the curve fit by these small irreproducible errors. It is a good policy to keep the mathematical model as simple as possible.
The weight of PC is determined from the inverse function of the selected power series. This is a simple calculation for first and second-order fits. Determining the inverse of higher-order equations is a more complex task; however, computer programs are available to numerically solve higher-order fits in the monotonic analytical range. Solutions to higher-order (polynomial) equations are easily determined by a successive approximation process called binary search. In a binary search for this application, a succession of estimates of the analyte mass is used to calculate corresponding count intensities (using the calibration equation) until there is negligible difference between the calculated and measured intensity. Each iteration of the search narrows the subsequent search by halving the previous search domain. The binary search procedure is as follows (an example follows the procedure):
1. The initial analytical search range must be monotonic. Determine the mass domain (initially, about 0 to 6 mg) and calculate the mass at the center of the mass domain (M1/2). The value for M1/2 is initially about 3 mg.
2. Evaluate the polynomial at M1/2 in order to obtain the calculated counts (I1/2). 3. Determine if the measured intensity (Im) is less than I1/2.

54
4. If Im is not less than I1/2, the upper half of the current mass domain becomes the new current mass domain. Proceed to step 6 below.
5. If Im is less than I1/2, the lower half of the current mass domain becomes the new current mass domain.
6. The mass midway in the current mass domain becomes the new M1/2. 7. Repeat steps 2 through 6 until there is no significant difference between Im and I1/2. This takes
fewer than 23 iterations. 8. The last M1/2 obtained is the inverse function of the polynomial that gives Im.
Note: For cases where the measured counts decrease with increasing mass (e.g., Ag counts versus PC mass), first transform the measured count data for the standards and samples by subtracting the mean of the blank count data.
Consider the following example of the binary search procedure to find the mass corresponding to a measurement of 5,500 counts
(shown as a "+" in the figure below):
The calibration curve above approximates the following calibration data:
Mass (mg) Counts Weighting factor
0.000 50 420
1.000 1,500 14
2.000 3,200 7
3.000 6,000 4
4.333 8,900 2
6.000 10,500 2
The experimental data was fit by the third-order equation I = ƒƒ(mass): counts = -73.6162(mass)3 + 599.4118(mass)2 + 802.421(mass) + 51.190

55
The monotonic analytical range is for the mass domain 0.0000 to 6.0248 mg.
Each iteration halves the span of the mass domain; this results in the convergence to a mass that corresponds to a calculated count intensity equal to the measured count intensity.
-------- Mass ---------- ----------- Counts --------
Iteration
Domain (mg)
Mid value M1/2
Calculated I1/2 = ƒ (M1/2)
Measured Im
(I1/2<Im)
1 0.0000 to 6.0248 3.0124 5,895.41 5,500 no
2 0.0000 to 3.0124 1.5062 2,368.10 5,500 yes
3 1.5062 to 3.0124 2.2593 4,074.78 5,500 yes
4 2.2593 to 3.0124 2.6358 4,982.65 5,500 yes
5 2.6358 to 3.0124 2.8241 5,439.89 5,500 yes
6 2.8241 to 3.0124 2.9183 5,668.05 5,500 no
7 2.8241 to 2.9183 2.8712 5,554.05 5,500 no
8 2.8241 to 2.8712 2.8477 5,496.98 5,500 yes
9 2.8477 to 2.8712 2.8594 5,525.25 5,500 no
10 2.8477 to 2.8594 2.8535 5,511.25 5,500 no
11 2.8477 to 2.8535 2.8506 5,504.12 5,500 no
12 2.8477 to 2.8506 2.8491 5,500.55 5,500 no
This process can be continued to any desired precision of calculation. During 23 iterations, the value of I1/2 approaches 5,500 counts and the value of M1/2 approaches 2.8487 mg (to five figures).

56
Appendix B
Typical PC X-ray Diffracton Patterns

57
Appendix C
Particle Size Considerations in Sampling for PC
Particles <100 µm achieve terminal velocity very quickly in still air. The terminal velocity may be estimated from a derivation using Stokes' relation for streamline flow (5.13.): FR = 3𠵃 V Dp
Where: FR = viscous resistance force of the air (gm · cm/sec2) µƒ = viscosity of the fluid (g/cm · sec) V = velocity of particle relative to air (cm/sec) Dp = spherical particle diameter (cm)
In free fall, this force of resistance is balanced by the gravitational force acting on the particle. (One may neglect the force due to buoyancy because the density of air is much less than that of PC particles.) FR = ρp π/6 (Dp)3 G
Where: ρp = density of particle (g/cm3) G = acceleration due to gravity (cm/sec2)
Substituting: 3𠵃 V Dp = ρp π/6 (Dp)3 G
Solving for V: V = ρp (Dp)2 G / (18 µƒ)
Note: G / (18 ƒ) = 3.02 × 10⁵ for ambient air at the surface of the Earth when Dp is expressed in cm. Use 3.02 × 10¯3 for Dp expresses in µm.
PC phases have densities in the range 3.0 to 3.8 g/cm3. The calculated settling rate range for 41-µm spherical particles with this density range is 15 to 19 cm/sec.
PC particles are not spherical (5.1.). Most nonspherical particles settle at a slightly slower rate. The worst-case deviation is about 33% 5.13. For nonsherical 41-µm particles of PC, the slowest velocity range for settling out of the air would be 10 to 13 cm/sec. A stationary volume of air 6 m high would become free of PC particles larger than 41 µm in less than 1 min.
In the case of dust exposures involving dust that is continually replenished from a source, the particle-size distribution changes over time; the concentration of smaller particles increases until a steady state is achieved. Particles <41 µm would represent the greatest contribution to the dust suspended in the air.
The foregoing discussion considers only particles subject to streamline flow, but non-streamline flow does not alter the conclusion. The largest spherical particle falling in the streamline flow range can be estimated from 5.13.: Dp <100 / (ρp)1/3
For the density range of PC phases, the largest particles that exhibit streamline flow are in the range of 64 to 69 µm (corresponding to 43 to 47 cm/sec). Particles larger than this are subject to turbulent flow and clear the air at velocities faster than 47 cm/sec.