portions of this document maybe illegible
TRANSCRIPT


SNF REPORT NO. 30/01
Cost Estimates and Investment Decisions
by
Kjetil EmhjeHenMagne EmhjellenPetter Osmundsen
SNF-project No. 7220:“Gassmarkeder, menneskelig kapital og selskapsstrategier”
The project is financed by the Research Council of Norway
FOUNDATION FOR RESEARCH IN ECONOMICS AND BUSINESS ADMINISTRATIONBERGEN, AUGUST 2001
(C)Dette eksemplar er Iremstilt etter avtalemed KOPINOR, Stenergate 1, 0050 Oslo.Ytferligere eksemplarfremsfilling uteri avtaieog i strid med ~ndsverkloven er straffbartog kan medfwe erstatningsansvar.

DISCLAIMER
Portions of this document maybe illegiblein electronic image products. Images areproduced from the best available originaldocument.

Cost Estimates and Investment Decisions*
By
Kjetil Emhjellen**, Magne Emhjellen*** and Petter Osmundsen****,
**Telemark University College**” Stavanger University College
**** Stavairgw University College I Norwegian School of Economics and Bus. Adrn.
Abstract
When evaluating new investment projects, oil companies traditionally use the discountedcashflow method. This method requires expected cashflows in the numerator and a riskadjusted required rate of return in the denominator in order to calculate net present value. Thecapital expenditure (CAPEX) of a project is one of the major cashflows used to calculate netpresent value. Usually the CAPEX is given by a single cost figure, with some indication of itsprobability distribution. In the oil industry and many other industries, it is a common practiceto report a CAPEX that is the estimated 50/50 (median) CAPEX instead of the estimatedexpected (expected value) CAPEX. In this article we demonstrate how the practice of using a50/50 (median) CAPEX, when the cost distributions are asymmetric, causes project valuationerrors and therefore may lead to wrong investment decisions with acceptance of projects thathave negative net present values.
Keywords: Investment Decision, Expected Value, Construction Cost Estimation, CapitalExpenditures (CAPEX), Probability Distribution of CAPEX.
Jel.no.:G31, L72, M21
“We are grateful to Kjell L@v& for useful comments. Financial support ti’om The Norwegian Research Councilis appreciated.
““ Kjetil Emhjellen, Telemark University College, Department of Engineering, Po Box 203, N-3901 Porsgmmr,~?rway Tek (47) 35575201, Fax: (47) 35575204, Emaik Kjetil.Emhiellen@ hit.no
Magne Emhjellen, Stavariger University College, Department of Business Administration, Po Box 2557Ulkmdharrg, 4091 Stavanger, Norway Tel: (47)51 831582, Fax (47)51 831550, Email:?vfarne.Emh [email protected] .no““”” Petter Osmundsen. Stavanger University College, Section of Petroleum Economics, Po Box 2557Ulkmdhaug, 4091 Stavanger, Norway. Tel: (47)51 831568, Fax: (47)51 831750, Email:Petter. [email protected], Internet: http ://www.nhh.no/for/cv/osmmrdsen -petter.htm
1Presentation at 24th International Conference of Intemationat Association for Energy Economics (IAEE),
2001: An Energy Odyssey?, Houston, Texas, April 25-27,2001.

1. Introduction
According to McMillan (1992), cost estimation is particularly difficult in the constructionindust~, often leading to considerable cost overruns. The explanations are that there often islarge uncertainty - often related to new technology - and that the uniqueness of the projectslimits the learning process. One might expect that cost overruns have the same probability ascompleting the project below the cost estimate. However, observations clearly indicate anoverrepresentation of cost overruns. This is due to two types of selection bias: 1) projectselection; it is typically the projects with the most optimistic internal cost estimates that arebeing pursued by the investing firm, and 2) tender selection; competition sees to that tenderswith pessimistic and realistic cost estimates are ruled out.
A project’s capital expenditures (CAPEX) is one of the major cashflows used to calculate netpresent value (along with e.g. operational expenditures (OPEX) and income). The CAPEX isdeveloped through a cost estimate, very often by a company’s internal cost estimationdepartment. Usually the CAPEX is given by a single cost estimate, with some indication ofthe probability dk.tribution for this cost estimate.
In this article we demonstrate how the practice of using a 50/50 (median) CAPEX, when thecost distributions are asymmetric, causes project valuation errors and therefore may lead towrong decisions with acceptance of projects with negative net present values.
2. Case: Estimation Failures in Norwegian Offshore Development Projects
In the beginning of the 1990s, the Norwegian petroleum industry experienced a cost level thatdid not justify new offshore development projects. To reduce development time and costsdrastically on the Norwegian shelf, economic and technical task forces were appointed, withmembers from the oil companies, the suppliers and government. This process, known asNORSOK, was inspired by the cost reduction initiative CRINE on the UK shelf. A consensuswas reached in the Norwegian petroleum industry to implement a number of organisationaland contractual changes.
Much attention has been devoted to reducing the lead time. Deep water offshore developmentprojects are extremely capital intensive, and getting the field on stream at an early stage maybe decisive for a positive project appraisal (net present value analyses). To reduce thedevelopment time, contract award (and to some extent fabrication) has started before detailedengineering was completed. This has led to a considerable increase in estimation risk. For anumber of extraction facilities there have been considerable amounts of reengineering andrefabrication, causing delays and cost overruns. In some cases this has been due to updatedinformation about reservoir characteristics and a wish to implement new technology. In othercases the initial engineering and planning were simply inadequate.
Previously, oil companies (the licence groups, represented by the operators) coordinateddeliveries from contractors that were specialised within, respectively, project management,
2Presentation at 24th International Conference of International Association for Energy Economics (IAEE),
2001: An Energy Odyssey?, Houston, Texas, April 25-27,2001.

engineering, module fabrication, at-shore/inshore hook-up or marine operations. Today, theNorwegian offshore development market is dominated by 3 to 4 major entities marketingthemselves as capable of carrying out total enterprise contracts and/or projects from conceptdevelopment to offshore installation and start up. Hence, the project management tasks whichpreviously had to be carried out by a project team managed by the client, have after 1994 beencarried out by the major offshore contractors, regulated by EPCI-contracts (Engineering,Procurement, Construction, Installation). The large size of the contracts, and the newcoordination tasks that were to be performed, implied a considerable increase of risk for theturnkey suppliers. In the previous fabrication contracts, founded on cost-plus principles, mostof the risk was borne by the oil companies. In the EPCI-contracts, however, an even split ofcost overruns and savings, relative to a target sum was introduced. There was an upper limitto the cost overruns to be borne by the contractor, but this cap was substantial compared to thecontractor’s financial strength. Thus, in a situation of a considerable increase in risk, a higherfraction of the risk is now borne by the contractors.
The performance of the new contractual and organisational solutions in Norwegian offshoredevelopment projects was evahtated by a government study (Government Report NOU1999: 11).] For the new type of development projects, implemented after 1994, the studyreports aggregate cost overruns exceeding 4 billion dollars. Still, development costs areestimated to have fallen; but not to the extent of the over-optimistic expectations. As a result,the main contractors have experienced financial problems. Moreover, clients have been forcedto pay in excess of their contractual obligations in order to secure delivery of the contractobject when contractor’s financial stability is jeopardised. A poor technical definition and aresulting under-estimation of scope has also caused schedule delays and subsequent losses tothe oil companies that they were unable to recover through liquidated damages paid bycontractors.
Experience gained by the Norwegian oil industry indicates that there should be more focus ondeveloping better technical specifications prior to the award of EPCI contracts; planning timehas been suboptimal. Furthermore, incentive contracts need to be curtailed to the financialcapacity of the supplier. The choice of design time - which influences the amount of risk -must be seen in conjunction with the risk sharing arrangements.2 Also, the need for improvedcost estimation has been clearly demonstrated. The 50/50 (median) CAPEX cost estimationprocedure has been - and is - used by the two major Norwegian oil companies, Statoil andNorsk Hydro. It is also this type of cost estimate that all companies on the Norwegian shelfare to report to the Norwegian Ministry of Oil and Energy and the Norwegian Oil Directorate.
3. Probability Distributions of Costs
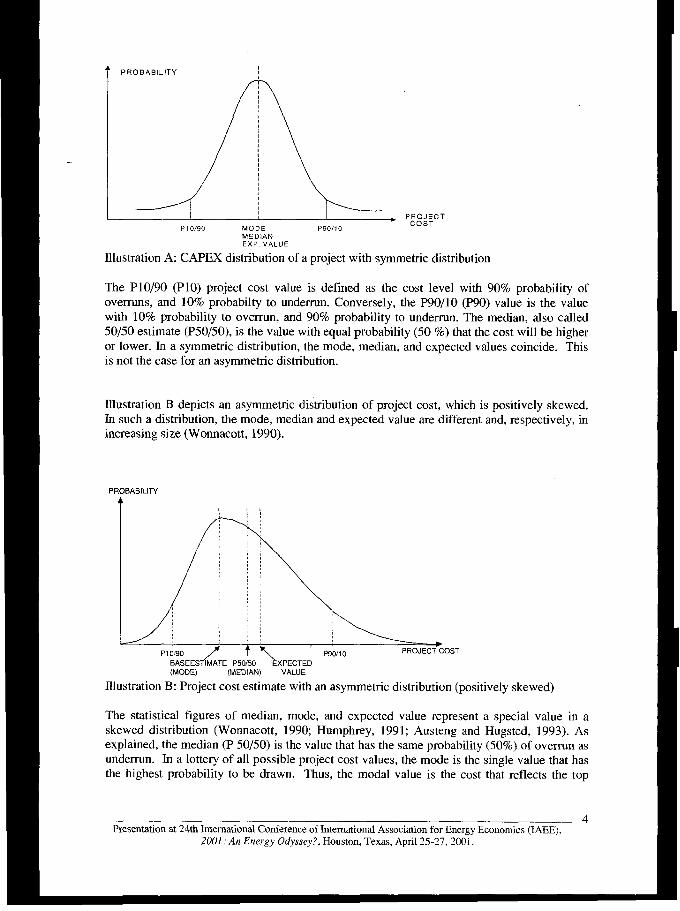
A cost estimate for a project is a prediction or forecast of the total cost of carrying out theproject, which can be illustrated by a distribution curve, Illustration A shows a distributionthat is symmetric from the mode, median, and expected value.
1The cost overruns are atso analysed from a contractual and organizational perspective, see Osmundsen (2000).z For a discussion of risk sharing in the petrolenm sector, see Osmundsen (1999) and Olsen and Osmundsen(2000).
5Presentation at 24th Intematiomd Conference of Intemationat Association for Energy Economics (IAEE),
2001: An Energy Odyssey?, Houston,Texas, April 25-27,2001.
? PROBABILITY,
P~::;cT
P 10/90 MODE P9OI1OMEDIANEXP VALUE
Illustration A: CAPEX distribution of a project with symmetric distribution
The PIO/90 (P1O) project cost value is defined as the cost level with 90% probability ofoverruns, and 10% probability to underrun. Conversely, the P90/10 (P90) value is the valuewith 10’70probability to overrun, and 90% probability to underrun. The median, also called50/50 estimate (P50/50), is the value with equal probability (50%) that the cost will be higheror lower. In a symmetric distribution, the mode, median, and expected values coincide. Thisis not the case for an asymmetric distribution.
Illustration B depicts an asymmetric distribution of project cost, which is positively skewed.In such a distribution, the mode, median and expected value are different and, respectively, inincreasing size (Wonnacott, 1990).
PF IABILITY
PI 0/90 2 \ P90/10 PROJECT COST
BASEESTfiATE P50/50 ‘kXPECTED(MODE) (MEDIAN) VALUE
Illustration B: Project cost estimate with an asymmetric distribution (positively skewed)
The statistical figures of median, mode, and expected value represent a special value in askewed distribution (Wonnacott, 1990 Humphrey, 1991; Austeng and Hugsted, 1993). Asexplained, the median (P 50/50) is the value that has the same probability (so~o) of overrun asunderrun. In a lottery of all possible project cost values, the mode is the single value that hasthe highest probability to be drawn. Thus, the modal value is the cost that reflects the top
4Presentationat 24thInternationalConferenceof InternationalAssociationfor Energy Economics (IAEE),
2001: A17Energy odyssey?, Houston, Texas, April 25-27,2001.

point of the distribution curve. The expected value - also referred to as a weighted average -is the sum of all outcome times the respective probabilities.
Expected value is the anticipated total cost of a project. Consequently, the expected valueshould be the reported investment cost figure (CAPEX) for a project (Humphrey, 1991; Clarkand Lorenzoni, 1985). We add two more remarks that we will come back to: 1) standarddeviation is measured from the expected value, which statistically makes the expected valueeasier to calculate during the development of the estimate, and 2) income, and othercosts/expenditures, e.g., OPEX, are reported as expected values and used in net present valuecalculations. For the sake of consistent comparisons, all cash flows including CAPEX shouldbe expected values.
4. The Current Practice and its Problems
In contradiction to the conclusions of the discussion above, the oil industry and many otherindustries adhere to a common practice of reporting a CAPEX that is the estimated 50/50(median) instead of the expected value. The 50/50 CAPEX estimate is usually reportedtogether with a) the base estimate (which is the sum of all defined cost elements, i.e. sum ofall cost elements’ modal values), and b) the contingency (usually defined as “The amount ofmoney in a cost estimate to cover the difference between the 50/50-Estimate and the BaseEstimate.”) (North Sea, 20013)
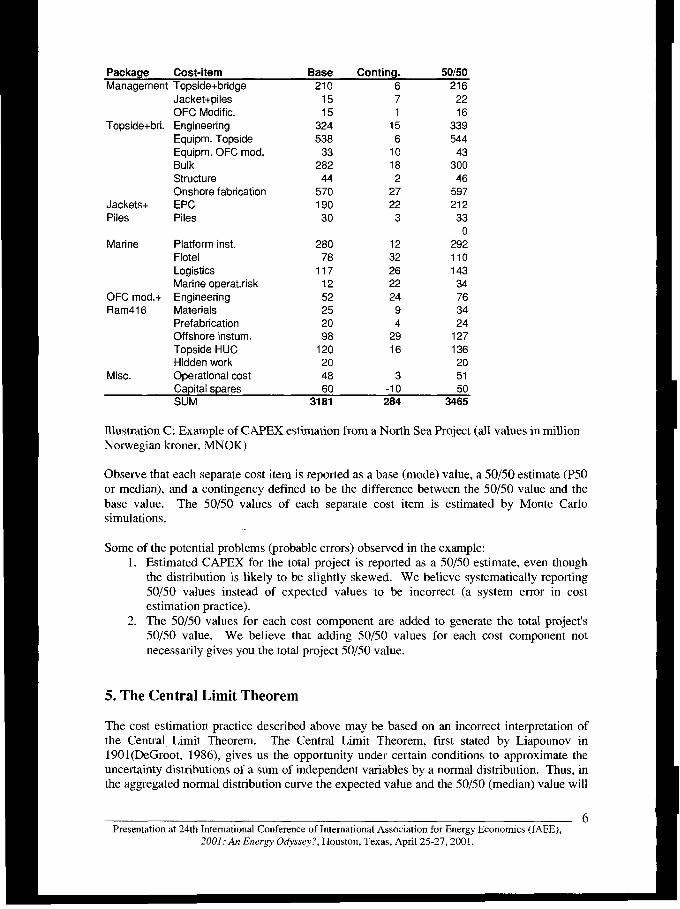
In order to illustrate details on problems in cost estimation practice, a reported cost estimatefor a North Sea Project after a cost risk analysis is shown in Illustration C (North Sea, 2001).
3 North Sea (2001), Cost Estimation Procedure and Cost Estimate from a North Sea Project. Oil company thatprefers to be anonymous, Norway. The cost reporting pmetice of any oil company operating in NorwegianNorth Sea sector is similar to this company’s practice, due to governmental requirements on reporting of costestimates.
5Presentationat 24th International Conference of International Association for Energy Economics (IAEE),
2001: An Energy Odyssey?, Houston, Texas, April 25-27,2001.
Package Coat-item Base Conting. 50/50Management Topside+bridge 210 6 216
Jacket+piles -OFC Modific.
Topside+bri. EngineeringEquipm. TopsideEquipm. OFC mod.BulkStructureOnshore fabrication
Jackets+ EPCPiles Piles
Marine Platform inst.FlotelLogisticsMarine operat.risk
OFCmod.+ EngineeringRam416 Materials
PrefabricationOffshoreinstum.TopsideHUCHidden work
Misc. Operational cost
1515
324538
3328244
57019030
28078
1171252252098
1202048
71
156
10182
2722
3
12
32
2622
24
94
29
16
3
2216
33954443
30046
59721233
029211014334763424
1271362051
Capital spares 60 -10 50SUM 3181 284 3465
Illustration C: Example of CAPEX estimation from a North Sea Project (all values in millionNorwegian kroner, MNOK)
Observe that each separate cost item is reported as a base (mode) value, a 50/50 estimate (P50or median), and a contingency defined to be the difference between the 50/50 value and thebase value. The 50/50 values of each separate cost item is estimated by Monte Carlosimulations.
Some of the potential problems (probable errors) observed in the example:1. Estimated CAPEX for the total project is reported as a 50/50 estimate, even though
the distribution is likely to be slightly skewed. We believe systematically reporting50/50 values instead of expected values to be incorrect (a system error in costestimation practice).
2. The 50/50 values for each cost component are added to generate the total project’s50/50 value. We believe that adding 50/50 values for each cost component notnecessarily gives you the total project 50/50 value.
5. The Central Limit Theorem
The cost estimation practice described above may be based on an incorrect interpretation ofthe Central Limit Theorem. The Central Limit Theorem, first stated by Liapounov in1901 (DeGroot, 1986), gives us the opportunity under certain conditions to approximate theuncertainty distributions of a sum of independent variables by a normal distribution. Thus, inthe aggregated normal distribution curve the expected value and the 50/50 (median) value will
6Presentation at 24th International Conference of Intemationat Association for Energy Economics (IAEE),
2001: An Energy Odyssey?, Houston, Texas, April 25-27,2001.

be the same, as shown in the symmetric curve in Illustration A. However, this is true only fora symmetric curve.
The conditions for the Central Limit Theorem to apply can be summarized in the followingconditions (Austeng and Hugsted, 1993):
1. The number of the N independent variables are large.2. The uncertain variables Xl ,X2,... ,X. are independent but there are no restriction on the
type of distribution each uncertain variable may have.
3. No single variable X. should dominate the sum(1
‘gX, .
We summarize how the uncertainty distribution of a sum of independent variables may beapproximated by a normal distribution. If the expected value and the variance is expressed as
E(Xi)= W, and Var(Xi)= a,’ for i=l,.. .,n and
$Xi .;pi*“ = ,=1
y ‘“ ‘
(1)
[)then E(Y.)=0 and Var(Yn)=l . If E[(XI – ~, )’ ]< co for i=l,2... and
then, with Yn defined as in (1), for all X,
lirnPr(Y,ls x) = o(x)>n+-
(2)
(3)
where CDis the distribution for a standard normal distribution with ~i=O and a,z =1.
In other words, if (2) holds and N is large, the distribution for the sum of independent
variables()
~x, will be approximately normal with expected value ~fl, and variancei=] ,.1
6. Aggregated Cost Estimate Distributions and Positive Skewness
Under the assumption that the three conditions described earlier holds true, the aggregatedtotal cost of a project (CAPEX) may be approximated by a normal distribution. The costestimates may then be calculated with the use of the Central Limit Theorem.
However, very few projects have a CAPEX that approximates to a normal or symmetricdistribution. Most projects have a positively skewed CAPEX distribution, and a majority of
IPresentation at 24th International Conference of Intemationat Association for Energy Economics (IAEE),
2001: An Energy Odyssey?, Houston, Texas, April 25-27,2001.

the single cost elements that makes up a CAPEX are also positively skewed. Typically, thedistribution’s spread and skewness are also underestimated. Our hypothesis that mostprojects have a positively skewed CAPEX are above explained by selection biases of projectsand tenders, and the belief that the three conditions for the Central Limit Theorem to holdusually are not met with respect to project cost. Another explanation is the asymmetric natureof cost savings and overruns.
If a project is carried out in an ideal manner, the cost would creep down towards an absoluteproject minimum cost that is unique for this project. However, this minimum cost will havean absolute lower limit, that could of course never be below zero. Conversely, if a project ispoorly carried out, e.g., by refabrication due to insut%cient engineering, the cost wouldincrease but there would be no absolute upper limit. Cost overruns in the range of 300 percent are not unheard of.
Therefore, the cost for a project has a geater chance of being 50 percent above than estimatedCAPEX than it does of being 50 percent below. Humphrey (1991) agrees: “ In practice,estimates and uncertainties will not follow a normal distribution or even be symmetrical aboutthe mem, a cost for a venture has a greater chance of being 50 percent higher than theestimated cost than it does for being 50 percent lower.” When we do not have normaldistributions, the general approach is to employ simulations using the Monte Carlo technique.
7. Monte Carlo Simulations
Based on the North Sea Project example, we want to illustrate possible errors of the costestimation practice.
● First, demonstrate that the expected value for the total cost, given each cost element’s50/50 value from the example project and given an assumed skewed distribution, to bedifferent from the reported 50/50 value of MNOK 3465. This would demonstrate thatthese two figures are different and that expected values should be reported.
● Second, if the total cost estimates uncertainty distribution has a 50/50 value that isdifferent from the sum of each cost elements 50/50 value (MNOK 3465), then thiswould demonstrate that the practice of adding several cost elements’ 50/50 value doesnot give the 50/50 cost estimate for the total project.
Assuming a skewed beta-curve with expected values for each cost element that were 20%higher than median vahre, and a standard deviation of 25% of median, where minimum valuewas one - 1 - standard deviation below median, and maximum value three - 3 - standarddeviations above median, we undertake Monte Carlo simulation (using @-Risk Palisade,1998). Illustration D shows the aggregated results from this example.
Exp. value 415850/50 4153Plo 3806P90 4524
Illustration D: Results from Monte Carlo CAPEX Simulation (uncorrelated, 2000 iterations).
8Presentation at 24th International Conference of International Association for Energy Economics (IAEE),
2001: An Energy Odyssey?, Houston, Texas, April 25-27,2001.

First, observe that the expected value is MNOK 4158, i.e. MNOK 693 higher than ourexample project 50/50 value of MNOK 3465. Second, we observe that the total project 50/50value is MNOK 4153, i.e. MNOK 688 h]gher than our example project 50/50 value MNOK3465.
Correlated cost elementsSince many cost elements are likely to be correlated, we also test the effect of correlations onour example distribution by correlating 7 cost elements with a factor of 0,7. Illustration Eshows the aggregated results from this example.
Exp. value 415850/50 4134Plo 3402P90 4943
Illustration E: Results from Monte Carlo CAPEX Simulation with correlated cost elements(2000 iterations).
Observe that the expected vahte is the same as in the uncorrelated simulation and that the50/50 and mode value have become slightly smaller. However, the distribution have got alarger spread, the. PI O (PI O/90) and P90 (P90/1 O) values have moved further away from theexpected value. Thus, correlated elements will influence on the spread of the distribution andalso to some degree on the skewness. (We also looked at dependency between cost elements(one cost element a constant factor of another) and obtained the result that dependency, likecorrelation, increases distribution skewness and standard deviation.
S. Conclusions
We draw two conclusions from this example:
1. Expected vahte fo~ a skewed uncertainty distribution curve (MNOK 4158) differsfrom the 50/50 estimate given in our project example (MNOK 3465). The differenceis MNOK 693, which definitively impact net present value calculations. In general,the 50/50 value is a too low CAPEX estimate, when the cost distribution is positivelyskewed. Thus, the use of 50/50 CAPEX may lead to wrong net present calculations,possibly leading to incorrect investment decisions. (The more skewed, the larger thedifference between the expected value and the 50/50 estimate.)
2. The total 50/50 value for the skewed distribution curve (MNOK 4153), differs fromthe sum of 50/50 estimate for each cost elements (MNOK 3465). The difference inour example is MNOK 688. Thus, to aggregate each cost element’s median values andexpect them to be the total project cost med]an (50/50) value is incorrect. The moreskewed the uncertainty distribution of each cost element is, the larger the estimationerrors.
9Presentation at 24th International Conference of International Association for Energy Economics (IAEE),
ZOOI: An Energy Odyssey?, Houston, Texas, April 25-27,2001.

References
Austeng, Kjell and Hugsted, Reidar (1993), Trirmvis kakdasjm i bygg og anlegg (StepwiseCalculation in Construction), Norges Tekniske H@gskole, Institutt for bygg- oganleggsteknikk, Trondheim, Norway.
Clark, Forrest D. and Lorenzoni, A.B. (1985), Applied Cost Engineering, Second edition,Revised and Expanded, Marcel Dekker, Inc., New York.
DeGroot, Morris H. (1986), The Central Limit Theorem for The Sum of IndependentVariables, Probability and Statistics, Second Edition, Addison-Wesley PublishingCompany, Inc.
Humphreys, Kenneth K. (1991), Jelen’s Cost and Optimization Engineering, Third Edition,McGraw-Hill, Inc.
McMillan, J. (1992), Games, Strategies& Managers, Oxford University Press.
NOU 1999:11, Government Report, Analyse av investeringsutviklingen pi sokkelen (Analysisof Investments on the Norwegian Continental Shelf).
Olsen, T.E. and P. Osmundsen (2000), “Sharing of Endogenous Risk in Construction”,Working paper 88/2000, Stavanger University College.
Osmundsen, P. (1999), Risk Sharing and Incentives in Norwegian Petroleum Extraction,Energy Policy 27,549-555.
Osmundsen, P. (1999), “Norsok og kostnadsoverskridelser sett ut i fra @konomisk kontrakts-og insentivteori” (Norsok and Cost Overruns seen from the Perspective of Contract andIncentive Theory), Scientific Enclosure to Government Report NOU 1999:11 (Analysisof Investments on the Norwegian Continental Shelf).
Palisade Corporation (1998), @ Risk, Windows, Version July, 1997. Palisade Corporation, 31Decker Road, Newfield, NY USA 14867.
Wonnacott, Thomas H. and Wonnacott, Ronald J. (1990), Introductory Statistics, fifth edition,John Wiley & Sons, Inc
10Presentation at 24th International Conference of Intemationat Association for Energy Economics (IAEE),
2001: An Energy Odyssey?, Houston, Texas, April 25-27,2001.