portfolio objectives - matson money save the investor. save the world. ™ 5955 deerfield boulevard...
TRANSCRIPT

w w w . m a t s o n m o n e y . c o mS a v e T h e I n v e s t o r . S a v e T h e W o r l d .
™ 5955 DEERFIELD BOULEVARD
MASON, OHIO 45040 P: (513) 204-8000 F: (513) 204-8005
PORTFOLIO OBJECTIVES
Aggressive Growth Strategy - Page 2
Long - Term Growth Strategy - Page 8
Balanced Growth Strategy - Page 11
Income and Growth Strategy - Page 20

1
AGGRESSIVE GROWTH STRATEGY
95% EQUITY • 5% FIXED INCOME
Investment ObjectIve
Since capital growth is the only goal in this in-vestment strategy, the investor must also ac-cept the high degree of risk inherent in the stock market. The Aggressive Growth Portfo-lio provides the greatest growth potential of the four and exposes the client to the great-est degree of volatility. Matson Money will fo-cus the client’s portfolio in equity funds to help produce better long-term returns. This is a long-term investment strategy of at least ten years. Annual withdrawals may not be ap-propriate with this investment strategy due to the short-term volatility of the stock market.
50% Domestic Equity
45% Int’l Equity
5% Fixed Income
ASSETS UNDER MANAGEMENT
as of 12/31/12
TOTAL AUM: $3.599 BillionTOTAL CLIENTS: 16,666
TOTAL AGGRESSIVE GROWTH OBJECTIVE:$334 Million Portfolio Inception: July 1, 1992
MATSON MONEY AGGRESSIVE GROWTH STYLE
STANDARD
Money Market U.S. Micro Cap*
U.S. Small Cap U.S. Small Cap Value
U.S. Large Cap Value U.S. Large Company
Int’l Small Company* Int’l Small Cap Value
Int’l Large Cap Value Int’l Large Cap
Emerging Markets Value* Emerging Markets
Emerging Markets Small Cap*
*Matson Fund Platform Only
These accounts are invested in various passive DFA mutual funds according to the objective of the management style and rebalanced periodically. Actual results of accounts under Matson Money’s management may have been materially different from results shown herein because of differences in the inception date of the account and restrictions. Net of fee results are time-weighted and dollar-weighted and are net of transaction costs, investment advisory fees, and any custodial fees which may have been paid. Gross of fee results are time-weighted and dollar-weighted and are net of transaction costs and any custodial fees which may have been paid. Performance results assume reinvestment of dividends and income plus capital appreciation. Past performance is not to be construed as a guarantee of future performance.
All investing involves risk and costs. Your advisor can provide you with more information about the risks and costs associated with specific programs. No investment strategy (including asset allocation and diversification strategies) can ensure peace of mind, assure profit, or protect against loss.
This booklet is based on the views of Matson Money, Inc. Other persons may analyze investing from a different perspective. Nothing included herein is intended to infer that the approach to investing espoused in this booklet will assure any particular results.
See accompaning GIPS report for disclosures and additional information, including benchmark information. This page must be accompanied with GIPS reports and disclosures.
Past performance is not to be construed as a guarantee of future performance.
Annualized Compound Returns (%) All data as of 12/31/2012
PORTFOLIO CHARACTERISTICS*
Portfolio Time Horizon 10+ yearsNumber of Unique Holdings in Funds 12,9292012 Dividends Distributed by Funds 1.41%2012 Short-Term Gains Distributed by Funds 0.00%2012 Long-Term Gains Distributed by Funds 0.73%Portfolio Weighted Expense Ratio2 1.05%
Unique Holdings based upon data obtained from DFA for each underlying mutual fund *Matson Fund Platform2. Based on 12/31/12 Free Market Fund prospectus
4
$-
$1.00
$2.00
$3.00
$4.00
$5.00
$6.00
$7.00
Sep-
92
Apr-9
3
Nov-
93
Jun-
94
Jan-
95
Aug-
95
Mar
-96
Oct-9
6
May
-97
Dec-
97
Jul-9
8
Feb-
99
Sep-
99
Apr-0
0
Nov-
00
Jun-
01
Jan-
02
Aug-
02
Mar
-03
Oct-0
3
May
-04
Dec-
04
Jul-0
5
Feb-
06
Sep-
06
Apr-0
7
Nov-
07
Jun-
08
Jan-
09
Aug-
09
Mar
-10
Oct-1
0
May
-11
Dec-
11
Jul-1
2
Aggressive Growth
Benchmark Net of Fees Gross of Fees
18.48%
8.53%
0.94%
10.87% 8.92%
17.85%
17.04%
7.13%
-0.48%
9.19% 7.20%
17.79%15.88%
7.85%
0.13%
8.64% 6.84%
16.93%
1-Year 3-Year 5-Year 10-Year Inception Std. Deviation
Aggressive Growth Gross of Fees Aggressive Growth Net of Fees Aggressive Benchmark

2
© 2005-13 McGriff Video Production, LLC., an Ohio limited liability company and a wholly-owned subsidiary of Matson Money, Inc. MPSv04162013_AGG
Aggressive Growth Composite
Aggressive Growth Composite contains all discretionary Aggressive Growth accounts that invest primarily in equities, are high risk, and have a time horizon of greater than ten years. For comparison purposes the composite is measured against a blend of the following indices; 5% One Month T-Bills, 25% Standard & Poor’s 500 Index, 25% Russell 2000 Index, 17.5% MSCI EAFE Index (net div), 27.5% MSCI EAFE Small Cap Index, calculated monthly, prior to 2009 the benchmark was calculated quarterly. Prior to June 30, 1996, the composite was measured against a different blend of indices, which was changed to more accurately represent the composite strategy. Additional information regarding the previous blended benchmark is available upon request. Beginning January 1, 1999, the minimum account size for this composite is $1000. Prior to 1999, the number of accounts included in the composite is reported as the number of client relationships. A client relationship may be comprised of multiple portfolios. From 1999 forward, the number of accounts reflects the total number of separate portfolios.
Matson Money, Inc. (“Matson”) is an independent SEC registered investment adviser. Matson Money is comprised of a bundled company retirement account platform and a standard fee only money management platform. The firm maintains a complete list and description of composites, which is available upon request.Matson Money, Inc. claims compliance with the Global Investment Performance Standards (GIPS®) and has prepared and presented this report in compliance with the GIPS standards. The firm was been independently verified for the periods October 1, 1991 through June 30, 1996 by Berge & Company CPAs. Matson Money, Inc. has been verified for the periods January 1, 1999 through December 31, 2012 by Ashland Partners & Company LLP.Verification assesses whether (1) the firm has complied with all the composite construction requirements of the GIPS standards on a firm-wide basis and (2) the firm’s policies and procedures are designed to calculate and present performance in compliance with the GIPS standards. The Aggressive Growth Composite has been examined for the periods January 1, 1999 through December 31, 2011. The verification and performance examination reports are available upon request.Results are based on fully discretionary accounts under management, including those accounts no longer with the firm. Beginning July, 1, 2002, composite policy requires the temporary removal of any portfolio incurring a client initiated significant cash inflow or outflow of 50% of portfolio’s beginning asset value. The temporary removal of such an account occurs at the beginning of the month in which the significant cash flow occurs and the account re-enters the composite the month after the cash flow. Additional information regarding the treatment of significant cash flows is available upon request. Past performance is not indicative of future results.The U.S. Dollar is the currency used to express performance. Returns are presented gross and net of management fees and include the reinvestment of all income. Net of fee performance was calculated using actual management fees. In addition to management fees and transaction costs, net of fee returns have been reduced by asset based custodial fees and other administrative fees. The annual composite dispersion presented is an asset-weighted standard deviation calculated for the accounts in the composite the entire year. Policies for valuing portfolios, calculating performance, and preparing compliant presentations are available upon request.The investment management fee schedule, under the private account asset allocation program, for the composite is 2% on the first $500 thousand, 1% on the next $500 thousand, 0.75% on the next $3 million, and 0.50% on the remainder. The investment management fee schedule, under the matson fund program, for the composite is in the range of 1.40% to 0.25%, of which Matson Money receives none of this fee under this program. Actual investment advisory fees incurred by clients may vary.Matson Money, Inc. changed its name from Abundance Technologies in December 2009. Furthermore, Abundance Technologies, Inc. changed its name from Matrix Asset Allocation in September 2001.Matson Money’s valuation policy materially differs from the recommended hierarchy in the GIPS Valuation Principles.The Aggressive Growth Composite was created July 1, 1992.The 2012 three year annualized standard deviation for the Aggressive Growth Composite Gross o f Fees and Net Of Fees were 18.94% and 18.82% compared to the benchmarks standard deviation of 17.18%. The 2011 three year annualized standard deviation for the Aggressive Growth Composite Gross o f Fees and Net Of Fees were 23.33% and 23.21% compared to the benchmarks standard deviation of 20.55%.
AGGRESSIVE GROWTH COMPOSITE PERFORMANCE FOR 1997 TO 2012Year End Total Firm
Assets (millions) USD
(millions)Number of Accounts
% of Non-Fee-Paying
Composite Gross
Composite Net
Benchmark Composite Dispersion
2012 $3,599 $334 4,909 6.40% 18.48% 17.04% 15.88% 0.399%2011 $3,026 $305 5,021 5.62% -9.73% -10.89% -7.73% 0.751%2010 $2,904 $346 4,881 5.09% 19.53% 17.88% 17.35% 0.73%2009 $2,407 $314 5,079 3.25% 34.53% 32.50% 30.98% 1.620%2008 $1,922 $251 5,005 3.89% -39.05% -40.06% -38.74% 1.217%2007 $2,579 $431 4,605 3.86% 5.54% 3.89% 3.08% 1.319%2006 $2,180 $336 3,340 2.97% 22.69% 20.78% 18.25% 0.922%2005 $1,504 $216 2,285 3.28% 13.26% 11.38% 11.34% 0.726%2004 $1,043 $144 1,447 2.25% 22.89% 20.93% 18.58% 1.054%2003 $709 $105 1,162 3.10% 48.58% 46.05% 41.33% 2.280%2002 $475 $70 1,138 2.38% -9.25% -10.83% -15.84% 1.795%2001 $482 $75 994 3.51% 0.19% -1.47% -9.82% 0.868%2000 $432 $65 848 3.03% -1.37% -2.98% -7.72% 1.973%1999 $403 $49 653 3.74% 19.94% 17.95% 20.98% 3.036%1998 $332 $37 310 0.22% 6.78% 4.98% 11.55% 1.758%
1997 $315 $39 308 4.25% 8.18% 6.35% 6.22% 0.431%
Annual Performance ResultsComposite Assets

*As of 12/31/2012
Aggressive Growth Portfolio 95% Eq / 5% Fi
12,929 Unique Holdings 19 Distinct Asset Categories* 46 Total Countries*Asset Class of International Small comprised of 5 separate funds:
Japan Small Co, continental Small Co, Canadian Small Co, Asia Pacific Small Co, and UK Small Co.
Five Year Global Fixed Income0.750%
Treasury Inflation Protected Securities0.150%
Short Term Government0.240%
Two Year Global Fixed Income0.750%
Intermediate Government0.360%
One Year Fixed Income0.750%
US Micro Cap Portfolio7.498%
US Large Cap Value Portfolio14.997%
US Small Cap Value Portfolio12.497%
US Small Cap Portfolio7.498%
US Large Company Portfolio7.498%
Continental Small Company Portfolio1.440%
DFA Japan Small Co1.012%
Emerging Markets2.362%
Emerging Markets Small Cap Portfolio2.205%
Emerging Markets Value Portfolio2.205%
International Value III Portfolio13.497%
International Small Value Cap17.996%
International Large Cap Portfolio2.249%
DFA Asia Pacific Small Company0.585%
DFA United Kingdom Small Company0.900%
DFA Canadian Small Company0.562%
Money Market2.000%
ADPC_03212013

1
LONG-TERM GROWTH STRATEGY
75% EQUITY • 25% FIXED INCOME
Investment ObjectIve
The Long-Term Growth Portfolio provides a reasonably high rate of growth without the full degree of risk usually found in the stock market. The primary goal is long-term capital growth while the secondary goal is preservation of capital. In order to achieve long-term capital growth, greater volatility, including the risk of negative returns, will be encountered than with the choice of the Income and Growth or Balanced Growth strategies. This investment strategy does not, however, expose investors to the full capital risk of the stock market. Returns will not compare with the stock market on a year-to-year basis, but should be less volatile than stock market returns. Six to nine years may be required to realize this investment strategy. Annual withdrawals may not be appropriate with this objective due to the short-term volatility of the stock market.
Performance results for Matrix Management Styles are for all accounts of each management style under Matrix’s management for at least one quarter beginning with the first quarter of 1993, other than variable annuity accounts, with a minimum account size of $1,000 and that have fees paid directly out of the account and no other fees taken out of the account. These accounts are invested in various passive DFA mutual funds according to the objective of the management style and rebalanced periodically. Actual results of accounts under Matrix’s management may have been materially different from results shown herein because of differences in the inception date of the account and restrictions. Results are time-weighted and dollar-weighted. Gross returns are gross of transaction costs and any custodial fees. Net results are net of investment transaction costs, investment advisory fees, and any custodial fees. Performance results and comparative indices assume reinvestment of dividends and income plus capital appreciation. Past performance is not to be construed as a guarantee of future performance. Actual Matrix Investment Performance for the Long Term Growth portfolio for the year of 1992 is only for the period of July 1, 1992 to December 31, 1992.
42.5% Domestic Equity
32.5% Int’l Equity
25% Fixed Income
ASSETS UNDER MANAGEMENT
as of 12/31/12
TOTAL AUM: $3.599 BillionTOTAL CLIENTS: 16,666TOTAL LONG-TERM GROWTH OBJECTIVE: $1.247 Billion Portfolio Inception: July 1, 1992
MATSON MONEY LONG-TERM GROWTH STYLE
STANDARD
Money Market One-Year Fixed Income
Two-Year Global Fixed Income* Five-Year Gov’t
Intermediate Gov’t U.S. Micro Cap* U.S. Small Cap
Five-Year Gov’t Fixe Income U.S. Small Cap Value
U.S. Large Cap Value U.S. Large Company
Int’l Small Company* Int’l Small Cap Value
Int’l Large Cap Value Int’l Large Cap
Emerging Markets Value* Emerging Markets
Emerging Markets Small Cap*
Inflation Protected Securities
*Matson Fund Platform OnlyThese accounts are invested in various passive DFA mutual funds according to the objective of the management style and rebalanced periodically. Actual results of accounts under Matson Money’s management may have been materially different from results shown herein because of differences in the inception date of the account and restrictions. Net of fee results are time-weighted and dollar-weighted and are net of transaction costs, investment advisory fees, and any custodial fees which may have been paid. Gross of fee results are time-weighted and dollar-weighted and are net of transaction costs and any custodial fees which may have been paid. Performance results assume reinvestment of dividends and income plus capital appreciation. Past performance is not to be construed as a guarantee of future performance.
All investing involves risk and costs. Your advisor can provide you with more information about the risks and costs associated with specific programs. No investment strategy (including asset allocation and diversification strategies) can ensure peace of mind, assure profit, or protect against loss.
This booklet is based on the views of Matson Money, Inc. Other persons may analyze investing from a different perspective. Nothing included herein is intended to infer that the approach to investing espoused in this booklet will assure any particular results.
See accompaning GIPS report for disclosures and additional information, including benchmark information. This page must be accompanied with GIPS reports and disclosures.
Past performance is not to be construed as a guarantee of future performance.
Annualized Compound Returns (%) All data as of 12/31/12
PORTFOLIO CHARACTERISTICS*
Portfolio Time Horizon 6–9 yearsNumber of Unique Holdings in Funds 12,9292012 Dividends Distributed by Funds 1.28%2012 Short-Term Gains Distributed by Funds 0.00%2012 Long-Term Gains Distributed by Funds 0.70%Portfolio Weighted Expense Ratio2 0.99%
Unique Holdings based upon data obtained from DFA for each underlying mutual fund *Matson Money Fund Platform2. Based on 12/31/12 Free Market Fund prospectus
6
14.85%
7.61%
2.00%
9.43% 8.24%
13.81%
13.42%
6.18%
0.55%
7.76% 6.50%
13.75%
13.34%
7.68%
1.70%
7.97% 7.06%
13.09%
1-Year 3-Year 5-Year 10-Year Inception Std. Deviation
Long Term Growth Gross of Fees Long Term Growth Net of Fees Long Term Growth Benchmark
$-
$1.00
$2.00
$3.00
$4.00
$5.00
$6.00
Sep-
92
Apr-9
3
Nov-
93
Jun-
94
Jan-
95
Aug-
95
Mar
-96
Oct-9
6
May
-97
Dec-9
7
Jul-9
8
Feb-
99
Sep-
99
Apr-0
0
Nov-
00
Jun-
01
Jan-
02
Aug-
02
Mar
-03
Oct-0
3
May
-04
Dec-0
4
Jul-0
5
Feb-
06
Sep-
06
Apr-0
7
Nov-
07
Jun-
08
Jan-
09
Aug-
09
Mar
-10
Oct-1
0
May
-11
Dec-1
1
Jul-1
2
Long Term Growth
Long Term Growth Benchmark(Qtrly) Long Term Growth Gross of Fees (Qtrly) Long Term Growth Net of Fees (Qtrly)

2
© 2005-13 McGriff Video Production, LLC., an Ohio limited liability company and a wholly-owned subsidiary of Matson Money, Inc. MPSv85-15-04162013_LTG
Long-Term Growth Composite
Long-Term Growth Composite contains all discretionary Long-Term Growth accounts that invest primarily in equities, are medium to high risk, and have a time horizon of six to ten years. For comparison purposes the composite is measured against a blend of the following indices; 20% Barclays Intermediate Government Credit Bond Index (1-10 year), 5% One Month T-Bills, 22.5% Standard & Poor’s 500 Index, 20% Russell 2000 Index, 15% MSCI EAFE Index (net div), 17.5% MSCI EAFE Small Cap Index, calculated monthly, prior to 2009 the benchmark was calculated quarterly. Prior to June 30, 1996, the composite was measured against a different blend of indices, which was changed to more accurately represent the composite strategy. Additional information regarding the previous blended benchmark is available upon request. Beginning January 1, 1999, the minimum account size for this composite is $1000. Prior to 1999, the number of accounts included in the composite is reported as the number of client relationships. A client relationship may be comprised of multiple portfolios. From 1999 forward, the number of accounts reflects the total number of separate portfolios.
Matson Money, Inc. (“Matson”) is an independent SEC registered investment adviser. Matson Money is comprised of a bundled company retirement account platform and a standard fee only money management platform. The firm maintains a complete list and description of composites, which is available upon request.Matson Money, Inc. claims compliance with the Global Investment Performance Standards (GIPS®) and has prepared and presented this report in compliance with the GIPS standards. The firm was been independently verified for the periods October 1, 1991 through June 30, 1996 by Berge & Company CPAs. Matson Money, Inc. has been verified for the periods January 1, 1999 through December 31, 2012 by Ashland Partners & Company LLP.Verification assesses whether (1) the firm has complied with all the composite construction requirements of the GIPS standards on a firm-wide basis and (2) the firm’s policies and procedures are designed to calculate and present performance in compliance with the GIPS standards. The Long-Term Growth Composite has been examined for the periods January 1, 1999 through December 31, 2011. The verification and performance examination reports are available upon request.Results are based on fully discretionary accounts under management, including those accounts no longer with the firm. Beginning July, 1, 2002, composite policy requires the temporary removal of any portfolio incurring a client initiated significant cash inflow or outflow of 50% of portfolio’s beginning asset value. The temporary removal of such an account occurs at the beginning of the month in which the significant cash flow occurs and the account re-enters the composite the month after the cash flow. Additional information regarding the treatment of significant cash flows is available upon request. Past performance is not indicative of future results.The U.S. Dollar is the currency used to express performance. Returns are presented gross and net of management fees and include the reinvestment of all income. Net of fee performance was calculated using actual management fees. In addition to management fees and transaction costs, net of fee returns have been reduced by asset based custodial fees and other administrative fees. The annual composite dispersion presented is an asset-weighted standard deviation calculated for the accounts in the composite the entire year. Policies for valuing portfolios, calculating performance, and preparing compliant presentations are available upon request.The investment management fee schedule, under the private account asset allocation program, for the composite is 2% on the first $500 thousand, 1% on the next $500 thousand, 0.75% on the next $3 million, and 0.50% on the remainder. The investment management fee schedule, under the matson fund program, for the composite is in the range of 1.40% to 0.25%, of which Matson Money receives none of this fee under this program. Actual investment advisory fees incurred by clients may vary.Matson Money, Inc. changed its name from Abundance Technologies in December 2009. Furthermore, Abundance Technologies, Inc. changed its name from Matrix Asset Allocation in September 2001.Matson Money’s valuation policy materially differs from the recommended hierarchy in the GIPS Valuation Principles.The Long-Term Growth Composite was created July 1, 1992.The 2012 three year annualized standard deviation for the Long-Term Growth Composite Gross of Fees and Net Of Fees were 14.70% and 14.57% compared to the benchmarks standard deviation of 13.33%. The 2011 three year annualized standard deviation for the Long-Term Growth Composite Gross of Fees and Net Of Fees were 18.08% and 17.97% compared to the benchmarks standard deviation of 16.16%.
The 2011 three year annualized standard deviation for the Long-Term Growth Composite Gross of Fees and Net Of Fees were 18.08% and 17.97% compared to the benchmarks standard deviation of 16.16%.
LONG-TERM GROWTH COMPOSITEYear End Total Firm
Assets (millions) USD
(millions)Number of Accounts
% of Non-Fee-Paying
Composite Gross
Composite Net
Benchmark Composite Dispersion
2012 $3,599 $1,247 12,811 3.02% 14.85% 13.42% 13.34% 0.692%2011 $3,026 $1,109 12,150 2.69% -6.60% -7.84% -4.16% 0.795%2010 $2,904 $1,155 10,892 2.42% 16.16% 14.54% 14.94% 0.782%2009 $2,407 $1,117 10,984 1.22% 26.86% 24.96% 24.92% 2.067%2008 $1,922 $926 10,833 1.55% -30.14% -31.30% -30.25% 1.842%2007 $2,579 $1,265 9,923 1.33% 5.42% 3.72% 4.30% 0.730%2006 $2,180 $1,062 7,906 1.32% 18.46% 16.56% 15.32% 1.069%2005 $1,504 $715 5,735 1.26% 10.27% 8.45% 8.60% 0.948%2004 $1,043 $465 3,566 0.67% 17.96% 16.08% 14.69% 1.129%
2003 $709 $315 2,705 0.85% 37.26% 35.03% 32.07% 2.354%2002 $475 $224 2,407 0.45% -6.24% -7.79% -11.03% 1.570%2001 $482 $229 2,076 0.35% 1.80% 0.12% -5.56% 1.986%
2000 $432 $207 1,838 0.64% 0.24% -1.42% -4.19% 1.865%1999 $403 $185 1,713 0.63% 16.18% 14.15% 16.75% 2.338%
1998 $332 $112 684 0.90% 7.11% 5.15% 12.32% 0.702%
1997 $315 $126 712 1.25% 9.86% 7.92% 8.81% 0.602%
Annual Performance ResultsComposite Assets
PERFORMANCE FOR 1997 TO 2012

*As of 12/31/2012
Long-Term Growth 85% Eq / 15% Fi
12,929 Unique Holdings 19 Distinct Asset Categories* 46 Total Countries*Asset Class of International Small comprised of 5 separate funds:
Japan Small Co, continental Small Co, Canadian Small Co, Asia Pacific Small Co, and UK Small Co.
Five Year Global Fixed Income3.249%
Treasury Inflation Protected Securities0.650%
Short Term Government1.040%
Two Year Global Fixed Income3.249%
Intermediate Government1.560%
One Year Fixed Income3.249%
US Micro Cap Portfolio6.936%
US Large Cap Value Portfolio13.872%
US Small Cap Value Portfolio11.560%
US Small Cap Portfolio6.936%
US Large Company Portfolio6.936%
Continental Small Company Portfolio1.240%
DFA Japan Small Co0.872%
Emerging Markets2.034%
Emerging Markets Small Cap Portfolio1.898%
Emerging Markets Value Portfolio1.898%
International Value III Portfolio11.623%
International Small Value Cap15.497%
International Large Cap Portfolio1.937%
DFA Asia Pacific Small Company0.504%
DFA United Kingdom Small Company0.775%
DFA Canadian Small Company0.484%
Money Market2.000%

1
LONG-TERM GROWTH STRATEGY
75% EQUITY • 25% FIXED INCOME
Investment ObjectIve
The Long-Term Growth Portfolio provides a reasonably high rate of growth without the full degree of risk usually found in the stock market. The primary goal is long-term capital growth while the secondary goal is preservation of capital. In order to achieve long-term capital growth, greater volatility, including the risk of negative returns, will be encountered than with the choice of the Income and Growth or Balanced Growth strategies. This investment strategy does not, however, expose investors to the full capital risk of the stock market. Returns will not compare with the stock market on a year-to-year basis, but should be less volatile than stock market returns. Six to nine years may be required to realize this investment strategy. Annual withdrawals may not be appropriate with this objective due to the short-term volatility of the stock market.
Performance results for Matrix Management Styles are for all accounts of each management style under Matrix’s management for at least one quarter beginning with the first quarter of 1993, other than variable annuity accounts, with a minimum account size of $1,000 and that have fees paid directly out of the account and no other fees taken out of the account. These accounts are invested in various passive DFA mutual funds according to the objective of the management style and rebalanced periodically. Actual results of accounts under Matrix’s management may have been materially different from results shown herein because of differences in the inception date of the account and restrictions. Results are time-weighted and dollar-weighted. Gross returns are gross of transaction costs and any custodial fees. Net results are net of investment transaction costs, investment advisory fees, and any custodial fees. Performance results and comparative indices assume reinvestment of dividends and income plus capital appreciation. Past performance is not to be construed as a guarantee of future performance. Actual Matrix Investment Performance for the Long Term Growth portfolio for the year of 1992 is only for the period of July 1, 1992 to December 31, 1992.
42.5% Domestic Equity
32.5% Int’l Equity
25% Fixed Income
ASSETS UNDER MANAGEMENT
as of 12/31/12
TOTAL AUM: $3.599 BillionTOTAL CLIENTS: 16,666TOTAL LONG-TERM GROWTH OBJECTIVE: $1.247 Billion Portfolio Inception: July 1, 1992
MATSON MONEY LONG-TERM GROWTH STYLE
STANDARD
Money Market One-Year Fixed Income
Two-Year Global Fixed Income* Five-Year Gov’t
Intermediate Gov’t U.S. Micro Cap* U.S. Small Cap
Five-Year Gov’t Fixe Income U.S. Small Cap Value
U.S. Large Cap Value U.S. Large Company
Int’l Small Company* Int’l Small Cap Value
Int’l Large Cap Value Int’l Large Cap
Emerging Markets Value* Emerging Markets
Emerging Markets Small Cap*
Inflation Protected Securities
*Matson Fund Platform OnlyThese accounts are invested in various passive DFA mutual funds according to the objective of the management style and rebalanced periodically. Actual results of accounts under Matson Money’s management may have been materially different from results shown herein because of differences in the inception date of the account and restrictions. Net of fee results are time-weighted and dollar-weighted and are net of transaction costs, investment advisory fees, and any custodial fees which may have been paid. Gross of fee results are time-weighted and dollar-weighted and are net of transaction costs and any custodial fees which may have been paid. Performance results assume reinvestment of dividends and income plus capital appreciation. Past performance is not to be construed as a guarantee of future performance.
All investing involves risk and costs. Your advisor can provide you with more information about the risks and costs associated with specific programs. No investment strategy (including asset allocation and diversification strategies) can ensure peace of mind, assure profit, or protect against loss.
This booklet is based on the views of Matson Money, Inc. Other persons may analyze investing from a different perspective. Nothing included herein is intended to infer that the approach to investing espoused in this booklet will assure any particular results.
See accompaning GIPS report for disclosures and additional information, including benchmark information. This page must be accompanied with GIPS reports and disclosures.
Past performance is not to be construed as a guarantee of future performance.
Annualized Compound Returns (%) All data as of 12/31/12
PORTFOLIO CHARACTERISTICS*
Portfolio Time Horizon 6–9 yearsNumber of Unique Holdings in Funds 12,9292012 Dividends Distributed by Funds 1.28%2012 Short-Term Gains Distributed by Funds 0.00%2012 Long-Term Gains Distributed by Funds 0.70%Portfolio Weighted Expense Ratio2 0.99%
Unique Holdings based upon data obtained from DFA for each underlying mutual fund *Matson Money Fund Platform2. Based on 12/31/12 Free Market Fund prospectus
6
14.85%
7.61%
2.00%
9.43% 8.24%
13.81%
13.42%
6.18%
0.55%
7.76% 6.50%
13.75%
13.34%
7.68%
1.70%
7.97% 7.06%
13.09%
1-Year 3-Year 5-Year 10-Year Inception Std. Deviation
Long Term Growth Gross of Fees Long Term Growth Net of Fees Long Term Growth Benchmark
$-
$1.00
$2.00
$3.00
$4.00
$5.00
$6.00
Sep-
92
Apr-9
3
Nov-
93
Jun-
94
Jan-
95
Aug-
95
Mar
-96
Oct-9
6
May
-97
Dec-9
7
Jul-9
8
Feb-
99
Sep-
99
Apr-0
0
Nov-
00
Jun-
01
Jan-
02
Aug-
02
Mar
-03
Oct-0
3
May
-04
Dec-0
4
Jul-0
5
Feb-
06
Sep-
06
Apr-0
7
Nov-
07
Jun-
08
Jan-
09
Aug-
09
Mar
-10
Oct-1
0
May
-11
Dec-1
1
Jul-1
2
Long Term Growth
Long Term Growth Benchmark(Qtrly) Long Term Growth Gross of Fees (Qtrly) Long Term Growth Net of Fees (Qtrly)

2
© 2005-13 McGriff Video Production, LLC., an Ohio limited liability company and a wholly-owned subsidiary of Matson Money, Inc. MPSv85-15-04162013_LTG
Long-Term Growth Composite
Long-Term Growth Composite contains all discretionary Long-Term Growth accounts that invest primarily in equities, are medium to high risk, and have a time horizon of six to ten years. For comparison purposes the composite is measured against a blend of the following indices; 20% Barclays Intermediate Government Credit Bond Index (1-10 year), 5% One Month T-Bills, 22.5% Standard & Poor’s 500 Index, 20% Russell 2000 Index, 15% MSCI EAFE Index (net div), 17.5% MSCI EAFE Small Cap Index, calculated monthly, prior to 2009 the benchmark was calculated quarterly. Prior to June 30, 1996, the composite was measured against a different blend of indices, which was changed to more accurately represent the composite strategy. Additional information regarding the previous blended benchmark is available upon request. Beginning January 1, 1999, the minimum account size for this composite is $1000. Prior to 1999, the number of accounts included in the composite is reported as the number of client relationships. A client relationship may be comprised of multiple portfolios. From 1999 forward, the number of accounts reflects the total number of separate portfolios.
Matson Money, Inc. (“Matson”) is an independent SEC registered investment adviser. Matson Money is comprised of a bundled company retirement account platform and a standard fee only money management platform. The firm maintains a complete list and description of composites, which is available upon request.Matson Money, Inc. claims compliance with the Global Investment Performance Standards (GIPS®) and has prepared and presented this report in compliance with the GIPS standards. The firm was been independently verified for the periods October 1, 1991 through June 30, 1996 by Berge & Company CPAs. Matson Money, Inc. has been verified for the periods January 1, 1999 through December 31, 2012 by Ashland Partners & Company LLP.Verification assesses whether (1) the firm has complied with all the composite construction requirements of the GIPS standards on a firm-wide basis and (2) the firm’s policies and procedures are designed to calculate and present performance in compliance with the GIPS standards. The Long-Term Growth Composite has been examined for the periods January 1, 1999 through December 31, 2011. The verification and performance examination reports are available upon request.Results are based on fully discretionary accounts under management, including those accounts no longer with the firm. Beginning July, 1, 2002, composite policy requires the temporary removal of any portfolio incurring a client initiated significant cash inflow or outflow of 50% of portfolio’s beginning asset value. The temporary removal of such an account occurs at the beginning of the month in which the significant cash flow occurs and the account re-enters the composite the month after the cash flow. Additional information regarding the treatment of significant cash flows is available upon request. Past performance is not indicative of future results.The U.S. Dollar is the currency used to express performance. Returns are presented gross and net of management fees and include the reinvestment of all income. Net of fee performance was calculated using actual management fees. In addition to management fees and transaction costs, net of fee returns have been reduced by asset based custodial fees and other administrative fees. The annual composite dispersion presented is an asset-weighted standard deviation calculated for the accounts in the composite the entire year. Policies for valuing portfolios, calculating performance, and preparing compliant presentations are available upon request.The investment management fee schedule, under the private account asset allocation program, for the composite is 2% on the first $500 thousand, 1% on the next $500 thousand, 0.75% on the next $3 million, and 0.50% on the remainder. The investment management fee schedule, under the matson fund program, for the composite is in the range of 1.40% to 0.25%, of which Matson Money receives none of this fee under this program. Actual investment advisory fees incurred by clients may vary.Matson Money, Inc. changed its name from Abundance Technologies in December 2009. Furthermore, Abundance Technologies, Inc. changed its name from Matrix Asset Allocation in September 2001.Matson Money’s valuation policy materially differs from the recommended hierarchy in the GIPS Valuation Principles.The Long-Term Growth Composite was created July 1, 1992.The 2012 three year annualized standard deviation for the Long-Term Growth Composite Gross of Fees and Net Of Fees were 14.70% and 14.57% compared to the benchmarks standard deviation of 13.33%. The 2011 three year annualized standard deviation for the Long-Term Growth Composite Gross of Fees and Net Of Fees were 18.08% and 17.97% compared to the benchmarks standard deviation of 16.16%.
The 2011 three year annualized standard deviation for the Long-Term Growth Composite Gross of Fees and Net Of Fees were 18.08% and 17.97% compared to the benchmarks standard deviation of 16.16%.
LONG-TERM GROWTH COMPOSITEYear End Total Firm
Assets (millions) USD
(millions)Number of Accounts
% of Non-Fee-Paying
Composite Gross
Composite Net
Benchmark Composite Dispersion
2012 $3,599 $1,247 12,811 3.02% 14.85% 13.42% 13.34% 0.692%2011 $3,026 $1,109 12,150 2.69% -6.60% -7.84% -4.16% 0.795%2010 $2,904 $1,155 10,892 2.42% 16.16% 14.54% 14.94% 0.782%2009 $2,407 $1,117 10,984 1.22% 26.86% 24.96% 24.92% 2.067%2008 $1,922 $926 10,833 1.55% -30.14% -31.30% -30.25% 1.842%2007 $2,579 $1,265 9,923 1.33% 5.42% 3.72% 4.30% 0.730%2006 $2,180 $1,062 7,906 1.32% 18.46% 16.56% 15.32% 1.069%2005 $1,504 $715 5,735 1.26% 10.27% 8.45% 8.60% 0.948%2004 $1,043 $465 3,566 0.67% 17.96% 16.08% 14.69% 1.129%
2003 $709 $315 2,705 0.85% 37.26% 35.03% 32.07% 2.354%2002 $475 $224 2,407 0.45% -6.24% -7.79% -11.03% 1.570%2001 $482 $229 2,076 0.35% 1.80% 0.12% -5.56% 1.986%
2000 $432 $207 1,838 0.64% 0.24% -1.42% -4.19% 1.865%1999 $403 $185 1,713 0.63% 16.18% 14.15% 16.75% 2.338%
1998 $332 $112 684 0.90% 7.11% 5.15% 12.32% 0.702%
1997 $315 $126 712 1.25% 9.86% 7.92% 8.81% 0.602%
Annual Performance ResultsComposite Assets
PERFORMANCE FOR 1997 TO 2012

*As of 12/31/2012
Long-Term Growth 75% Eq / 25% Fi
12,929 Unique Holdings 19 Distinct Asset Categories* 46 Total Countries*Asset Class of International Small comprised of 5 separate funds:
Japan Small Co, continental Small Co, Canadian Small Co, Asia Pacific Small Co, and UK Small Co.
Five Year Global Fixed Income5.749%
Treasury Inflation Protected Securities1.150%
Short Term Government1.840%
Two Year Global Fixed Income5.749%
Intermediate Government2.760%
One Year Fixed Income5.749%
US Micro Cap Portfolio6.374%
US Large Cap Value Portfolio12.748%
US Small Cap Value Portfolio10.623%
US Small Cap Portfolio6.374%
US Large Company Portfolio6.374%
Continental Small Company Portfolio1.040%
DFA Japan Small Co0.731%
Emerging Markets1.706%
Emerging Markets Small Cap Portfolio1.592%
Emerging Markets Value Portfolio1.592%
International Value III Portfolio9.748%
International Small Value Cap12.998%
International Large Cap Portfolio1.625%
DFA Asia Pacific Small Company0.422%
DFA United Kingdom Small Company0.650%
DFA Canadian Small Company0.406%
Money Market2.000%

1
BALANCED GROWTH STRATEGY
50% EQUITY • 50% FIXED INCOME
Investment ObjectIve
The Balanced Growth Portfolio has two purposes: to preserve capital and to obtain capital growth. Choosing this investment strategy for your investments indicates a need for a balance between capital preservation and long-term growth. This investment strategy will result in Matson Money choosing more stable and less volatile mutual fund investment strategies than with the choice of a longer-term growth investment strategy. Inherent in this position is that the earning potential of your investment will be less than in the Long-Term Growth or Aggressive Growth investment strategies, but this investment strategy should also be less volatile over time while earning a premium above short-term rates. The risk of capital loss and negative returns cannot be eliminated, but with this choice your portfolio will be subjected to less capital risk than is characteristic of the stock market. While the rate of return cannot be compared to the stock market, the investment manager will be expected to exceed the returns form Money Market Funds and three-month Treasury Bills. To realize this strategy, no less than a full-market cycle of three to five years is required.
Performance results for Matson Money Management Styles are for all accounts of each management style under Matrix’s management for at least one quarter beginning with the first quarter of 1993, other than variable annuity accounts, with a minimum account size of $1,000 and that have fees paid directly out of the account and no other fees taken out of the account. These accounts are invested in various passive DFA mutual funds according to the objective of the management style and rebalanced periodically. Actual results of accounts under Matrix’s management may have been materially different from results shown herein because of differences in the inception date of the account and restrictions. Results are time-weighted and dollar-weighted. Gross returns are gross of transaction costs and any custodial fees. Net results are net of investment transaction costs, investment advisory fees, and any custodial fees. Performance results and comparative indices assume reinvestment of dividends and income plus capital appreciation. Past performance is not to be construed as a guarantee of future performance. Actual Matrix Investment Performance for the Balanced Growth portfolio for the year of 1991 is only for the period of October 1, 1991 to December 31, 1991.
30% Domestic Equity
20% Int’l Equity
50% Fixed Income
ASSETS UNDER MANAGEMENT
as of 12/31/12
TOTAL AUM: $3.599 BillionTOTAL CLIENTS: 16,666TOTAL BALANCED GROWTH OBJECTIVE: $1.444 Billion Portfolio Inception: October 1, 1991
MATSON MONEY BALANCED GROWTH STYLE
STANDARD
Money Market One-Year Fixed Income
Two-Year Fixed income Five-Year Gov’t
Two-Year Global Fixed Income* U.S. Micro Cap*
Intermediate Gov’t* U.S. Small Cap
U.S. Small Cap Value U.S. Large Cap Value
U.S. Large Company Int’l Small Company*
Int’l Small Cap Value Int’l Large Cap Value
Int’l Large Cap Emerging Markets Small Cap*
Emerging Markets Value* Emerging Markets
Inflation Protected Securities
*Matson Fund Platform Only
These accounts are invested in various passive DFA mutual funds according to the objective of the management style and rebalanced periodically. Actual results of accounts under Matson Money’s management may have been materially different from results shown herein because of differences in the inception date of the account and restrictions. Net of fee results are time-weighted and dollar-weighted and are net of transaction costs, investment advisory fees, and any custodial fees which may have been paid. Gross of fee results are time-weighted and dollar-weighted and are net of transaction costs and any custodial fees which may have been paid. Performance results assume reinvestment of dividends and income plus capital appreciation. Past performance is not to be construed as a guarantee of future performance. Actual Matson Money Investment Performance for the Balanced Growth Portfolio for the year of 1991 is only for the period of October 1, 1991 to December 31, 1991.
All investing involves risk and costs. Your advisor can provide you with more information about the risks and costs associated with specific programs. No investment strategy (including asset allocation and diversification strategies) can ensure peace of mind, assure profit, or protect against loss.
This booklet is based on the views of Matson Money, Inc. Other persons may analyze investing from a different perspective. Nothing included herein is intended to infer that the approach to investing espoused in this booklet will assure any particular results.
See accompaning GIPS report for disclosures and additional information, including benchmark information. This page must be accompanied with GIPS reports and disclosures.
Past performance is not to be construed as a guarantee of future performance.
Annualized Compound Returns (%) All data as of 12/31/12
PORTFOLIO CHARACTERISTICS*
Portfolio Time Horizon 3–5 yearsNumber of Unique Holdings in Funds 12,9292012 Dividends Distributed by Funds 1.13%2012 Short-Term Gains Distributed by Funds 0.00%2012 Long-Term Gains Distributed by Funds 0.67%Portfolio Weighted Expense Ratio2 0.93%
Unique Holdings based upon data obtained from DFA for each underlying mutual fund *Matson Money Fund Platform 2. Based on 12/31/12 Free Market Fund prospectus
10.71%
6.11%
2.61%
7.51%
7.23%
9.05%
9.40%
4.79%
1.20%
5.89%
5.49%
9.01%
9.91%
6.77%
2.87%
6.77%
6.72%
8.38%
1-Year 3-Year 5-Year 10-Year Inception Std. Deviation
Balanced Growth Gross of Fees Balanced Growth Net of Fees Balanced Growth Benchmark
$-
$0.50
$1.00
$1.50
$2.00
$2.50
$3.00
$3.50
$4.00
$4.50
$5.00
Dec-9
1Ju
l-92
Feb-
93Se
p-93
Apr-9
4No
v-94
Jun-
95Jan
-96
Aug-9
6M
ar-9
7Oc
t-97
May
-98
Dec-9
8Ju
l-99
Feb-
00Se
p-00
Apr-0
1No
v-01
Jun-
02Jan
-03
Aug-0
3M
ar-0
4Oc
t-04
May
-05
Dec-0
5Ju
l-06
Feb-
07Se
p-07
Apr-0
8No
v-08
Jun-
09Jan
-10
Aug-1
0M
ar-1
1Oc
t-11
May
-12
Dec-1
2
Balanced Growth
Balanced Growth Benchmark(Qtrly) Balanced Growth Gross of Fees (Qtrly) Balanced Growth Net of Fees (Qtrly)

2
© 2005-13 McGriff Video Production, LLC., an Ohio limited liability company and a wholly-owned subsidiary of Matson Money, Inc. MPSv40-60-04162013_BAL
Balanced Growth Composite
Balanced Growth Composite contains all discretionary Balanced Growth accounts that invest primarily in a balanced strategy, are moderate risk, and have a time horizon of three to five years. For comparison purposes the composite is measured against a blend of the following indices; 40% Barclays Intermediate Government Credit Bond Index (1-10 year), 10% One Month T-Bills, 20% Standard & Poor’s 500 Index, 10% Russell 2000 Index, 7.5% MSCI EAFE Index (net div), 12.5% MSCI EAFE Small Cap Index, calculated monthly, prior to 2009 the benchmark was calculated quarterly. Prior to June 30, 1996, the composite was measured against a different blend of indices, which was changed to more accurately represent the composite strategy. Additional information regarding the previous blended benchmark is available upon request. Beginning January 1, 1999, the minimum account size for this composite is $1000. Prior to 1999, the number of accounts included in the composite is reported as the number of client relationships. A client relationship may be comprised of multiple portfolios. From 1999 forward, the number of accounts reflects the total number of separate portfolios.
Matson Money, Inc. (“Matson”) is an independent SEC registered investment adviser. Matson Money is comprised of a bundled company retirement account platform and a standard fee only money management platform. The firm maintains a complete list and description of composites, which is available upon request.Matson Money, Inc. claims compliance with the Global Investment Performance Standards (GIPS®) and has prepared and presented this report in compliance with the GIPS standards. The firm was been independently verified for the periods October 1, 1991 through June 30, 1996 by Berge & Company CPAs. Matson Money, Inc. has been verified for the periods January 1, 1999 through December 31, 2012 by Ashland Partners & Company LLP.Verification assesses whether (1) the firm has complied with all the composite construction requirements of the GIPS standards on a firm-wide basis and (2) the firm’s policies and procedures are designed to calculate and present performance in compliance with the GIPS standards. The Balanced Growth Composite has been examined for the periods January 1, 1999 through December 31, 2011. The verification and performance examination reports are available upon request.Results are based on fully discretionary accounts under management, including those accounts no longer with the firm. Beginning July, 1, 2002, composite policy requires the temporary removal of any portfolio incurring a client initiated significant cash inflow or outflow of 50% of portfolio’s beginning asset value. The temporary removal of such an account occurs at the beginning of the month in which the significant cash flow occurs and the account re-enters the composite the month after the cash flow. Additional information regarding the treatment of significant cash flows is available upon request. Past performance is not indicative of future results.The U.S. Dollar is the currency used to express performance. Returns are presented gross and net of management fees and include the reinvestment of all income. Net of fee performance was calculated using actual management fees. In addition to management fees and transaction costs, net of fee returns have been reduced by asset based custodial fees and other administrative fees. The annual composite dispersion presented is an asset-weighted standard deviation calculated for the accounts in the composite the entire year. Policies for valuing portfolios, calculating performance, and preparing compliant presentations are available upon request.The investment management fee schedule, under the private account asset allocation program, for the composite is 2% on the first $500 thousand, 1% on the next $500 thousand, 0.75% on the next $3 million, and 0.50% on the remainder. The investment management fee schedule, under the matson fund program, for the composite is in the range of 1.40% to 0.25%, of which Matson Money receives none of this fee under this program. Actual investment advisory fees incurred by clients may vary.Matson Money, Inc. changed its name from Abundance Technologies in December 2009. Furthermore, Abundance Technologies, Inc. changed its name from Matrix Asset Allocation in September 2001.Matson Money’s valuation policy materially differs from the recommended hierarchy in the GIPS Valuation Principles.The Balanced Growth Composite was created October 1, 1991.The 2012 three year annualized standard deviation for the Balanced Growth Composite Gross of Fees and Net Of Fees were 9.94% and 9.83% compared to the benchmarks standard deviation of 8.56%. The 2011 three year annualized standard deviation for the Balanced Growth Composite Gross of Fees and Net Of Fees were 12.18% and 12.08% compared to the benchmarks standard deviation of 10.62%..
BALANCED GROWTH COMPOSITEYear End Total Firm
Assets (millions) USD
(millions)Number of Accounts
% of Non-Fee-Paying
Composite Gross
Composite Net
Benchmark Composite Dispersion
2012 $3,599 $1,444 11,844 1.19% 10.71% 9.40% 9.91% 1.152%2011 $3,026 $1,161 10,063 1.18% -3.57% -4.77% -0.74% 0.795%2010 $2,904 $977 7,877 1.09% 11.91% 10.44% 11.58% 1.028%2009 $2,407 $640 5,409 0.26% 19.03% 17.27% 17.93% 0.967%2008 $1,922 $504 4,678 0.86% -20.01% -21.32% -19.73% 0.961%2007 $2,579 $595 3,972 0.32% 5.91% 4.20% 5.25% 0.726%2006 $2,180 $517 3,321 0.13% 13.94% 12.07% 11.27% 0.622%2005 $1,504 $379 2,567 0.36% 7.68% 5.88% 6.29% 0.520%2004 $1,043 $272 1,793 0.05% 12.52% 10.73% 10.34% 0.916%
2003 $709 $204 1,426 0.06% 24.04% 21.93% 21.63% 1.236%2002 $475 $131 1,244 0.34% -2.62% -4.27% -4.78% 0.974%2001 $482 $128 1,035 0.00% 2.37% 0.64% -1.08% 0.497%
2000 $432 $114 949 0.00% 2.02% 0.31% 0.12% 1.039%1999 $403 $111 965 0.00% 12.24% 10.29% 11.29% 2.067%1998 $332 $70 375 0.24% 7.61% 5.69% 12.34% 0.829%1997 $315 $75 305 0.00% 9.13% 7.15% 8.97% 0.394%
Annual Performance ResultsComposite Assets
PERFORMANCE FOR 1997 TO 2012

*As of 12/31/2012
Balanced Growth Portfolio 60% Eq / 40% Fi
12,929 Unique Holdings 19 Distinct Asset Categories* 46 Total Countries*Asset Class of International Small comprised of 5 separate funds:
Japan Small Co, continental Small Co, Canadian Small Co, Asia Pacific Small Co, and UK Small Co.
Five Year Global Fixed Income9.499%
Treasury Inflation Protected Securities1.900%
Short Term Government3.040%
Two Year Global Fixed Income9.499%
Intermediate Government4.559%
One Year Fixed Income9.499%
US Micro Cap Portfolio5.099%
US Large Cap Value Portfolio10.199%
US Small Cap Value Portfolio8.499%
US Small Cap Portfolio5.099%
US Large Company Portfolio5.099%
Continental Small Company Portfolio0.832%
DFA Japan Small Co0.585%
Emerging Markets1.365%
Emerging Markets Small Cap Portfolio1.274%
Emerging Markets Value Portfolio1.274%
International Value III Portfolio7.799%
International Small Value Cap10.399%
International Large Cap Portfolio1.300%
DFA Asia Pacific Small Company0.338%
DFA United Kingdom Small Company
0.520%
DFA Canadian Small Company0.325%
Money Market2.000%

1
BALANCED GROWTH STRATEGY
50% EQUITY • 50% FIXED INCOME
Investment ObjectIve
The Balanced Growth Portfolio has two purposes: to preserve capital and to obtain capital growth. Choosing this investment strategy for your investments indicates a need for a balance between capital preservation and long-term growth. This investment strategy will result in Matson Money choosing more stable and less volatile mutual fund investment strategies than with the choice of a longer-term growth investment strategy. Inherent in this position is that the earning potential of your investment will be less than in the Long-Term Growth or Aggressive Growth investment strategies, but this investment strategy should also be less volatile over time while earning a premium above short-term rates. The risk of capital loss and negative returns cannot be eliminated, but with this choice your portfolio will be subjected to less capital risk than is characteristic of the stock market. While the rate of return cannot be compared to the stock market, the investment manager will be expected to exceed the returns form Money Market Funds and three-month Treasury Bills. To realize this strategy, no less than a full-market cycle of three to five years is required.
Performance results for Matson Money Management Styles are for all accounts of each management style under Matrix’s management for at least one quarter beginning with the first quarter of 1993, other than variable annuity accounts, with a minimum account size of $1,000 and that have fees paid directly out of the account and no other fees taken out of the account. These accounts are invested in various passive DFA mutual funds according to the objective of the management style and rebalanced periodically. Actual results of accounts under Matrix’s management may have been materially different from results shown herein because of differences in the inception date of the account and restrictions. Results are time-weighted and dollar-weighted. Gross returns are gross of transaction costs and any custodial fees. Net results are net of investment transaction costs, investment advisory fees, and any custodial fees. Performance results and comparative indices assume reinvestment of dividends and income plus capital appreciation. Past performance is not to be construed as a guarantee of future performance. Actual Matrix Investment Performance for the Balanced Growth portfolio for the year of 1991 is only for the period of October 1, 1991 to December 31, 1991.
30% Domestic Equity
20% Int’l Equity
50% Fixed Income
ASSETS UNDER MANAGEMENT
as of 12/31/12
TOTAL AUM: $3.599 BillionTOTAL CLIENTS: 16,666TOTAL BALANCED GROWTH OBJECTIVE: $1.444 Billion Portfolio Inception: October 1, 1991
MATSON MONEY BALANCED GROWTH STYLE
STANDARD
Money Market One-Year Fixed Income
Two-Year Fixed income Five-Year Gov’t
Two-Year Global Fixed Income* U.S. Micro Cap*
Intermediate Gov’t* U.S. Small Cap
U.S. Small Cap Value U.S. Large Cap Value
U.S. Large Company Int’l Small Company*
Int’l Small Cap Value Int’l Large Cap Value
Int’l Large Cap Emerging Markets Small Cap*
Emerging Markets Value* Emerging Markets
Inflation Protected Securities
*Matson Fund Platform Only
These accounts are invested in various passive DFA mutual funds according to the objective of the management style and rebalanced periodically. Actual results of accounts under Matson Money’s management may have been materially different from results shown herein because of differences in the inception date of the account and restrictions. Net of fee results are time-weighted and dollar-weighted and are net of transaction costs, investment advisory fees, and any custodial fees which may have been paid. Gross of fee results are time-weighted and dollar-weighted and are net of transaction costs and any custodial fees which may have been paid. Performance results assume reinvestment of dividends and income plus capital appreciation. Past performance is not to be construed as a guarantee of future performance. Actual Matson Money Investment Performance for the Balanced Growth Portfolio for the year of 1991 is only for the period of October 1, 1991 to December 31, 1991.
All investing involves risk and costs. Your advisor can provide you with more information about the risks and costs associated with specific programs. No investment strategy (including asset allocation and diversification strategies) can ensure peace of mind, assure profit, or protect against loss.
This booklet is based on the views of Matson Money, Inc. Other persons may analyze investing from a different perspective. Nothing included herein is intended to infer that the approach to investing espoused in this booklet will assure any particular results.
See accompaning GIPS report for disclosures and additional information, including benchmark information. This page must be accompanied with GIPS reports and disclosures.
Past performance is not to be construed as a guarantee of future performance.
Annualized Compound Returns (%) All data as of 12/31/12
PORTFOLIO CHARACTERISTICS*
Portfolio Time Horizon 3–5 yearsNumber of Unique Holdings in Funds 12,9292012 Dividends Distributed by Funds 1.13%2012 Short-Term Gains Distributed by Funds 0.00%2012 Long-Term Gains Distributed by Funds 0.67%Portfolio Weighted Expense Ratio2 0.93%
Unique Holdings based upon data obtained from DFA for each underlying mutual fund *Matson Money Fund Platform 2. Based on 12/31/12 Free Market Fund prospectus
10.71%
6.11%
2.61%
7.51%
7.23%
9.05%
9.40%
4.79%
1.20%
5.89%
5.49%
9.01%
9.91%
6.77%
2.87%
6.77%
6.72%
8.38%
1-Year 3-Year 5-Year 10-Year Inception Std. Deviation
Balanced Growth Gross of Fees Balanced Growth Net of Fees Balanced Growth Benchmark
$-
$0.50
$1.00
$1.50
$2.00
$2.50
$3.00
$3.50
$4.00
$4.50
$5.00
Dec-9
1Ju
l-92
Feb-
93Se
p-93
Apr-9
4No
v-94
Jun-
95Jan
-96
Aug-9
6M
ar-9
7Oc
t-97
May
-98
Dec-9
8Ju
l-99
Feb-
00Se
p-00
Apr-0
1No
v-01
Jun-
02Jan
-03
Aug-0
3M
ar-0
4Oc
t-04
May
-05
Dec-0
5Ju
l-06
Feb-
07Se
p-07
Apr-0
8No
v-08
Jun-
09Jan
-10
Aug-1
0M
ar-1
1Oc
t-11
May
-12
Dec-1
2
Balanced Growth
Balanced Growth Benchmark(Qtrly) Balanced Growth Gross of Fees (Qtrly) Balanced Growth Net of Fees (Qtrly)

2
© 2005-13 McGriff Video Production, LLC., an Ohio limited liability company and a wholly-owned subsidiary of Matson Money, Inc. MPSv40-60-04162013_BAL
Balanced Growth Composite
Balanced Growth Composite contains all discretionary Balanced Growth accounts that invest primarily in a balanced strategy, are moderate risk, and have a time horizon of three to five years. For comparison purposes the composite is measured against a blend of the following indices; 40% Barclays Intermediate Government Credit Bond Index (1-10 year), 10% One Month T-Bills, 20% Standard & Poor’s 500 Index, 10% Russell 2000 Index, 7.5% MSCI EAFE Index (net div), 12.5% MSCI EAFE Small Cap Index, calculated monthly, prior to 2009 the benchmark was calculated quarterly. Prior to June 30, 1996, the composite was measured against a different blend of indices, which was changed to more accurately represent the composite strategy. Additional information regarding the previous blended benchmark is available upon request. Beginning January 1, 1999, the minimum account size for this composite is $1000. Prior to 1999, the number of accounts included in the composite is reported as the number of client relationships. A client relationship may be comprised of multiple portfolios. From 1999 forward, the number of accounts reflects the total number of separate portfolios.
Matson Money, Inc. (“Matson”) is an independent SEC registered investment adviser. Matson Money is comprised of a bundled company retirement account platform and a standard fee only money management platform. The firm maintains a complete list and description of composites, which is available upon request.Matson Money, Inc. claims compliance with the Global Investment Performance Standards (GIPS®) and has prepared and presented this report in compliance with the GIPS standards. The firm was been independently verified for the periods October 1, 1991 through June 30, 1996 by Berge & Company CPAs. Matson Money, Inc. has been verified for the periods January 1, 1999 through December 31, 2012 by Ashland Partners & Company LLP.Verification assesses whether (1) the firm has complied with all the composite construction requirements of the GIPS standards on a firm-wide basis and (2) the firm’s policies and procedures are designed to calculate and present performance in compliance with the GIPS standards. The Balanced Growth Composite has been examined for the periods January 1, 1999 through December 31, 2011. The verification and performance examination reports are available upon request.Results are based on fully discretionary accounts under management, including those accounts no longer with the firm. Beginning July, 1, 2002, composite policy requires the temporary removal of any portfolio incurring a client initiated significant cash inflow or outflow of 50% of portfolio’s beginning asset value. The temporary removal of such an account occurs at the beginning of the month in which the significant cash flow occurs and the account re-enters the composite the month after the cash flow. Additional information regarding the treatment of significant cash flows is available upon request. Past performance is not indicative of future results.The U.S. Dollar is the currency used to express performance. Returns are presented gross and net of management fees and include the reinvestment of all income. Net of fee performance was calculated using actual management fees. In addition to management fees and transaction costs, net of fee returns have been reduced by asset based custodial fees and other administrative fees. The annual composite dispersion presented is an asset-weighted standard deviation calculated for the accounts in the composite the entire year. Policies for valuing portfolios, calculating performance, and preparing compliant presentations are available upon request.The investment management fee schedule, under the private account asset allocation program, for the composite is 2% on the first $500 thousand, 1% on the next $500 thousand, 0.75% on the next $3 million, and 0.50% on the remainder. The investment management fee schedule, under the matson fund program, for the composite is in the range of 1.40% to 0.25%, of which Matson Money receives none of this fee under this program. Actual investment advisory fees incurred by clients may vary.Matson Money, Inc. changed its name from Abundance Technologies in December 2009. Furthermore, Abundance Technologies, Inc. changed its name from Matrix Asset Allocation in September 2001.Matson Money’s valuation policy materially differs from the recommended hierarchy in the GIPS Valuation Principles.The Balanced Growth Composite was created October 1, 1991.The 2012 three year annualized standard deviation for the Balanced Growth Composite Gross of Fees and Net Of Fees were 9.94% and 9.83% compared to the benchmarks standard deviation of 8.56%. The 2011 three year annualized standard deviation for the Balanced Growth Composite Gross of Fees and Net Of Fees were 12.18% and 12.08% compared to the benchmarks standard deviation of 10.62%..
BALANCED GROWTH COMPOSITEYear End Total Firm
Assets (millions) USD
(millions)Number of Accounts
% of Non-Fee-Paying
Composite Gross
Composite Net
Benchmark Composite Dispersion
2012 $3,599 $1,444 11,844 1.19% 10.71% 9.40% 9.91% 1.152%2011 $3,026 $1,161 10,063 1.18% -3.57% -4.77% -0.74% 0.795%2010 $2,904 $977 7,877 1.09% 11.91% 10.44% 11.58% 1.028%2009 $2,407 $640 5,409 0.26% 19.03% 17.27% 17.93% 0.967%2008 $1,922 $504 4,678 0.86% -20.01% -21.32% -19.73% 0.961%2007 $2,579 $595 3,972 0.32% 5.91% 4.20% 5.25% 0.726%2006 $2,180 $517 3,321 0.13% 13.94% 12.07% 11.27% 0.622%2005 $1,504 $379 2,567 0.36% 7.68% 5.88% 6.29% 0.520%2004 $1,043 $272 1,793 0.05% 12.52% 10.73% 10.34% 0.916%
2003 $709 $204 1,426 0.06% 24.04% 21.93% 21.63% 1.236%2002 $475 $131 1,244 0.34% -2.62% -4.27% -4.78% 0.974%2001 $482 $128 1,035 0.00% 2.37% 0.64% -1.08% 0.497%
2000 $432 $114 949 0.00% 2.02% 0.31% 0.12% 1.039%1999 $403 $111 965 0.00% 12.24% 10.29% 11.29% 2.067%1998 $332 $70 375 0.24% 7.61% 5.69% 12.34% 0.829%1997 $315 $75 305 0.00% 9.13% 7.15% 8.97% 0.394%
Annual Performance ResultsComposite Assets
PERFORMANCE FOR 1997 TO 2012
*As of 12/31/2012
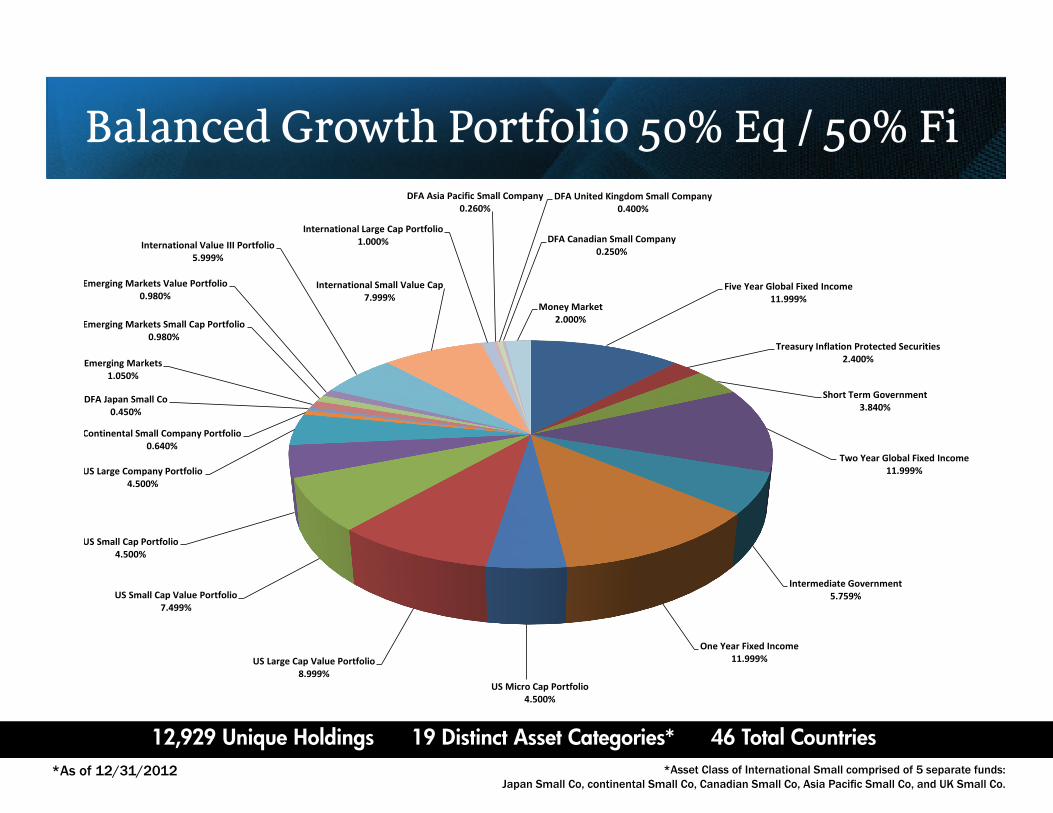
Balanced Growth Portfolio 50% Eq / 50% Fi
12,929 Unique Holdings 19 Distinct Asset Categories* 46 Total Countries*Asset Class of International Small comprised of 5 separate funds:
Japan Small Co, continental Small Co, Canadian Small Co, Asia Pacific Small Co, and UK Small Co.
Five Year Global Fixed Income11.999%
Treasury Inflation Protected Securities2.400%
Short Term Government3.840%
Two Year Global Fixed Income11.999%
Intermediate Government5.759%
One Year Fixed Income11.999%
US Micro Cap Portfolio4.500%
US Large Cap Value Portfolio8.999%
US Small Cap Value Portfolio7.499%
US Small Cap Portfolio4.500%
US Large Company Portfolio4.500%
Continental Small Company Portfolio0.640%
DFA Japan Small Co0.450%
Emerging Markets1.050%
Emerging Markets Small Cap Portfolio0.980%
Emerging Markets Value Portfolio0.980%
International Value III Portfolio5.999%
International Small Value Cap7.999%
International Large Cap Portfolio1.000%
DFA Asia Pacific Small Company0.260%
DFA United Kingdom Small Company0.400%
DFA Canadian Small Company0.250%
Money Market2.000%

1
BALANCED GROWTH STRATEGY
50% EQUITY • 50% FIXED INCOME
Investment ObjectIve
The Balanced Growth Portfolio has two purposes: to preserve capital and to obtain capital growth. Choosing this investment strategy for your investments indicates a need for a balance between capital preservation and long-term growth. This investment strategy will result in Matson Money choosing more stable and less volatile mutual fund investment strategies than with the choice of a longer-term growth investment strategy. Inherent in this position is that the earning potential of your investment will be less than in the Long-Term Growth or Aggressive Growth investment strategies, but this investment strategy should also be less volatile over time while earning a premium above short-term rates. The risk of capital loss and negative returns cannot be eliminated, but with this choice your portfolio will be subjected to less capital risk than is characteristic of the stock market. While the rate of return cannot be compared to the stock market, the investment manager will be expected to exceed the returns form Money Market Funds and three-month Treasury Bills. To realize this strategy, no less than a full-market cycle of three to five years is required.
Performance results for Matson Money Management Styles are for all accounts of each management style under Matrix’s management for at least one quarter beginning with the first quarter of 1993, other than variable annuity accounts, with a minimum account size of $1,000 and that have fees paid directly out of the account and no other fees taken out of the account. These accounts are invested in various passive DFA mutual funds according to the objective of the management style and rebalanced periodically. Actual results of accounts under Matrix’s management may have been materially different from results shown herein because of differences in the inception date of the account and restrictions. Results are time-weighted and dollar-weighted. Gross returns are gross of transaction costs and any custodial fees. Net results are net of investment transaction costs, investment advisory fees, and any custodial fees. Performance results and comparative indices assume reinvestment of dividends and income plus capital appreciation. Past performance is not to be construed as a guarantee of future performance. Actual Matrix Investment Performance for the Balanced Growth portfolio for the year of 1991 is only for the period of October 1, 1991 to December 31, 1991.
30% Domestic Equity
20% Int’l Equity
50% Fixed Income
ASSETS UNDER MANAGEMENT
as of 12/31/12
TOTAL AUM: $3.599 BillionTOTAL CLIENTS: 16,666TOTAL BALANCED GROWTH OBJECTIVE: $1.444 Billion Portfolio Inception: October 1, 1991
MATSON MONEY BALANCED GROWTH STYLE
STANDARD
Money Market One-Year Fixed Income
Two-Year Fixed income Five-Year Gov’t
Two-Year Global Fixed Income* U.S. Micro Cap*
Intermediate Gov’t* U.S. Small Cap
U.S. Small Cap Value U.S. Large Cap Value
U.S. Large Company Int’l Small Company*
Int’l Small Cap Value Int’l Large Cap Value
Int’l Large Cap Emerging Markets Small Cap*
Emerging Markets Value* Emerging Markets
Inflation Protected Securities
*Matson Fund Platform Only
These accounts are invested in various passive DFA mutual funds according to the objective of the management style and rebalanced periodically. Actual results of accounts under Matson Money’s management may have been materially different from results shown herein because of differences in the inception date of the account and restrictions. Net of fee results are time-weighted and dollar-weighted and are net of transaction costs, investment advisory fees, and any custodial fees which may have been paid. Gross of fee results are time-weighted and dollar-weighted and are net of transaction costs and any custodial fees which may have been paid. Performance results assume reinvestment of dividends and income plus capital appreciation. Past performance is not to be construed as a guarantee of future performance. Actual Matson Money Investment Performance for the Balanced Growth Portfolio for the year of 1991 is only for the period of October 1, 1991 to December 31, 1991.
All investing involves risk and costs. Your advisor can provide you with more information about the risks and costs associated with specific programs. No investment strategy (including asset allocation and diversification strategies) can ensure peace of mind, assure profit, or protect against loss.
This booklet is based on the views of Matson Money, Inc. Other persons may analyze investing from a different perspective. Nothing included herein is intended to infer that the approach to investing espoused in this booklet will assure any particular results.
See accompaning GIPS report for disclosures and additional information, including benchmark information. This page must be accompanied with GIPS reports and disclosures.
Past performance is not to be construed as a guarantee of future performance.
Annualized Compound Returns (%) All data as of 12/31/12
PORTFOLIO CHARACTERISTICS*
Portfolio Time Horizon 3–5 yearsNumber of Unique Holdings in Funds 12,9292012 Dividends Distributed by Funds 1.13%2012 Short-Term Gains Distributed by Funds 0.00%2012 Long-Term Gains Distributed by Funds 0.67%Portfolio Weighted Expense Ratio2 0.93%
Unique Holdings based upon data obtained from DFA for each underlying mutual fund *Matson Money Fund Platform 2. Based on 12/31/12 Free Market Fund prospectus
10.71%
6.11%
2.61%
7.51%
7.23%
9.05%
9.40%
4.79%
1.20%
5.89%
5.49%
9.01%
9.91%
6.77%
2.87%
6.77%
6.72%
8.38%
1-Year 3-Year 5-Year 10-Year Inception Std. Deviation
Balanced Growth Gross of Fees Balanced Growth Net of Fees Balanced Growth Benchmark
$-
$0.50
$1.00
$1.50
$2.00
$2.50
$3.00
$3.50
$4.00
$4.50
$5.00
Dec-9
1Ju
l-92
Feb-
93Se
p-93
Apr-9
4No
v-94
Jun-
95Jan
-96
Aug-9
6M
ar-9
7Oc
t-97
May
-98
Dec-9
8Ju
l-99
Feb-
00Se
p-00
Apr-0
1No
v-01
Jun-
02Jan
-03
Aug-0
3M
ar-0
4Oc
t-04
May
-05
Dec-0
5Ju
l-06
Feb-
07Se
p-07
Apr-0
8No
v-08
Jun-
09Jan
-10
Aug-1
0M
ar-1
1Oc
t-11
May
-12
Dec-1
2
Balanced Growth
Balanced Growth Benchmark(Qtrly) Balanced Growth Gross of Fees (Qtrly) Balanced Growth Net of Fees (Qtrly)

2
© 2005-13 McGriff Video Production, LLC., an Ohio limited liability company and a wholly-owned subsidiary of Matson Money, Inc. MPSv40-60-04162013_BAL
Balanced Growth Composite
Balanced Growth Composite contains all discretionary Balanced Growth accounts that invest primarily in a balanced strategy, are moderate risk, and have a time horizon of three to five years. For comparison purposes the composite is measured against a blend of the following indices; 40% Barclays Intermediate Government Credit Bond Index (1-10 year), 10% One Month T-Bills, 20% Standard & Poor’s 500 Index, 10% Russell 2000 Index, 7.5% MSCI EAFE Index (net div), 12.5% MSCI EAFE Small Cap Index, calculated monthly, prior to 2009 the benchmark was calculated quarterly. Prior to June 30, 1996, the composite was measured against a different blend of indices, which was changed to more accurately represent the composite strategy. Additional information regarding the previous blended benchmark is available upon request. Beginning January 1, 1999, the minimum account size for this composite is $1000. Prior to 1999, the number of accounts included in the composite is reported as the number of client relationships. A client relationship may be comprised of multiple portfolios. From 1999 forward, the number of accounts reflects the total number of separate portfolios.
Matson Money, Inc. (“Matson”) is an independent SEC registered investment adviser. Matson Money is comprised of a bundled company retirement account platform and a standard fee only money management platform. The firm maintains a complete list and description of composites, which is available upon request.Matson Money, Inc. claims compliance with the Global Investment Performance Standards (GIPS®) and has prepared and presented this report in compliance with the GIPS standards. The firm was been independently verified for the periods October 1, 1991 through June 30, 1996 by Berge & Company CPAs. Matson Money, Inc. has been verified for the periods January 1, 1999 through December 31, 2012 by Ashland Partners & Company LLP.Verification assesses whether (1) the firm has complied with all the composite construction requirements of the GIPS standards on a firm-wide basis and (2) the firm’s policies and procedures are designed to calculate and present performance in compliance with the GIPS standards. The Balanced Growth Composite has been examined for the periods January 1, 1999 through December 31, 2011. The verification and performance examination reports are available upon request.Results are based on fully discretionary accounts under management, including those accounts no longer with the firm. Beginning July, 1, 2002, composite policy requires the temporary removal of any portfolio incurring a client initiated significant cash inflow or outflow of 50% of portfolio’s beginning asset value. The temporary removal of such an account occurs at the beginning of the month in which the significant cash flow occurs and the account re-enters the composite the month after the cash flow. Additional information regarding the treatment of significant cash flows is available upon request. Past performance is not indicative of future results.The U.S. Dollar is the currency used to express performance. Returns are presented gross and net of management fees and include the reinvestment of all income. Net of fee performance was calculated using actual management fees. In addition to management fees and transaction costs, net of fee returns have been reduced by asset based custodial fees and other administrative fees. The annual composite dispersion presented is an asset-weighted standard deviation calculated for the accounts in the composite the entire year. Policies for valuing portfolios, calculating performance, and preparing compliant presentations are available upon request.The investment management fee schedule, under the private account asset allocation program, for the composite is 2% on the first $500 thousand, 1% on the next $500 thousand, 0.75% on the next $3 million, and 0.50% on the remainder. The investment management fee schedule, under the matson fund program, for the composite is in the range of 1.40% to 0.25%, of which Matson Money receives none of this fee under this program. Actual investment advisory fees incurred by clients may vary.Matson Money, Inc. changed its name from Abundance Technologies in December 2009. Furthermore, Abundance Technologies, Inc. changed its name from Matrix Asset Allocation in September 2001.Matson Money’s valuation policy materially differs from the recommended hierarchy in the GIPS Valuation Principles.The Balanced Growth Composite was created October 1, 1991.The 2012 three year annualized standard deviation for the Balanced Growth Composite Gross of Fees and Net Of Fees were 9.94% and 9.83% compared to the benchmarks standard deviation of 8.56%. The 2011 three year annualized standard deviation for the Balanced Growth Composite Gross of Fees and Net Of Fees were 12.18% and 12.08% compared to the benchmarks standard deviation of 10.62%..
BALANCED GROWTH COMPOSITEYear End Total Firm
Assets (millions) USD
(millions)Number of Accounts
% of Non-Fee-Paying
Composite Gross
Composite Net
Benchmark Composite Dispersion
2012 $3,599 $1,444 11,844 1.19% 10.71% 9.40% 9.91% 1.152%2011 $3,026 $1,161 10,063 1.18% -3.57% -4.77% -0.74% 0.795%2010 $2,904 $977 7,877 1.09% 11.91% 10.44% 11.58% 1.028%2009 $2,407 $640 5,409 0.26% 19.03% 17.27% 17.93% 0.967%2008 $1,922 $504 4,678 0.86% -20.01% -21.32% -19.73% 0.961%2007 $2,579 $595 3,972 0.32% 5.91% 4.20% 5.25% 0.726%2006 $2,180 $517 3,321 0.13% 13.94% 12.07% 11.27% 0.622%2005 $1,504 $379 2,567 0.36% 7.68% 5.88% 6.29% 0.520%2004 $1,043 $272 1,793 0.05% 12.52% 10.73% 10.34% 0.916%
2003 $709 $204 1,426 0.06% 24.04% 21.93% 21.63% 1.236%2002 $475 $131 1,244 0.34% -2.62% -4.27% -4.78% 0.974%2001 $482 $128 1,035 0.00% 2.37% 0.64% -1.08% 0.497%
2000 $432 $114 949 0.00% 2.02% 0.31% 0.12% 1.039%1999 $403 $111 965 0.00% 12.24% 10.29% 11.29% 2.067%1998 $332 $70 375 0.24% 7.61% 5.69% 12.34% 0.829%1997 $315 $75 305 0.00% 9.13% 7.15% 8.97% 0.394%
Annual Performance ResultsComposite Assets
PERFORMANCE FOR 1997 TO 2012

*As of 12/31/2012
Balanced Growth Portfolio 40% Eq/60% Fi
12,929 Unique Holdings 19 Distinct Asset Categories* 46 Total Countries*Asset Class of International Small comprised of 5 separate funds:
Japan Small Co, continental Small Co, Canadian Small Co, Asia Pacific Small Co, and UK Small Co.
Five Year Global Fixed Income14.499%
Treasury Inflation Protected Securities2.900%
Short Term Government4.640%
Two Year Global Fixed Income14.499%
Intermediate Government6.959%
One Year Fixed Income14.499%
US Micro Cap Portfolio3.750%
US Large Cap Value Portfolio7.499%
US Small Cap Value Portfolio6.250%
US Small Cap Portfolio3.750%
US Large Company Portfolio3.750%
Continental Small Company Portfolio0.480%
DFA Japan Small Co0.337%
Emerging Markets0.787%
Emerging Markets Small Cap Portfolio0.735%
Emerging Markets Value Portfolio0.735%
International Value III Portfolio4.500%
International Small Value Cap6.000%
International Large Cap Portfolio0.750%
DFA Asia Pacific Small Company0.195%
DFA United Kingdom Small Company
0.300% DFA Canadian Small Company0.187%
Money Market2.000%

1
INCOME AND GROWTH STRATEGY
25% EQUITY • 75% FIXED INCOME
Investment ObjectIve
The Income and Growth Portfolio purpose is to minimize capital fluctuations while attempt-ing to deliver a rate of return in excess of infla-tion as measured by the consumer price index (C.P.I.). The choice of this investment strategy indicates a realization that the client’s portfolio must stay ahead of inflation to make any real gains. While this approach will provide the least amount of capital fluctuation, the possibility of negative returns is not eliminated, only re-duced. This approach does imply a substantial reduction of capital growth when compared to the stock market. This investment strategy fits with a time horizon of less than three years.
Annualized Compound Returns (%) All data as of 12/31/12
PORTFOLIO CHARACTERISTICS*
Portfolio Time Horizon < 3 yearsNumber of Unique Holdings in Funds 12,9292012 Dividends Distributed by Funds 0.97%2012 Short-Term Gains Distributed by Funds 0.00%2012 Long-Term Gains Distributed by Funds 0.63%Portfolio Weighted Expense Ratio2 0.87%
Unique Holdings based upon data obtained from DFA for each underlying mutual fund *Matson Money Fund Platform2. Based on 12/31/12 Free Market Fund prospectus
These accounts are invested in various passive DFA mutual funds according to the objective of the management style and rebalanced periodically. Actual results of accounts under Matson Money’s management may have been materially different from results shown herein because of differences in the inception date of the account and restrictions. Net of fee results are time-weighted and dollar-weighted and are net of transaction costs, investment advisory fees, and any custodial fees which may have been paid. Gross of fee results are time-weighted and dollar-weighted and are net of transaction costs and any custodial fees which may have been paid. Performance results assume reinvestment of dividends and income plus capital appreciation. Past performance is not to be construed as a guarantee of future performance. Actual Matson Money Investment Performance for the Income and Growth portfolio for the year of 1992 is only for the period of October 1, 1992 to December 31, 1992.
All investing involves risk and costs. Your advisor can provide you with more information about the risks and costs associated with specific programs. No investment strategy (including asset allocation and diversification strategies) can ensure peace of mind, assure profit, or protect against loss.
This booklet is based on the views of Matson Money, Inc. Other persons may analyze investing from a different perspective. Nothing included herein is intended to infer that the approach to investing espoused in this booklet will assure any particular results.
See accompaning GIPS report for disclosures and additional information, including benchmark information. This page must be accompanied with GIPS reports and disclosures.
Past performance is not to be construed as a guarantee of future performance.
ASSETS UNDER MANAGEMENT
as of 12/31/12
TOTAL AUM: $3.599 BillionTOTAL CLIENTS: 16,666TOTAL INCOME & GROWTH OBJECTIVE: $310 Million Portfolio Inception: October 1, 1992
MATSON MONEY INCOME & GROWTH STYLE
STANDARD
Money Market One-Year Fixed Income
Two-Year Global Fixed Income* Five-Year Gov’t
Intermediate Gov’t* U.S. Micro Cap*
Five-Year Global Fixed Income U.S. Small Cap
U.S. Small Cap Value* U.S. Large Cap Value
U.S. Large Company Int’l Small Company
Int’l Small Cap Value Int’l Large Cap Value
Emerging Markets Value* Emerging Markets*
Emerging Markets Small Cap*
Inflation Protected Securities
*Matson Fund Platform Only
1010
INCOME AND GROWTH STRATEGY
25% EQUITY • 75% FIXED INCOME
Investment ObjectIve
The Income and Growth Portfolio purpose is to minimize capital fluctuations while attempt-ing to deliver a rate of return in excess of infla-tion as measured by the consumer price index (C.P.I.). The choice of this investment strategy indicates a realization that the client’s portfolio must stay ahead of inflation to make any real gains. While this approach will provide the least amount of capital fluctuation, the possibility of negative returns is not eliminated, only re-duced. This approach does imply a substantial reduction of capital growth when compared to the stock market. This investment strategy fits with a time horizon of less than three years.
Annualized Compound Returns (%) All data as of 12/31/08
PORTFOLIO CHARACTERISTICS
Number of Unique Holdings in Funds 3,700+/12,300+*5-Year Average Dividends Distributed by Funds 2.73%5-Year Average Short-Term Gains Distributed by Funds 0.06%5-Year Average Long-Term Gains Distributed by Funds 0.67%
Portfolio Characteristics based upon dates obtained from DFA for each underlying mutual fund
*Advisor Direct Portfolio
These accounts are invested in various passive DFA mutual funds according to the objective of the management style and rebalanced periodically. Actual results of accounts under Matrix’s management may have been materially different from results shown herein because of differences in the inception date of the account and restrictions. Net of fee results are time-weighted and dollar-weighted and are net of transaction costs, investment advisory fees, and any custodial fees which may have been paid. Gross of fee results are time-weighted and dollar-weighted and are net of transaction costs and any custodial fees which may have been paid. Performance results assume reinvestment of dividends and income plus capital appreciation. Past performance is not to be construed as a guarantee of future performance. Actual Matrix Investment Performance for the Income and Growth portfolio for the year of 1992 is only for the period of October 1, 1992 to December 31, 1992.
All investing involves risk and costs. Your advisor can provide you with more information about the risks and costs associated with specific programs. No investment strategy (including asset allocation and diversification strategies) can ensure peace of mind, assure profit, or protect against loss.
This booklet is based on the views of Matson Money, Inc. Other persons may analyze investing from a different perspective. Nothing included herein is intended to infer that the approach to investing espoused in this booklet will assure any particular results.
See accompaning GIPS report for disclosures and additional information, including benchmark information. This page must be accompanied with GIPS reports and disclosures.
Past performance is not to be construed as a guarantee of future performance.
ASSETS UNDER MANAGEMENT
as of 12/31/08
TOTAL AUM:$1,921,844,646
TOTAL CLIENTS:9,914
TOTAL INCOME & GROWTH OBJECTIVE: $46,910,518 Portfolio Inception: July 1, 1992
MATRIX INCOME & GROWTH STYLE
STANDARD
Money Market One-Year Fixed Income
Two-Year Global Fixed Income* Five-Year Gov’t
Intermediate Gov’t* U.S. Micro Cap*
Five-Year Global Fixed Income U.S. Small Cap
U.S. Small Cap Value* U.S. Large Cap Value
U.S. Large Company Int’l Small Company
Int’l Small Cap Value Int’l Large Cap Value
Emerging Markets Value* Emerging Markets*
Emerging Markets Small Cap*
*Advisor Direct Platform Only
17.5% Domestic Equity
7.5% Int’l Equity
75% Fixed Income
™
®
10
Income & Growth
$10,000.00
$14,000.00
$18,000.00
$22,000.00
$26,000.00
$30,000.00
$34,000.00
$38,000.00
$42,000.00
$46,000.00
$50,000.00
$54,000.00
$58,000.00
Sep
-92
Mar
-93
Sep
-93
Mar
-94
Sep
-94
Mar
-95
Sep
-95
Mar
-96
Sep
-96
Mar
-97
Sep
-97
Mar
-98
Sep
-98
Mar
-99
Sep
-99
Mar
-00
Sep
-00
Mar
-01
Sep
-01
Mar
-02
Sep
-02
Mar
-03
Sep
-03
Mar
-04
Sep
-04
Mar
-05
Sep
-05
Mar
-06
Sep
-06
Mar
-07
Sep
-07
Mar
-08
Sep
-08
Gross of Fees Net of Fees Benchmark
-7.74%-9.30%
-7.34%
1.76%0.00%
2.21%
3.04%1.20%
3.14%
4.39%2.61%4.29%
5.85%4.02%
6.15%
4.12%4.00%
-10.00%
-8.00%
-6.00%
-4.00%
-2.00%
0.00%
2.00%
4.00%
6.00%
8.00%
One Year Three Year Five Year Ten Year SinceInception
Std Deviation
Matrix Income & Grow th Portfolio (Gross of Fees) Matrix Income & Grow th Portfolio (Net of Fees) Benchmark
10
$-
$0.50
$1.00
$1.50
$2.00
$2.50
$3.00
$3.50
$4.00
Dec-9
2
Jul-93
Feb-9
4
Sep-9
4
Apr-9
5
Nov-9
5
Jun-96
Jan-97
Aug-9
7
Mar-
98
Oct-9
8
May
-99
Dec-9
9
Jul-00
Feb-0
1
Sep-0
1
Apr-0
2
Nov-0
2
Jun-03
Jan-04
Aug-0
4
Mar-
05
Oct-0
5
May
-06
Dec-0
6
Jul-07
Feb-0
8
Sep-0
8
Apr-0
9
Nov-0
9
Jun-10
Jan-11
Aug-1
1
Mar-
12
Oct-1
2
Income and Growth
Income & Growth Net of Fees (Qtrly) Income & Growth Gross of Fees (Qtrly) Income & Growth Benchmark(Qtrly)
6.10%
4.51%
2.85%
4.94%
5.81%
4.57%
4.87%
3.24%
1.47%
3.29%
4.09%
4.56%
6.69%
5.92%
4.02%
5.50%
6.33%
4.30%
1 2 3 4 5 6
Income and Growth Gross of Fees Income and Growth Net of fees Income and Growth Benchmark

2
© 2005-13 McGriff Video Production, LLC., an Ohio limited liability company and a wholly-owned subsidiary of Matson Money, Inc. MPSv04162013_INC
INCOME & GROWTH COMPOSITE PERFORMANCE FOR 1997 TO 2012
Income & Growth Composite Income & Growth Composite contains all discretionary Income and Growth accounts that invest primarily in fixed income, are low risk, and have a time horizon of three years or less. For comparison purposes the composite is measured against a blend of the following indices; 65% Barclays Intermediate Government Credit Bond Index (1-10 year), 10% One Month T-Bills, 12.5% Standard & Poors 500 Index, 5% Russell 2000 Index, 7.5% MSCI EAFE Index (net div), calculated monthly, prior to 2009 the benchmark was calculated quarterly. Prior to June 30, 1996, the composite was measured against a different blend of indices, which was changed to more accurately represent the composite strategy. Additional information regarding the previous blended benchmark is available upon request. Beginning January 1, 1999, the minimum account size for this composite is $1000. Prior to 1999, the number of accounts included in the composite is reported as the number of client relationships. A client relationship may be comprised of multiple portfolios. From 1999 forward, the number of accounts reflects the total number of separate portfolios.
Matson Money, Inc. (“Matson”) is an independent SEC registered investment adviser. Matson Money is comprised of a bundled company retirement account platform and a standard fee only money management platform. The firm maintains a complete list and description of composites, which is available upon request.Matson Money, Inc. claims compliance with the Global Investment Performance Standards (GIPS®) and has prepared and presented this report in compliance with the GIPS standards. The firm was been independently verified for the periods October 1, 1991 through June 30, 1996 by Berge & Company CPAs. Matson Money, Inc. has been verified for the periods January 1, 1999 through December 31, 2012 by Ashland Partners & Company LLP.Verification assesses whether (1) the firm has complied with all the composite construction requirements of the GIPS standards on a firm-wide basis and (2) the firm’s policies and procedures are designed to calculate and present performance in compliance with the GIPS standards. The Income & Growth Composite has been examined for the periods January 1, 1999 through December 31, 2011. The verification and performance examination reports are available upon request.Results are based on fully discretionary accounts under management, including those accounts no longer with the firm. Beginning July, 1, 2002, composite policy requires the temporary removal of any portfolio incurring a client initiated significant cash inflow or outflow of 50% of portfolio’s beginning asset value. The temporary removal of such an account occurs at the beginning of the month in which the significant cash flow occurs and the account re-enters the composite the month after the cash flow. Additional information regarding the treatment of significant cash flows is available upon request. Past performance is not indicative of future results.The U.S. Dollar is the currency used to express performance. Returns are presented gross and net of management fees and include the reinvestment of all income. Net of fee performance was calculated using actual management fees. In addition to management fees and transaction costs, net of fee returns have been reduced by asset based custodial fees and other administrative fees. The annual composite dispersion presented is an asset-weighted standard deviation calculated for the accounts in the composite the entire year. Policies for valuing portfolios, calculating performance, and preparing compliant presentations are available upon request.The investment management fee schedule, under the private account asset allocation program, for the composite is 2% on the first $500 thousand, 1% on the next $500 thousand, 0.75% on the next $3 million, and 0.50% on the remainder. The investment management fee schedule, under the matson fund program, for the composite is in the range of 1.40% to 0.25%, of which Matson Money receives none of this fee under this program. Actual investment advisory fees incurred by clients may vary.Matson Money, Inc. changed its name from Abundance Technologies in December 2009. Furthermore, Abundance Technologies, Inc. changed its name from Matrix Asset Allocation in September 2001.Matson Money’s valuation policy materially differs from the recommended hierarchy in the GIPS Valuation Principles.The Income & Growth Composite was created October 1, 1992.The 2012 three year annualized standard deviation for the Income and Growth Composite Gross of Fees and Net Of Fees were 4.62% and 4.50% compared to the benchmarks standard deviation of 4.11%. The 2011 three year annualized standard deviation for the Income and Growth Composite Gross of Fees and Net Of Fees were 6.08% and 6.00% compared to the benchmarks standard deviation of 5.55%.
Year End Total FirmAssets
(millions) USD(millions)
Number of Accounts
% of Non-Fee-Paying
Composite Gross
Composite Net
Benchmark Composite Dispersion
2012 $3,599 $310 2,851 1.67% 6.10% 4.87% 6.69% 0.822%2011 $3,026 $251 2,349 1.14% 0.19% -1.01% 3.12% 0.231%2010 $2,904 $192 1,720 1.35% 7.38% 6.00% 8.00% 0.517%2009 $2,407 $100 937 1.07% 9.29% 7.80% 10.59% 0.784%2008 $1,922 $46 479 0.42% -7.78% -9.33% -7.34% 0.594%2007 $2,579 $28 297 0.02% 5.17% 3.40% 6.76% 0.387%2006 $2,180 $27 283 0.28% 8.60% 6.62% 7.94% 0.647%2005 $1,504 $21 253 0.31% 3.66% 1.68% 3.19% 0.277%2004 $1,043 $20 217 0.45% 6.36% 4.40% 5.91% 0.493%
2003 $709 $12 147 0.00% 11.84% 9.85% 11.44% 1.058%2002 $475 $10 104 0.00% 1.79% 0.04% 1.47% 0.768%2001 $482 $5 56 0.00% 3.57% 1.79% 3.60% 0.262%
2000 $432 $5 53 0.02% 4.72% 2.93% 4.61% 0.647%1999 $403 $7 64 0.39% 7.19% 5.83% 6.40% 0.705%1998 $332 $6 36 0.00% 7.85% 6.30% 11.50% 1.511%1997 $315 $12 22 0.00% 8.95% 7.42% 10.98% 0.729%
Annual Performance ResultsComposite Assets

*As of 12/31/2012
Income Growth Portfolio 25% Eq/75% Fi
12,929 Unique Holdings 19 Distinct Asset Categories* 46 Total Countries
Five Year Global Fixed Income18.249%
Treasury Inflation Protected Securities3.650%
Short Term Government5.840%
Two Year Global Fixed Income18.249%
Intermediate Government8.760%
One Year Fixed Income18.249%
US Micro Cap Portfolio2.625%
US Large Cap Value Portfolio5.250%
US Small Cap Value Portfolio4.375%
US Small Cap Portfolio2.625%
US Large Company Portfolio2.625%
Continental Small Company Portfolio0.240%
DFA Japan Small Co0.169%
Emerging Markets0.394%
Emerging Markets Small Cap Portfolio0.367%
Emerging Markets Value Portfolio0.367%
International Value III Portfolio2.250%
International Small Value Cap3.000% International Large Cap Portfolio
0.375%DFA Asia Pacific Small Company
0.097%
DFA United Kingdom Small Company0.150%
DFA Canadian Small Company0.094%
Money Market2.000%
*Asset Class of International Small comprised of 5 separate funds:Japan Small Co, continental Small Co, Canadian Small Co, Asia Pacific Small Co, and UK Small Co.

2
© 2005-13 McGriff Video Production, LLC., an Ohio limited liability company and a wholly-owned subsidiary of Matson Money, Inc. MPSv04162013_INC
INCOME & GROWTH COMPOSITE PERFORMANCE FOR 1997 TO 2012
Income & Growth Composite Income & Growth Composite contains all discretionary Income and Growth accounts that invest primarily in fixed income, are low risk, and have a time horizon of three years or less. For comparison purposes the composite is measured against a blend of the following indices; 65% Barclays Intermediate Government Credit Bond Index (1-10 year), 10% One Month T-Bills, 12.5% Standard & Poors 500 Index, 5% Russell 2000 Index, 7.5% MSCI EAFE Index (net div), calculated monthly, prior to 2009 the benchmark was calculated quarterly. Prior to June 30, 1996, the composite was measured against a different blend of indices, which was changed to more accurately represent the composite strategy. Additional information regarding the previous blended benchmark is available upon request. Beginning January 1, 1999, the minimum account size for this composite is $1000. Prior to 1999, the number of accounts included in the composite is reported as the number of client relationships. A client relationship may be comprised of multiple portfolios. From 1999 forward, the number of accounts reflects the total number of separate portfolios.
Matson Money, Inc. (“Matson”) is an independent SEC registered investment adviser. Matson Money is comprised of a bundled company retirement account platform and a standard fee only money management platform. The firm maintains a complete list and description of composites, which is available upon request.Matson Money, Inc. claims compliance with the Global Investment Performance Standards (GIPS®) and has prepared and presented this report in compliance with the GIPS standards. The firm was been independently verified for the periods October 1, 1991 through June 30, 1996 by Berge & Company CPAs. Matson Money, Inc. has been verified for the periods January 1, 1999 through December 31, 2012 by Ashland Partners & Company LLP.Verification assesses whether (1) the firm has complied with all the composite construction requirements of the GIPS standards on a firm-wide basis and (2) the firm’s policies and procedures are designed to calculate and present performance in compliance with the GIPS standards. The Income & Growth Composite has been examined for the periods January 1, 1999 through December 31, 2011. The verification and performance examination reports are available upon request.Results are based on fully discretionary accounts under management, including those accounts no longer with the firm. Beginning July, 1, 2002, composite policy requires the temporary removal of any portfolio incurring a client initiated significant cash inflow or outflow of 50% of portfolio’s beginning asset value. The temporary removal of such an account occurs at the beginning of the month in which the significant cash flow occurs and the account re-enters the composite the month after the cash flow. Additional information regarding the treatment of significant cash flows is available upon request. Past performance is not indicative of future results.The U.S. Dollar is the currency used to express performance. Returns are presented gross and net of management fees and include the reinvestment of all income. Net of fee performance was calculated using actual management fees. In addition to management fees and transaction costs, net of fee returns have been reduced by asset based custodial fees and other administrative fees. The annual composite dispersion presented is an asset-weighted standard deviation calculated for the accounts in the composite the entire year. Policies for valuing portfolios, calculating performance, and preparing compliant presentations are available upon request.The investment management fee schedule, under the private account asset allocation program, for the composite is 2% on the first $500 thousand, 1% on the next $500 thousand, 0.75% on the next $3 million, and 0.50% on the remainder. The investment management fee schedule, under the matson fund program, for the composite is in the range of 1.40% to 0.25%, of which Matson Money receives none of this fee under this program. Actual investment advisory fees incurred by clients may vary.Matson Money, Inc. changed its name from Abundance Technologies in December 2009. Furthermore, Abundance Technologies, Inc. changed its name from Matrix Asset Allocation in September 2001.Matson Money’s valuation policy materially differs from the recommended hierarchy in the GIPS Valuation Principles.The Income & Growth Composite was created October 1, 1992.The 2012 three year annualized standard deviation for the Income and Growth Composite Gross of Fees and Net Of Fees were 4.62% and 4.50% compared to the benchmarks standard deviation of 4.11%. The 2011 three year annualized standard deviation for the Income and Growth Composite Gross of Fees and Net Of Fees were 6.08% and 6.00% compared to the benchmarks standard deviation of 5.55%.
Year End Total FirmAssets
(millions) USD(millions)
Number of Accounts
% of Non-Fee-Paying
Composite Gross
Composite Net
Benchmark Composite Dispersion
2012 $3,599 $310 2,851 1.67% 6.10% 4.87% 6.69% 0.822%2011 $3,026 $251 2,349 1.14% 0.19% -1.01% 3.12% 0.231%2010 $2,904 $192 1,720 1.35% 7.38% 6.00% 8.00% 0.517%2009 $2,407 $100 937 1.07% 9.29% 7.80% 10.59% 0.784%2008 $1,922 $46 479 0.42% -7.78% -9.33% -7.34% 0.594%2007 $2,579 $28 297 0.02% 5.17% 3.40% 6.76% 0.387%2006 $2,180 $27 283 0.28% 8.60% 6.62% 7.94% 0.647%2005 $1,504 $21 253 0.31% 3.66% 1.68% 3.19% 0.277%2004 $1,043 $20 217 0.45% 6.36% 4.40% 5.91% 0.493%
2003 $709 $12 147 0.00% 11.84% 9.85% 11.44% 1.058%2002 $475 $10 104 0.00% 1.79% 0.04% 1.47% 0.768%2001 $482 $5 56 0.00% 3.57% 1.79% 3.60% 0.262%
2000 $432 $5 53 0.02% 4.72% 2.93% 4.61% 0.647%1999 $403 $7 64 0.39% 7.19% 5.83% 6.40% 0.705%1998 $332 $6 36 0.00% 7.85% 6.30% 11.50% 1.511%1997 $315 $12 22 0.00% 8.95% 7.42% 10.98% 0.729%
Annual Performance ResultsComposite Assets