portfolio cash flow real estate business plan
TRANSCRIPT

Portfolio Cash Flow Real Estate Business Plan
02 MAY 2015
STRICTLY PRIVATE AND CONFIDENTIAL
Executive Summary
Section Page
Executive Summary 2
Market Research 5
Business Model 14
Marketing Plan 21
Financial Projections 26
Management Profile, Sample Transactions 32
Operating Workflows Of The Fund 35
2

Executive Summary
• To purchase 100 single family homes during this unprecedented buying opportunity of the current real estate market;
• Average purchase price (including any rehabilitation):$45,000;
• Attract equity financing to fund those 100 homes - $4.5M;
• To achieve 90% occupancy rate;
• To sell at a net double within 7 years or sooner
Mission Of The Fund: To Take Advantage of Current Market Fluctuations to Purchase Strategically
Located, Distressed Properties to Create Current Investment Income & Future Appreciation
• The Fund will buy fix and hold single family homes in the Atlanta, GA area.
Main operating cash flows:
• Rent of property;
• Capital gain on future sale of acquired property.
Target Customer:
• Young professional, dual-income family with fairly good credit and income potential who will be good, long-term renters who pay on time.
• Main characteristics of targeted property: age: 5-11 years old, 3–4 bedrooms, purchase price (including any rehabilitation):$45,000.
Target Exit: Sell at a minimum of a net double in 7 years or less.
3
• The ability to acquire property at significant discounts;
• Experienced, professional management with proven systems;
• Strategic relationships with real estate professionals and financial institutions established;
• Experienced operations;
• Proven systems in place to keep costs contained and maximize efficiency.
Market research
Goals
-
1,000
2,000
3,000
4,000
5,000
6,000
7,000
8,000
9,000
1990 1995 2000 2005 2010 2015 2020 2025 2030 2035 2040
ARC's Population and Empoyment Forecasts 1990-2040, m
Population EmploymentSource: ARC
Fund profile
Strengths
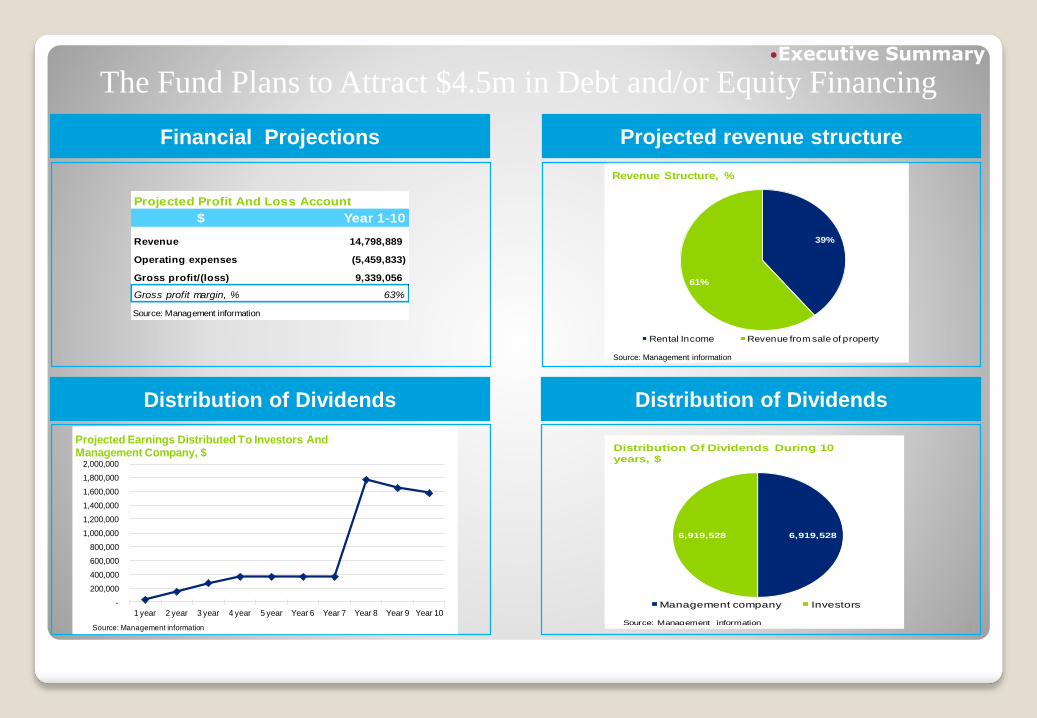
The Fund Plans to Attract $4.5m in Debt and/or Equity Financing
4
Financial Projections
Distribution of Dividends
-
200,000
400,000
600,000
800,000
1,000,000
1,200,000
1,400,000
1,600,000
1,800,000
2,000,000
1 year 2 year 3 year 4 year 5 year Year 6 Year 7 Year 8 Year 9 Year 10
Projected Earnings Distributed To Investors And Management Company, $
Source: Management information
Projected Profit And Loss Account
$ Year 1-10
Revenue 14,798,889
Operating expenses (5,459,833)
Gross profit/(loss) 9,339,056
Gross profit margin, % 63%
Source: Management information
Projected revenue structure
Distribution of Dividends
6,919,528 6,919,528
Distribution Of Dividends During 10
years, $
Management company Investors
Source: Management information
39%
61%
Revenue Structure, %
Rental Income Revenue from sale of property
Source: Management information
Executive Summary

Market ResearchSection Page
Executive Summary 2
Market Research 5
Business Model 14
Marketing Plan 21
Financial Projections 26
Management Profile, Sample Transactions 32
Operating Workflows Of The Fund 35
5
Subsections Page
Population 6
Atlanta Region 7
Clayton County, GA 8
Foreclosure 12
Market Analysis 13
Population
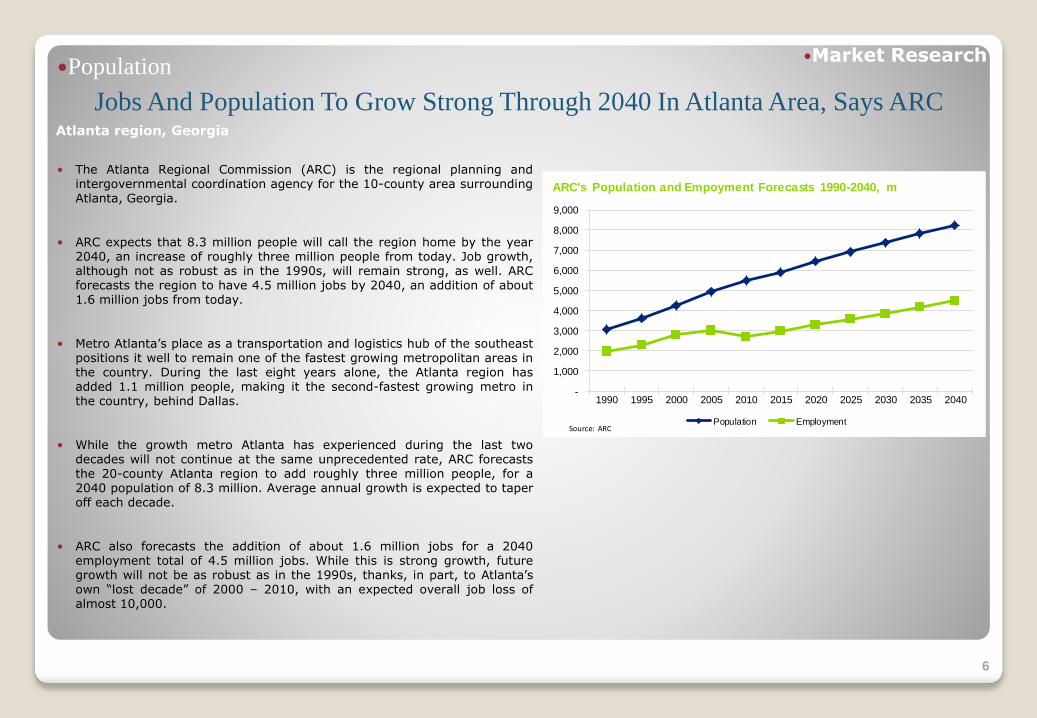
Jobs And Population To Grow Strong Through 2040 In Atlanta Area, Says ARCAtlanta region, Georgia
• The Atlanta Regional Commission (ARC) is the regional planning andintergovernmental coordination agency for the 10-county area surroundingAtlanta, Georgia.
• ARC expects that 8.3 million people will call the region home by the year2040, an increase of roughly three million people from today. Job growth,although not as robust as in the 1990s, will remain strong, as well. ARCforecasts the region to have 4.5 million jobs by 2040, an addition of about1.6 million jobs from today.
• Metro Atlanta’s place as a transportation and logistics hub of the southeastpositions it well to remain one of the fastest growing metropolitan areas inthe country. During the last eight years alone, the Atlanta region hasadded 1.1 million people, making it the second-fastest growing metro inthe country, behind Dallas.
• While the growth metro Atlanta has experienced during the last twodecades will not continue at the same unprecedented rate, ARC forecaststhe 20-county Atlanta region to add roughly three million people, for a2040 population of 8.3 million. Average annual growth is expected to taperoff each decade.
• ARC also forecasts the addition of about 1.6 million jobs for a 2040employment total of 4.5 million jobs. While this is strong growth, futuregrowth will not be as robust as in the 1990s, thanks, in part, to Atlanta’sown “lost decade” of 2000 – 2010, with an expected overall job loss ofalmost 10,000.
6
-
1,000
2,000
3,000
4,000
5,000
6,000
7,000
8,000
9,000
1990 1995 2000 2005 2010 2015 2020 2025 2030 2035 2040
ARC's Population and Empoyment Forecasts 1990-2040, m
Population EmploymentSource: ARC
Market Research
Atlanta Region
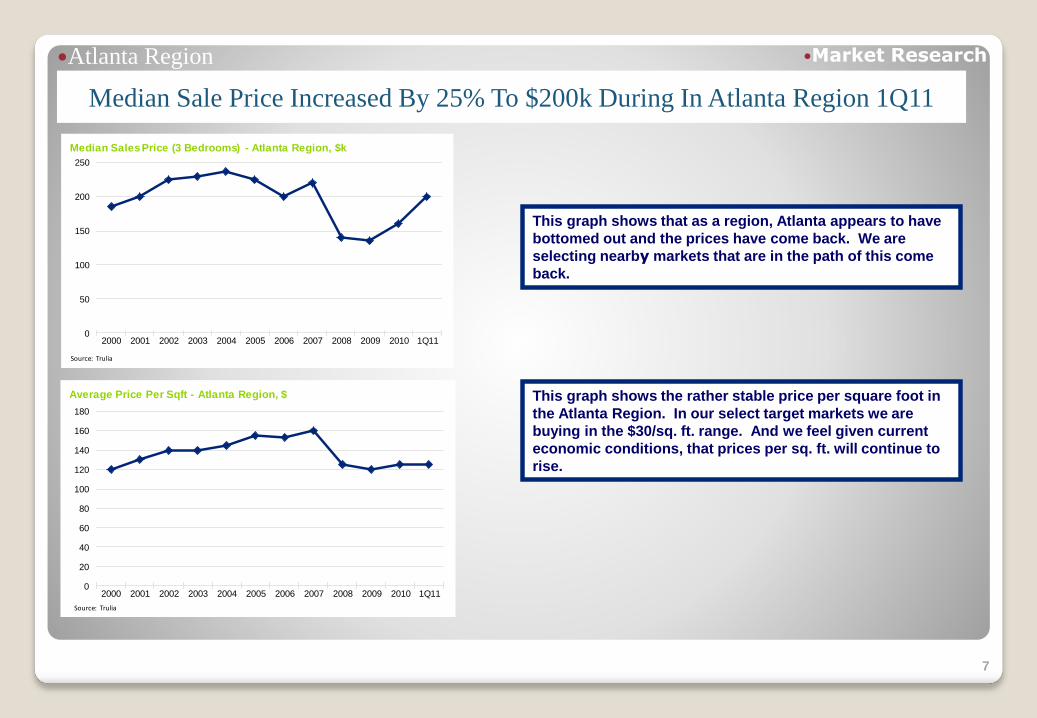
Median Sale Price Increased By 25% To $200k During In Atlanta Region 1Q11
7
0
50
100
150
200
250
2000 2001 2002 2003 2004 2005 2006 2007 2008 2009 2010 1Q11
Median Sales Price (3 Bedrooms) - Atlanta Region, $k
Source: Trulia
0
20
40
60
80
100
120
140
160
180
2000 2001 2002 2003 2004 2005 2006 2007 2008 2009 2010 1Q11
Average Price Per Sqft - Atlanta Region, $
Source: Trulia
This graph shows that as a region, Atlanta appears to have
bottomed out and the prices have come back. We are
selecting nearby markets that are in the path of this come
back.
This graph shows the rather stable price per square foot in
the Atlanta Region. In our select target markets we are
buying in the $30/sq. ft. range. And we feel given current
economic conditions, that prices per sq. ft. will continue to
rise.
Market Research

• Building permits are an excellent indicator of which way the market is headed and you can see a drastic drop on thisgraph. This means that the time to buy is now as virtually all the builders have left the market.
• Furthermore, the Atlanta Area was the most overbuilt area of the country in the peak real estate years. These twoingredients combined are what allow us to buy such young homes at such amazingly low prices.
Clayton County, Georgia
Leading Indicator Says Now Is The Time To Buy
8
-
20,000
40,000
60,000
80,000
100,000
120,000
140,000
160,000
-
500
1,000
1,500
2,000
2,500
3,000
2000 2001 2002 2003 2004 2005 2006 2007 2008 2009
Single-family new house construction building permits
Buildings Average costSource: city-data Clayton county
Market Research
Clayton County: One of The Smallest Counties Yet One of
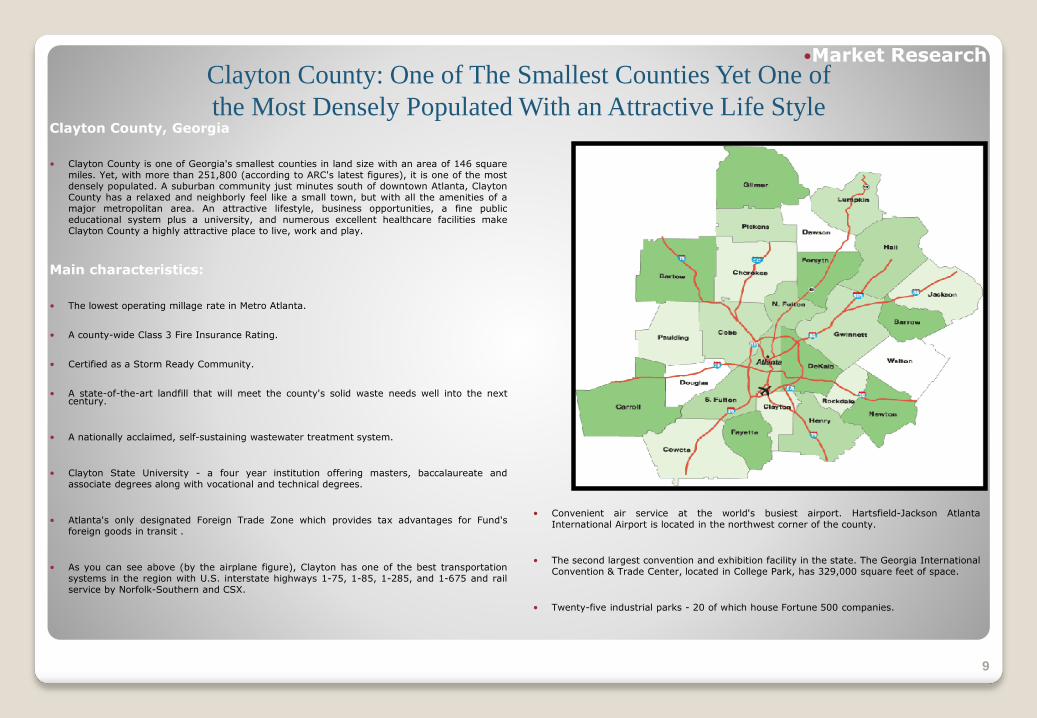
the Most Densely Populated With an Attractive Life Style Clayton County, Georgia
• Clayton County is one of Georgia's smallest counties in land size with an area of 146 squaremiles. Yet, with more than 251,800 (according to ARC's latest figures), it is one of the mostdensely populated. A suburban community just minutes south of downtown Atlanta, ClaytonCounty has a relaxed and neighborly feel like a small town, but with all the amenities of amajor metropolitan area. An attractive lifestyle, business opportunities, a fine publiceducational system plus a university, and numerous excellent healthcare facilities makeClayton County a highly attractive place to live, work and play.
Main characteristics:
• The lowest operating millage rate in Metro Atlanta.
• A county-wide Class 3 Fire Insurance Rating.
• Certified as a Storm Ready Community.
• A state-of-the-art landfill that will meet the county's solid waste needs well into the nextcentury.
• A nationally acclaimed, self-sustaining wastewater treatment system.
• Clayton State University - a four year institution offering masters, baccalaureate andassociate degrees along with vocational and technical degrees.
• Atlanta's only designated Foreign Trade Zone which provides tax advantages for Fund'sforeign goods in transit .
• As you can see above (by the airplane figure), Clayton has one of the best transportationsystems in the region with U.S. interstate highways 1-75, 1-85, 1-285, and 1-675 and railservice by Norfolk-Southern and CSX.
9
• Convenient air service at the world's busiest airport. Hartsfield-Jackson AtlantaInternational Airport is located in the northwest corner of the county.
• The second largest convention and exhibition facility in the state. The Georgia InternationalConvention & Trade Center, located in College Park, has 329,000 square feet of space.
• Twenty-five industrial parks - 20 of which house Fortune 500 companies.
Market Research

Clayton, Georgia
In 2010 Median Rental Rate Was $955 In Clayton County, Georgia
10
Our target rent is $795. By charging below market rent, we are able to occupy our units faster and command longer term leases. This reduces turnover and vacancy, which are the two biggest expenses for a landlord. The bottom line is we offer the most desired product, i.e. 3-4 bedroom young homes vs. apartments, condos or older homes. And we do it with below market rents so we have the pick of the best applicants in the area.
Note that the ratio of rent to value is far better in Clayton than inGeorgia and the US. And we buy far better than the median($123,000 vs. $45,000), giving us a far better ratio.
Household Income Statistics
2010 Household Income Statistics Clayton, GA GeorgiaUnited
States
Median Household Income $44,312 $52,162 $55,970
Average Household Income $58,951 $68,786 $74,974
Per Capita Household Income $24,348 $25,714 $28,779
Source: CLRSearch.com
Home Values and Rental
2010 Homeowner Statistics
and Home ValuesClayton, GA Georgia
United
States
Median Value Households $123,327 $169,802 $177,046
Median Rent $955 $927 $950
Source: CLRSearch.com
Owner
Market Research
Clayton, Georgia/Foreclosure
The Target Market Is Strategically Situated
11
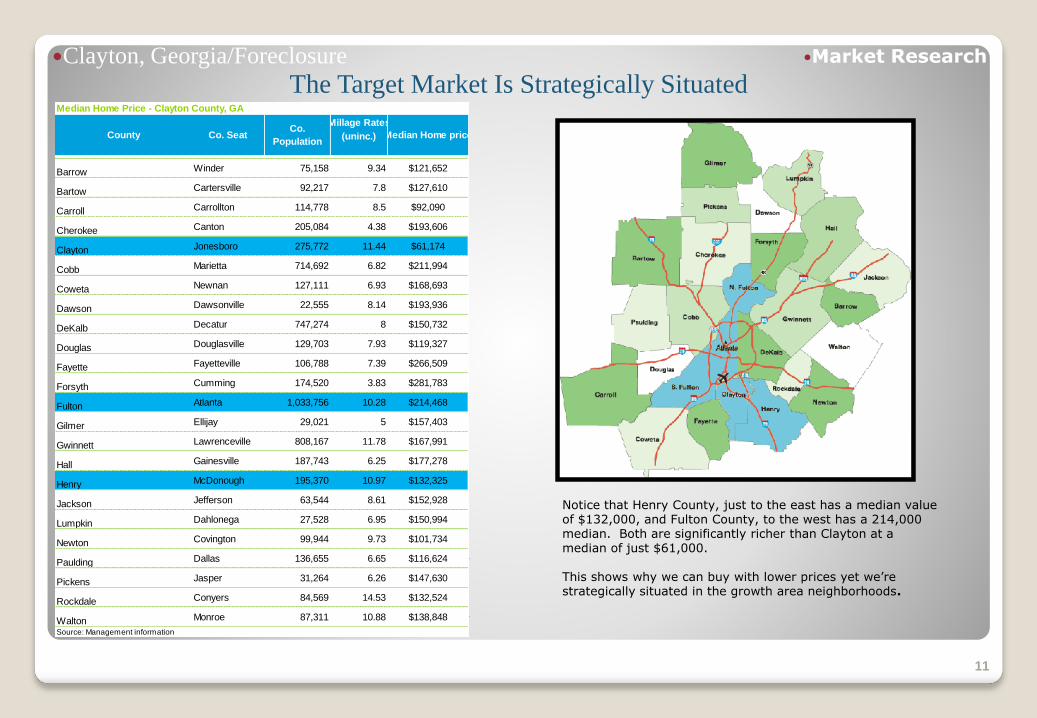
Median Home Price - Clayton County, GA
Millage Rates
(uninc.)
Source: Management information
Rockdale Conyers 84,569 14.53 $132,524
Walton Monroe 87,311 10.88 $138,848
Paulding Dallas 136,655 6.65 $116,624
Pickens Jasper 31,264 6.26 $147,630
Lumpkin Dahlonega 27,528 6.95 $150,994
Newton Covington 99,944 9.73 $101,734
Henry McDonough 195,370 10.97 $132,325
Jackson Jefferson 63,544 8.61 $152,928
Gwinnett Lawrenceville 808,167 11.78 $167,991
Hall Gainesville 187,743 6.25 $177,278
Fulton Atlanta 1,033,756 10.28 $214,468
Gilmer Ellijay 29,021 5 $157,403
Fayette Fayetteville 106,788 7.39 $266,509
Forsyth Cumming 174,520 3.83 $281,783
DeKalb Decatur 747,274 8 $150,732
Douglas Douglasville 129,703 7.93 $119,327
Coweta Newnan 127,111 6.93 $168,693
Dawson Dawsonville 22,555 8.14 $193,936
Clayton Jonesboro 275,772 11.44 $61,174
Cobb Marietta 714,692 6.82 $211,994
Carroll Carrollton 114,778 8.5 $92,090
Cherokee Canton 205,084 4.38 $193,606
$121,652
Bartow Cartersville 92,217 7.8 $127,610
County Co. SeatCo.
Population
Barrow Winder 75,158 9.34
Median Home price
Notice that Henry County, just to the east has a median value of $132,000, and Fulton County, to the west has a 214,000 median. Both are significantly richer than Clayton at a median of just $61,000.
This shows why we can buy with lower prices yet we’re strategically situated in the growth area neighborhoods.
Market Research
Foreclosure
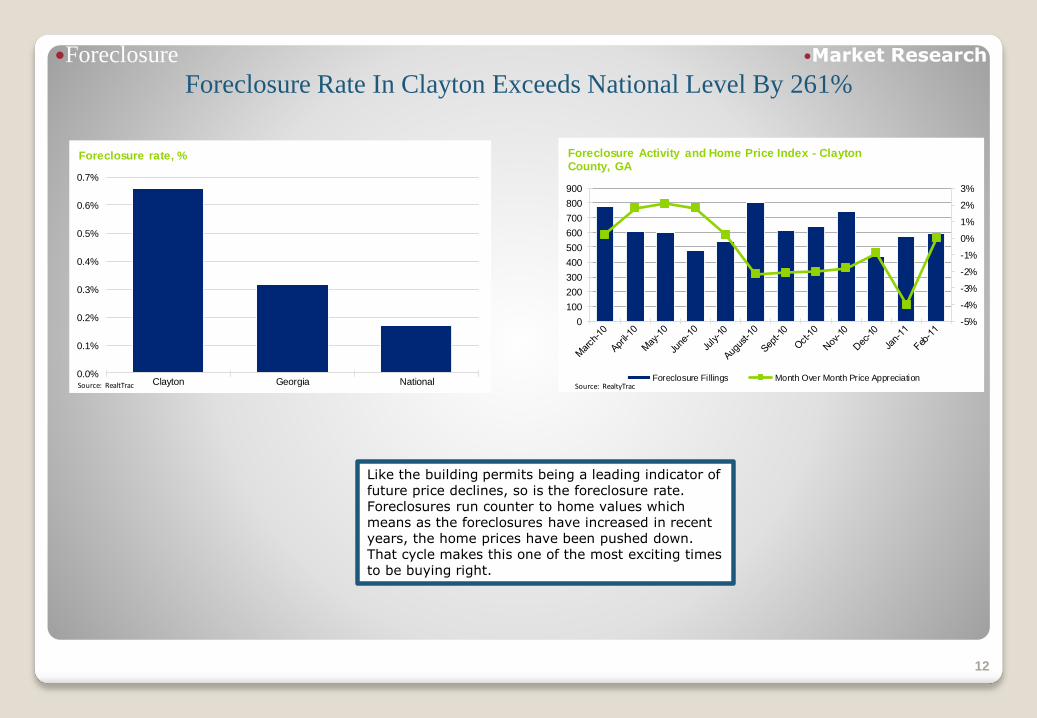
Foreclosure Rate In Clayton Exceeds National Level By 261%
12
0.0%
0.1%
0.2%
0.3%
0.4%
0.5%
0.6%
0.7%
Clayton Georgia National
Foreclosure rate, %
Source: RealtTrac
-5%
-4%
-3%
-2%
-1%
0%
1%
2%
3%
0
100
200
300
400
500
600
700
800
900
Foreclosure Activity and Home Price Index - Clayton County, GA
Foreclosure Fillings Month Over Month Price AppreciationSource: RealtyTrac
Like the building permits being a leading indicator of future price declines, so is the foreclosure rate. Foreclosures run counter to home values which means as the foreclosures have increased in recent years, the home prices have been pushed down. That cycle makes this one of the most exciting times to be buying right.
Market Research

Market analysisThe Market Is Made Up Of Weak Competition
13
Small “Mom and Pop” InvestorsOur main competition comes from individual investors with limited resources and extremely limited experience. They are basically “Mom and Pop” investors. All they know is that prices are good and that real estate is “on sale right now” so they want to buy some.
They buy without a long-term strategic plan and tend to be poor managers and as we know, good management is the key to long-term profitability and appreciation.
Fix and FlipThere are those who think you can still be profitable at the “buy, fix and flip” model. HomeVestors of America, is an example of this business model. They are one of the largest buyers of houses in the U.S. with 200 franchisees in 33 states.
However this business model tends to buy older homes that need far more rehab. Thus, they really do not compete in our target market.
Out of Area InvestorsWe’ve seen some out of state investors buying properties in our target market because of the low prices. But they have no trusted contacts that are local experts to find, fix and manage long-term.
This results in a failed business model and they retreat to their original market and leave many homes boarded up and vacant.
Market Research
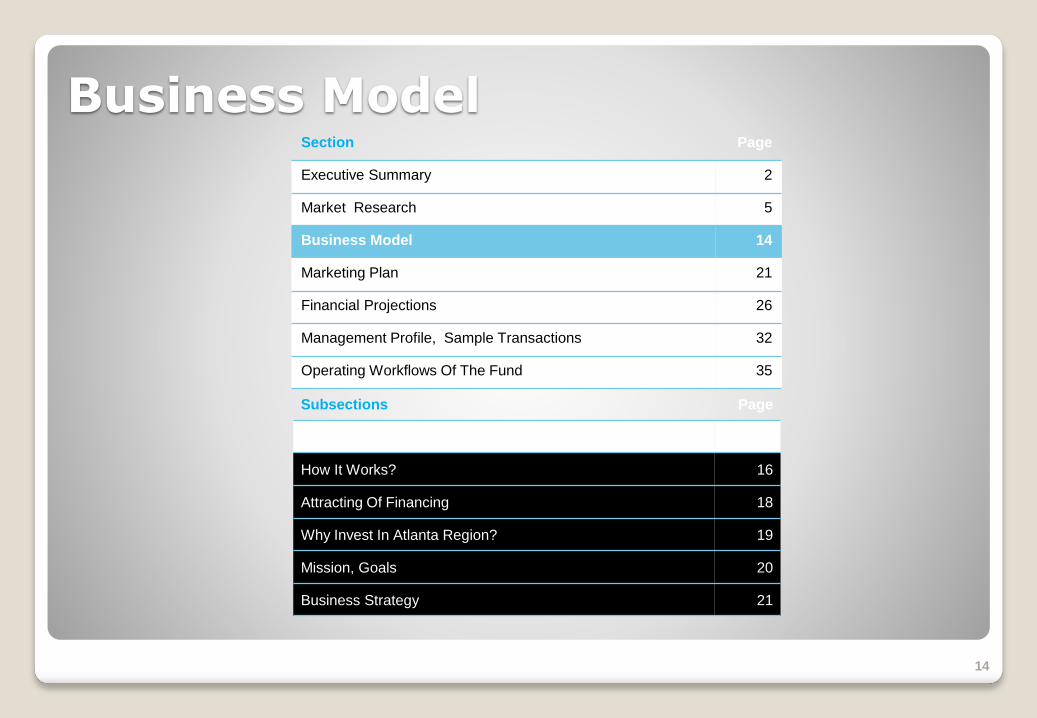
Business ModelSection Page
Executive Summary 2
Market Research 5
Business Model 14
Marketing Plan 21
Financial Projections 26
Management Profile, Sample Transactions 32
Operating Workflows Of The Fund 35
14
Subsections Page
Fund Profile 15
How It Works? 16
Attracting Of Financing 18
Why Invest In Atlanta Region? 19
Mission, Goals 20
Business Strategy 21
Fund profile The Fund Will Buy Strategically Located, Young Single
Family Homes, Far Below Replacement Cost, Rent Below Market
With Superior Management For Cash Flow And Capital Gains
15
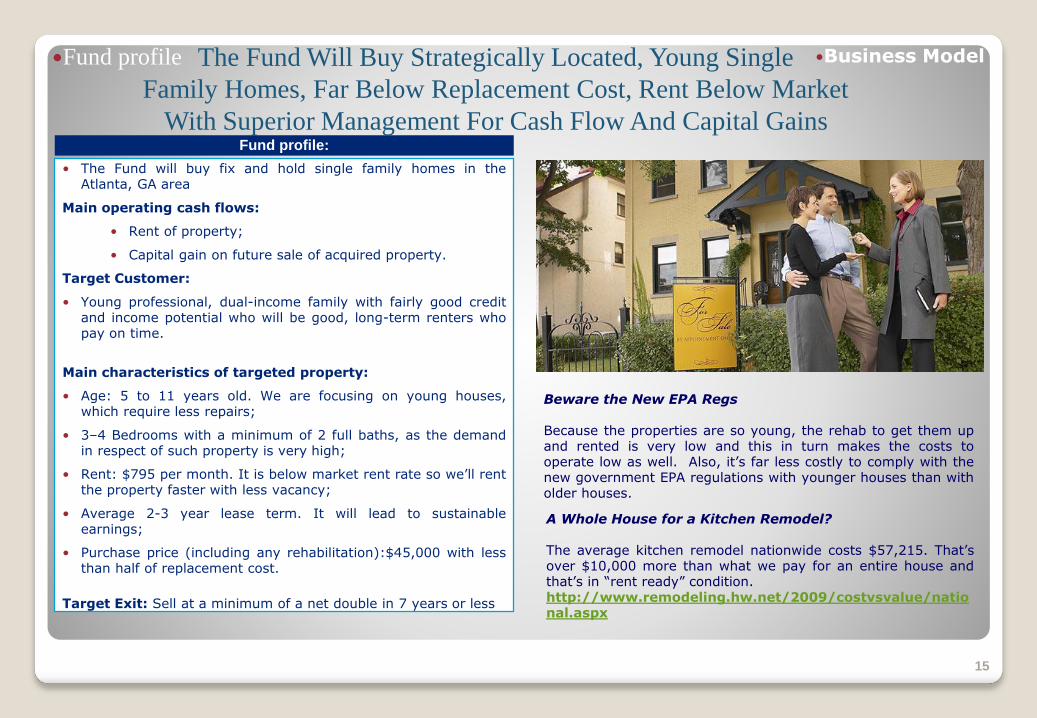
• The Fund will buy fix and hold single family homes in theAtlanta, GA area
Main operating cash flows:
• Rent of property;
• Capital gain on future sale of acquired property.
Target Customer:
• Young professional, dual-income family with fairly good creditand income potential who will be good, long-term renters whopay on time.
Main characteristics of targeted property:
• Age: 5 to 11 years old. We are focusing on young houses,which require less repairs;
• 3–4 Bedrooms with a minimum of 2 full baths, as the demandin respect of such property is very high;
• Rent: $795 per month. It is below market rent rate so we’ll rentthe property faster with less vacancy;
• Average 2-3 year lease term. It will lead to sustainableearnings;
• Purchase price (including any rehabilitation):$45,000 with lessthan half of replacement cost.
Target Exit: Sell at a minimum of a net double in 7 years or less
Fund profile:
Beware the New EPA Regs
Because the properties are so young, the rehab to get them upand rented is very low and this in turn makes the costs tooperate low as well. Also, it’s far less costly to comply with thenew government EPA regulations with younger houses than witholder houses.
A Whole House for a Kitchen Remodel?
The average kitchen remodel nationwide costs $57,215. That’sover $10,000 more than what we pay for an entire house andthat’s in “rent ready” condition.http://www.remodeling.hw.net/2009/costvsvalue/national.aspx
Business Model

How it Works The Fund Will Buy Strategically Located, Young Single
Family Homes, Far Below Replacement Cost, Rent Below Market
With Superior Management for Cash Flow and Capital Gains
16
How it works?
Analysis of expected CF in respect of property acquisition
Rehabbing properties Rent
Legal counsel will be engaged in all stages of operational workflows, except preparation of financial projections.
Selling properties
Financing
Business Model

How it Works The Fund Will Buy Strategically Located, Young Single
Family Homes, Far Below Replacement Cost, Rent Below Market
With Superior Management for Cash Flow and Capital Gains
17
Each investment in property will be assessed using the following formulas:
Cap rate = Net Operating Income(NOI)/Purchase PriceCash on Cash Return = (NOI - P&I payment)/(Acquisition costs + down payment)
Targets:Cap rate > 7% Cash on Cash Return >15%
Analysis of expected CF in respect of property acquisition:
Operating activity of the Fund will be financed by private investors.
It will be done on a one for one basis. “One for one” refers to one investor for one property. “Pooled” refers to lots of different investors pooling their money into one pot and then the pot makes the investment.
Financing:
The Fund's approach to rehabbing properties starts when the property is initially considered for purchase. Each property will have a physical inspection by management, professional property inspector (if necessary) or our strategic contractor(s). At that time cost estimates for all repairs will be determined and based on the results of inspection, the purchase price may be renegotiated.Rehabbing will be outsourced to well-known, certified service providers.
Rehabbing properties:
Properties will be marketed through Real estate agents who will provide a discounted fee as a result of strategic relationships. In addition, we also actively market the property through local newspaper and Internet advertising, along with placing signage on the property and accessing a database of active buyers.
Selling properties:
The Fund will receive rents on the properties during the 7 years after acquisition. Properties will be rented through a proven systematic process:
• Multiple Listing Services
• Strategically placed signs
• Proprietary websites
• Internet listings
• Local business bulletin boards
• Current tenant referral programs
Rent:
Business Model
Attracting of Financing
The Fund Will Attract Debt and/or Equity Financing on a Project Basis
18
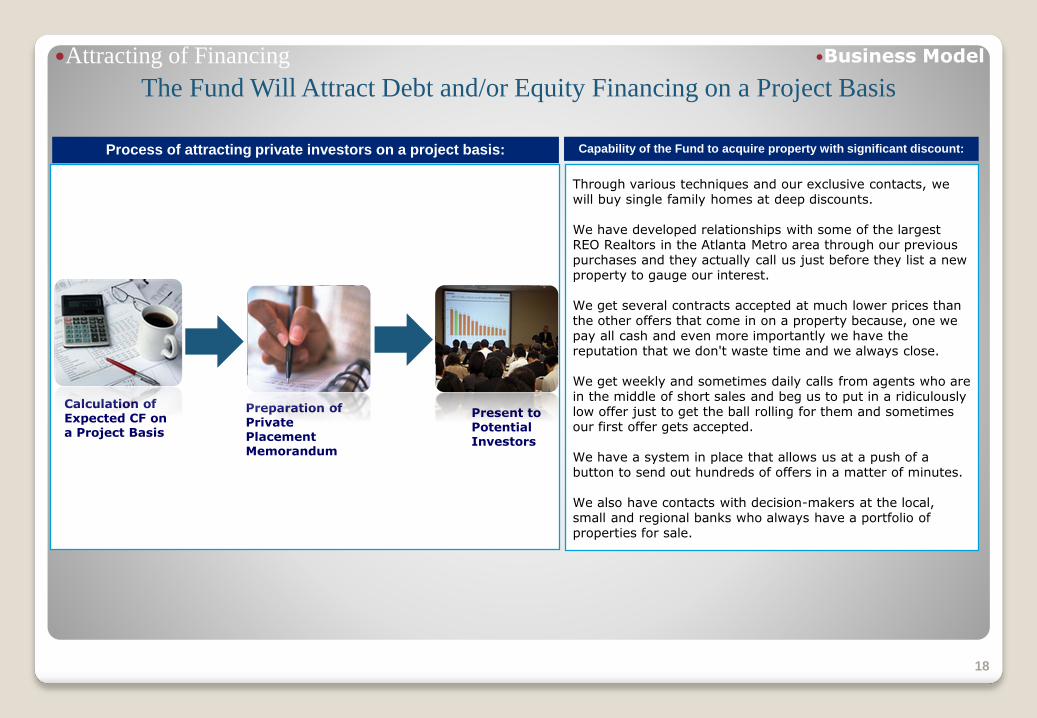
Process of attracting private investors on a project basis:
Calculation of Expected CF on a Project Basis
Preparation of Private Placement Memorandum
Present to Potential Investors
Through various techniques and our exclusive contacts, we will buy single family homes at deep discounts.
We have developed relationships with some of the largest REO Realtors in the Atlanta Metro area through our previous purchases and they actually call us just before they list a new property to gauge our interest.
We get several contracts accepted at much lower prices than the other offers that come in on a property because, one we pay all cash and even more importantly we have the reputation that we don't waste time and we always close.
We get weekly and sometimes daily calls from agents who are in the middle of short sales and beg us to put in a ridiculously low offer just to get the ball rolling for them and sometimes our first offer gets accepted.
We have a system in place that allows us at a push of a button to send out hundreds of offers in a matter of minutes.
We also have contacts with decision-makers at the local, small and regional banks who always have a portfolio of properties for sale.
Capability of the Fund to acquire property with significant discount:
Business Model
Why Invest in the Atlanta Region?
19
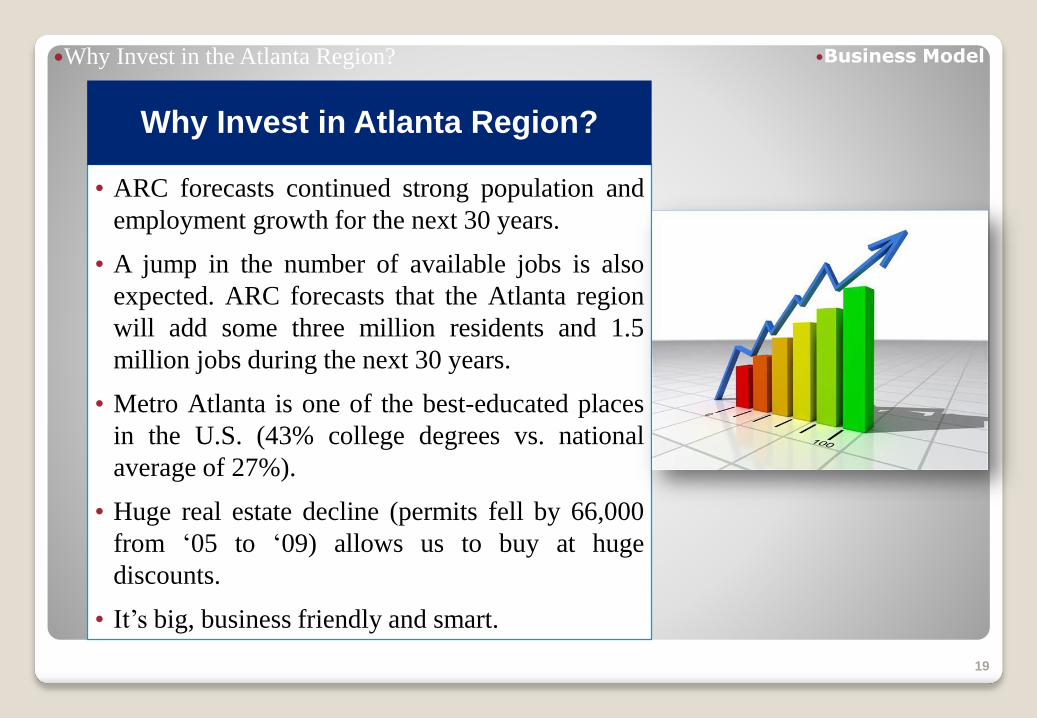
• ARC forecasts continued strong population and
employment growth for the next 30 years.
• A jump in the number of available jobs is also
expected. ARC forecasts that the Atlanta region
will add some three million residents and 1.5
million jobs during the next 30 years.
• Metro Atlanta is one of the best-educated places
in the U.S. (43% college degrees vs. national
average of 27%).
• Huge real estate decline (permits fell by 66,000
from ‘05 to ‘09) allows us to buy at huge
discounts.
• It’s big, business friendly and smart.
Why Invest in Atlanta Region?
Business Model

Mission, Goals
20
• Mission of the Fund: To Take Advantage of Current Market Fluctuations to PurchaseStrategically Located, Distressed Properties to Create Current Investment Income & FutureAppreciation
Mission
Goals
• To purchase 100 single family homes during this unprecedented buying opportunity of thecurrent real estate market.
• Average purchase price (including any rehabilitation):$45,000
• Attract equity financing to fund those 100 homes - $4.5M
• To achieve 90% occupancy rate;
• To sell at a net double within 7 years or sooner
• Continue to build strong partnerships with key real property professionals, financialinstitutions, law firms, contractors and others
Business Model
Marketing PlanSection Page
Executive Summary 2
Market Research 5
Business Model 14
Marketing Plan 21
Financial Projections 26
Management Profile, Sample Transactions 32
Operating Workflows Of The Fund 35
21
Subsections Page
Pricing Strategy 22
Five Forces Analysis 23
SWOT Analysis 24
Marketing Objectives, Strategy, Mix 25
Marketing Mix 26

Pricing Strategy
The Fund Will Maximize the Monthly Cash Flow
While Supporting the Long Term Appreciation
22
• Use strategic relationships and systems to buy below replacement cost
• Buy young properties that will need minimal rehab and minimal time
• Buy what is in high demand (i.e. 3-4 bedrooms, 2 baths)
• Get houses to market quickly
Acquisition
Objectives
Rental Pricing
Strategy• Price our rent below market value so it gets occupied quicker with longer
lease terms
• Build in back end profit when we buy at a great discount
• Keep properties well maintained by continually monitoring them
Maximize
Appreciation
Marketing Plan

SWOT Analysis
Cash Flow Real Estate Has High Growth Potential Given Current Market Conditions
23
• The ability to acquire property at significant discounts;
• Experienced, professional management with proven systems;
• Strategic relationships with real estate professionals and financialinstitutions established;
• Experienced operations;
• Proven systems in place to keep costs contained and maximize efficiency;
• Buying with all cash allows us to drop rent price if necessary.
• Too many properties and not enough money to buy them all;
• Maximum property acquisition is around 10-15 houses per month
• Continued economic slowdown (e.g. 20% unemployment and 30%inflation) could have an adverse impact on the ability to collect rent.
• Foreclosure techniques;
• Great time to invest in real estate at the bottom;
• Huge increase in capital gain is expected in Clayton County;
• Further service/market development is available;
• Further geographical expansion is available;
• If current market trends drive house prices lower, we can buy even better.
Strengths Weaknesses
Opportunities Threats
Business Model
Marketing Mix
Proven Marketing Techniques Work Every Time
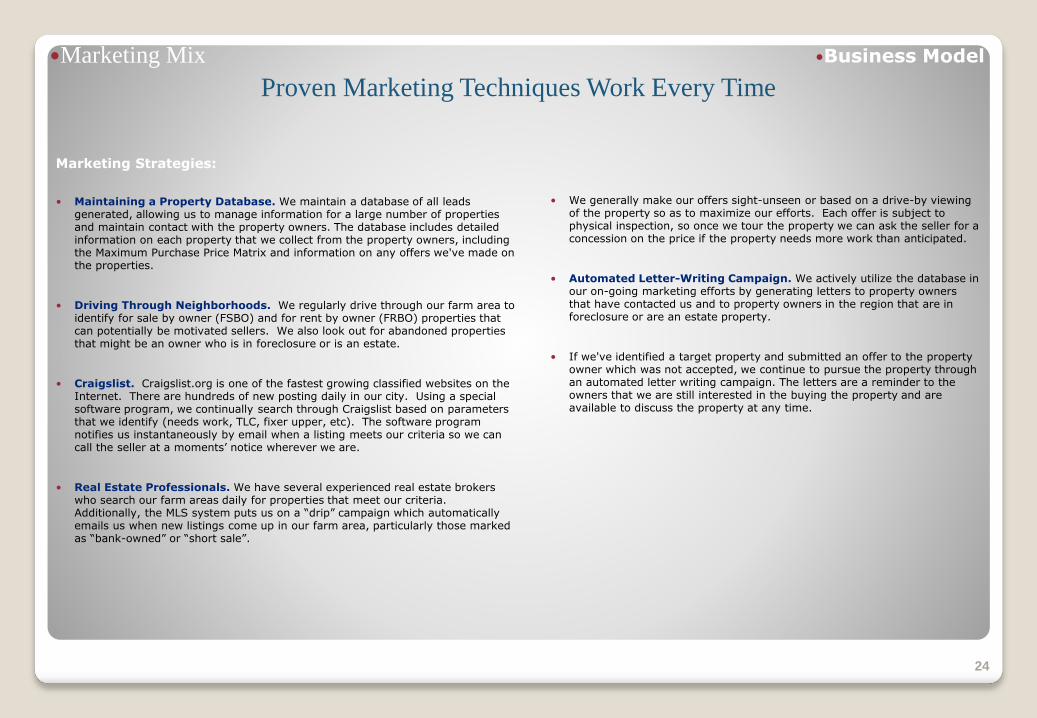
Marketing Strategies:
• Maintaining a Property Database. We maintain a database of all leads generated, allowing us to manage information for a large number of properties and maintain contact with the property owners. The database includes detailed information on each property that we collect from the property owners, including the Maximum Purchase Price Matrix and information on any offers we've made on the properties.
• Driving Through Neighborhoods. We regularly drive through our farm area to identify for sale by owner (FSBO) and for rent by owner (FRBO) properties that can potentially be motivated sellers. We also look out for abandoned properties that might be an owner who is in foreclosure or is an estate.
• Craigslist. Craigslist.org is one of the fastest growing classified websites on the Internet. There are hundreds of new posting daily in our city. Using a special software program, we continually search through Craigslist based on parameters that we identify (needs work, TLC, fixer upper, etc). The software program notifies us instantaneously by email when a listing meets our criteria so we can call the seller at a moments’ notice wherever we are.
• Real Estate Professionals. We have several experienced real estate brokers who search our farm areas daily for properties that meet our criteria. Additionally, the MLS system puts us on a “drip” campaign which automatically emails us when new listings come up in our farm area, particularly those marked as “bank-owned” or “short sale”.
24
• We generally make our offers sight-unseen or based on a drive-by viewing of the property so as to maximize our efforts. Each offer is subject to physical inspection, so once we tour the property we can ask the seller for a concession on the price if the property needs more work than anticipated.
• Automated Letter-Writing Campaign. We actively utilize the database in our on-going marketing efforts by generating letters to property owners that have contacted us and to property owners in the region that are in foreclosure or are an estate property.
• If we've identified a target property and submitted an offer to the property owner which was not accepted, we continue to pursue the property through an automated letter writing campaign. The letters are a reminder to the owners that we are still interested in the buying the property and are available to discuss the property at any time.
Business Model
Marketing Mix
Proven Marketing Techniques Work Every Time
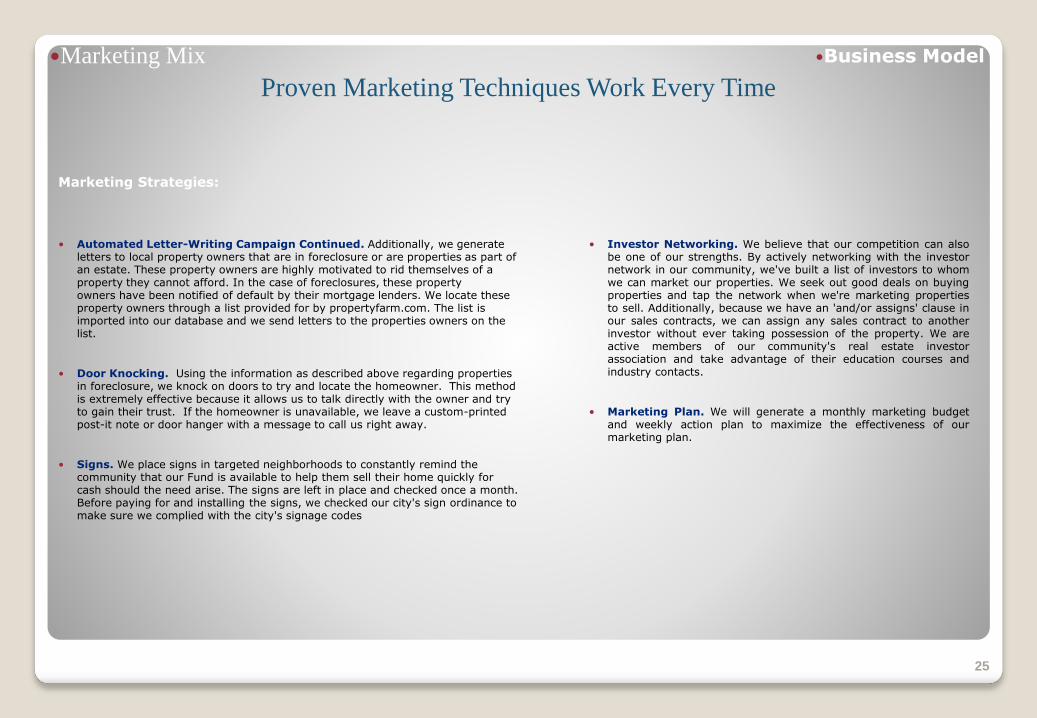
Marketing Strategies:
• Automated Letter-Writing Campaign Continued. Additionally, we generate letters to local property owners that are in foreclosure or are properties as part of an estate. These property owners are highly motivated to rid themselves of a property they cannot afford. In the case of foreclosures, these property owners have been notified of default by their mortgage lenders. We locate these property owners through a list provided for by propertyfarm.com. The list is imported into our database and we send letters to the properties owners on the list.
• Door Knocking. Using the information as described above regarding properties in foreclosure, we knock on doors to try and locate the homeowner. This method is extremely effective because it allows us to talk directly with the owner and try to gain their trust. If the homeowner is unavailable, we leave a custom-printed post-it note or door hanger with a message to call us right away.
• Signs. We place signs in targeted neighborhoods to constantly remind the community that our Fund is available to help them sell their home quickly for cash should the need arise. The signs are left in place and checked once a month. Before paying for and installing the signs, we checked our city's sign ordinance to make sure we complied with the city's signage codes
25
• Investor Networking. We believe that our competition can alsobe one of our strengths. By actively networking with the investornetwork in our community, we've built a list of investors to whomwe can market our properties. We seek out good deals on buyingproperties and tap the network when we're marketing propertiesto sell. Additionally, because we have an 'and/or assigns' clause inour sales contracts, we can assign any sales contract to anotherinvestor without ever taking possession of the property. We areactive members of our community's real estate investorassociation and take advantage of their education courses andindustry contacts.
• Marketing Plan. We will generate a monthly marketing budgetand weekly action plan to maximize the effectiveness of ourmarketing plan.
Business Model
Financial ProjectionsSection Page
Executive Summary 2
Market Research 5
Business Model 14
Marketing Plan 21
Financial Projections 26
Management Profile, Sample Transactions 32
Operating Workflows Of The Fund 35
26
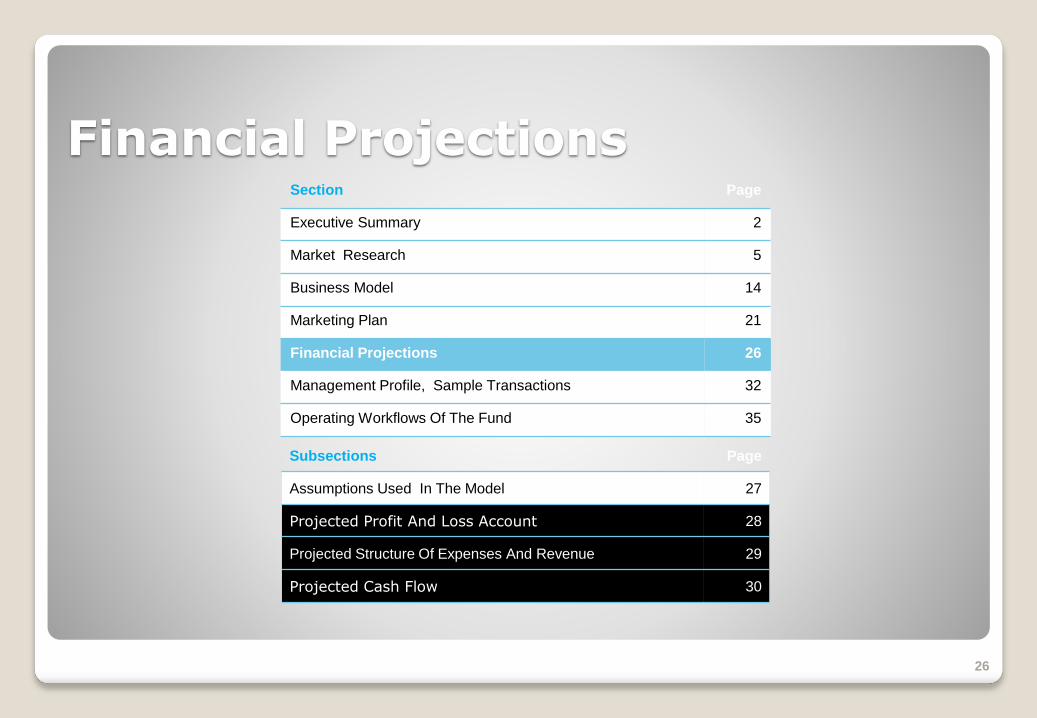
Subsections Page
Assumptions Used In The Model 27
Projected Profit And Loss Account 28
Projected Structure Of Expenses And Revenue 29
Projected Cash Flow 30
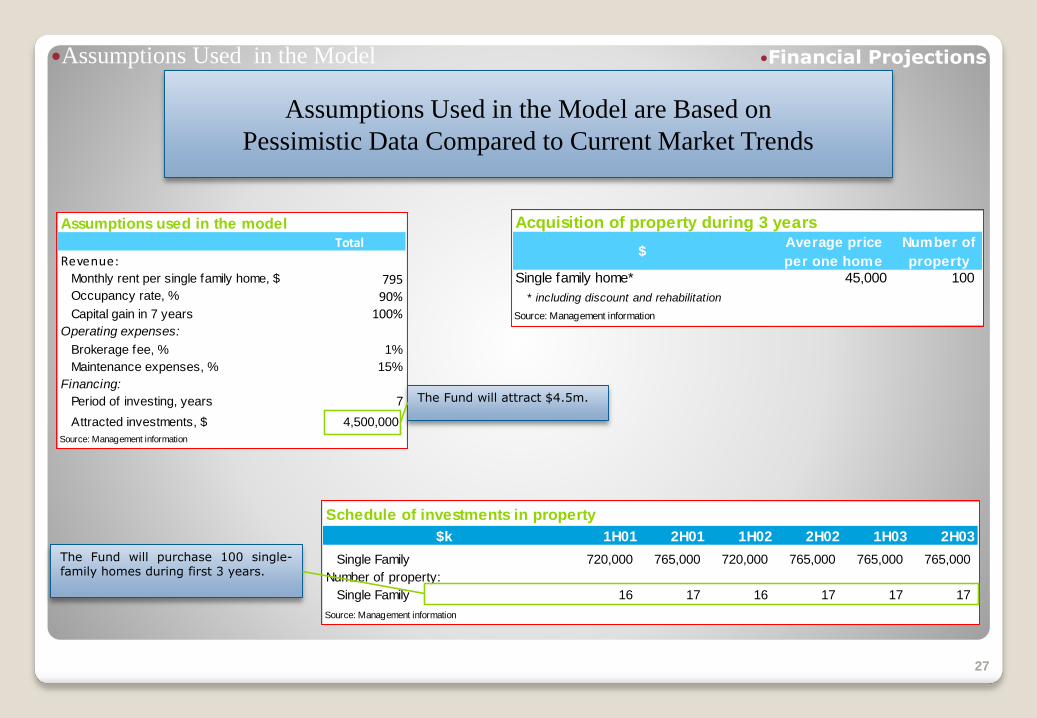
Acquisition of property during 3 years
$Average price
per one home
Number of
property
Single family home* 45,000 100
* including discount and rehabilitation
Source: Management information
Assumptions Used in the Model
Assumptions Used in the Model are Based on
Pessimistic Data Compared to Current Market Trends
27
The Fund will purchase 100 single-family homes during first 3 years.
Assumptions used in the model
Total
Revenue:Monthly rent per single family home, $ 795 Occupancy rate, % 90%
Capital gain in 7 years 100%Operating expenses:
Brokerage fee, % 1%
Maintenance expenses, % 15%
Financing:
Period of investing, years 7
Attracted investments, $ 4,500,000
Source: Management information
The Fund will attract $4.5m.
Schedule of investments in property
$k 1H01 2H01 1H02 2H02 1H03 2H03
Single Family 720,000 765,000 720,000 765,000 765,000 765,000
Number of property:
Single Family 16 17 16 17 17 17
Source: Management information
Financial Projections
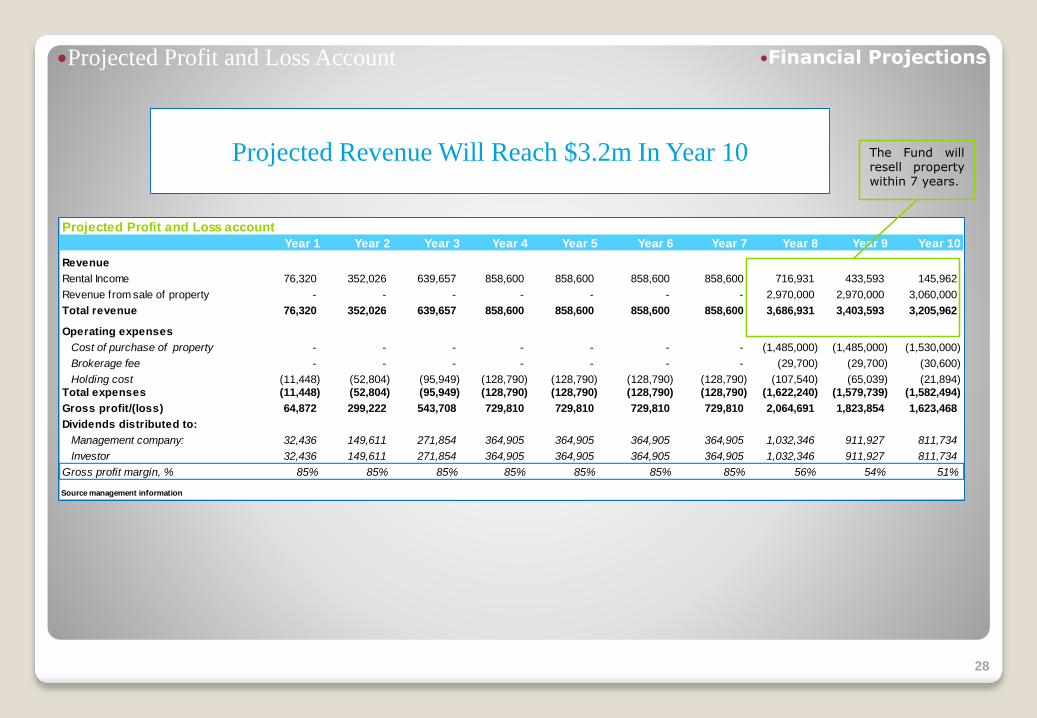
Projected Profit and Loss account
Year 1 Year 2 Year 3 Year 4 Year 5 Year 6 Year 7 Year 8 Year 9 Year 10
Revenue
Rental Income 76,320 352,026 639,657 858,600 858,600 858,600 858,600 716,931 433,593 145,962
Revenue from sale of property - - - - - - - 2,970,000 2,970,000 3,060,000
Total revenue 76,320 352,026 639,657 858,600 858,600 858,600 858,600 3,686,931 3,403,593 3,205,962
Operating expenses
Cost of purchase of property - - - - - - - (1,485,000) (1,485,000) (1,530,000)
Brokerage fee - - - - - - - (29,700) (29,700) (30,600)
Holding cost (11,448) (52,804) (95,949) (128,790) (128,790) (128,790) (128,790) (107,540) (65,039) (21,894)
Total expenses (11,448) (52,804) (95,949) (128,790) (128,790) (128,790) (128,790) (1,622,240) (1,579,739) (1,582,494)
Gross profit/(loss) 64,872 299,222 543,708 729,810 729,810 729,810 729,810 2,064,691 1,823,854 1,623,468
Dividends distributed to:
Management company: 32,436 149,611 271,854 364,905 364,905 364,905 364,905 1,032,346 911,927 811,734
Investor 32,436 149,611 271,854 364,905 364,905 364,905 364,905 1,032,346 911,927 811,734
Gross profit margin, % 85% 85% 85% 85% 85% 85% 85% 56% 54% 51%
Source management information
Projected Profit and Loss Account
Projected Revenue Will Reach $3.2m In Year 10
28
The Fund willresell propertywithin 7 years.
Financial Projections
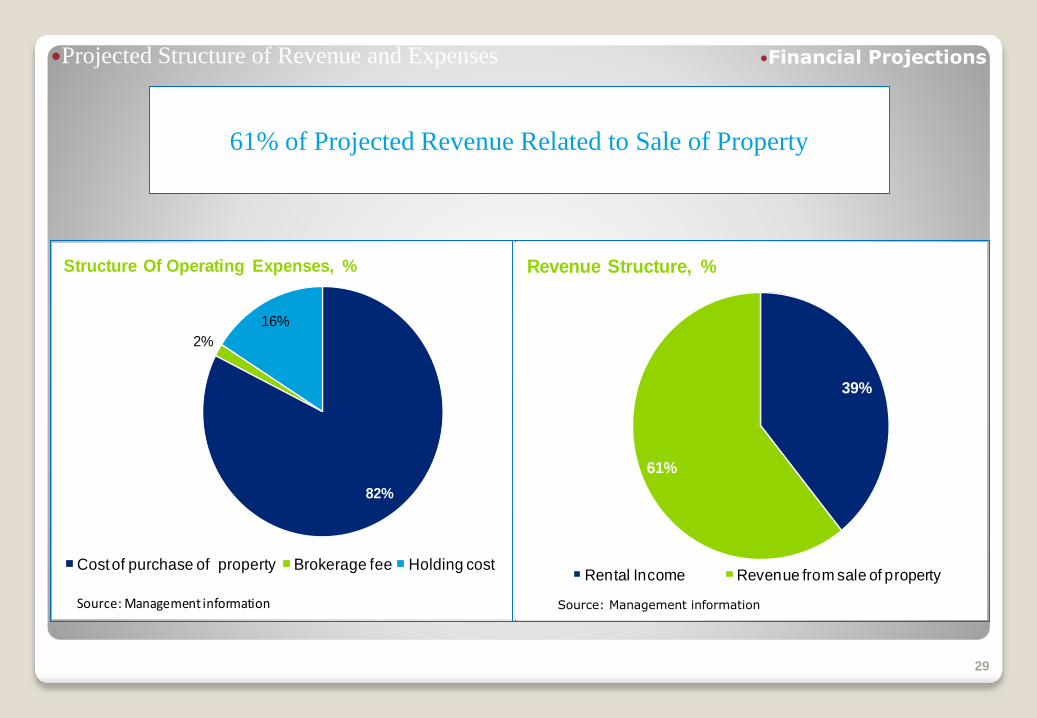
Projected Structure of Revenue and Expenses
61% of Projected Revenue Related to Sale of Property
29
Source: Management information82%
2%
16%
Structure Of Operating Expenses, %
Cost of purchase of property Brokerage fee Holding cost
Source: Management information
39%
61%
Revenue Structure, %
Rental Income Revenue from sale of property
Source: Management information
Financial Projections
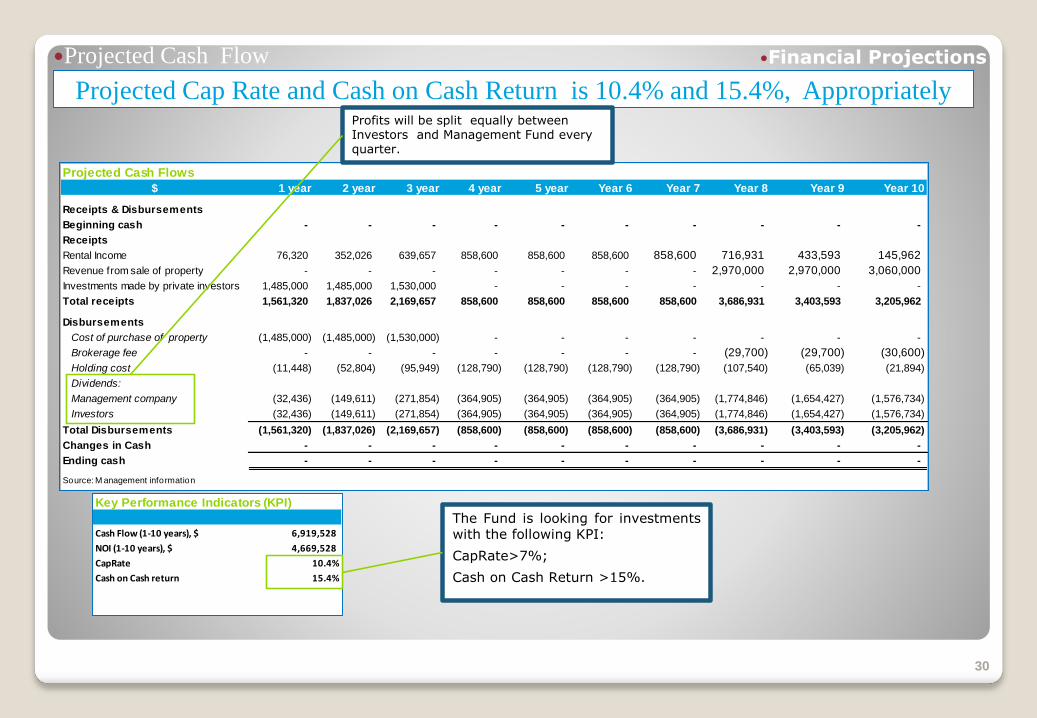
Key Performance Indicators (KPI)
Cash Flow (1-10 years), $ 6,919,528
NOI (1-10 years), $ 4,669,528
CapRate 10.4%
Cash on Cash return 15.4%
Projected Cash Flow
Projected Cap Rate and Cash on Cash Return is 10.4% and 15.4%, Appropriately
30
The Fund is looking for investmentswith the following KPI:
CapRate>7%;
Cash on Cash Return >15%.
Projected Cash Flows
$ 1 year 2 year 3 year 4 year 5 year Year 6 Year 7 Year 8 Year 9 Year 10
Receipts & Disbursements
Beginning cash - - - - - - - - - -
Receipts
Rental Income 76,320 352,026 639,657 858,600 858,600 858,600 858,600 716,931 433,593 145,962
Revenue from sale of property - - - - - - - 2,970,000 2,970,000 3,060,000
Investments made by private investors 1,485,000 1,485,000 1,530,000 - - - - - - -
Total receipts 1,561,320 1,837,026 2,169,657 858,600 858,600 858,600 858,600 3,686,931 3,403,593 3,205,962
Disbursements
Cost of purchase of property (1,485,000) (1,485,000) (1,530,000) - - - - - - -
Brokerage fee - - - - - - - (29,700) (29,700) (30,600)
Holding cost (11,448) (52,804) (95,949) (128,790) (128,790) (128,790) (128,790) (107,540) (65,039) (21,894)
Dividends:
Management company (32,436) (149,611) (271,854) (364,905) (364,905) (364,905) (364,905) (1,774,846) (1,654,427) (1,576,734)
Investors (32,436) (149,611) (271,854) (364,905) (364,905) (364,905) (364,905) (1,774,846) (1,654,427) (1,576,734)
Total Disbursements (1,561,320) (1,837,026) (2,169,657) (858,600) (858,600) (858,600) (858,600) (3,686,931) (3,403,593) (3,205,962)
Changes in Cash - - - - - - - - - -
Ending cash - - - - - - - - - -
Source: M anagement information
Profits will be split equally between Investors and Management Fund every quarter.
Financial Projections
-
200,000
400,000
600,000
800,000
1,000,000
1,200,000
1,400,000
1,600,000
1,800,000
2,000,000
1 year 2 year 3 year 4 year 5 year Year 6 Year 7 Year 8 Year 9 Year 10
Projected earnings distributed to Investors and Management company, $
Source: Management information
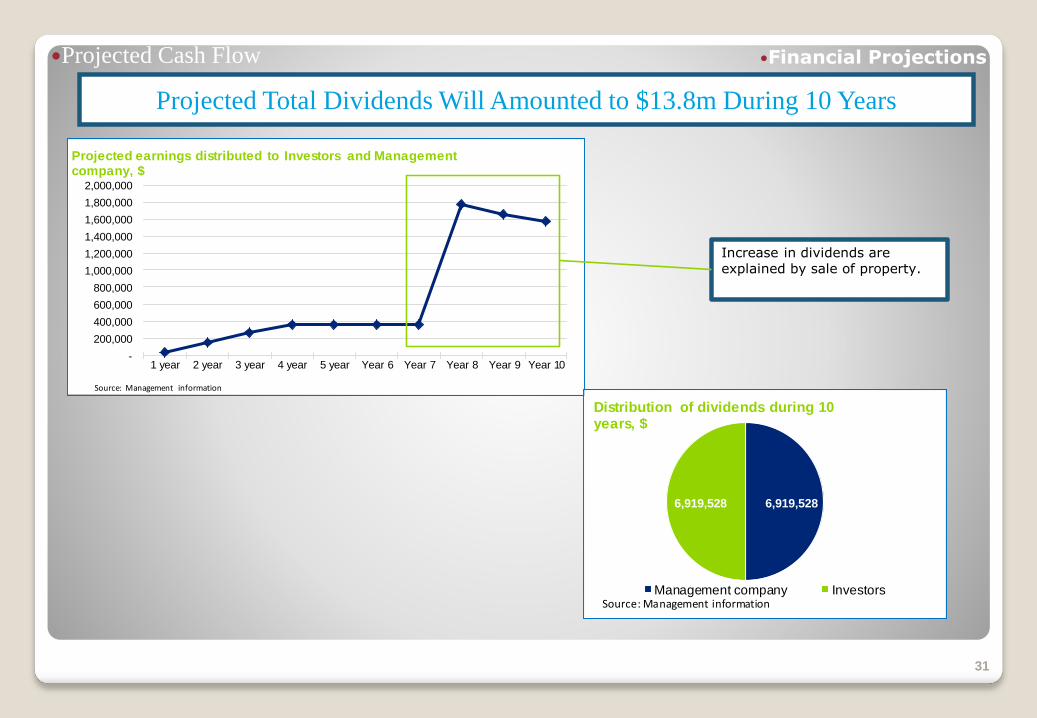
Projected Cash Flow
Projected Total Dividends Will Amounted to $13.8m During 10 Years
31
Increase in dividends are explained by sale of property.
6,919,528 6,919,528
Distribution of dividends during 10 years, $
Management company InvestorsSource: Management information
Financial Projections

Management Profile, Sample Transactions
Section Page
Executive Summary 2
Market Research 5
Business Model 14
Marketing Plan 21
Financial Projections 26
Management Profile, Sample Transactions 32
Operating Workflows Of The Fund 35
32

Management Profile
Management Profile –
33
Management Profile, Sample Transactions

34
9360 Linkside Trace, Riverdale, GA 30274
Purchase, Rehab & Acquisition Costs$39,534.48Insurance Replacement Cost $103,616.25(This does not include Lot and Grading)Rented on 3 Year Lease for $795.00 per Month
Purchase, Rehab & Acquisition Costs$47,358.72Insurance Replacement Cost$91,978.75(This does not include Lot and Grading)Rented on a 3 Year Lease for $795.00 per Month
Purchase, Rehab & Acquisition Costs$48,348.60Insurance Replacement Cost$97,113.75(This does not include Lot and Grading)Rented on a 3 Year Lease for $795.00 per Month
Purchase, Rehab & Acquisition Costs $42,735.02Insurance Replacement Cost $106,242.50(This does not include Lot and Grading)Rented on a 2 Year Lease for $895.00 per Month
374 Eagles Crossing Circle, Riverdale, GA 30274
21 Marissa Cove, Riverdale, GA 30274 111 Inverness Trace, Riverdale, GA 30274
Sample Transactions
Sample Transactions
Management Profile, Sample Transactions
Operating Workflows of the Fund
Section Page
Executive Summary 2
Market Research 5
Business Model 14
Marketing Plan 21
Financial Projections 26
Management Profile, Sample Transactions 32
Operating Workflows Of The Fund 35
35
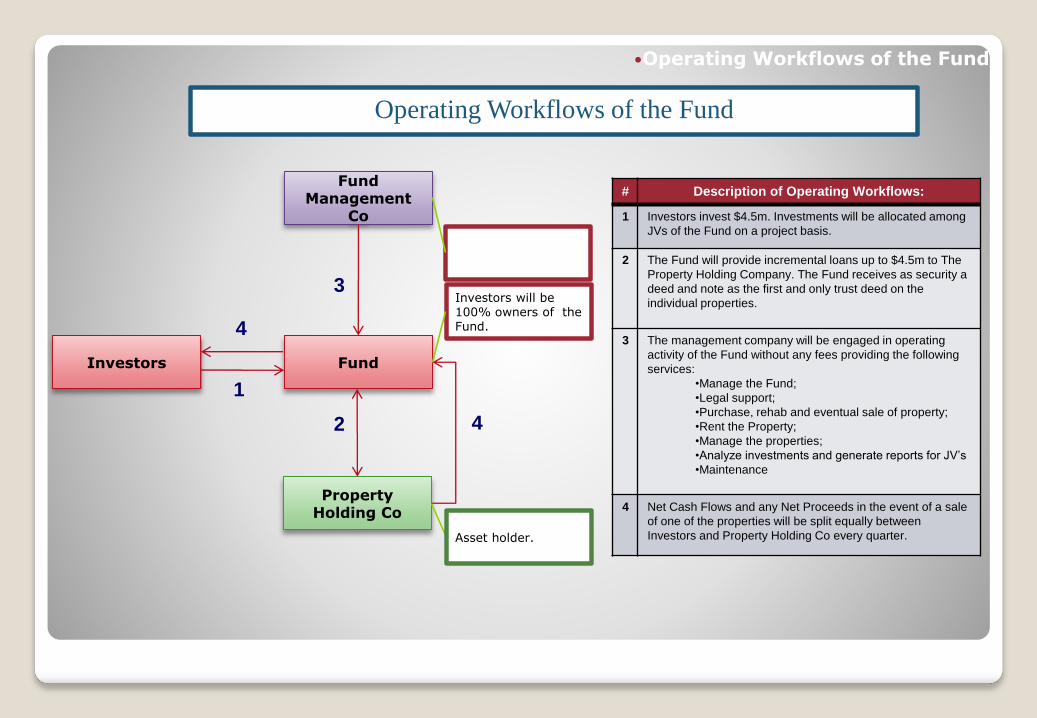
Investors
Fund Management
Co
2
3
4
Investors will be 100% owners of the Fund.
Operating Workflows of the Fund
Fund
Property Holding Co
1
4
# Description of Operating Workflows:
1 Investors invest $4.5m. Investments will be allocated among
JVs of the Fund on a project basis.
2 The Fund will provide incremental loans up to $4.5m to The
Property Holding Company. The Fund receives as security a
deed and note as the first and only trust deed on the
individual properties.
3 The management company will be engaged in operating
activity of the Fund without any fees providing the following
services:
•Manage the Fund;
•Legal support;
•Purchase, rehab and eventual sale of property;
•Rent the Property;
•Manage the properties;
•Analyze investments and generate reports for JV’s
•Maintenance
4 Net Cash Flows and any Net Proceeds in the event of a sale
of one of the properties will be split equally between
Investors and Property Holding Co every quarter.Asset holder.
Operating Workflows of the Fund