portable work zone data collection · vehicle classification (20 sec. updates). historical camera...
TRANSCRIPT

Portable Work Zone Data Collection
Blaine Van Dyke
ODOT ITS Designer

Year 1
Construction Zone Travel Time project.
Provide work zone information to public.
Test OSU Bluetooth travel time sensors in
new application.
Slide 2
Year 1 - Construction Zone
15 mile repaving project on I-5.
North of Roseburg and South of Cottage Grove.
Project anticipated having a large impact to
traffic flow.
ITS project goals:
Test the Bluetooth travel time technology in a
new application.
Inform the public of traffic impact.
Analyze the impact of traffic delay.
Slide 3

Slide 4

Travel Time Collection
Device collects Bluetooth MAC
addresses.
Stores the data and presents it with a web
interface.
ODOT database collects the MAC
addresses from the web interface.
Database subtracts timestamps to
determine travel time.
Slide 5
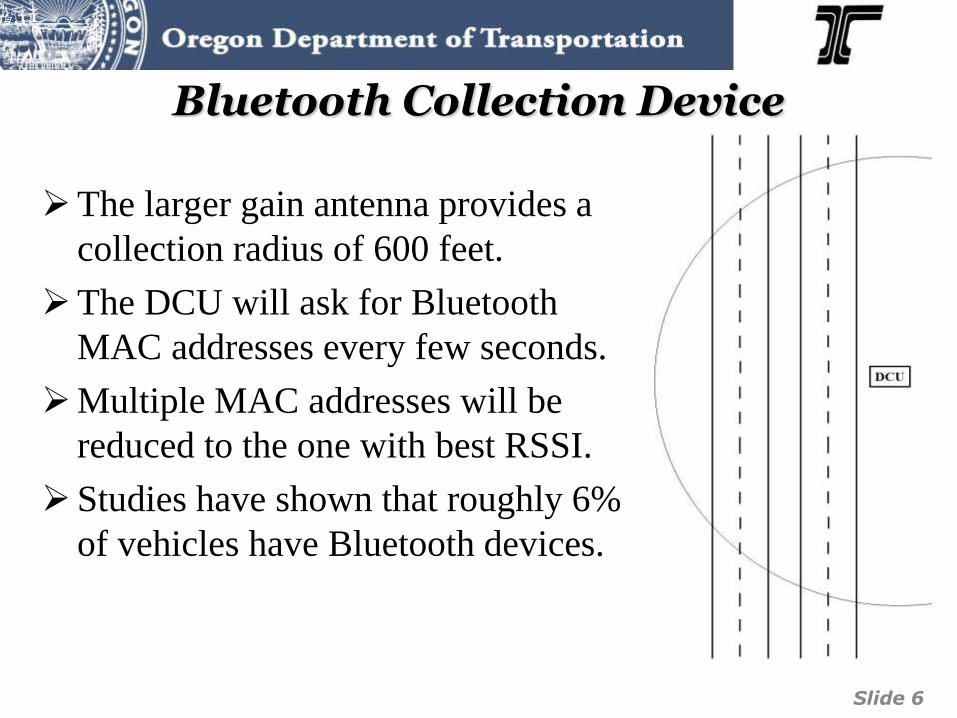
Bluetooth Collection Device
The larger gain antenna provides a
collection radius of 600 feet.
The DCU will ask for Bluetooth
MAC addresses every few seconds.
Multiple MAC addresses will be
reduced to the one with best RSSI.
Studies have shown that roughly 6%
of vehicles have Bluetooth devices.
Slide 6

Public Security/Privacy
DCUs transmit hashed Bluetooth MAC Addresses and
signal strength.
Hashed MAC Addresses are halved when received.
Slide 7

Data Collection Unit Components
Slide 8
ALIX Enclosure
4GB compact flash card
Linux operating system
ALIX.3D3
Bluetooth to
USB adapter
2.4 GHz 9dBi
Omni Antenna

Year 1 – Trailer #1
Custom built camera
trailer.
Propane powered.
Bluetooth DCU
installed.
Communicates via a
wireless router.
Slide 9

Year 1 – Trailer #1
Slide 10

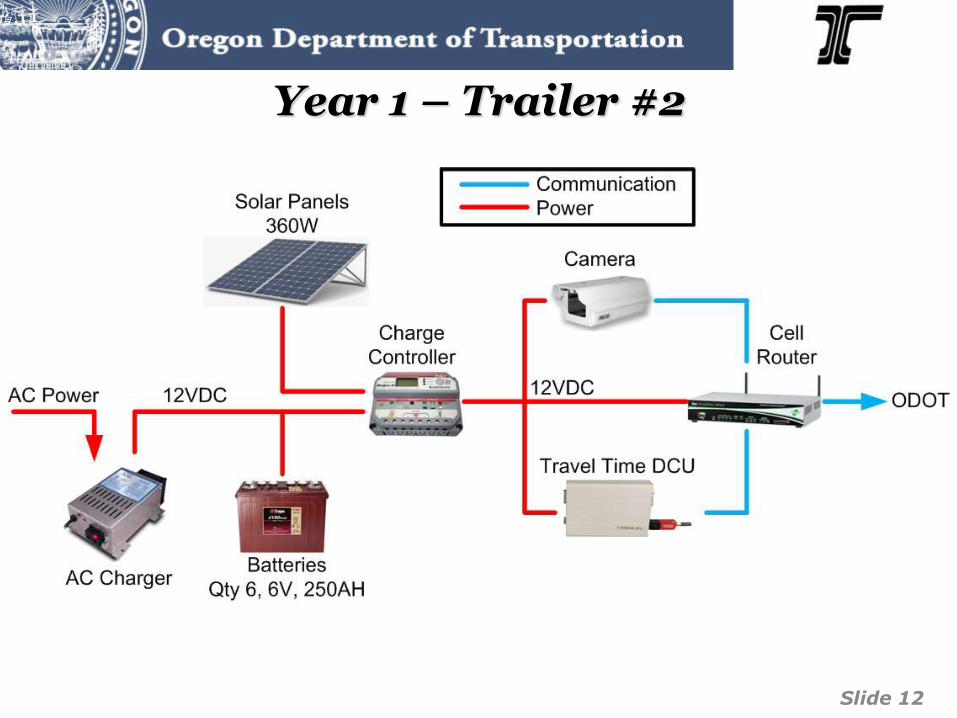
Year 1 – Trailer #2
Refurbished PCMS trailer.
Message sign removed, and
camera mast added.
Solar powered.
Camera and Bluetooth DCU
installed.
Communicates via a
wireless router.
Slide 11
Year 1 – Trailer #2
Slide 12

Trailer Cabinet
Slide 13
# Description
1 Wireless router
2 Camera encoder
3 Charge controller
4 Bluetooth DCU
5 Terminal blocks
6 Trailer brake wiring
7 AC battery charger
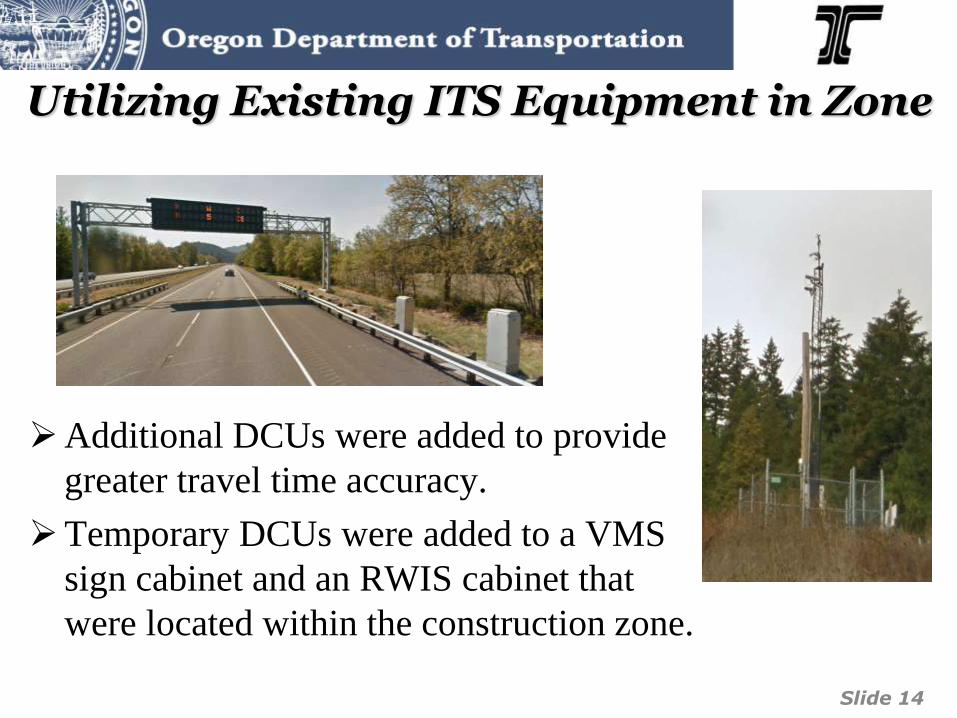
Utilizing Existing ITS Equipment in Zone
Additional DCUs were added to provide
greater travel time accuracy.
Temporary DCUs were added to a VMS
sign cabinet and an RWIS cabinet that
were located within the construction zone.
Slide 14

Integration of BT Units
Slide 15

Year 1 – Device Locations
Trailers are placed outside the bounds of the
construction zone to detect queues.
Intermediate DCUs provide sections of travel
times within the zone.
Locations are limited by existing infrastructure
and the number of portable trailers.
Slide 16

Slide 17

ODOT Central Services
Slide 18

Public Information - Travel Delay
Slide 19

Public Information - Travel Delay
Slide 20

Public Information - Cameras
Slide 21

Year 1 - Operational Experience
Propane trailer component failure.
Constant refueling of propane.
Trailer location adjustments due to large delays.
Bluetooth travel time bugs:
Delay maximum was reached on several occasions.
DCU interface and web hosting lockup.
Periods with unrealistic travel time.
Cell connectivity issues.
System “fills in” travel time data for failed segments.
Slide 22

Year 1 – Trailer #3
Replacement for propane
trailer.
Custom built camera trailer.
Solar powered.
PTZ camera
Bluetooth and network gear
installed.
Slide 23

Lessons Learned
Use solar powered trailers.
Better understanding of Bluetooth travel time system.
More equally spaced detectors for analysis.
Barricade equipment needs to be included.
PTZ cameras do not travel well.
Slide 24

Year 2
Construction Zone Travel Time became Smart
Work Zone.
Traffic financed project.
Project scope transitioned to enhancing safety
and reducing congestion.
Traffic impact analysis.
Slide 25

Year 2 - Construction Zone
9 mile repaving project on I-5.
Project anticipated having a large impact to
traffic flow.
Work Zone Traffic partnered with ITS.
ITS/Traffic project goals:
Inform the public, local and web users, of
traffic impact.
Analyze the impact of traffic delay.
Analyze the vehicle count, congestion, and
classification of I-5 traffic impacted by
construction. Slide 26

Slide 27
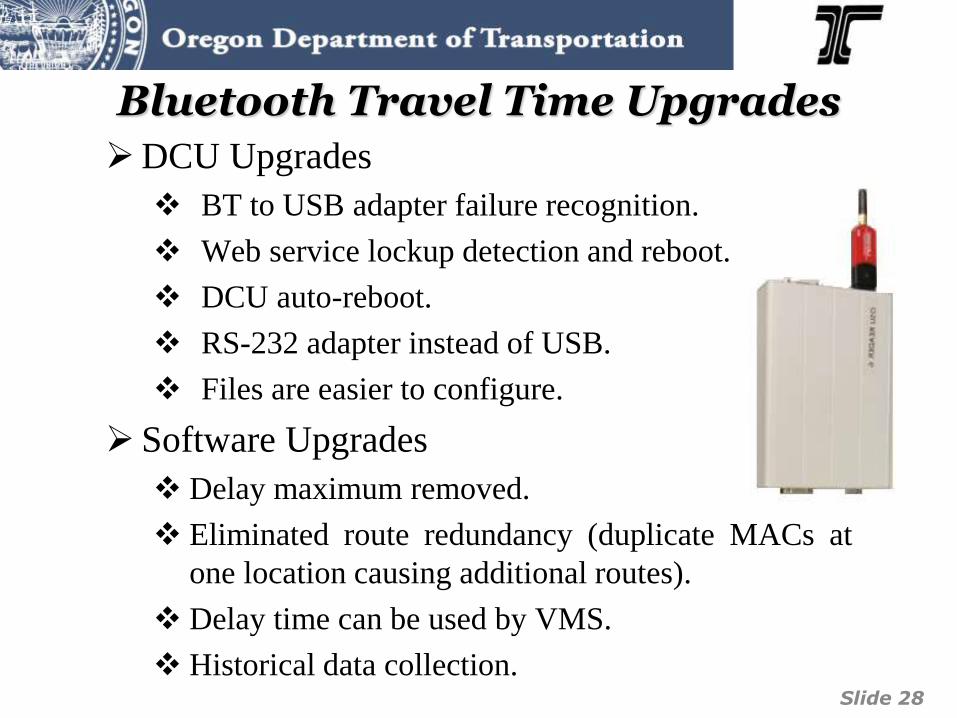
Bluetooth Travel Time Upgrades
DCU Upgrades
BT to USB adapter failure recognition.
Web service lockup detection and reboot.
DCU auto-reboot.
RS-232 adapter instead of USB.
Files are easier to configure.
Software Upgrades
Delay maximum removed.
Eliminated route redundancy (duplicate MACs at
one location causing additional routes).
Delay time can be used by VMS.
Historical data collection.
Slide 28

Traffic Sensor
Radar sensor measuring traffic
perpendicular to the roadway.
Able to monitor all
northbound and southbound
lanes from either side of the
roadway.
Provides volume counts,
average lane speed, and
vehicle size classification.
9,000 data intervals stored in
sensor.
Slide 29

Traffic Sensor Components
Slide 30
Serial to Ethernet Converter
Surge Protector
RS-485 RS-485
Wavetronix Smart Sensor HD

Traffic Sensor Configuration
Slide 31
Lanes are automatically
generated when vehicles pass by.
Areas can be disregarded.
Configuration needs to be done
at each trailer deployment.
Configuration is saved in device
and loads automatically when
power cycled.

Year 2 – Trailers
4 trailers were built.
Included cameras, travel time
sensors, and radar traffic
sensors.
Solar powered systems.
Custom sensor mast and solar
panel mounts were created
and attached to PCMS
frames.
Trailers cost around $30,000.
Slide 32

Slide 33

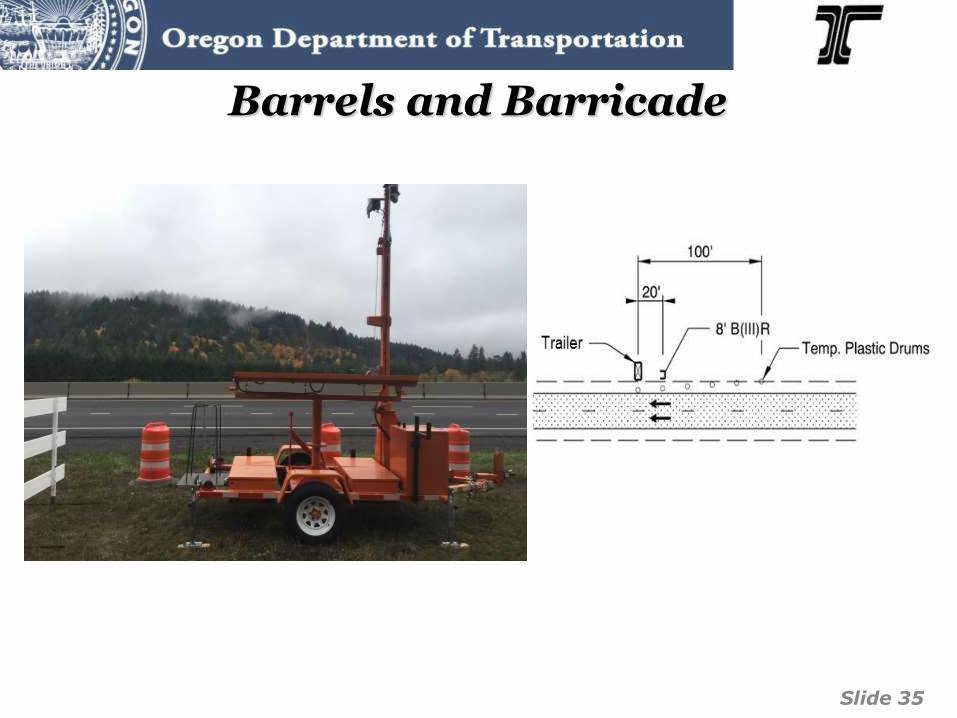
Portability
6 barrels and a barricade are required for roadside
deployment within the clear zone.
During travel this equipment can all be attached to
the trailer for ease of portability.
Toolboxes and additional trailer hitches are
included in each trailer.
Sensor carrying cases were added for safer
transportation.
Slide 34
Barrels and Barricade
Slide 35

Slide 36
Trailer Deployment

Trailer Design
Slide 37

Trailer Cabinet
Slide 38
# Description
1 Terminal blocks
2 Radar signal converter
3 Wireless router
4 Power supply
5 AC battery charger
6 Bluetooth DCU
7 Camera encoder
8 Charge controller
9 Trailer brake wiring

Remote Access
Slide 39
Wireless Router Bluetooth DCU
Camera Encoder Radar Traffic Sensor

Public Information - TripCheck
Slide 40

Public Information - TripCheck
Slide 41

Public Information - TripCheck
Slide 42

Camera Images Saved
Camera images are saved every 5 minutes for
10 days.
Allows for data validation and monitoring
traffic patterns.
Large congestion events are recorded for
analysis.
Slide 43

Camera Time Lapse
Slide 44

Year 2 – Equipment Placement
Portability of the midpoints
allows for a more dynamic
view of the zone.
Trailers were relocated at
various times to focus on
different work points.
Deployment locations are
only limited by the
landscape and road height.
Slide 45

Public Information – Message Signs
PVMS and VMS provide travelers of real time travel
delay at the beginning of the construction zone.
Slide 46

Public Information – Message Signs
Slide 47

Message Signs – Inner PVMS
Messages posted on signs are determined only
from travel time data.
Delay values posted are in 5 minute increments.
Values round up, so 1 second of delay is reported
as 5 minutes.
There is a constant message displayed.
During periods of no delay “--” is the placeholder.
Slide 48

Panel 1 Panel 2
Message Signs – Inner PVMS
Slide 49

Message Signs – Outer PVMS & VMS
Activated when travel time delay is greater than 5 min.
Messages will automatically clear when delay is reduced.
After congestion reaches a certain threshold the message
signs display:
WZ AHEAD CURRENT
CONSIDER WZ DELAY
ALT RTE XX MIN
VMS is activated when delay is greater than 20 min.
CONGESTION AHEAD
MP 154-162 SEVERE
DELAY XX MINUTES Slide 50

ODOT Notifications
When traffic delay reaches a certain threshold
notifications are sent to designated personnel
via text and email.
Allows for project manager to take corrective
action to reduce the traffic backup.
Alert messages are saved for historical reports.
Slide 51

ODOT Central Services
Slide 52

Traffic Analysis Benefit
The sensors from the trailers provide the following data:
Travel time (1 min. updates).
Volume by lane (20 sec. updates).
Speed by lane (20 sec. updates).
Occupancy by lane (20 sec. updates).
Vehicle classification (20 sec. updates).
Historical camera images.
Slide 53

Traffic Analysis Benefit
Prior to construction, traffic data allows for
prediction of work zone traffic.
Lane closure strategies can be developed to
improve flow.
Vehicle counts can be used for project
funding.
Slide 54

Year 2 - Operational Experience
Project location impacts sun exposure.
Abnormally heavy rain this year.
Generator used frequently to charge batteries.
Radar firmware issues.
Radar is sensitive to reflections caused by median
barriers or trees.
Slide 55

Slide 56

Slide 57

Future Improvements
Battery voltage monitor with email
notification.
Secondary power system, onboard
generator.
Powered adjustment of the traffic
sensor and camera on the mast.
Slide 58