port state control - paris mou report 2012... · explanatory note - “white ... once a year the...
TRANSCRIPT

Annual Report2012
Th
e P
ar
is m
em
or
an
du
m o
f u
nd
er
sTa
nd
ing
on
Po
rT
sTa
Te
co
nT
ro
l
Port State ControlTaking Port State Control to the Next Level


3AnnuAl report 2012
Annual Report
2012
Contents
Statement by Paris MoU chairman 4Statement by the Secretary General 6Executive summary 8Paris MoU developments 10Facts & Figures 2012 18Statistical Annexes Annual Report 2012 23White list 31Grey List 33Black List 35Explanatory note - “White”, “Grey” and “Black List” 58Secretariat Paris Memorandum of Understanding on Port State Control 60

4
Port State Control - taking Port State Control to the next level
30th Anniversary ofthe Paris MoU:
Taking Port State Controlto the Next Level
The year 2012 started out with maritime safety in the headlines of the
world’s news with the grounding of the “M/V Costa Concordia”. This
event was a shock to the Paris MoU and should be taken as a sign to
increase our efforts on verifying the safety of all ships operating in our
waters. I wish to extend my sympathy and that of the Paris MoU to all
the families of those touched by this tragedy. While the casualty report
will detail the lessons to be learnt, the Paris MoU considered that the
issue of cruise ship safety should be addressed. With this in mind the
Paris MoU developed a harmonized inspection campaign for cruise
ships during 2012 to commence from the 1st of January 2013.
We held our Port State Control
Committee’s 45th Session in Riga,
Latvia in May 2012 and this was an
important occasion. The meeting
adopted several significant matters
improving the port State control
regime, many of which you can
read about in this annual report.
The meeting itself was a success
and strengthens the Paris MoU
for the future and Latvia is to be
complimented on hosting our meeting.
During 2012 we celebrated our
thirtieth anniversary with the theme
“Taking Port State Control to the
Next Level”. This was marked with
Statement by
Paris MoU chairman

5AnnuAl report 2012
The Paris MoU Secretariat again
continued to serve its Members well
during the year and I would like to
thank them for their contribution.
I also wish to thank the Member
Authorities for their contributions to all
of the different fora of the Paris MoU
including the Technical Evaluation
Group (TEG) and its Chairman and all
of the contributors to our Task Forces
and to the members of the MoU
Advisory Board (MAB), all of whom
have made a tremendous contribution
during the year. I would also like to
thank the European Commission and
the European Maritime Safety Agency
(EMSA) for the excellent co-operation
and strong working relationship
with the Paris MoU. In conclusion,
the Port State Control Officers and
Administrators in the Member
Authorities of the Paris MoU are the
people who ensure the success of our
endeavours and they are the ones who
are the core of the Paris MoU and
continue to deliver on our common
objectives and they deserve our special
thanks and appreciation.
Brian Hogan
a reception at the International
Maritime Organization during the Flag
State Implementation Committee’s
twentieth session in London. This was
an opportunity to thank the members
of the IMO together with the observer
organizations and the IMO Secretariat
for the close co-operation with the
Paris MoU over the years. The Paris
MoU relationship with other Port State
Control Memoranda is growing and
we are very proud of our co-operation
with other MoUs, the United States
Coast Guard and with the role played
by the IMO in working with the MoUs
in achieving our common goal of safe
ships on clean seas.

6
Port State Control - taking Port State Control to the next level
30th Anniversary ofthe Paris MoU:
On Port State Control
This year we have commemorated the 30th anniversary of the Paris
MoU. An opportunity to reflect on what has been accomplished and
plan a course for the future. The introduction of a new inspection
regime in 2011 has now settled and feedback of the maritime industry
has been positive and supportive.
I would like to thank our Members
and the European Commission, as
well as EMSA, for their continued
support to achieve this. In particular
I would like to bring a salute to the
Port State Control Officers throughout
the region for their dedication and
professionalism.
Although we are on course, there is no
time for complacency. Some serious
casualties this year may indicate that
the human error remains an area of
concern.
Statement by
the Secretary General
7AnnuAl report 2012
PSC agreements, the IMO and the
ILO will be the way forward in this
effort. A joint approach to become
more effective is of vital importance.
A positive development in this
direction is that other PSC regions are
developing or considering a similar risk
based approach.
Richard W.J. Schiferli
measures to cut back on training, it
should be realized that training is a
long term investment. The challenges
in the maritime sector are many and
we need to be prepared.
The introduction of the Maritime
Labour Convention in 2013 will be a
significant step forward in securing
acceptable working and living
conditions on board. The aim of
the Paris MoU has been to remove
substandard ships from our seas.
Coöperation with other regional
The disaster with the Costa Concordia
made clear that human error can
have dramatic consequences. The
Paris MoU has agreed to investigate
the operational preparedness on
board cruise ships and announced a
harmonized verification programme
for 2013.
In order to deliver quality inspections,
we have to invest in the knowledge
and professionalism of those who
represent our organization. Although it
may be tempting in times of austerity

Port State Control - taking Port State Control to the next level
Executive summary
Last year Faroe Islands, Iran, Latvia
and Vanuatu were congratulated for
their efforts to move up to the White
List. This year Thailand and the United
States of America moved from the
“Grey List” to the “White List”. A very
successful achievement and an example
for other flags that, through determined
actions and political courage, changes
can be made. Syrian Arab Republic and
Ukraine moved from the “Black List” to
the “Grey List”.
There are now 45 flags on the “White
List”, 2 more compared with last year.
France is now leading the list, followed
by Germany and Hong Kong. Several
flags have made a significant move
upwards on the “White List” in the top
10: France, Hong Kong (China), Greece,
Norway and Bahamas. Other flags have
8
Considered to be the worldwide index for flag performance,
the Paris MoU “White, Grey and Black Lists” indicate further
improvements towards quality shipping.
9AnnuAl report 2012
the overall inspection efforts in terms of
percentage.
In 2012 a total of 15 ships were banned.
5 less compared with last year. Multiple
detentions was the most common
reason for banning in 2012.
With 1,090 inspections and 114
detentions the ships flying a “black
listed flag“ score a detention rate of
10.46%. For ships flying a “grey listed
flag” the detention rate is 6.39%
(1,017 inspections, 65 detentions)
and ships flying a “white listed flag”
2.99% (16,092 inspections and 482
detentions).
made a significant move downwards
in the “White List” and are no longer
in the top 10: United Kingdom, the
Netherlands and Singapore.
Recognized Organizations are delegated
by flag States and carry out most of the
statutory surveys on behalf of flags.
For this very reason it is important
to monitor their performance. The
best performing RO over the period
2010-2012 is the American Bureau of
Shipping followed by Det Norske Veritas
and Lloyds Register. Germanischer
Lloyd has dropped out of the top 5 and
has been replaced by Korean Register.
The worst performing RO is Phoenix
Register of Shipping (PH.R.S),
located in Piraeus, in Greece. A joint
submission with the Tokyo MoU has
addressed the correlation between ROs
and flags by submitting a paper to the
International Maritime Organization
based on 2011 figures. The combination
of Sierra Leone and Phoenix Register of
Shipping resulted in a 41% detention
rate. The Republic of Moldova with
Dromon Bureau of Shipping scored a
33% detention rate, followed by Saint
Kitts and Nevis and International
Register of Shipping with 12%.
The introduction of the New Inspection
Regime last year has also had an
impact on the 2012 figures. A decrease
in total number of inspections has
continued, as well as the total number
of deficiencies. Compared to 2011 the
detention percentage has stabilized on
3.6%. Italy, the Netherlands, Spain and
the United Kingdom contribute most to

10
Port State Control - taking Port State Control to the next level
Paris MoUdevelopments
Once a year the Port State Control Committee, which is the executive
body of the Paris MoU, meets in one of the member States. The
Committee considers policy matters concerning regional enforcement
of port State control, reviews the work of the Technical Evaluation
Group and task forces and decides on administrative procedures.
The task forces, of which 14 were
active in 2012, are each assigned a
specific work programme to investigate
improvement of operational, technical
and administrative port State control
procedures. Reports of the task
forces are submitted to the Technical
Evaluation Group (TEG) at which all
Paris MoU members and observers are
represented. The evaluation of the TEG
is submitted to the Committee for final
consideration and decision-making.
The MoU Advisory Board advises
the Port State Control Committee on
matters of a political and strategic
nature, and provides direction to the
task forces and Secretariat between
meetings of the Committee. The Board
meets several times a year and was in
2012 composed of participants from
Croatia, Italy, Norway, Malta and the
European Commission.
Port State Control Committee
The Port State Control Committee
Harmonized Verification Programme
(HAVEP) on operational controls on
passenger ships in 2013. The HAVEP will
run for a period of twelve months, during
which period PSCOs focus their attention
on compliance with regulations concerning
operational emergency drills. The
Committee noted that the detention rate of
passenger ships increased in 2011 to 4.4%
compared with 1.6% in 2010 and 2009.
Since the Maritime Labour Convention
2006 (MLC 2006) is expected to enter
into force in 2013, the Committee agreed
in principle on amendments to the Paris
MoU text, introducing the MLC 2006
as a relevant instrument. Guidelines on
operational controls on passenger ships/
ferries, PSC on pleasure yachts and ECDIS
were also adopted. The Committee agreed
to publish relevant inspection guidelines
on the public website.
High importance was given to
Concentrated Inspection Campaigns
(CICs). A CIC on Fire Safety Systems
held its 45th meeting in Riga, Latvia
from 7-11 May 2012. The MoU has
27 member States. The Committee
agreed that the first year of the new
inspection regime (NIR) had been
largely successful.
An important goal of the NIR is to
concentrate inspection efforts on high
risk ships and reward quality shipping
with a reduced inspection burden.
The NIR makes use of company
performance and the Voluntary IMO
Member State Audit Scheme (VIMSAS)
for identifying the risk profile of
ships together with the performance
of the flag State and the recognised
organization. The inspection history of
the ship as well as the ship’s age and
ship type influences the targeting. The
information system THETIS is hosted
and managed by EMSA.
The Committee recognised the need
to focus on passenger ship safety
and agreed to do so in the form of a

11AnnuAl report 2012
■ Revision of the guidelines on
MARPOL Annex I
Port State Control Training initiatives
The Paris MoU will continue to invest
in the training and development
of Port State Control Officers in
order to establish a higher degree of
harmonisation and standardisation in
inspections throughout the region.
The Secretariat organises three
different training programmes for
Port State Control Officers:
■ Seminars (twice a year)
■ Expert training (twice a year)
■ Specialized training (once a year)
The Seminars are open to members,
co-operating members and observers.
The agenda is more topical and deals
with current issues such as inspection
campaigns and new requirements.
Expert and Specialized Training
aim to promote a higher degree
of professional knowledge and
had been scheduled from September to
November 2012, a CIC on Propulsion
and Auxiliary Machinery in 2013 and
a CIC focussing on Hours of Work or
Rest in 2014. The campaigns will be
carried out jointly with the Tokyo MoU.
In addition the Committee considered
a number of options for other joint
CICs with the Tokyo MoU for 2014 and
beyond.
The report of the CIC on Structural
Safety and the International Convention
on Load Lines, carried out in September,
October and November of 2011, was
presented to PSCC45 and the results will
be published and submitted to the IMO
in 2013.
The Committee also adopted the
2011 Annual Report, including the
new White, Grey and Black List and
the performance list of Recognised
Organizations. The Faroe Islands,
Vanuatu, Latvia and Iran moved from
the “Grey List” to the “White List”.
Technical Evaluation Group
The Technical Evaluation Group (TEG)
convened in Leiden, The Netherlands
in December 2012. Fourteen task
forces submitted reports to the TEG
for evaluation before submission to the
Port State Control Committee.
Issues considered by the TEG included:
■ Improvement of the THETIS
information system
■ Evaluation of Paris MoU statistics
■ Revision of the guidelines on
operational controls
■ Development of guidelines for
PSCOs regarding Human Element
issues
■ Development of guidelines for
PSCOs for the Maritime Labour
Convention
■ Development of the training policy
■ Development of a Harmonized
Verification Programme for
Passenger Ships 2013
■ Development of a CIC on Propulsion
and aux. Machinery with the Tokyo
MoU 2013

12
PORT STATE CONTROL - TAKING PORT STATE CONTROL TO THE NExT LEVEL
harmonisation of more complex port
State control issues and procedures.
The Paris MoU is also assisting EMSA
in the preparation and delivery of New
Entrant and Refresher Programmes for
PSCOs from throughout the region.
PSC Seminar 53
The 53rd Port State Control Seminar
was held from 19-21 June 2012 in
Szczecin, Poland. Port State Control
Officers from the Paris MoU, the Tokyo
MoU, the Black Sea MoU and the
Riyadh MoU as well as participants
from Montenegro attended the
Seminar. The main topics of discussion
were the Train the Trainer for the CIC on
Fire Safety Systems. Furthermore there
where presentations on the Surveyor
Simulation program developed by
Det Norske Veritas and several case
studies on the application of Paris
MoU procedures. The Secretariat
presented an overview on the decisions
themes are “The Human Element”
and “Safety and Environment”. The
theme of the Specialized Training will
change every year. In 2012 this training
dealt with the inspection of Passenger
Ships and the problems Port State
Control Officers may encounter. Both
training programmes are intended
for experienced PSCOs. Using that
experience, the participants can work
together to establish a higher degree of
harmonisation and standardisation of
their inspection practice.
Lecturers for the training programmes
are recruited from the maritime
Administrations of the member States,
international maritime organizations
and the maritime industry. For the
training programmes in 2012 the United
Kingdom, Germany, the Netherlands,
Spain, Italy and different ROs and
service companies, among others,
provided lecturers. In 2012 the IMO was
able to sponsor several representatives
and discussions coming from PSCC45
and a representative from EMSA gave
a presentation on the developments
within the EU and EMSA.
PSC Seminar 54
The 54th Port State Control Seminar
was held from 6 to 8 November 2012
in Genoa, Italy. Port State control
officers from the Paris MoU attended
the Seminar as well as participants
from the Mediterranean MoU. The
main topics of discussion were the
HAVEP on Passenger Ships which
will be held in 2013 and the changes
to the different MARPOL Annexes
which will enter into force in 2013. The
Secretariat presented an overview of
developments in the Paris Mou and
a representative from EMSA gave a
presentation on the developments
within the EU and EMSA.
Expert and Specialized Training
For the Expert Training the central
13AnnuAl report 2012
raise the awareness concerning the
procedures governing PSC inspections.
As with the seminars organised in
earlier years, the main objective
remained the establishment of
a common understanding and
harmonised approach in the area of
the Paris MoU. Feedback sessions
with participants during the seminars
indicated that indeed a wider
understanding of the procedures
and the available tools such as the
Paris MoU manual, RuleCheck and
the Distance Learning modules was
established by the seminars. This
suggests that the adapted concept of
the seminars is conducive in achieving
the objective.
All seminars were organised by EMSA
and held at its premises in Lisbon.
Lecturers were provided both by EMSA
and the Paris MoU Secretariat. The 262
participants attending the New Entrant
and the Refresher seminars during
2012 originated from all Paris MoU
member States.
Detention Review Panel
Flag States or Recognized
Organizations that cannot resolve a
dispute concerning a detention with
the port State may submit their case
for review. The detention review panel
is composed of representatives of
four different MoU Authorities, on a
rotating basis, plus the Secretariat.
In 2012 the Secretariat received 13
requests for review. Four cases did
not comply with the requirements for
consideration. These cases were either
submitted beyond the 120 days limit,
were handled at National Courts or
originated from ship owners instead
from other MoUs to take part in the
training programmes. It was agreed
that one representative from each MoU
can attend the Expert or Specialized
Training programme. Not every MoU
was able to send a PSCO to the
training programmes.
The 8th Expert Training “Safety and
Environment”
The eighth Expert Training programme
was held in The Hague in February
2012. Important issues during this
training were the IMDG Code, Load
Lines, life saving appliances and oil
filtering equipment. Participants from
the Black Sea MoU, Indian Ocean MoU,
Caribbean MoU, Mediterranean MoU,
Riyadh MoU and the Viña del Mar
Agreement took part in the training.
The 4th Specialized Training on the
Inspection of Passenger Ships
The fourth Specialized Training on
the Inspection of Passenger ships
was held in Venice, Italy in April 2012.
During the training construction and
certification, and the more detailed and
expanded inspection procedures where
discussed. A highlight of the training
was the visit to a ship yard, where the
whole construction (and certification)
procedure was discussed with an
extensive tour of the shipyard.
The 11th Expert Training
“The Human Element”
In October 2012 the eleventh Expert
Training programme was held in The
Hague with the Human Element as
the central theme. Participants from
member States took part in this training.
The issues discussed during the training
session were the ILO and STCW
conventions, the Code of Good Practice
and inter-cultural communication.
One representative from another MoU
attended the training.
BI-Tool training
In 2012 10 representatives from
member States attended a new
training for the BI-tool. To facilitate
both new and experienced users of the
BI-tool there was a separate one day
programme for new users. This training
focussed on the use of pivot tables and
charts in Excel. The second part of the
training, for all attendees, was centred
on different assignments in the use of
the BI-tool. Both general assignments
as well as specific assignments for
member states were used.
Training in cooperation with EMSA
The Paris MoU is assisting EMSA in
the training delivered to PSCOs from
throughout the region.
New Entrant and Refresher
PSC Seminars
In 2012 the fully established Professional
Development Scheme of the Paris MoU
encompassed 2 seminars for New
Entrant PSCOs and 4 Refresher seminars
for experienced PSCOs. The New Regime
focuses on sub-standard shipping and
introduces a reward in terms of the
inspection frequency for good performing
ships. It translates to “less, but better
inspections”. The New Regime also
forced new and enhanced procedures to
be implemented, all aiming at providing
more guidance for better inspections.
These changes meant that adherence to
the established procedures became of
paramount importance.
For the seminars organised for New
Entrants and Refreshers held during
2012 the approach adopted the
previous year has been followed to

14
Port State Control - taking Port State Control to the next level
of flag States or RO’s. Nine cases met
the criteria and where submitted to MoU
members for review.
In three cases the detention review
panel concluded that the port State’s
decision to detain was not justified.
The panel advised these port States to
reconsider the detention. In six cases the
panel concluded that the detaining port
States would not have to reconsider the
decision to detain.
Quality management
Since 15 March 2011 the Paris MoU
Secretariat has been ISO 9001:2008
certified for the services and products
of the Secretariat. The Secretariat has
continued to develop the quality system
in 2012 in order to improve service
levels combined with efficient use of the
available resources.
Paris MoU on the Internet
After the launch at the beginning of
2011, the new website enjoyed in 2012
an ever increasing demand, in particular
from flag and port States, government
agencies, charterers, insurers and
classification societies. They were able
to monitor their performance and the
performance of others on a continuous
basis. The port State enters ships that
are currently under detention in a listing.
Validated port State control reports could
be accessed and offered visitors more
detailed information.
To increase public awareness of unsafe
ships caught by port State control,
particularly serious detentions are
published under the heading “Caught in
the Net’. These detentions are described
in detail with photographs.
In 2012 only details of the ship “TERRY
SIETE” were published. The annual

15AnnuAl report 2012
appliances, and the fire control plan.
During the campaign most inspections
concerned general cargo/multi-
purpose ships with 1,347 (34%)
inspections, followed by bulk carriers
with 766 (19%) inspections, container
ships with 422 (11%) inspections,
chemical tankers with 343 (9%)
inspections and oil tankers with 308
(8%) inspections.
59 (57%) of the ships detained for
CIC-related deficiencies were general
cargo/multipurpose ships and 14
(14%) were bulk carriers. Among the
other detained ships were 9 container
ships, 4 offshore supply ships and
4 Ro-Ro cargo ships. 51% of the
detained ships were 30 years or older.
award for the best contribution to the
“Caught in the Net” therefore has been
presented to the United Kingdom.
Other information of interest such
as the monthly list of detentions, the
Annual Report, current detentions,
the performance lists and news items
can be downloaded from the website,
which is found at www.parismou.org.
Concentrated inspection campaigns
Several Concentrated Inspection
Campaigns have been held in the
Paris MoU Region over the past years.
The campaigns focus on a particular
area of compliance with international
regulations with the aim of gathering
information and enforcing the level
of compliance. Each campaign is
prepared by experts and identifies
a number of specific items for
inspection. Experience shows that they
serve to draw attention to the chosen
area of compliance.
CIC 2012 Fire Safety Systems
In the period from 1 September 2012
to 30 November 2012 a Concentrated
Inspection Campaign was carried out
on Fire Safety Systems.
The CIC questionnaire was completed
during 4,014 inspections, a total of
1,958 CIC-related deficiencies were
recorded and 103 ships (2.6%) were
detained for CIC-related deficiencies.
Problem areas included fire pumps and
its pipes, fire fighting equipment and

Port State Control - taking Port State Control to the next level
16
Analysis of the recorded deficiencies
shows that most deficiencies relate
to fire pumps and its pipes (13%), fire
fighting equipment and appliances
(11%) and the fire control plan (9%).
Most inspections were carried out on
ships under the flags of Panama with
445 (11%) inspections, Liberia with 308
(8%) inspections, Malta with 306 (8%)
inspections and Antigua and Barbuda
with 282 (7%) inspections. The flags
with the highest CIC-topic related
detention rate were Dominica with
28.6% (2 CIC-topic related detentions
during 7 inspections), Sierra Leone
with 21.2% (7 CIC-topic related
detentions during 33 inspections) and
Togo with 18.2% (4 CIC-topic related
detentions during 22 inspections).
In order to provide co-operation
to these MoUs, they may apply
for associate or observer status.
Regional agreements seeking
observer status must demonstrate
that their member Authorities have
an acceptable overall flag State
record and have a similar approach
in terms of commitment and goals to
that of the Paris MoU.
Six regional agreements have
obtained official observer status
to the Paris MoU: the Tokyo MoU,
Caribbean MoU, Mediterranean
MoU, Black Sea MoU, Riyadh MoU
and Acuerdo de Viña del Mar. The
United States Coast Guard is also an
observer at Paris MoU meetings.
The background for this CIC was that,
as an average for the last 8 years,
deficiencies related to fire safety
systems accounted for 14% of the total
number of deficiencies.
CIC Campaigns 2013 and 2014
For 2013, the PSC Committee decided
on a Concentrated Inspection
Campaign on Propulsion and Auxiliary
Machinery. For 2014, the Committee
agreed on a CIC on STCW Hours of
Rest.
Co-operation with other organizations
The strength of regional regimes of
port State control, which are bound
by geographical circumstances and
interests, is widely recognised. Nine
regional MoUs have been established.

17AnnuAl report 2012
exercise, have to be made before co-operating
status can be granted.
In 2011 the maritime Authority of
Montenegro joined the MoU as a co-
operating member with the prospect of
becoming a full member in the future.
The Paris MoU currently has 8 members with
dual or even triple membership of MoU’s
on PSC: Canada and the Russian Federation
have also ties with the Tokyo MoU, while the
Russian Federation is also a member of the
Black Sea MoU. With Bulgaria and Romania
there are further ties with the Black Sea MoU.
Malta and Cyprus are also members of the
Mediterranean MoU. The Netherlands is
member of the Caribbean MoU and France is
member of the Indian Ocean MoU.
For all these members the Paris MoU
standards will prevail.
The West and Central Africa MoU
obtained an associate status. It will
not be represented in the Committee,
but there is a commitment from the
Paris MoU to assist them on a technical
and administrative basis, including
participation in seminars and technical
meetings.
The International Labour Organization
and the International Maritime
Organization have participated in the
meetings of the Paris MoU on a regular
basis since 1982. In 2006 the Paris MoU
obtained official status at the IMO as
an Inter Governmental Organization. A
delegation of the MoU participated in the
20th session of the Sub-Committee on
Flag State Implementation in March 2012.
The 2010 Annual Report including
inspection data in a new format, the
performance of flag Administrations and
Recognized Organizations, a combined
list of flags targeted by the Paris MoU,
Tokyo MoU and USCG and the results
of the 2010 CIC on tanker damage
stability, as well preliminary results
of the 2011 CIC on Structural Safety
and Load Lines, information on the
improvement of flag performance and a
new Guideline for PSCOs on certification
of Seafarers’ Rest Hours were submitted
to the Sub-Committee on Flag State
Implementation.
Membership of the Paris MoU
In preparation for prospective new
members of the Paris MoU, the Port
State Control Committee has adopted
criteria for co-operating status for non-
member States and observer/associate
status for other PSC regions. Specific
criteria, including a self-evaluation
18
Port State Control - taking Port State Control to the next level
Inspections
With a total number of 18,308
inspections performed in 2012 the
inspection figures showed a decrease
of 4% compared with the figures
of 2011. Each individual ship was
inspected an average of 1.3 times per
year, a rate which has slightly increased
since 2011 (1.2).
The drop in the number of inspections
that set in with the introduction of the
New Inspection Regime in January
2011, has continued in 2012. New
features of this inspections regime are
that the annual inspection target for
each Member State is based on ship
movement data rather than individual
ship calls and that dedicated quality
shipping is awarded with larger
inspection intervals. As a result the
number of inspections performed
in the region has dropped, but the
detention rate increases.
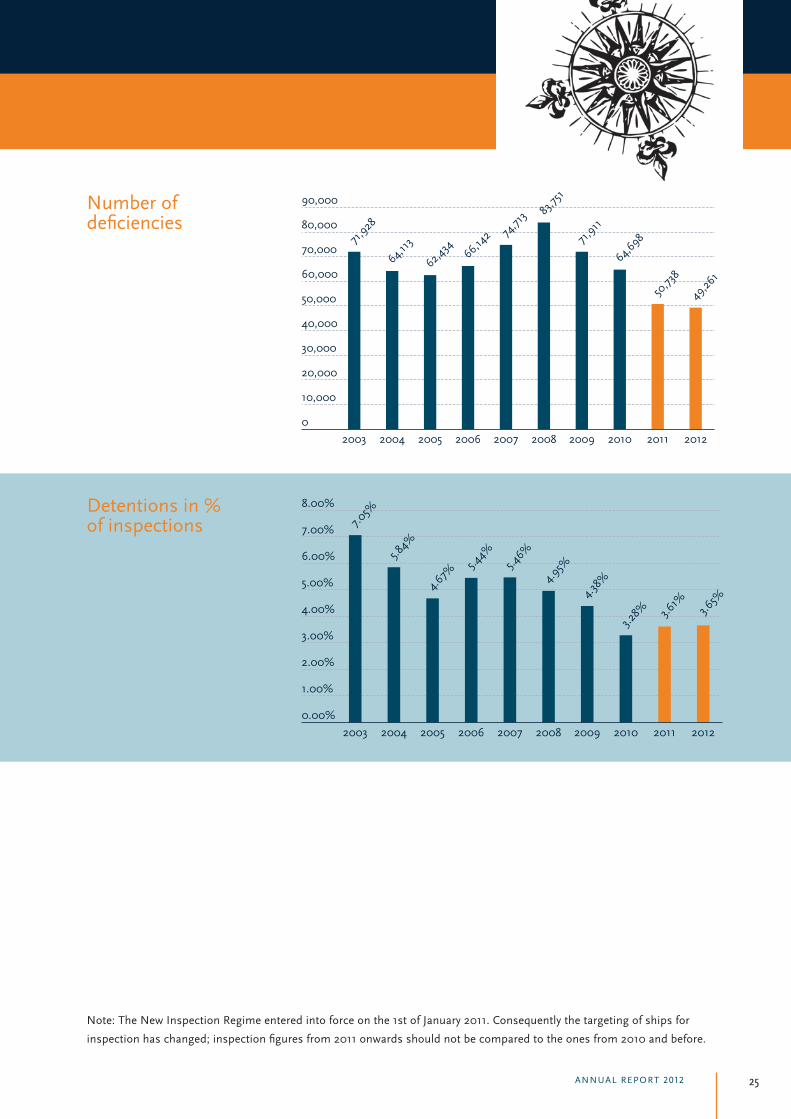
account of the fact that some ships are
detained more than once a year.
Compared with 2011, the number of
detentions has decreased from 688 to
669 detentions. The average detention
rate in 2012 is 3.65%. In 2011 the
detention rate was 3.61%. In 2010 the
detention rate was 3.28%, the lowest
detention rate ever. This is the second
year that the average detention rate
has increased.
“White, Grey and Black List”
The “White, Grey and Black (WGB) List”
presents the full spectrum, from quality
flags to flags with a poor performance
that are considered high or very high
risk. It is based on the total number of
inspections and detentions over a 3-year
rolling period for flags with at least 30
inspections in the period.
On the “White, Grey and Black list”
for 2012 a total number of 78 flags are
Deficiencies
In 2010 the number of deficiencies
recorded was 64,698. In 2011 the
number of deficiencies was 50,738.
In 2012 the number of deficiencies
decreased further to 49,261. Compared
with 2011 this is a decrease of 3%.
In 57% of all inspections performed,
one or more deficiencies were
recorded. In 2011 this figure was 56%.
The average number of deficiencies
per inspection also increased from
2.6 in 2011 to 2.7 in 2012.
Detentions
Some deficiencies are clearly
hazardous to safety, health or the
environment and the ship is
detained until they are rectified.
Detention rates are expressed as
a percentage of the number of
inspections, rather than the number
of individual ships inspected to take
Facts & Figures2012
In the following pages the facts and figures of 2012 are listed. The
trend that begun in 2011 when the New Inspection Regime entered
into force has continued. For the second year in a row the inspection
figures show a decrease in the number of inspections, deficiencies and
detentions, but an increase in the detention rate.
19AnnuAl report 2012
load ships (9.68%) and general cargo/
multipurpose ships (5.99%) was
higher than the detention rate of other
ship types. Ship types like other special
activities ships, refrigerated cargo
ships and tugs have a lower detention
rate of 4.34%, 4.23% and 3.39%
respectively. The other ship types have
even lower detention rates.
Performance of Recognized
Organizations
For several years the Committee has
closely monitored the performance
of classification societies acting as
Recognized Organizations for flag
States. To calculate the performance
of the Recognized Organizations, the
same formula to calculate the excess
factor of the flags is used. A minimum
number of 60 inspections per RO
are needed before the performance
is taken into account for the list. In
2012 30 ROs are recorded on the
performance list.
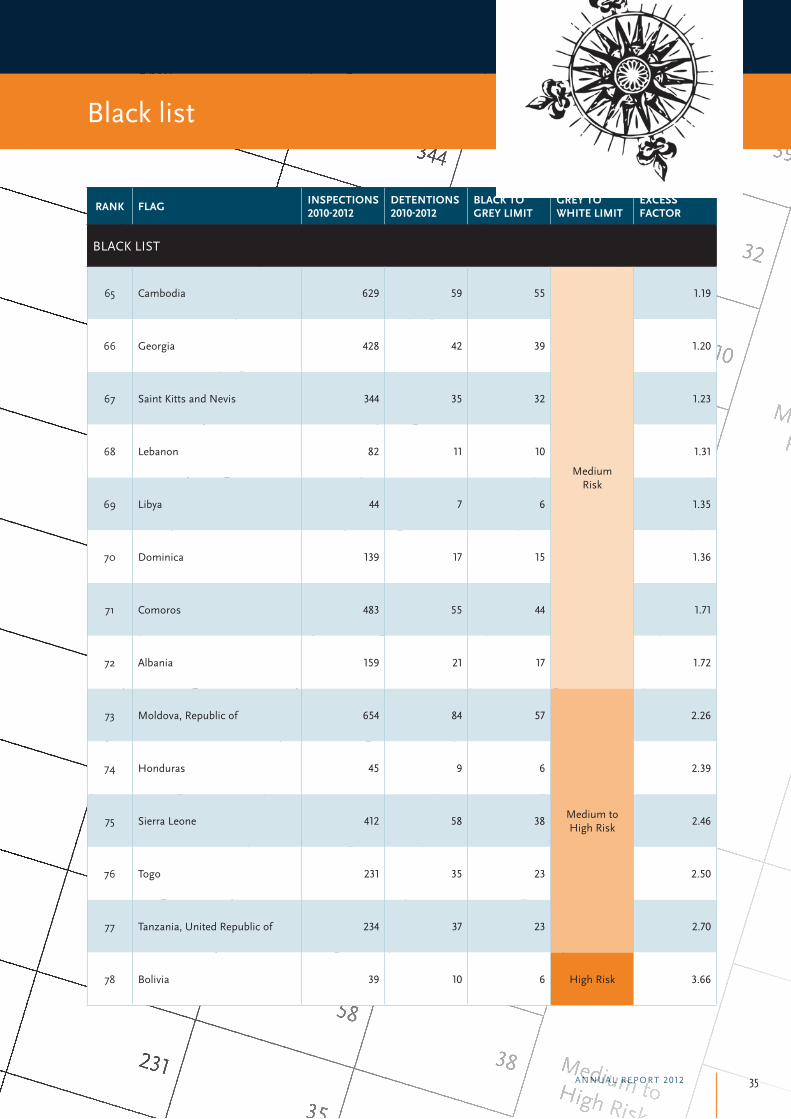
listed: 45 on the “White List”, 19 on
the “Grey List” and 14 on the “Black
list”. In 2011 the number of flags listed
totalled 80 flags, namely 43 on the
“White List”, 20 on the “Grey List” and
17 on the “Black List”.
The “White List” represents quality
flags with a consistently low detention
record. Compared with last year, the
number of flags on the “White List”
has increased by 2 flags to a total
number of 45 flags. New on
the “White List” are the United States
and Thailand, last year still on the
“Grey List”.
France has been placed highest on the
list in terms of performance. The next
in line of the best performing flags
in 2012 are Germany, Hong Kong,
Sweden and Greece.
Flags with an average performance
are shown on the “Grey List”. Their
appearance on this list may act as an
incentive to improve and move to the
“White List”. At the same time flags at
the lower end of the “Grey List” should
be careful not to neglect control over
their ships and risk ending up on the
“Black List” next year.
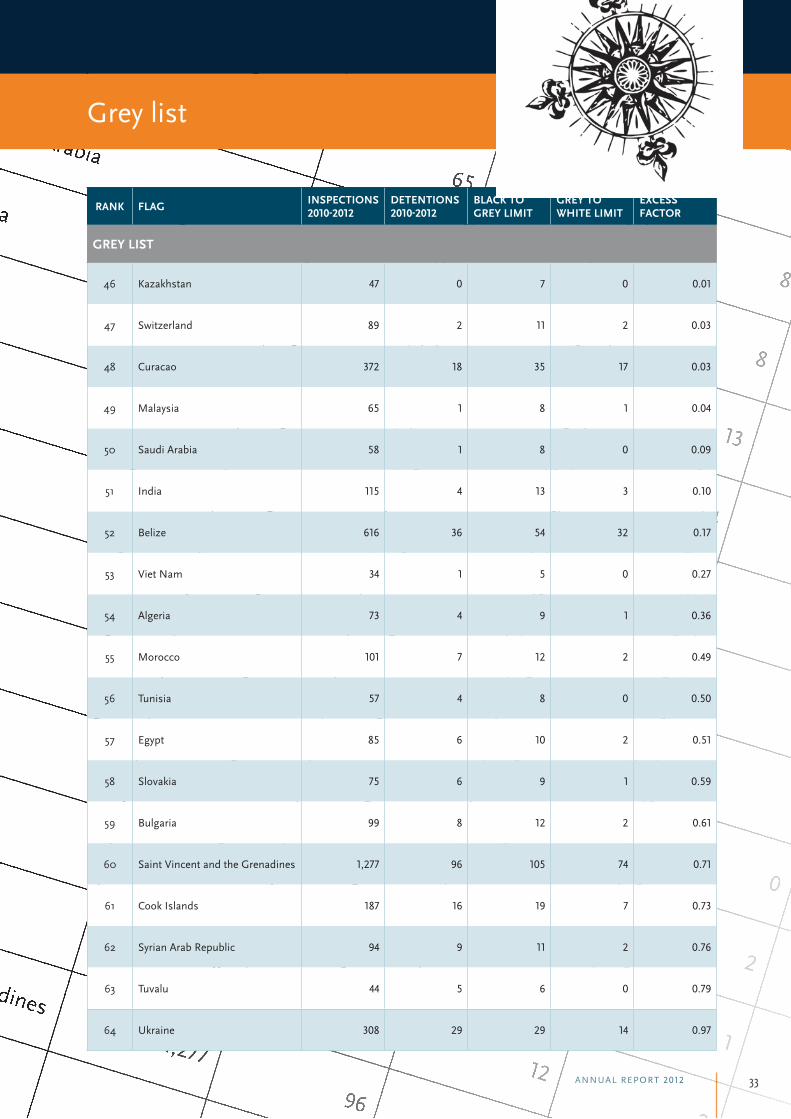
On this year’s “Grey List” a total
number of 19 flags is recorded. Last
year the “Grey List” recorded 20 flags.
New on the “Grey List” are the Syrian
Arab Republic and Ukraine, last year
still on the “Black List”.
The poorest performing flags are
Bolivia, Tanzania and Togo.
A graph of the distribution of listed
and not listed flags indicates that only
0.5% of the ships inspected are from
flags not listed on the WGB list.
Ship type
In 2012 the detention rate of heavy

Port State Control - taking Port State Control to the next level
Among the best performing recognized
organizations were:
■ American Bureau of Shipping (ABS)
■ Det Norske Veritas (DNV)
■ Lloyd’s Register (UK) (LR)
The lowest performing organizations
were:
■ Phoenix Register of Shipping
(Greece) (PHRS)
■ INCLAMAR (Cyprus)
■ Register of Shipping (Albania) (RSA)
Compared with last year’s performance
level, a small shift in RO performance
in 2012 can be noticed. This year fewer
is an increase compared with the 13.2%
of the previous year.
Refusal of access of ships
A total of 15 ships were banned from
the Paris MoU region in 2012 for
reasons of multiple detentions (11),
failure to call at an indicated repair
yard (3) and jumping detention (1).
A number of ships remain banned from
previous years.
Deficiencies per major category
The number of deficiencies in areas
such as certificate & documentation,
fire safety, safety of navigation and
organizations have been placed on the
high and very low performing part of the
list and more organizations have been
placed on the medium part of the list.
Details of the responsibility of
Recognized Organizations for
detainable deficiencies have been
published since 1999. When one
or more detainable deficiencies
are attributed to a Recognized
Organization in accordance with the
criteria, it is recorded “RO responsible”
and the RO is informed. Out of 669
detentions recorded in 2012, 107 or
16% were considered RO related which
20

21AnnuAl report 2012
Deficiencies in MARPOL Annex IV
show an increase of 28.1% in 2012
(324), compared with 2011 (253).
Deficiencies in MARPOL Annex VI
show an increase of 25.4% in 2012
(449), compared with 2011 (358).
Working and living conditions
Deficiencies in working conditions
decreased with 3.5% from 5,252 in 2011
to 5,067 in 2012. Deficiencies in living
conditions decreased with 5.7% from
2,313 in 2011 to 2,182 in 2012.
Management
The number of ISM related deficiencies
showed an increase of 5.6% from 1,644
in 2011 to 1,736 in 2012.
working & living conditions accounted
for approximately 65% of the total
number of deficiencies. The trends
in these areas are clarified below. In
2011 a new coding system has taken
effect. More detailed information may
be found in the statistical Annexes to
this report. The data of 2010 has been
regrouped accordingly and is therefore
not comparable with the data as
published in the Annual Report of 2010.
Certificate & Documentation
Deficiencies in ships’ certificates, crew
certificates and documents indicated a
decrease of 6.3% from 7,638 in 2011 to
7,158 in 2012.
Safety of navigation
The deficiencies in Safety of Navigation
show an increase of 4.4%, from 6,528
deficiencies in 2011 to 6,816 in 2012.
Fire safety
In 2012 deficiencies in fire safety
accounted for approximately 15% of
the total number of deficiencies. The
number of deficiencies in these areas
increased with 13.6% from 6,591 in
2011 to 7,488 in 2012.
Pollution prevention
Deficiencies in MARPOL Annex I
show a decrease of 14.5% in 2012
(1,127), compared with 2011 (1,318).

22
23AnnuAl report 2012
Annual Report2012
Statistical Annexes

24
Port State Control - taking Port State Control to the next level
Basic port State control figures 2012
Number of individual ships inspected
16,000
14,000
12,000
10,000
8,000
6,000
4,000
2,000
02003 2004 2005 2006 2007 2008 2009 2010 2011 2012
12,382
12,538
13,024
13,417 14
,182 15,
237
14,753
14,762
15,268
14,646
Number ofinspections
25,000
20,000
15,000
10,000
5,000
02003 2004 2005 2006 2007 2008 2009 2010 2011 2012
20,309
20,316
21,302
21,566 22
,877 24
,647
24,186
24,058
19,058
18,308
Number ofdetentions
1,600
1,400
1,200
1,000
800
600
400
200
02003 2004 2005 2006 2007 2008 2009 2010 2011 2012
1,431
1,187
994
1,174 1,2
501,220
1,059
790
688
669
25AnnuAl report 2012
Number ofdeficiencies
90,000
80,000
70,000
60,000
50,000
40,000
30,000
20,000
10,000
02003 2004 2005 2006 2007 2008 2009 2010 2011 2012
71,928
64,113
62,434
66,142 74
,713 83
,751
71,911
64,698
50,738
49,261
Detentions in %of inspections
8.00%
7.00%
6.00%
5.00%
4.00%
3.00%
2.00%
1.00%
0.00%2003 2004 2005 2006 2007 2008 2009 2010 2011 2012
7.05%
5.84%
4.67%
5.44%
5.46%
4.95%
4.38%
3.28% 3.6
1%3.65%
Note: The New Inspection Regime entered into force on the 1st of January 2011. Consequently the targeting of ships for
inspection has changed; inspection figures from 2011 onwards should not be compared to the ones from 2010 and before.

26
Port State Control - taking Port State Control to the next level
Inspection efforts 2012
HRS, SRS and LRS inspections per member state
Commitment
1,800
1,600
1,400
1,200
1,000
800
600
400
200
0
Belg
ium
Bulg
aria
Cana
da
Croa
tia
Cypr
us
Den
mar
k
Esto
nia
Finl
and
Fran
ce
Ger
man
y
Gre
ece
Icel
and
Irela
nd Italy
Latv
ia
Lith
uani
a
Mal
ta
Net
herla
nds,
the
Nor
way
Pola
nd
Port
ugal
Rom
ania
Russ
ian
Fede
ratio
n
Slov
ania
Spai
n
Swed
en
Uni
ted
King
dom
High Risk Ship Inspection Standard Risk Ship Inspection Low Risk Ship Inspection Ship Risk Profile unknown
Belg
ium
Bulg
aria
Cana
da
Croa
tia
Cypr
us
Den
mar
k
Esto
nia
Finl
and
Fran
ce
Ger
man
y
Gre
ece
Icel
and
Irel
and
Ital
y
Latv
ia
Lith
uani
a
Mal
ta
Net
herla
nds,
the
Nor
way
Pola
nd
Port
ugal
Rom
ania
Russ
ian
Fede
ratio
n
Slov
enia
Spai
n
Swed
en
Uni
ted
King
dom
1,800
1,600
1,400
1,200
1,000
800
600
400
200
0
Inspections
Commitment
1,06
4
540
948
218
103
318
164
259
1,18
5
1,14
5
1,14
2
68 265
1,42
9
266
174
177
1,52
2
561
411
422
725
881
197
1,62
4
442
1,45
8
1,10
9
272
653
234
212
511
284
274
1,19
9
1,13
2
663
67 249
1,25
8
404
311
162
1,50
7
546
461
550
412
640
188
1,36
7
577
1,38
4
CommitmentInspections relevant for commitment
27ANNUAL REPORT 2012
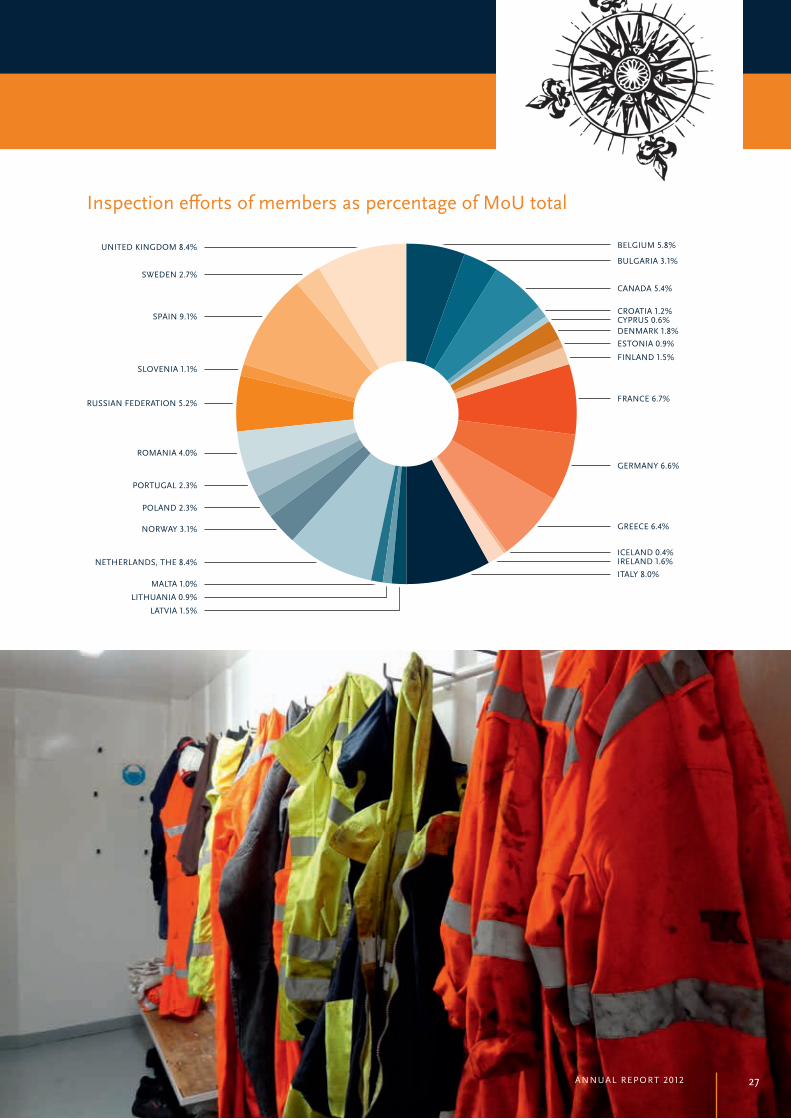
Inspection efforts of members as percentage of MoU total
BELGIUM 5.8%
SWEDEN 2.7%
SPAIN 9.1%
SLOVENIA 1.1%
RUSSIAN FEDERATION 5.2%
ROMANIA 4.0%
PORTUGAL 2.3%
POLAND 2.3%
NORWAY 3.1%
NETHERLANDS, THE 8.4%
MALTA 1.0%
LITHUANIA 0.9%
LATVIA 1.5%
UNITED KINGDOM 8.4%
BULGARIA 3.1%
CANADA 5.4%
CROATIA 1.2%CYPRUS 0.6%DENMARK 1.8%ESTONIA 0.9%
FINLAND 1.5%
FRANCE 6.7%
GERMANY 6.6%
GREECE 6.4%
ICELAND 0.4%IRELAND 1.6%ITALY 8.0%

28
Port State Control - taking Port State Control to the next level
FlagTo
tal n
r of
Insp
ectio
ns
Insp
ectio
ns w
ith
defic
ienc
ies
Insp
ectio
ns w
ith
dete
ntio
ns
Insp
ectio
ns w
ith R
O
rela
ted
deta
inab
le
defic
ienc
ies
% In
spec
tions
with
de
ficie
ncie
s
% D
eten
tions
% In
spec
tion
of
MoU
tota
l
% H
RS
% S
RS
% L
SR
% S
RP U
nkno
wn
Belgium 1,068 666 13 3 62.4 1.22 5.83 2.25 82.77 12.83 2.15
Bulgaria 567 418 25 11 73.7 4.41 3.10 17.64 71.25 6.17 4.94
Canada 983 522 27 4 53.1 2.75 5.37 2.24 65.41 10.07 22.28
Croatia 223 128 5 57.4 2.24 1.22 14.35 74.44 3.14 8.07
Cyprus 103 50 6 1 48.5 5.83 0.56 13.59 76.70 1.94 7.77
Denmark 334 139 4 41.6 1.20 1.82 2.10 80.84 9.58 7.49
Estonia 169 56 1 33.1 0.59 0.92 1.78 78.70 17.16 2.37
Finland 283 95 1 33.6 0.35 1.55 0.35 82.69 14.84 2.12
France 1,233 756 45 4 61.3 3.65 6.73 3.33 81.35 9.89 5.43
Germany 1,208 646 46 5 53.5 3.81 6.60 2.57 78.89 14.07 4.47
Greece 1,164 683 42 12 58.7 3.61 6.36 20.70 65.55 3.18 10.57
Iceland 70 19 0 27.1 0.00 0.38 4.29 84.29 7.14 4.29
Ireland 285 187 21 1 65.6 7.37 1.56 2.46 87.02 9.47 1.05
Italy 1,468 908 110 23 61.9 7.49 8.02 10.49 77.66 5.11 6.74
Latvia 267 63 2 1 23.6 0.75 1.46 3.75 83.15 7.87 5.24
Lithuania 173 89 5 1 51.4 2.89 0.94 3.47 84.39 8.67 3.47
Malta 176 116 12 2 65.9 6.82 0.96 3.41 78.98 1.70 15.91
Netherlands, the 1,531 762 36 3 49.8 2.35 8.36 2.48 77.40 10.84 9.27
Norway 572 182 11 31.8 1.92 3.12 2.10 79.37 8.04 10.49
Poland 425 325 17 2 76.5 4.00 2.32 3.06 86.35 4.94 5.65
Portugal 424 153 4 1 36.1 0.94 2.32 5.66 79.01 6.13 9.20
Romania 728 395 16 3 54.3 2.20 3.98 26.65 64.15 2.75 6.46
Russian Federation1 951 717 29 3 75.4 3.05 5.19 20.29 73.29 3.58 2.84
Slovenia 199 102 6 51.3 3.02 1.09 7.04 77.89 9.05 6.03
Spain 1,668 1,032 117 23 61.9 7.01 9.11 5.58 83.21 3.78 7.43
Sweden 493 168 5 34.1 1.01 2.69 1.01 78.09 16.02 4.87
United Kingdom 1,543 1,083 63 5 70.2 4.08 8.43 3.82 80.75 7.71 7.71
Total 18,308 10,460 669 108 57.1 3.65 100.00 7.36 77.37 7.92 7.35
1 Only inspections in the Russian ports of the Baltic, Azov, Kaspian and Barents Sea are included.
MoU port States’s individual contributions to the total amount of inspections

29ANNUAL REPORT 2012

1France
306
0
29
14
-1.95
2Germany
1,099
10
91
63
-1.82
3Hong Kong, China
1,559
19
126
92
-1.74
4Sweden
630
6
55
33
-1.71
5Greece
1,154
14
96
66
-1.71
6Denmark
1,233
16
102
71
-1.68
7Norway
1,697
24
137
101
-1.68
8Bahamas
2,868
47
224
178
-1.64
9Italy
1,384
21
113
81
-1.61
10Croatia
151
0
16
5
-1.61
11Finland
477
5
43
24
-1.60
12Isle of Man, UK
755
10
65
41
-1.59
13United Kingdom
1,683
28
136
100
-1.58
14Liberia
4,179
80
320
265
-1.57
15Netherlands, the
3,441
68
266
216
-1.53
16Singapore
1,408
25
115
82
-1.52
17Korea, Republic of
123
0
14
3
-1.44
18Marshall Islands
2,427
56
191
149
-1.38
19Belgium
250
3
25
10
-1.28
20China
238
3
24
10
-1.22
21Gibraltar, UK
1,072
26
89
61
-1.22
22Cyprus
2,157
61
171
131
-1.17
23Malta
4,922
159
374
315
-1.11
24Cayman Islands, UK
315
6
30
14
-1.06
25Latvia
91
0
11
2
-1.05
26Bermuda, UK
275
5
27
12
-1.03
27Ireland
127
1
14
4
-0.98
28Russian Federation
1,458
49
119
86
-0.91
29Estonia
81
0
10
1
-0.90
30Barbados
395
10
36
19
-0.89
31Japan
80
0
10
1
-0.88
32Panama
6,876
277
517
446
-0.85
33Spain
230
5
23
9
-0.78
34Iran, Islamic Republic of
107
1
12
3
-0.75
35Faroe Islands, DK
223
5
22
9
-0.73
36Antigua and Barbuda
4,364
202
334
277
-0.60
37Turkey
1,930
88
154
116
-0.53
38Poland
172
4
18
6
-0.52
39United States of America
236
7
23
10
-0.46
40Philippines
234
7
23
9
-0.44
41Lithuania
198
6
20
7
-0.32
42Portugal
439
19
40
21
-0.22
43Thailand
53
0
7
0
-0.18
44Vanuatu
203
7
21
8
-0.16
45Luxembourg
197
7
20
7
-0.09
30
PORT STATE CONTROL - TAKING PORT STATE CONTROL TO THE NExT LEVEL

1France
306
0
29
14
-1.95
2Germany
1,099
10
91
63
-1.82
3Hong Kong, China
1,559
19
126
92
-1.74
4Sweden
630
6
55
33
-1.71
5Greece
1,154
14
96
66
-1.71
6Denmark
1,233
16
102
71
-1.68
7Norway
1,697
24
137
101
-1.68
8Bahamas
2,868
47
224
178
-1.64
9Italy
1,384
21
113
81
-1.61
10Croatia
151
0
16
5
-1.61
11Finland
477
5
43
24
-1.60
12Isle of Man, UK
755
10
65
41
-1.59
13United Kingdom
1,683
28
136
100
-1.58
14Liberia
4,179
80
320
265
-1.57
15Netherlands, the
3,441
68
266
216
-1.53
16Singapore
1,408
25
115
82
-1.52
17Korea, Republic of
123
0
14
3
-1.44
18Marshall Islands
2,427
56
191
149
-1.38
19Belgium
250
3
25
10
-1.28
20China
238
3
24
10
-1.22
21Gibraltar, UK
1,072
26
89
61
-1.22
22Cyprus
2,157
61
171
131
-1.17
23Malta
4,922
159
374
315
-1.11
24Cayman Islands, UK
315
6
30
14
-1.06
25Latvia
91
0
11
2
-1.05
26Bermuda, UK
275
5
27
12
-1.03
27Ireland
127
1
14
4
-0.98
28Russian Federation
1,458
49
119
86
-0.91
29Estonia
81
0
10
1
-0.90
30Barbados
395
10
36
19
-0.89
31Japan
80
0
10
1
-0.88
32Panama
6,876
277
517
446
-0.85
33Spain
230
5
23
9
-0.78
34Iran, Islamic Republic of
107
1
12
3
-0.75
35Faroe Islands, DK
223
5
22
9
-0.73
36Antigua and Barbuda
4,364
202
334
277
-0.60
37Turkey
1,930
88
154
116
-0.53
38Poland
172
4
18
6
-0.52
39United States of America
236
7
23
10
-0.46
40Philippines
234
7
23
9
-0.44
41Lithuania
198
6
20
7
-0.32
42Portugal
439
19
40
21
-0.22
43Thailand
53
0
7
0
-0.18
44Vanuatu
203
7
21
8
-0.16
45Luxembourg
197
7
20
7
-0.09
31ANNUAL REPORT 2012
RANk FLAG INSPECTIONS 2010-2012
DETENTIONS 2010-2012
BLACk TO GREy LIMIT
GREy TO WHITE LIMIT
ExCESS FACTOR
WHITE LIST
1 France 306 0 29 14 -1.95
2 Germany 1,099 10 91 63 -1.82
3 Hong Kong, China 1,559 19 126 92 -1.74
4 Sweden 630 6 55 33 -1.71
5 Greece 1,154 14 96 66 -1.71
6 Denmark 1,233 16 102 71 -1.68
7 Norway 1,697 24 137 101 -1.68
8 Bahamas 2,868 47 224 178 -1.64
9 Italy 1,384 21 113 81 -1.61
10 Croatia 151 0 16 5 -1.61
11 Finland 477 5 43 24 -1.60
12 Isle of Man, UK 755 10 65 41 -1.59
13 United Kingdom 1,683 28 136 100 -1.58
14 Liberia 4,179 80 320 265 -1.57
15 Netherlands, the 3,441 68 266 216 -1.53
16 Singapore 1,408 25 115 82 -1.52
17 Korea, Republic of 123 0 14 3 -1.44
18 Marshall Islands 2,427 56 191 149 -1.38
19 Belgium 250 3 25 10 -1.28
20 China 238 3 24 10 -1.22
21 Gibraltar, UK 1,072 26 89 61 -1.22
22 Cyprus 2,157 61 171 131 -1.17
23 Malta 4,922 159 374 315 -1.11
24 Cayman Islands, UK 315 6 30 14 -1.06
25 Latvia 91 0 11 2 -1.05
26 Bermuda, UK 275 5 27 12 -1.03
27 Ireland 127 1 14 4 -0.98
28 Russian Federation 1,458 49 119 86 -0.91
29 Estonia 81 0 10 1 -0.90
30 Barbados 395 10 36 19 -0.89
31 Japan 80 0 10 1 -0.88
32 Panama 6,876 277 517 446 -0.85
33 Spain 230 5 23 9 -0.78
34 Iran, Islamic Republic of 107 1 12 3 -0.75
35 Faroe Islands, DK 223 5 22 9 -0.73
36 Antigua and Barbuda 4,364 202 334 277 -0.60
37 Turkey 1,930 88 154 116 -0.53
38 Poland 172 4 18 6 -0.52
39 United States of America 236 7 23 10 -0.46
40 Philippines 234 7 23 9 -0.44
41 Lithuania 198 6 20 7 -0.32
42 Portugal 439 19 40 21 -0.22
43 Thailand 53 0 7 0 -0.18
44 Vanuatu 203 7 21 8 -0.16
45 Luxembourg 197 7 20 7 -0.09
White list
32
46Kazakhstan
47
0
7
0
0.01
47Switzerland
89
2
11
2
0.03
48Curacao
372
18
35
17
0.03
49Malaysia
65
1
8
1
0.04
50Saudi Arabia
58
1
8
0
0.09
51India
115
4
13
3
0.10
52Belize
616
36
54
32
0.17
53Viet Nam
34
1
5
0
0.27
54Algeria
73
4
9
1
0.36
55Morocco
101
7
12
2
0.49
56Tunisia
57
4
8
0
0.50
57Egypt
85
6
10
2
0.51
58Slovakia
75
6
9
1
0.59
59Bulgaria
99
8
12
2
0.61
60Saint Vincent and the Grenadines
1,277
96
105
74
0.71
61Cook Islands
187
16
19
7
0.73
62Syrian Arab Republic
94
9
11
2
0.76
63Tuvalu
44
5
6
0
0.79
64Ukraine
308
29
29
14
0.97
PORT STATE CONTROL - TAKING PORT STATE CONTROL TO THE NExT LEVEL
33ANNUAL REPORT 2012
46Kazakhstan
47
0
7
0
0.01
47Switzerland
89
2
11
2
0.03
48Curacao
372
18
35
17
0.03
49Malaysia
65
1
8
1
0.04
50Saudi Arabia
58
1
8
0
0.09
51India
115
4
13
3
0.10
52Belize
616
36
54
32
0.17
53Viet Nam
34
1
5
0
0.27
54Algeria
73
4
9
1
0.36
55Morocco
101
7
12
2
0.49
56Tunisia
57
4
8
0
0.50
57Egypt
85
6
10
2
0.51
58Slovakia
75
6
9
1
0.59
59Bulgaria
99
8
12
2
0.61
60Saint Vincent and the Grenadines
1,277
96
105
74
0.71
61Cook Islands
187
16
19
7
0.73
62Syrian Arab Republic
94
9
11
2
0.76
63Tuvalu
44
5
6
0
0.79
64Ukraine
308
29
29
14
0.97
RANk FLAG INSPECTIONS 2010-2012
DETENTIONS 2010-2012
BLACk TO GREy LIMIT
GREy TO WHITE LIMIT
ExCESS FACTOR
GREy LIST
46 Kazakhstan 47 0 7 0 0.01
47 Switzerland 89 2 11 2 0.03
48 Curacao 372 18 35 17 0.03
49 Malaysia 65 1 8 1 0.04
50 Saudi Arabia 58 1 8 0 0.09
51 India 115 4 13 3 0.10
52 Belize 616 36 54 32 0.17
53 Viet Nam 34 1 5 0 0.27
54 Algeria 73 4 9 1 0.36
55 Morocco 101 7 12 2 0.49
56 Tunisia 57 4 8 0 0.50
57 Egypt 85 6 10 2 0.51
58 Slovakia 75 6 9 1 0.59
59 Bulgaria 99 8 12 2 0.61
60 Saint Vincent and the Grenadines 1,277 96 105 74 0.71
61 Cook Islands 187 16 19 7 0.73
62 Syrian Arab Republic 94 9 11 2 0.76
63 Tuvalu 44 5 6 0 0.79
64 Ukraine 308 29 29 14 0.97
Grey list

65Cambodia
629
59
55
MediumRisk
1.19
66Georgia
428
42
39
1.20
67Saint Kitts and Nevis
344
35
32
1.23
68Lebanon
82
11
10
1.31
69Libya
44
7
6
1.35
70Dominica
140
18
15
1.54
71Comoros
483
55
44
1.71
72Albania
159
21
17
1.72
73Moldova, Republic of
654
84
57
Medium to High Risk
2.26
74Honduras
45
9
6
2.39
75Sierra Leone
412
58
38
2.46
76Togo
231
35
23
2.50
77Tanzania, United Republic of
234
37
23
2.70
78Bolivia
39
10
6High Risk
3.66
34
PORT STATE CONTROL - TAKING PORT STATE CONTROL TO THE NExT LEVEL
35ANNUAL REPORT 2012
65Cambodia
629
59
55
MediumRisk
1.19
66Georgia
428
42
39
1.20
67Saint Kitts and Nevis
344
35
32
1.23
68Lebanon
82
11
10
1.31
69Libya
44
7
6
1.35
70Dominica
140
18
15
1.54
71Comoros
483
55
44
1.71
72Albania
159
21
17
1.72
73Moldova, Republic of
654
84
57
Medium to High Risk
2.26
74Honduras
45
9
6
2.39
75Sierra Leone
412
58
38
2.46
76Togo
231
35
23
2.50
77Tanzania, United Republic of
234
37
23
2.70
78Bolivia
39
10
6High Risk
3.66
RANk FLAG INSPECTIONS 2010-2012
DETENTIONS 2010-2012
BLACk TO GREy LIMIT
GREy TOWHITE LIMIT
ExCESSFACTOR
BLACK LIST
65 Cambodia 629 59 55
MediumRisk
1.19
66 Georgia 428 42 39 1.20
67 Saint Kitts and Nevis 344 35 32 1.23
68 Lebanon 82 11 10 1.31
69 Libya 44 7 6 1.35
70 Dominica 139 17 15 1.36
71 Comoros 483 55 44 1.71
72 Albania 159 21 17 1.72
73 Moldova, Republic of 654 84 57
Medium to High Risk
2.26
74 Honduras 45 9 6 2.39
75 Sierra Leone 412 58 38 2.46
76 Togo 231 35 23 2.50
77 Tanzania, United Republic of 234 37 23 2.70
78 Bolivia 39 10 6 High Risk 3.66
Black list

36
Port State Control - taking Port State Control to the next level
Flags meeting criteria for Low Risk Ships 2012
Flags meeting criteria for Low Risk Ships (as per 31 December 2012)
Bahamas Japan
Belgium Korea, Republic of
Bermuda, UK Latvia
Cayman Islands, UK Liberia
China Lithuania
Cyprus Luxembourg
Denmark Malta
Estonia Marshall Islands
Faroe Islands, DK Netherlands, the
Finland Norway
France Panama
Germany Poland
Gibraltar, UK Russian Federation
Greece Singapore
Hong Kong, China Spain
Ireland Sweden
Isle of Man, UK United Kingdom
Italy
To meet the criteria for Low Risk Ships, flags should be on the Paris MoU White list and have submitted evidence of having
undergone an IMO VIMSAS Audit.
Non listed flags having undergone IMO VIMSAS AuditAustralia Canada
Flags who’s total number of inspections over a 3-years rolling period does not meet the minimum of 30 are not included
in the Paris MoU White list. Consequently some flags cannot meet the criteria for their ships to qualify as Low Risk Ships
under the Paris MoU, despite having undergone the IMO VIMSAS Audit.
Non listed flags with no detentions 2010-2012*Angola (1) Chile (3) Iceland (7) Montenegro (1) Seychelles (16)
Australia (4) Colombia (1) Indonesia (5) Myanmar (5) Slovenia (6)
Austria (1) Dominican Republic (5) Israel (18) Pakistan (4) South Africa (1)
Bahrain (19) Falkland Islands (5) Jordan (1) Qatar (23) Sri Lanka (19)
Brazil (8) Grenada (1) Maldives (1) Sao Tome and Principe (1) Turkmenistan (9)
Flags who’s total number of inspections over a 3-years rolling period does not meet the minimum of 30 are not included in
the Paris MoU White, Grey and Black lists. The flags in this table had too few inspections to be included in the lists, but had
no detentions in the period 2010-2012.
* Note: The flags are listed in alphabetical order. The number of inspections over the period 2010-2012 taken into account is
shown in brackets. Flags on this list do not meet the criteria for Low Risk Ships.

37AnnuAl report 2012
Distribution of listed and non listed flags 2010-2012
White flags (86.9%)
Grey flags (6.1%)
Black flags (6.4%)
Not listed (0.6%)
SRI LANKA
JAMAICA
QATAR
BAHRAIN
ISRAEL
SEYCHELLES
KIRIBATI
CANADA
TAIWAN, CHINA
MONGOLIA
KOREA, DEMOCRATICPEOPLE'S REP.
GUINEAECUADOR
VENEZUELASOUTH AFRICA
SAO TOME AND PRINCIPEMONTENEGRO
MALDIVESJORDAN
GRENADACOLOMBIA
AUSTRIAANGOLAKUWAIT
UNITED ARAB EMIRATES
BRAZILICELAND
SLOVENIAROMANIA
MYANMAR
AZERBAIJANTURKMENISTAN
MAURITIUSBANGLADESH
INDONESIAFALKLAND ISLANDS
DOMINICAN REPUBLICPAKISTAN
AUSTRALIACHILE
CAPE VERDENIGERIA
38
Port State Control - taking Port State Control to the next level
Flag
Nr o
f In
spec
tions
Insp
ectio
ns
with
de
tent
ions
Insp
ectio
ns
with
de
ficie
ncie
s
Nr o
f In
divi
dual
sh
ips
insp
ecte
d
% o
f In
spec
tions
w
ith
dete
ntio
ns
% o
f In
spec
tions
w
ith
defic
ienc
ies
Albania 42 2 37 15 4.76 88.10
Algeria 23 1 17 18 4.35 73.91
Angola 1 0 1 1 0.00 100.00
Antigua and Barbuda 1,301 71 820 880 5.46 63.03
Australia 3 0 2 3 0.00 66.67
Azerbaijan 2 0 0 2 0.00 0.00
Bahamas 803 12 424 642 1.49 52.80
Bahrain 6 0 3 4 0.00 50.00
Bangladesh 2 1 1 2 50.00 50.00
Barbados 120 5 83 82 4.17 69.17
Belgium 89 2 41 77 2.25 46.07
Belize 191 15 157 138 7.85 82.20
Bermuda, UK 87 2 40 73 2.30 45.98
Bolivia 9 1 6 9 11.11 66.67
Brazil 2 0 1 2 0.00 50.00
Bulgaria 16 1 13 13 6.25 81.25
Cambodia 175 13 166 107 7.43 94.86
Canada 5 0 3 4 0.00 60.00
Cayman Islands, UK 119 2 61 115 1.68 51.26
Chile 1 0 0 1 0.00 0.00
China 69 0 28 64 0.00 40.58
Colombia 1 0 1 1 0.00 100.00
Comoros 122 16 120 73 13.11 98.36
Cook Islands 76 7 57 48 9.21 75.00
Croatia 49 0 28 42 0.00 57.14
Curacao 85 4 59 59 4.71 69.41
Cyprus 632 24 351 476 3.80 55.54
Denmark 331 7 145 271 2.11 43.81
Dominica 35 6 26 24 17.14 74.29
Dominican Republic 2 0 1 1 0.00 50.00
Ecuador 2 1 1 1 50.00 50.00
Egypt 23 1 19 19 4.35 82.61
Estonia 26 0 9 18 0.00 34.62
Falkland Islands, UK 2 0 0 2 0.00 0.00
Faroe Islands, DK 76 2 36 59 2.63 47.37
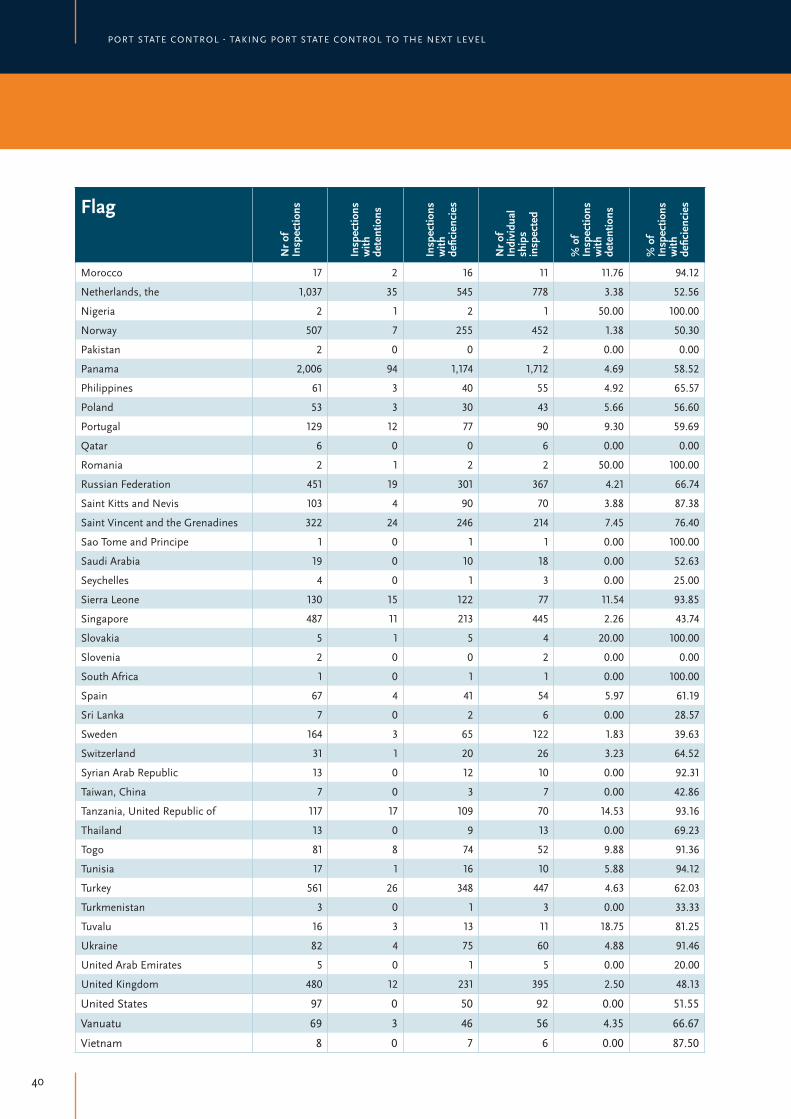
Inspections, detentions and deficiencies 2012

39AnnuAl report 2012
Flag
Nr o
f In
spec
tions
Insp
ectio
ns
with
de
tent
ions
Insp
ectio
ns
with
de
ficie
ncie
s
Nr o
f In
divi
dual
sh
ips
insp
ecte
d
% o
f In
spec
tions
w
ith
dete
ntio
ns
% o
f In
spec
tions
w
ith
defic
ienc
ies
Finland 122 1 51 99 0.82 41.80
France 93 0 54 76 0.00 58.06
Georgia 8 1 7 6 12.50 87.50
Germany 280 5 135 230 1.79 48.21
Gibraltar, UK 290 10 144 212 3.45 49.66
Greece 311 3 115 295 0.96 36.98
Honduras 8 2 7 6 25.00 87.50
Hong Kong, China 532 7 256 492 1.32 48.12
Iceland 2 0 1 2 0.00 50.00
India 26 0 14 23 0.00 53.85
Indonesia 1 0 1 1 0.00 100.00
Iran, Islamic Republic of 23 0 15 20 0.00 65.22
Ireland 19 0 15 17 0.00 78.95
Isle of Man, UK 247 3 97 225 1.21 39.27
Israel 5 0 2 5 0.00 40.00
Italy 421 5 230 351 1.19 54.63
Jamaica 4 0 3 2 0.00 75.00
Japan 25 0 9 21 0.00 36.00
Jordan 1 0 1 1 0.00 100.00
Kazakhstan 18 0 6 18 0.00 33.33
Kiribati 6 1 5 3 16.67 83.33
Korea, Democratic People's Republic of
3 0 3 3 0.00 100.00
Korea, Republic of 39 0 30 38 0.00 76.92
Kuwait 6 1 2 6 16.67 33.33
Latvia 24 0 16 13 0.00 66.67
Lebanon 28 2 25 19 7.14 89.29
Liberia 1,385 21 726 1,214 1.52 52.42
Libya 14 0 5 12 0.00 35.71
Lithuania 57 3 34 38 5.26 59.65
Luxembourg 60 5 38 43 8.33 63.33
Malaysia 29 0 17 22 0.00 58.62
Malta 1,447 46 826 1,099 3.18 57.08
Marshall Islands 833 14 360 757 1.68 43.22
Mauritius 5 0 3 5 0.00 60.00
Moldova, Republic of 217 26 191 121 11.98 88.02
Mongolia 4 2 4 4 50.00 100.00
Montenegro 1 0 0 1 0.00 0.00
40
Port State Control - taking Port State Control to the next level
Flag
Nr o
f In
spec
tions
Insp
ectio
ns
with
de
tent
ions
Insp
ectio
ns
with
de
ficie
ncie
s
Nr o
f In
divi
dual
sh
ips
insp
ecte
d
% o
f In
spec
tions
w
ith
dete
ntio
ns
% o
f In
spec
tions
w
ith
defic
ienc
ies
Morocco 17 2 16 11 11.76 94.12
Netherlands, the 1,037 35 545 778 3.38 52.56
Nigeria 2 1 2 1 50.00 100.00
Norway 507 7 255 452 1.38 50.30
Pakistan 2 0 0 2 0.00 0.00
Panama 2,006 94 1,174 1,712 4.69 58.52
Philippines 61 3 40 55 4.92 65.57
Poland 53 3 30 43 5.66 56.60
Portugal 129 12 77 90 9.30 59.69
Qatar 6 0 0 6 0.00 0.00
Romania 2 1 2 2 50.00 100.00
Russian Federation 451 19 301 367 4.21 66.74
Saint Kitts and Nevis 103 4 90 70 3.88 87.38
Saint Vincent and the Grenadines 322 24 246 214 7.45 76.40
Sao Tome and Principe 1 0 1 1 0.00 100.00
Saudi Arabia 19 0 10 18 0.00 52.63
Seychelles 4 0 1 3 0.00 25.00
Sierra Leone 130 15 122 77 11.54 93.85
Singapore 487 11 213 445 2.26 43.74
Slovakia 5 1 5 4 20.00 100.00
Slovenia 2 0 0 2 0.00 0.00
South Africa 1 0 1 1 0.00 100.00
Spain 67 4 41 54 5.97 61.19
Sri Lanka 7 0 2 6 0.00 28.57
Sweden 164 3 65 122 1.83 39.63
Switzerland 31 1 20 26 3.23 64.52
Syrian Arab Republic 13 0 12 10 0.00 92.31
Taiwan, China 7 0 3 7 0.00 42.86
Tanzania, United Republic of 117 17 109 70 14.53 93.16
Thailand 13 0 9 13 0.00 69.23
Togo 81 8 74 52 9.88 91.36
Tunisia 17 1 16 10 5.88 94.12
Turkey 561 26 348 447 4.63 62.03
Turkmenistan 3 0 1 3 0.00 33.33
Tuvalu 16 3 13 11 18.75 81.25
Ukraine 82 4 75 60 4.88 91.46
United Arab Emirates 5 0 1 5 0.00 20.00
United Kingdom 480 12 231 395 2.50 48.13
United States 97 0 50 92 0.00 51.55
Vanuatu 69 3 46 56 4.35 66.67
Vietnam 8 0 7 6 0.00 87.50

41ANNUAL REPORT 2012
42
Port State Control - taking Port State Control to the next level
Flag
Nr o
f In
spec
tions
Insp
ectio
ns
with
de
tent
ions
% o
f In
spec
tions
w
ith
dete
ntio
ns
Exce
ss o
f av
erag
e 20
12
Det
entio
ns %
20
11
Exce
ss o
f av
erag
e 20
11
Cyprus 632 24 3.80 0.15 2.12 -1.49
Saint Kitts and Nevis 103 4 3.88 0.23 7.92 4.31
Barbados 120 5 4.17 0.52 1.85 -1.76
Russian Federation 451 19 4.21 0.56 1.85 -1.76
Algeria 23 1 4.35 0.70 3.85 0.24
Egypt 23 1 4.35 0.70 10.34 6.73
Vanuatu 69 3 4.35 0.70 2.60 -1.01
Turkey 561 26 4.63 0.98 4.78 1.17
Panama 2,006 94 4.69 1.04 4.39 0.78
Curacao 85 4 4.71 1.06 6.42 2.81
Albania 42 2 4.76 1.11 15.91 12.30
Ukraine 82 4 4.88 1.23 10.42 6.81
Philippines 61 3 4.92 1.27 2.27 -1.34
Lithuania 57 3 5.26 1.61 1.52 -2.09
Antigua and Barbuda 1,301 71 5.46 1.81 4.67 1.06
Poland 53 3 5.66 2.01 0.00 -3.61
Spain 67 4 5.97 2.32 0.00 -3.61
Lebanon 28 2 7.14 3.49 19.23 15.62
Cambodia 175 13 7.43 3.78 8.33 4.72
Saint Vincent and the Grenadines 322 24 7.45 3.80 9.39 5.78
Belize 191 15 7.85 4.20 7.14 3.53
Luxembourg 60 5 8.33 4.68 0.00 -3.61
Cook Islands 76 7 9.21 5.56 7.02 3.41
Portugal 129 12 9.30 5.65 0.00 -3.61
Togo 81 8 9.88 6.23 12.50 8.89
Sierra Leone 130 15 11.54 7.89 14.75 11.14
Moldova, Republic of 217 26 11.98 8.33 9.69 6.08
Comoros 122 16 13.11 9.46 7.25 3.64
Tanzania, United Republic of 117 17 14.53 10.88 23.08 19.47
Dominica 35 6 17.14 13.49 17.78 14.17
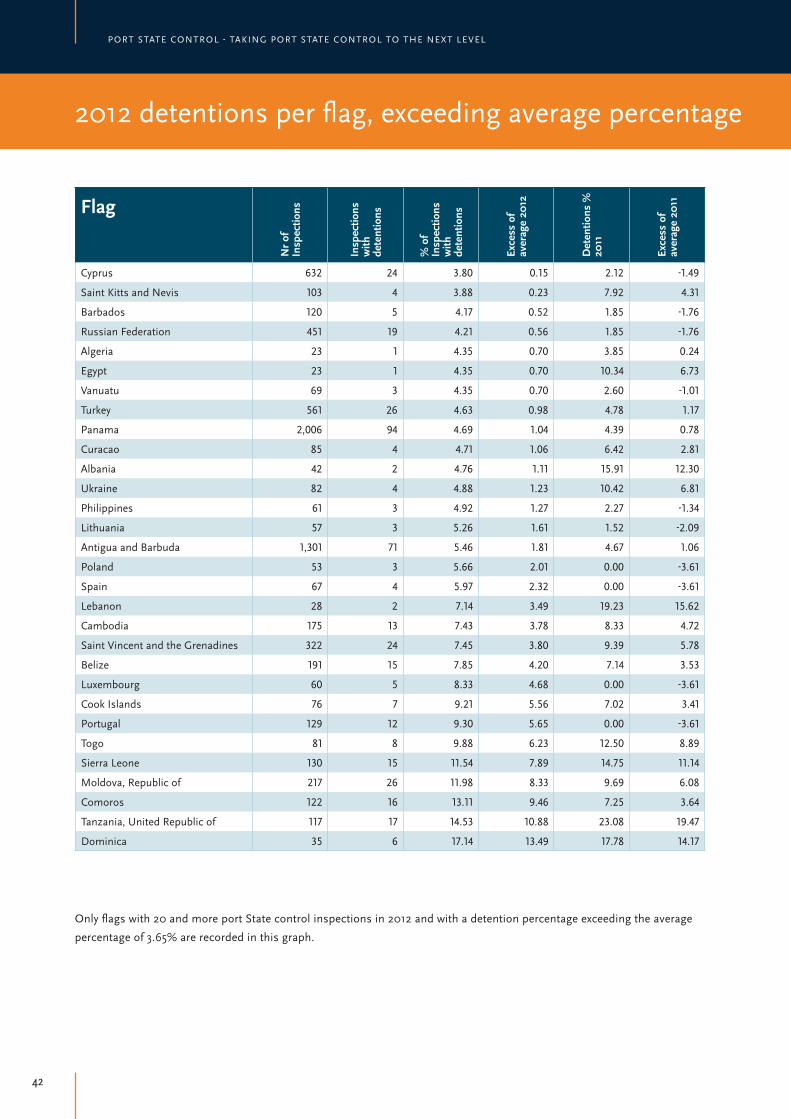
Only flags with 20 and more port State control inspections in 2012 and with a detention percentage exceeding the average
percentage of 3.65% are recorded in this graph.
2012 detentions per flag, exceeding average percentage

43AnnuAl report 2012
■ Only flags with 20 and more port State control inspections in 2012 and with a detention percentage exceeding the average
percentage of 3.65% are recorded in this graph. In 2011 the average detentions percentage was 3.61%.
■ The grey column represents the 2012 average detention percentage (3.65%).
Detentions per flag in 2012 exceeding average percentage
Cyprus
Saint Kitts and Nevis
Barbados
Russian Federation
Vanuatu
Egypt
Algeria
Turkey
Panama
Curacao
Albania
Ukraine
Philippines
Lithuania
Antigua and Barbuda
Poland
Spain
Lebanon
Cambodia
Saint Vincent and the Grenadines
Belize
Luxembourg
Cook Islands
Portugal
Togo
Sierra Leone
Moldova, Republic of
Comoros
Tanzania, United Republic of
Dominica
0.00 5.00 10.00 15.00 20.00 25.00
Detention percentage 2012
Detention percentage 2011
Average dentention percentage 2012

44
Port State Control - taking Port State Control to the next level
Inspections and detentions 2012 PER SHIP TYPE
Ship type
Nr o
f Ins
pect
ions
Insp
ectio
ns w
ith
defic
ienc
ies
% o
f ins
pect
ions
w
ith d
efici
enci
es
Nr o
f Ind
ivid
ual
ship
s in
spec
ted
Insp
ectio
ns w
ith
dete
ntio
ns
% o
f det
entio
ns
to in
spec
tions
20
12
% o
f det
entio
ns
to in
spec
tions
20
11
% o
f det
entio
ns
to in
spec
tions
20
10
+ /
- ave
rage
de
tent
ion
%
Bulk carrier 3,191 1,764 55 2,828 83 2.60 3.25 2.77 2.87
Chemical tanker 1,498 694 46 1,239 25 1.67 1.47 2.06 1.73
Combination carrier 28 18 64 27 0 0.00 0.00 0.00 0.00
Container 1,793 907 51 1,503 47 2.62 1.40 0.94 1.65
Gas carrier 364 167 46 324 4 1.10 1.12 1.12 1.11
General cargo/multipurpose 6,143 4,124 67 4,304 368 5.99 6.02 5.47 5.83
Heavy load 31 17 55 27 3 9.68 0.00 0.00 3.23
High speed passenger craft 70 42 60 43 2 2.86 1.32 1.12 1.77
NLS tanker 113 41 36 98 0 0.00 2.17 0.68 0.95
Offshore supply 425 234 55 395 9 2.12 2.16 1.74 2.01
Oil tanker 1,326 491 37 1,210 16 1.21 1.28 0.93 1.14
Other 109 80 73 84 6 5.50 5.97 2.35 4.61
Other special activities 852 502 59 778 37 4.34 4.08 2.83 3.75
Passenger ship 349 180 52 257 6 1.72 4.42 1.60 2.58
Refrigerated cargo 378 273 72 306 16 4.23 4.12 3.08 3.81
Ro-Ro cargo 797 414 52 669 29 3.64 2.52 3.00 3.05
Ro-Ro passenger ship 545 348 64 293 10 1.83 1.70 1.91 1.81
Special purpose ship 119 71 60 100 2 1.68 1.68 3.23 2.20
Tug 177 93 53 161 6 3.39 3.33 0.00 2.24
Note: Since 2011 ship types are published separate and not longer grouped in categories. The data of 2010 has been
regrouped accordingly and is therefore not comparable with the data as published in the Annual Report 2010.

45AnnuAl report 2012
Note: Since 2011 ship types are published separate and not longer grouped in categories. The data of 2010 has been
regrouped accordingly and is therefore not comparable with the data as published in the Annual Report 2010.
12
10
8
6
4
2
0
% det. 2010
% det. 2011
% det. 2012
Average detention % 2012
Hea
vy lo
ad
Gen
eral
car
go/m
ultip
urpo
se
Oth
er
Oth
er s
peci
al a
ctiv
ities
Refr
iger
ated
car
go
Ro-R
o ca
rgo
Tug
Hig
h sp
eed
pass
enge
r cra
ft
Cont
aine
r
Bulk
car
rier
Offs
hore
sup
ply
Ro-R
o pa
ssen
ger s
hip
Pass
enge
r shi
p
Spec
ial p
urpo
se s
hip
Che
mic
al ta
nker
Oil
tank
er
Gas
car
rier
NLS
tank
er
Com
bina
tion
carr
ier

46
Port State Control - taking Port State Control to the next level
Major categories of deficiencies 2010-2012
2010 2011 2012
Def. Main Group Category of deficiencies Def Def % Def Def % Def Def %
Certificates & Documentation
Crew Certificates 1,684 2.59 1,101 2.15 1,005 2.04
Documents 4,349 6.69 3,491 6.83 3,297 6.69
Ship Certificates 4,117 6.33 3,046 5.96 2,856 5.80
Structural Condition 2,952 4.54 2,808 5.49 2,216 4.50
Water/Weathertight condition 2,851 4.38 2,597 5.08 2,121 4.31
Emergency Systems 2,191 3.37 1,952 3.82 2,029 4.12
Radio Communication 2,200 3.38 1,704 3.33 1,476 3.00
Cargo operations including equipment 317 0.49 332 0.65 319 0.65
Fire safety 7,687 11.82 6,591 12.89 7,488 15.20
Alarms 497 0.76 464 0.91 398 0.81
Working and Living ConditionsLiving Conditions 2,932 4.51 2,313 4.52 2,182 4.43
Working conditions 7,057 10.85 5,252 10.27 5,067 10.29
Safety of Navigation 8,654 13.30 6,528 12.76 6,816 13.84
Life saving appliances 5,636 8.66 4,782 9.35 4,393 8.92
Dangerous goods 224 0.34 125 0.24 98 0.20
Propulsion and auxiliary machinery 4,239 6.52 2,951 5.77 2,442 4.96
Pollution prevention
Anti Fouling 36 0.06 15 0.03 23 0.05
Marpol Annex I 1,586 2.44 1,318 2.58 1,127 2.29
Marpol Annex II 14 0.02 36 0.07 29 0.06
Marpol Annex III 8 0.01 18 0.04 12 0.02
Marpol Annex IV 298 0.46 253 0.49 324 0.66
Marpol Annex V 402 0.62 347 0.68 303 0.62
Marpol Annex VI 293 0.45 358 0.70 449 0.91
ISM 3,458 5.32 1,644 3.21 1,736 3.52
ISPS 868 1.33 518 1.01 485 0.98
Other 495 0.76 602 1.18 570 1.16
Note: In 2011 a new coding system has taken effect. The data of 2010 has been regrouped accordingly and is therefore not
comparable with the data as published in the Annual Report 2010.

ANNUAL REPORT 2012 47
Major categories of deficiencies 2010-2012
Top 5 categories of deficiencies 2012
Category of deficiencies Deficiencies % Deficiencies
Fire safety 7,488 15.12%
Safety of Navigation 6,816 13.77%
Working and Living Conditions - Working Conditions 5,067 10.23%
Life saving appliances 4,393 8.87%
Certificates and Documentation - Document 3,297 6.66%
Top 5 categories of deficiencies 2012
Deficiencies Deficiencies % Deficiencies
ISM 1,736 3.51%
Nautical publications 1,436 2.90%
Charts 1,370 2.77%
Fire doors/openings in fire-resisting divisions 1,124 2.27%
Oil record book 924 1.87%
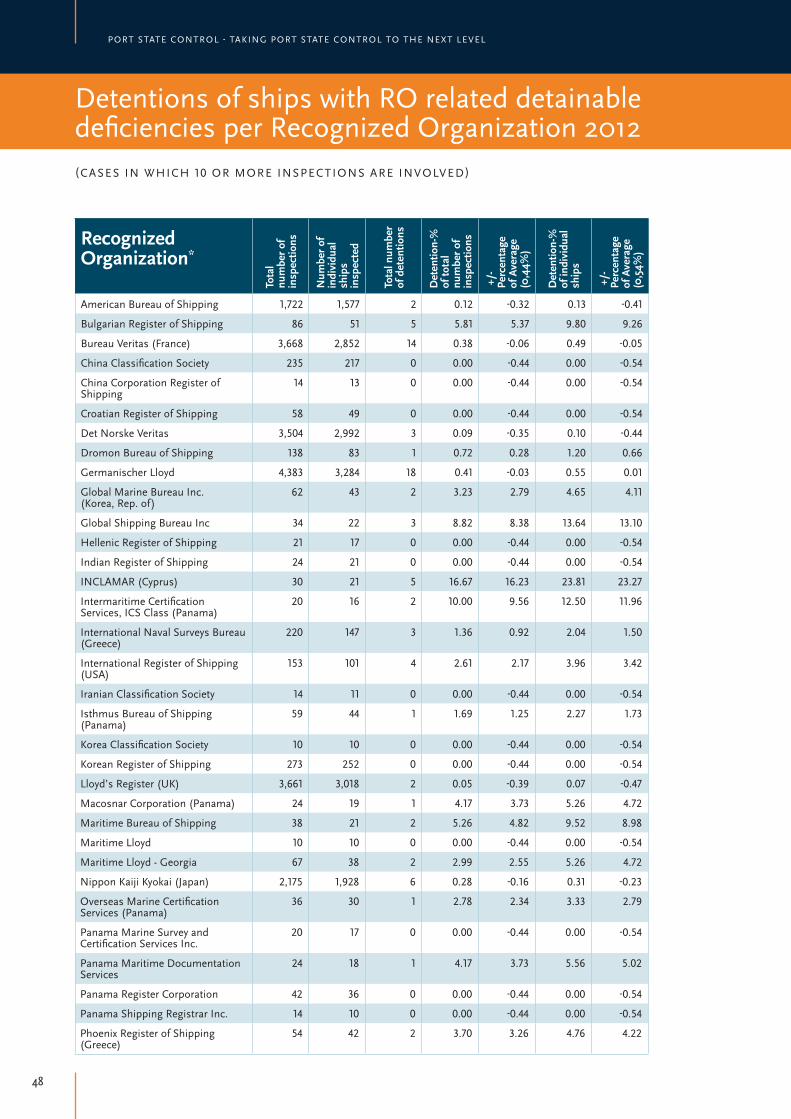
48
Port State Control - taking Port State Control to the next level
Recognized Organization*
Tota
l nu
mbe
r of
insp
ectio
ns
Num
ber o
f in
divi
dual
sh
ips
insp
ecte
d
Tota
l num
ber
of d
eten
tions
Det
entio
n-%
of
tota
l nu
mbe
r of
insp
ectio
ns
+/-
Pe
rcen
tage
of
Ave
rage
(0
,44%
)
Det
entio
n-%
of
indi
vidu
al
ship
s
+/-
Pe
rcen
tage
of
Ave
rage
(0
,54%
)
American Bureau of Shipping 1,722 1,577 2 0.12 -0.32 0.13 -0.41
Bulgarian Register of Shipping 86 51 5 5.81 5.37 9.80 9.26
Bureau Veritas (France) 3,668 2,852 14 0.38 -0.06 0.49 -0.05
China Classification Society 235 217 0 0.00 -0.44 0.00 -0.54
China Corporation Register of Shipping
14 13 0 0.00 -0.44 0.00 -0.54
Croatian Register of Shipping 58 49 0 0.00 -0.44 0.00 -0.54
Det Norske Veritas 3,504 2,992 3 0.09 -0.35 0.10 -0.44
Dromon Bureau of Shipping 138 83 1 0.72 0.28 1.20 0.66
Germanischer Lloyd 4,383 3,284 18 0.41 -0.03 0.55 0.01
Global Marine Bureau Inc. (Korea, Rep. of)
62 43 2 3.23 2.79 4.65 4.11
Global Shipping Bureau Inc 34 22 3 8.82 8.38 13.64 13.10
Hellenic Register of Shipping 21 17 0 0.00 -0.44 0.00 -0.54
Indian Register of Shipping 24 21 0 0.00 -0.44 0.00 -0.54
INCLAMAR (Cyprus) 30 21 5 16.67 16.23 23.81 23.27
Intermaritime Certification Services, ICS Class (Panama)
20 16 2 10.00 9.56 12.50 11.96
International Naval Surveys Bureau (Greece)
220 147 3 1.36 0.92 2.04 1.50
International Register of Shipping (USA)
153 101 4 2.61 2.17 3.96 3.42
Iranian Classification Society 14 11 0 0.00 -0.44 0.00 -0.54
Isthmus Bureau of Shipping (Panama)
59 44 1 1.69 1.25 2.27 1.73
Korea Classification Society 10 10 0 0.00 -0.44 0.00 -0.54
Korean Register of Shipping 273 252 0 0.00 -0.44 0.00 -0.54
Lloyd’s Register (UK) 3,661 3,018 2 0.05 -0.39 0.07 -0.47
Macosnar Corporation (Panama) 24 19 1 4.17 3.73 5.26 4.72
Maritime Bureau of Shipping 38 21 2 5.26 4.82 9.52 8.98
Maritime Lloyd 10 10 0 0.00 -0.44 0.00 -0.54
Maritime Lloyd - Georgia 67 38 2 2.99 2.55 5.26 4.72
Nippon Kaiji Kyokai (Japan) 2,175 1,928 6 0.28 -0.16 0.31 -0.23
Overseas Marine Certification Services (Panama)
36 30 1 2.78 2.34 3.33 2.79
Panama Marine Survey and Certification Services Inc.
20 17 0 0.00 -0.44 0.00 -0.54
Panama Maritime Documentation Services
24 18 1 4.17 3.73 5.56 5.02
Panama Register Corporation 42 36 0 0.00 -0.44 0.00 -0.54
Panama Shipping Registrar Inc. 14 10 0 0.00 -0.44 0.00 -0.54
Phoenix Register of Shipping (Greece)
54 42 2 3.70 3.26 4.76 4.22
Detentions of ships with RO related detainable deficiencies per Recognized Organization 2012(CASES IN WHICH 10 OR MORE INSPECTIONS ARE INVOLVED)

49AnnuAl report 2012
Recognized Organization*
Tota
l nu
mbe
r of
insp
ectio
ns
Num
ber o
f in
divi
dual
sh
ips
insp
ecte
d
Tota
l nu
mbe
r of
dete
ntio
ns
Det
entio
n-%
of
tota
l nu
mbe
r of
insp
ectio
ns
+/-
Pe
rcen
tage
of
Ave
rage
(0
,44%
)
Det
entio
n-%
of
indi
vidu
al
ship
s
+/-
Pe
rcen
tage
of
Ave
rage
(0
,54%
)
Polski Rejestr Statkow (Polish Register of Shipping)
183 131 2 1.09 0.65 1.53 0.99
Register of Shipping (Albania) 43 16 1 2.33 1.89 6.25 5.71
Registro Italiano Navale 953 759 0 0.00 -0.44 0.00 -0.54
Russian Maritime Register of Shipping 1,414 1,070 11 0.78 0.34 1.03 0.49
Shipping Register of Ukraine 215 138 7 3.26 2.82 5.07 4.53
Turkish Lloyd 315 244 1 0.32 -0.12 0.41 -0.13
Universal Shipping Bureau Inc. (Panama) 43 36 0 0.00 -0.44 0.00 -0.54
Venezuelan Register of Shipping 31 26 0 0.00 -0.44 0.00 -0.54
* Where a country is shown after a recognized organization this indicates its location and not necessarily any connection
with the maritime administration of that country.
* Only ROs with 10 and more port State control inspections in 2012 and with a detention percentage exceeding the average
percentage of 0.44% are recorded in this graph. In 2011 the average detentions percentage was 0.35%.
* The grey column represents the 2012 average detention percentage (0.44%).
% of detentions of ships with RO related detainable deficiencies per Recognized Organization 2011-2012(CASES IN WHICH MORE THAN 10 INSPECTIONS ARE INVOLVED )
Dromon Bureau of Shipping
Russian Maritime Register of Shipping
Polski Rejestr Statkow (Polish Register of Shipping)
International Naval Surveys Bureau
Isthmus Bureau of Shipping, S.A.
Register of Shipping
International Register of Shipping
Overseas Marine Certification Services
Maritime Lloyd - Georgia
Global Marine Bureau Inc.
Shipping Register of Ukraine
Phoenix Register of Shipping
Panama Maritime Documentation Services
Macosnar Corporation
Maritime Bureau of Shipping
Bulgarian Register of Shipping
Global Shipping Bureau Inc
Intermaritime Certification Services, ICS Class
INCLAMAR
-2% 0% 2% 4% 6% 8% 10% 12% 14% 16%
Average detention percentage 2012 (0.44%)
+/- Percentage of Average 2011 (0.35%)
+/- Percentage of Average 2012 (0.44%)

50
Port State Control - taking Port State Control to the next level
Recognized Organization*
Insp
ectio
ns
Det
entio
ns
Low
/med
ium
lim
it
Med
ium
/ h
igh
limit
Exce
ss F
acto
r
Perf
orm
ance
leve
l
American Bureau of Shipping (USA) ABS 5,690 3 132 96 -1.92
high
Det Norske Veritas DNV 11,602 8 257 207 -1.91
Lloyd's Register (UK) LR 12,636 9 279 226 -1.91
China Classification Society CCS 816 0 23 9 -1.86
Korean Register of Shipping (Korea, Rep. of) KRS 815 0 23 9 -1.86
Registro Italiano Navale RINA 3,036 4 74 48 -1.79
Nippon Kaiji Kyokai (Japan) NKK 6,726 13 154 115 -1.75
Germanischer Lloyd GL 14,495 37 318 262 -1.70
Bureau Veritas (France) BV 12,455 32 275 223 -1.69
Turkish Lloyd TL 1,219 3 33 16 -1.46
Russian Maritime Register of Shipping RMRS 5,151 21 120 86 -1.46
Polski Rejestr Statkow PRS 648 4 19 7 -0.54
Croatian Register of Shipping CRS 198 1 8 0 0.10
medium
Indian Register of Shipping IRS 109 0 5 0 0.12
Hellenic Register of Shipping (Greece) HRS 212 2 8 0 0.21
International Naval Surveys Bureau (Greece) INSB 782 12 23 9 0.24
Panama Register Corporation PRC 125 1 6 0 0.26
Isthmus Bureau of Shipping (Panama) IBS 229 3 9 1 0.30
Dromon Bureau of Shipping DBS 198 3 8 0 0.37
Maritime Lloyd -Georgia MLG 90 2 4 0 0.54
Universal Shipping Bureau Inc. (Panama) USB 171 4 7 0 0.58
Intermaritime Certification Service, S.A. (Panama)
ICS 61 2 4 0 0.67
Global Marine Bureau Inc. GMB 100 3 5 0 0.68
Panama Maritime Documentation Services PMDS 100 3 5 0 0.68
Shipping Register of Ukraine SRU 744 19 22 8 0.80
International Register of Shipping (USA) IS 757 21 22 8 0.93
Bulgarski Koraben Registar BRS 337 15 11 2 1.82 low
Register of Shipping (Albania) RSA 160 10 7 0 2.54
very lowINCLAMAR (Cyprus) INCLAMAR 93 7 5 0 2.75
Phoenix Register of Shipping (Greece) PHRS 138 10 6 0 3.11
* Where a country is shown after a Recognized Organization this indicates its location and not necessarily any connection
with the maritime administration of that country.
Recognized Organization performance table 2010-2012

51AnnuAl report 2012
Recognized Organization
Cert
ifica
tes
RO d
etde
f
%
defe
icie
ncie
s /
cert
ifica
tes
American Bureau of Shipping ABS 11,661 4 0.03
Bulgarian Register of Shipping BRS 792 15 1.89
Bureau Veritas BV 23,787 30 0.13
China Classification Society CCS 1,859 0 0.00
China Corporation Register of Shipping CCRS 93 0 0.00
Croatian Register of Shipping CRS 475 0 0.00
Det Norske Veritas DNV 23,683 5 0.02
Dromon Bureau of Shipping DBS 1,211 1 0.08
Germanischer Lloyd GL 34,588 30 0.09
Global Marine Bureau Inc. GMB 512 5 0.98
Global Shipping Bureau Inc GSB 275 19 6.91
Hellenic Register of Shipping HRS 82 0 0.00
Indian Register of Shipping IRS 62 0 0.00
INCLAMAR INCLAMAR 242 10 4.13
Intermaritime Certification Services, ICS Class ICS 112 5 4.46
International Naval Surveys Bureau INSB 1,522 7 0.46
International Register of Shipping IS 1,035 10 0.97
Iranian Classification Society IRCS 78 0 0.00
Isthmus Bureau of Shipping, S.A. IBS 280 1 0.36
Korea Classification Society KCS 43 0 0.00
Korean Register of Shipping KRS 2,422 0 0.00
Lloyd's Register LR 21,933 4 0.02
Macosnar Corporation MC 173 3 1.73
Maritime Bureau of Shipping MBS 378 4 1.06
Maritime Lloyd ML 86 0 0.00
Maritime Lloyd - Georgia MLG 591 5 0.85
Nippon Kaiji Kyokai NKK 18,077 15 0.08
Overseas Marine Certification Services OMCS 140 3 2.14
Panama Marine Survey and Certification Services Inc. PMSCS 100 0 0.00
Panama Maritime Documentation Services PMDS 124 11 8.87
Panama Register Corporation PRC 162 0 0.00
Panama Shipping Registrar Inc. PSR 100 0 0.00
Phoenix Register of Shipping PHRS 374 2 0.53
Polski Rejestr Statkow (Polish Register of Shipping) PRS 1,124 6 0.53
Register of Shipping RSA 446 10 2.24
Registro Italiano Navale RINA 5,636 0 0.00
Russian Maritime Register of Shipping RMRS 11,236 23 0.20
Shipping Register of Ukraine SRU 1,700 9 0.53
Turkish Lloyd TL 1,525 1 0.07
Universal Shipping Bureau Inc. USB 215 0 0.00
Venezuelan Register of Shipping VRS 274 0 0.00
Total 170,480 267 0.16
Number of certificates covering RO responsible detainable deficiencies 2012

52
Port State Control - taking Port State Control to the next level
Recognized Organization
Bulk
Car
riers
Che
mic
al T
anke
rs
Gen
eral
Dry
Car
go
0 - 5 6 - 11 ≥ 18 0 - 5 0 - 5 6 - 11 12 - 17 ≥ 18
American Bureau of Shipping ABS 3 1
Bulgarian Register of Shipping BRS 2 13
Bureau Veritas BV 4 1 1 2 2 9
Det Norske Veritas DNV 2
Dromon Bureau of Shipping DBS 1
Germanischer Lloyd GL 1 5 11
Global Marine Bureau Inc. GMB 5
Global Shipping Bureau Inc GSB 19
INCLAMAR INCLAMAR 8 2
Intermaritime Certification Services, ICS Class ICS 3
International Naval Surveys Bureau INSB 2
International Register of Shipping IS 10
Isthmus Bureau of Shipping, S.A. IBS 1
Lloyd's Register LR 2
Maritime Bureau of Shipping MBS 4
Maritime Lloyd - Georgia MLG 5
Nippon Kaiji Kyokai NKK 3 1 8
Overseas Marine Certification Services OMCS 3
Panama Maritime Documentation Services PMDS 11
Phoenix Register of Shipping PHRS 2
Polski Rejestr Statkow (Polish Register of Shipping) PRS 2
Register of Shipping RSA 10
Russian Maritime Register of Shipping RMRS 6 2 11
Shipping Register of Ukraine SRU 1 6
Turkish Lloyd TL 1
Total 2 3 21 1 2 6 10 141
Number of certificates delivered for RO related detainable deficiencies per ship type and age 2012

53AnnuAl report 2012
Pass
enge
r shi
ps/
Ferr
ies
Refr
iger
ated
Car
go
Ro -
Ro /
Con
tain
er
Vehi
cle
Tank
ers
/ Co
mb.
Ca
rrie
rs
Tota
l
≥ 18 ≥ 18 6 - 11 12 - 17 ≥ 18 0 - 5 ≥ 18
4
15
10 1 30
2 1 5
1
1 3 6 3 30
5
19
10
2 5
4 1 7
10
1
4
4
5
2 1 15
3
11
2
4 6
10
4 23
2 9
1
6 6 3 3 26 1 4 235

54
Port State Control - taking Port State Control to the next level
Flag / ROAB
S
BRS
BV DBS
DN
V
GL
GM
B
GSB
IBS
ICS
INC
LAM
AR
INSB
IS LR MBS
MC
MLG
Nkk
OM
CS
PHRS
PMD
S
PRS
RMRS
RSA
SRU
TL Tota
l
%
Albania 10 10 4.20
Antigua and Barbuda 3 9 12 5.04
Bahamas 1 1 0.42
Bangladesh 2 2 0.84
Barbados 1 1 0.42
Belize 1 3 1 4 9 3.78
Cambodia 5 1 2 8 3.36
Comoros 2 6 1 9 3.78
Cyprus 1 1 2 6 10 4.20
Dominica 3 8 11 4.62
Gibraltar, UK 1 3 4 1.68
Hong Kong, China 2 2 0.84
Liberia 8 3 2 13 5.46
Malta 1 2 2 5 2.10
Moldova, Republic of 10 2 4 4 20 8.40
Netherlands, the 2 1 3 1.26
Norway 2 2 0.84
Panama 13 1 19 2 3 9 3 1 11 2 64 26.89
Philippines 2 2 0.84
Poland 2 2 0.84
Portugal 1 1 0.42
Russian Federation 7 7 2.94
Saint Kitts and Nevis 3 3 1.26
Saint Vincent and the Grenadines 4 8 12 5.04
Sierra Leone 6 1 7 2.94
Singapore 2 2 0.84
Tanzania, United Republic of 3 1 5 9 3.78
Turkey 1 1 2 0.84
Ukraine 2 2 4 1.68
United Kingdom 1 1 0.42
Total 4 15 30 1 5 30 5 19 1 5 10 7 10 4 4 3 5 15 3 2 11 6 23 10 9 1 238 100
Number of certificates covering RO related detainable deficiencies per flag 2012
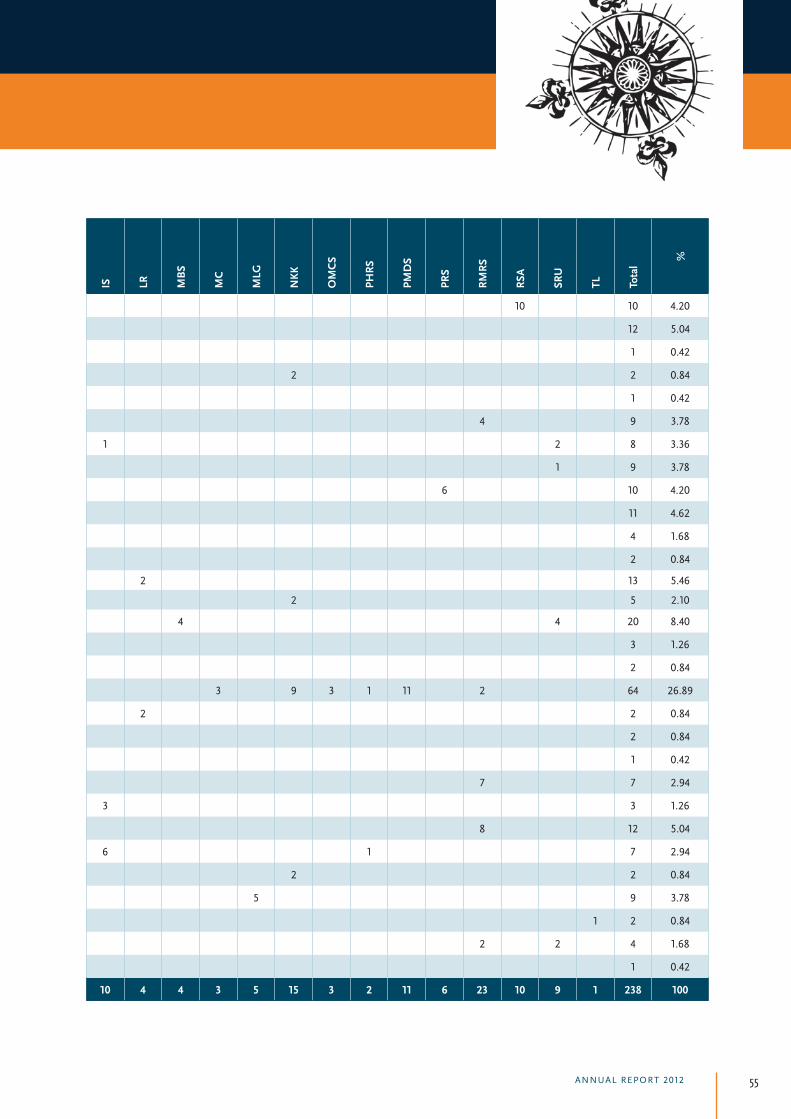
55AnnuAl report 2012
Flag / RO
ABS
BRS
BV DBS
DN
V
GL
GM
B
GSB
IBS
ICS
INC
LAM
AR
INSB
IS LR MBS
MC
MLG
Nkk
OM
CS
PHRS
PMD
S
PRS
RMRS
RSA
SRU
TL Tota
l
%
Albania 10 10 4.20
Antigua and Barbuda 3 9 12 5.04
Bahamas 1 1 0.42
Bangladesh 2 2 0.84
Barbados 1 1 0.42
Belize 1 3 1 4 9 3.78
Cambodia 5 1 2 8 3.36
Comoros 2 6 1 9 3.78
Cyprus 1 1 2 6 10 4.20
Dominica 3 8 11 4.62
Gibraltar, UK 1 3 4 1.68
Hong Kong, China 2 2 0.84
Liberia 8 3 2 13 5.46
Malta 1 2 2 5 2.10
Moldova, Republic of 10 2 4 4 20 8.40
Netherlands, the 2 1 3 1.26
Norway 2 2 0.84
Panama 13 1 19 2 3 9 3 1 11 2 64 26.89
Philippines 2 2 0.84
Poland 2 2 0.84
Portugal 1 1 0.42
Russian Federation 7 7 2.94
Saint Kitts and Nevis 3 3 1.26
Saint Vincent and the Grenadines 4 8 12 5.04
Sierra Leone 6 1 7 2.94
Singapore 2 2 0.84
Tanzania, United Republic of 3 1 5 9 3.78
Turkey 1 1 2 0.84
Ukraine 2 2 4 1.68
United Kingdom 1 1 0.42
Total 4 15 30 1 5 30 5 19 1 5 10 7 10 4 4 3 5 15 3 2 11 6 23 10 9 1 238 100
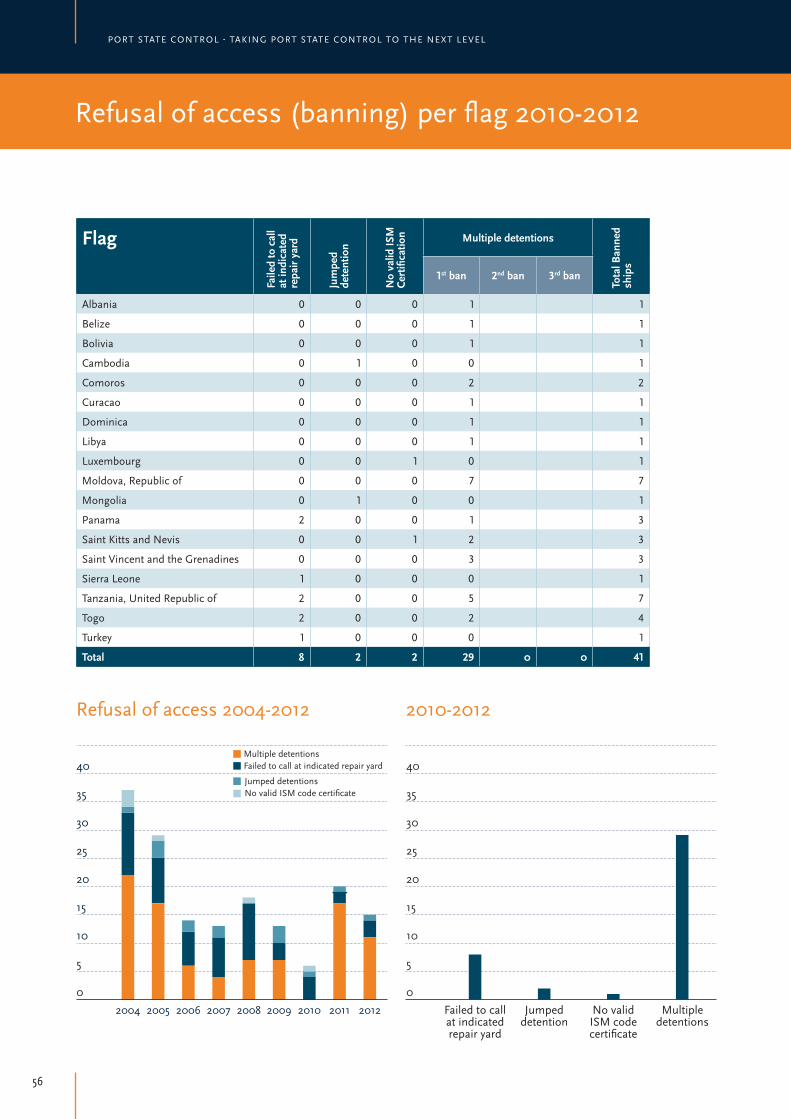
56
Port State Control - taking Port State Control to the next level
FlagFa
iled
to c
all
at in
dica
ted
repa
ir ya
rd
Jum
ped
dete
ntio
n
No
valid
ISM
Ce
rtifi
catio
n Multiple detentions
Tota
l Ban
ned
ship
s
1st ban 2nd ban 3rd ban
Albania 0 0 0 1 1
Belize 0 0 0 1 1
Bolivia 0 0 0 1 1
Cambodia 0 1 0 0 1
Comoros 0 0 0 2 2
Curacao 0 0 0 1 1
Dominica 0 0 0 1 1
Libya 0 0 0 1 1
Luxembourg 0 0 1 0 1
Moldova, Republic of 0 0 0 7 7
Mongolia 0 1 0 0 1
Panama 2 0 0 1 3
Saint Kitts and Nevis 0 0 1 2 3
Saint Vincent and the Grenadines 0 0 0 3 3
Sierra Leone 1 0 0 0 1
Tanzania, United Republic of 2 0 0 5 7
Togo 2 0 0 2 4
Turkey 1 0 0 0 1
Total 8 2 2 29 0 0 41
Refusal of access (banning) per flag 2010-2012
40
35
30
25
20
15
10
5
020052004 2006 2007 2008 2009 2010 20122011
Multiple detentionsFailed to call at indicated repair yard
Jumped detentionsNo valid ISM code certificate
40
35
30
25
20
15
10
5
0Failed to callat indicatedrepair yard
Jumpeddetention
No validISM codecertificate
Multipledetentions
Refusal of access 2004-2012 2010-2012

57AnnuAl report 2012
Number of individual ships inspected during CIC
Indi
vidu
al
ship
s in
spec
ted
durin
g C
IC
Insp
ectio
ns
perf
orm
ed
with
a C
IC
ques
tionn
aire
Insp
ectio
ns
with
out a
CIC
qu
estio
nnai
re
Inspections 3,985 4,014 468
Inspections with detentions 160 160 21
Detentions with CIC-topic related deficiencies 103 103 6
Number of inspections during CIC-campaign
# of
shi
ps
% o
f tot
al1 3,956 98.6%
2 58 1.4%
Total 4,014 100.0%
Ship type
Num
ber o
f in
divi
dual
sh
ips
Insp
ectio
ns
Det
entio
ns
Det
. as
% o
f in
spec
tions
Det
. CIC
-to
pic
rela
ted
dete
ntio
ns
CIC
-topi
c re
late
d as
% o
f in
spec
tions
Bulk carrier 765 766 31 4.0% 14 1.8%
Chemical tanker 342 343 4 1.2% 0 0.0%
Combination carrier 8 8 0 0.0% 0 0.0%
Container 420 422 12 2.8% 9 2.1%
Dredger 9 9 1 11.1% 1 11.1%
Gas carrier 85 86 2 2.3% 2 2.3%
General cargo/multipurpose 1,329 1,347 78 5.8% 59 4.4%
Heavy load 6 6 0 0.0% 0 0.0%
High speed passenger craft 2 2 0 0.0% 0 0.0%
Livestock carrier 14 14 2 14.3% 1 7.1%
MODU & FPSO 5 5 0 0.0% 0 0.0%
NLS tanker 29 31 0 0.0% 0 0.0%
Offshore supply 78 78 5 6.4% 4 5.1%
Oil tanker 307 308 4 1.3% 2 0.6%
Other special activities 164 165 7 4.2% 3 1.8%
Passenger ship 39 39 0 0.0% 0 0.0%
Refrigerated cargo 95 95 4 4.2% 3 3.2%
Ro-Ro cargo 193 194 8 4.1% 4 2.1%
Ro-Ro passenger ship 28 28 0 0.0% 0 0.0%
Special purpose ship 29 29 1 3.4% 1 3.4%
Tug 38 39 1 2.6% 0 0.0%
Total 3,985 4,014 160 4.0% 103 2.6%
CIC 2012 on Fire Safety Systems
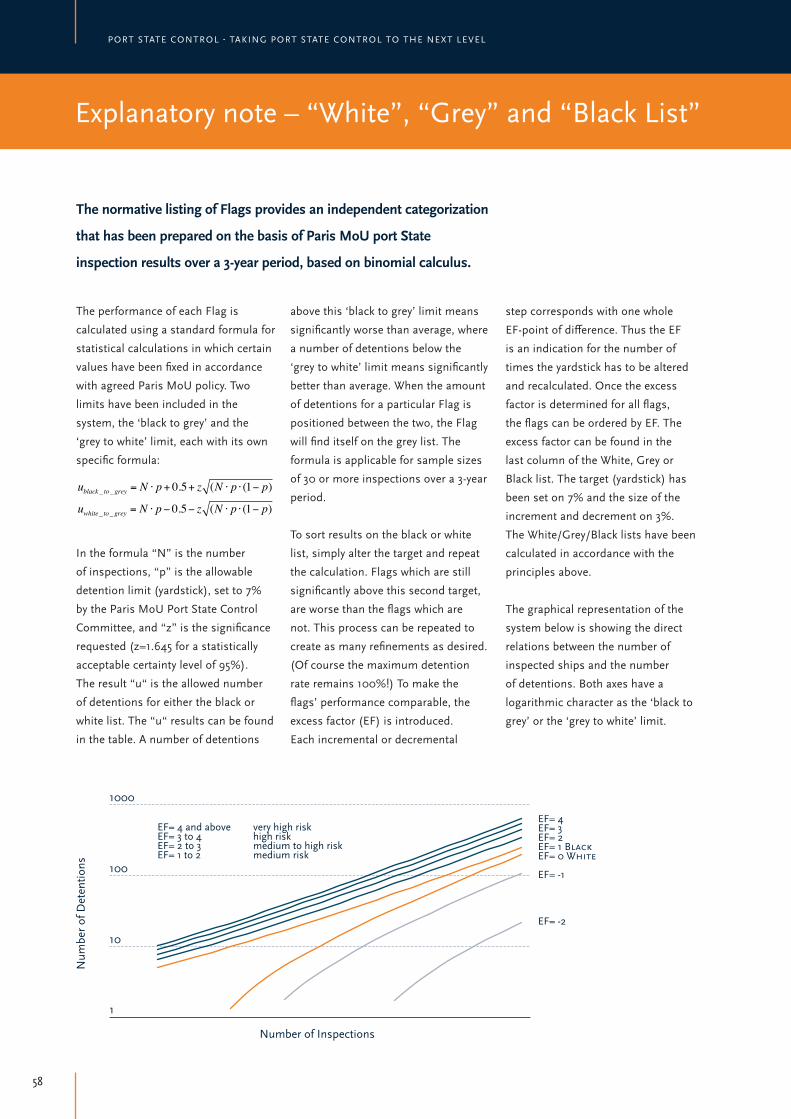
58
Port State Control - taking Port State Control to the next level
Explanatory note – “White”, “Grey” and “Black List”
The performance of each Flag is
calculated using a standard formula for
statistical calculations in which certain
values have been fixed in accordance
with agreed Paris MoU policy. Two
limits have been included in the
system, the ‘black to grey’ and the
‘grey to white’ limit, each with its own
specific formula:
ublack _ to_ grey = N ⋅ p+ 0.5+ z (N ⋅ p ⋅ (1− p)
uwhite_ to_ grey = N ⋅ p− 0.5− z (N ⋅ p ⋅ (1− p)
In the formula “N” is the number
of inspections, “p” is the allowable
detention limit (yardstick), set to 7%
by the Paris MoU Port State Control
Committee, and “z” is the significance
requested (z=1.645 for a statistically
acceptable certainty level of 95%).
The result “u“ is the allowed number
of detentions for either the black or
white list. The “u“ results can be found
in the table. A number of detentions
above this ‘black to grey’ limit means
significantly worse than average, where
a number of detentions below the
‘grey to white’ limit means significantly
better than average. When the amount
of detentions for a particular Flag is
positioned between the two, the Flag
will find itself on the grey list. The
formula is applicable for sample sizes
of 30 or more inspections over a 3-year
period.
To sort results on the black or white
list, simply alter the target and repeat
the calculation. Flags which are still
significantly above this second target,
are worse than the flags which are
not. This process can be repeated to
create as many refinements as desired.
(Of course the maximum detention
rate remains 100%!) To make the
flags’ performance comparable, the
excess factor (EF) is introduced.
Each incremental or decremental
step corresponds with one whole
EF-point of difference. Thus the EF
is an indication for the number of
times the yardstick has to be altered
and recalculated. Once the excess
factor is determined for all flags,
the flags can be ordered by EF. The
excess factor can be found in the
last column of the White, Grey or
Black list. The target (yardstick) has
been set on 7% and the size of the
increment and decrement on 3%.
The White/Grey/Black lists have been
calculated in accordance with the
principles above.
The graphical representation of the
system below is showing the direct
relations between the number of
inspected ships and the number
of detentions. Both axes have a
logarithmic character as the ‘black to
grey’ or the ‘grey to white’ limit.
The normative listing of Flags provides an independent categorization
that has been prepared on the basis of Paris MoU port State
inspection results over a 3-year period, based on binomial calculus.
Num
ber o
f Det
entio
ns
Number of Inspections
EF= 4EF= 3EF= 2EF= 1 BlackEF= 0 White
EF= -1
EF= -2
EF= 4 and above very high riskEF= 3 to 4 high riskEF= 2 to 3 medium to high riskEF= 1 to 2 medium risk
1000
100
10
1

59AnnuAl report 2012
Example flag on Black list:
Ships of Flag A were subject to 108 inspections of
which 25 resulted in a detention . The “black to grey
limit” is 12 detentions. The excess factor is 4.26.
N = total inspections
P = 7%
Q = 3%
Z = 1.645
How to determine the black to grey limit:
µblacktogrey = N ⋅ p+ 0.5+ z N ⋅ p ⋅ (1− p)
µblacktogrey =108 ⋅0.07+ 0.5+1.645 108 ⋅0.07 ⋅0.93
µblacktogrey =12
The excess factor is 4.26. This means that ‘p’ has to be
adjusted in the formula. The black to grey limit has an
excess factor of 1. so to determine the new value for ‘p’.
‘q’ has to be multiplied with 3.26 and the outcome has to
be added to the normal value for ‘p’:
p+3,26q = 0,07+ (3, 26 ⋅0,03) = 0,1678
µexcessfactor =108 ⋅0.1678+ 0.5+1.645 108 ⋅0.1678 ⋅0.8322µexcessfactor = 25
Example flag on Grey list:
Ships of Flag B were subject to 141 inspections. of which
10 resulted in a detention. The ‘ black to grey limit” is 15
and the “ grey to white limit” is 4. The excess factor is
0.51. How to determine the black to grey limit:
µblacktogrey =141⋅0.07+ 0.5+1.645 141⋅0.07 ⋅0.93µblactogrey =15
How to determine the grey to white limit:
µgreytowhite = N ⋅ p− 0.5− z N ⋅ p ⋅ (1− p)µgreytowhite =141⋅0.07− 0.5−1.645 141⋅0.07 ⋅0.93µgreytowhite = 4
To determine the excess factor the following formula
is used: ef = Detentions – grey to white limit / grey to
black limit – grey to white limit
ef = (10− 4) / (15− 4)ef = 0,51
Example flag on White list:
Ships of Flag C were subject to 297 inspections of which
11 resulted in detention. The “grey to white limit” is 13
detentions. The excess factor is –0.28. How to determine
the grey to white limit:
µgreytowhite = N ⋅ p− 0,5− z N ⋅ p(1− p)µgreytowhite = 297 ⋅0.07− 0.5−1.645 297 ⋅0.07 ⋅0.93µgreytowhite =13
The excess factor is - 0.28 This means that ‘p’ has to be
adjusted in the formula. The grey to white limit has an
excess factor of 0. so to determine the new value for ’p’.
‘q’ has to be multiplied with –0.28. and the outcome has
to be added to the normal value for ‘p’:
p+ (−0.28q) = 0.07+ (−0.28 ⋅0.03) = 0.0616
µexcessfactor = 297 ⋅0.0616− 0.5−1.645 297 ⋅0.0616 ⋅0.9384µexcessfactor =11

60
Port State Control - taking Port State Control to the next level
Secretariat Paris Memorandum of Understanding on Port State Control
Colophon
Layout and design
The KEY Agency
Photographs
Cover photo: Raitis Murnieks,
Maritime Administration of Latvia
Raitis Murnieks
Maritime & Coastguard Agency, UK
Direccion General de la Marina
Mercante, Spain
Paris MoU Authorities
Secretariat
Address Secretariat
Nieuwe Uitleg 1
P.O.Box 90653
2509 LR The Hague
The Netherlands
Telephone: +31 70 456 1508
Fax: +31 70 456 1599
www.parismou.org
E-mail: [email protected]
Staff
Mr. Richard W.J. Schiferli
Secretary General
Telephone: +31 70 456 1509
E-mail: [email protected]
Mrs. Carien Droppers
Deputy Secretary General
Telephone: +31 70 456 1507
E-mail: [email protected]
Mr. Ivo Snijders
Secretary
Telephone: +31 70 456 1849
E-mail: [email protected]
Mr. Peter Aarsen
Secretary
Telephone: +31 70 456 1510
E-mail: [email protected]
Mrs. Linda korpershoek
Secretary
Telephone: +31 70 456 1627
E-mail: [email protected]
Mr. Lourens van ‘t Wout
ICT Advisor
Telephone: +31 70 456 1375
E-mail: [email protected]
Mrs. Melany Cadogan - Eskici
Office Manager
Telephone: +31 70 456 1436
E-mail: [email protected]
Mrs. Ingrid de Vree
Management Assistant
Telephone: +31 70 456 1508
E-mail: [email protected]

61AnnuAl report 2012
Paris MoU fact sheet – organizational structure
MaritimeAuthorities
EuropeanCommission
Co-operatingMaritime
Authorities
Observers:IMO, ILO,
other MoU’s
Port State Control Committee
MoU Advisory Board (MAB)
THETISInformation System
Paris MoU Secretariat
Taskforces
Technical Evaluation Group
Ship inspection services of
Paris MoU port States
Owners, Flags andclassification societies


Th
e P
ar
is m
em
or
an
du
m o
f u
nd
er
sTa
nd
ing
on
Po
rT
sTa
Te
co
nT
ro
l