port of muskegon infrastructure and...
TRANSCRIPT

Prepared by:Martin Associates941 Wheatland Ave., Suite 203Lancaster, PA 17603 September 22, 2016
www.martinassoc.net
PORT OF MUSKEGONINFRASTRUCTURE AND ORGANIZATIONAL ANALYSIS
FINAL REPORT
Prepared for:

Infrastructure analysis
- Port terminals- Capacity
- Conditions assessment
- Road, rail and airport- Capacity
- Accessibility
Market analysis- Base cargoes (traditional markets)
- Non-traditional markets/opportunities
Future organizational structure of Port Authority- Review of other organizational structures
- Review proposed language amendment to Hertel-Law-T. StopcyznskiPort Authority Act
- Recommendation on structure
Study Elements
2

1) INFRASTRUCTURE INVENTORY AND ASSESSMENT
3

Terminals Reviewed:
West Michigan Dock & Market Corporation (Mart Dock) Terminal
Verplank – Salt Dock
GL&V Terminal
B.C. Cobb Dock
Verplank – Cobb Dock
Other Waterfront Facilities (Not Reviewed)
Fisherman’s Landing Park
Heritage Landing
Lafarge Terminal
Port of Muskegon Marine Terminals and Facilities
4

Dock frontage of 2,500 -ft
Open storage laydown area of approximately 20 acres , used to store a variety of bulk materials, including aggregate.
Existing buildings used to store cars, boats and other recreational vehicles.
Mart Dock has the capacity to store 200,000 to 250,000 tons of bulk material
West Michigan Dock & Market Corp Terminal (Mart Dock)
5

• Obvious deficiencies noted: No significant deficiencies were noted or reported, and the terminal appears to be functioning adequately for its current uses. The berths would benefit from an improved fendering system.
• Issues of concern: The waterfront structures are quite old. Their condition is a concern that should be addressed by an underwater inspection to determine the extent of corrosion and remaining practical life.
Conclusions & Recommendations: This facility remains functional despite its age and seems best suited for general and dry bulk cargoes. When required, it appears that one or more of the current warehouses could be made available for general cargo storage, but would likely require extensive renovation.
Mart Dock Maintenance Review:
6

The Verplank Salt Dock is used almost exclusively for Salt storage
Dock frontage of approximately 1,000 feet with an allowable draft of 25 feet
Approximately 5 acres of paved land
Capacity of terminal is approximately 250,000+ tons.
Verplank Salt Dock
7

Obvious deficiencies noted: No notable deficiencies were observed and none were reported by the terminal’s representative. The deeper side of the peninsula of the terminal is on the North side, which does not have a properly improved berth for vessels delivering salt to the facility. These vessels must stand-off of the unimproved shoreline while unloading.
Issues of concern: The unimproved shoreline on the north side, and lack of a proper berth, limits the flexibility and usefulness of the site for other than dry bulk cargoes delivered by self-unloading vessels.
Conclusion and Recommendations: This facility is functional and well suited for dry bulk cargoes. There is available space at the east end for expansion if needed. The Terminal is also quite near to the main north-south rail line, but it does not currently have a spur for access. Constructing a rail spur appears feasible and could improve business opportunities
Verplank Salt Dock Maintenance Review
8

The marine products handle at the terminal are limestone, slag, coal, furnace coke,
There is approximately 15 acres of improved open storage space.
The terminal has a dockage area length of 950 feet.
Total static capacity of the terminal ranges from 100,000 tons to 200,000 tons depending on type of cargo
G L & V Terminal
9

Obvious deficiencies noted: No notable deficiencies were observed and none were reported by the terminal’s representative. The north side of the terminal does not have a properly improved berth for vessels delivering cargo to the facility. These vessels must stand-off of the unimproved shoreline while unloading.
Issues of concern: The unimproved shoreline on the north side, and lack of a proper berth, limits the flexibility and usefulness of the site for other than dry bulk cargoes delivered by self-unloading vessels.
Conclusions & Recommendations: This facility is functional and best suited for dry bulk cargoes. There is available space at the southerly end for expansion if needed. The Terminal is also quite near to the main rail line, but it does not currently have a spur for access. Constructing a rail spur into the terminal would be difficult due to wetlands easterly and the Lake Express Ferry terminal and a marina westerly.
G L & V Terminal Maintenance Review
10

A 109 acre site that is becoming available for other uses
The existing dock is an 1,800-foot long structure supported by steel piles.
The berth depth is 27 feet,
The Coal Storage Yard was a 35-acre site located adjacent to the dock structure and the power plant.
BC Cobb Terminal
11

Container Yard (CY) Storage capacity is based on the type of container handling equipment being used.
- Wheeled Storage – 92 TEUs/Ac.
- Reach Stackers (2h,4w)-220 TEUs/Ac.
- Empty Container w/ High Pick Forklift – 300-400 TEUs/Ac.
35 Ac. CY that is partially wheeled w/ empties -5,400 TEUs Static Capacity
BC Cobb Terminal Potential Capacity
12

BC Cobb Terminal Maintenance Review
13
Issues of concern: While the existing berth appears to be in very good condition, conversations with several locals familiar with the facility’s history report that that construction was based on a designed focused on only supporting the existing operations until the plant closing. The situation, if factual, would affect a developer’s ability to use shore-based cranes for cargo handling. This issue needs further investigation by a structural engineer as it could render the current berth unsuitable for future containerized cargo operations, and thus require significant investment to replace or strengthen the bulkhead
Conclusions & Recommendations: The waterside (westerly coal storage yard) portion of this facility is arguably the best suited in the harbor for redevelopment for container and possibly general cargo operations. The site is large enough to also accommodate other types of cargo if sufficient demand materializes.

Dock frontage of 1,000-ft.
Approximately 8-9 acres of the site is used for cargo storage of aggregates and other bulk commodities used mostly for highway construction
Rest of site is used as a Confined Disposal Facility (CDF) for dredged material.
The “static” capacity of the terminal is approximately 150,000 tons
Annual capacity is 400k-450k, assuming several turns per year.
Verplank – Cobb Dock
14

Obvious deficiencies noted: None were noted or reported during the visit.
Issues of concern: The unimproved shoreline on the north side, and lack of a proper berth, limits the flexibility and usefulness of the site for other than dry bulk cargoes delivered by self-unloading vessels.
Conclusions & Recommendations: This facility is functional and well suited for dry bulk cargoes. There is available space at the easterly end for expansion if needed, although it is currently utilized for recreational boat parking and waterside marina slips. The Terminal is also quite near to the main rail line, but it does not currently have a spur for access. Constructing a rail spur into the terminal would be difficult due to wetlands easterly and the Lake Express Ferry terminal and a marina westerly.
Verplank – Cobb Dock Maintenance Review
15

Terminal Wharf
(length)
Open
Storage
Area
Covered
Storage
Area
Capacity
Bulk Cargos Other
Mart Dock 2,500 - ft 20- Ac. 20,000 ft.2 200 k – 250 k Tons
(limestone,
Aggregates, Other)
Autos,
Recreation
Vehicles,
Boats, general
cargo
Verplank Salt Dock 1,000 - ft 14.5- Ac. N.A. 250,000 Tons (Salt) N.A.
GL & V Terminal 950 - ft 15- Ac. N.A. 100,000 -200,000 –
Tons
(Limestone,
Aggregates, other)
N.A
B.C. Cobb Dock 1,800 - ft 35- Ac. N.A. 400 k – 500 k Tons Containers
92 TEUs /Ac. (Static,
Wheeled);
250-400 TEUs/Ac.
(Empties, Stacked)
If 12 Ac. Empty, 23
ac. Wheeled total
static capacity =
5,400 TEUs
Verplank – Cobb
Dock
1,000 - ft 8.5- Ac. N.A. 150,000 – Tons
(Stone, Aggregates,
etc.)
N.A.
Static Capacity Summary
16

Rail Service is provided by Michigan Shoreline Railroad (owned by the Genesee & Wyoming (G&W));
Operates 52 miles track connecting to the CSX Transportation (CSXT) yards at West Olive, Michigan.
Serves terminals located at northeastern end of Lake Muskegon
Currently carries primarily sand and chemicals and hauls 6,000 -6,500 carloads per year.
Other Infrastructure - Rail
17

Major Highways serving Lake Muskegon Terminals include:
- US 31
- M- 46
- M- 120
- I-96
MDOT reports no major “deficiencies” in region.
Some local bridge clearances were identified less than the required 14’ 6” min standard
Other Infrastructure - Highways
18

Route From To AADT CAADT
US-31 Jct. M-120 Russell Rd 41,000 1,500
US-31 N. Jct. M 31BR Jct. M-120 37,800 1,800
US-31 Getty St. Norton St. 26,200 1,000
Us-31 Fourth Skyline Drive 14,400 1,200
M-46 Pine St. Getty St. 10,300 330
M-120 Jct. US31BR Turn @ Lake Av. 25,000 280
Selected Local Highway Traffic Counts
19
Data from MDOT 2014 Traffic Map

Muskegon County Airport (MKG) has two asphalt paved runways:
- 6/24 is 6,501-ft
- 14/32 is 6,100=ft
Current operations are well under FAA operational ratios, indicating significant unused traffic capacity.
Adjacent to the Airport is the Muskegon County Airport Business Park, which provides opportunities for aviation related industrial development
Other Infrastructure - Airport
20

Port Infrastructure
- No critical deficiencies found
- Age of the terminals may require underwater inspections to determine operating life
- Unimproved berths limit flexibility and marketability
- No rail on south end can limit market opportunities
- Capacity appears adequate for future cargo opportunities
- Non-bulk cargo opportunities better served at BC Cobb Dock
Rail
- No critical deficiencies found
Highway
- No critical deficiencies found
- Few local bridges fall below clearance standard; investigating solutions
Airport
- No critical deficiencies found
- Excess capacity
Infrastructure Conditions Assessment Summary
21

2) MARKET ASSESSMENT –MARKET OVERVIEW
22

Defining Types of Cargo Markets
23
At the outset it is necessary to define the types of waterborne cargo markets in which the Port of Muskegon currently competes; and those markets in which the Port can potentially compete for market share- Captive cargo markets
- Tied to a single user/producer
- Proximity to plant, mine or farm
- Typically dry and liquid bulks
- Staple of Great Lakes and Inland Waterway System
- Not dynamic
- Discretionary cargo markets
- Hinterland reach - competition
- Containerized and breakbulk cargo
- Competitive vessel, port and inland transportation services
- More dynamic (influenced by cost and transit time)

Great Lakes total tonnage handled 2006-2014
0
50,000
100,000
150,000
200,000
2006 2007 2008 2009 2010 2011 2012 2013 2014
Tho
usa
nd
To
ns
Other
Iron & Steel
Grain
Sand & Gravel
Cement & Concrete
Non-Metal. Min.
Limestone
Coal Lignite
Iron Ore
Source: USACE, Waterborne Commerce Statistics
The recession impacted total tonnage handled at Great Lakes ports was impacted
heavily by the recession in 2009; During subsequent recovery, tonnage has been
flat. In 2014, total tonnage is still down by 23.5% over 2006 pre-recession levels

Historical St. Lawrence Seaway Tonnage 2000-2015
0
5
10
15
20
25
30
35
40
45
50
2000 2001 2002 2003 2004 2005 2006 2007 2008 2009 2010 2011 2012 2013 2014 2015
Milli
on
s o
f To
nn
es
GRAIN IRON ORE COAL OTHER BULK GENERAL CARGO
Source: St. Lawrence Seaway Management Corporation (SLSMC)26
International cargo moving via the St. Lawrence Seaway Transits has declined 23%
since 2006 reflecting 1) economic downturn during recession and 2) Increased
competition from coastal ports.
International general cargo share of total Seaway traffic has declined from 10% to
about 7.5%.

0.4
0.5
0.6
0.7
0.8
0.9
1
1.1
2006 2007 2008 2009 2010 2011 2012 2013 2014
Ind
ex
Great Lakes Michigan
Michigan ports’ tonnage has tracked with the Great Lakes total; Tonnage is off by 18.5% since 2006
27

Michigan Statewide Tonnages by Commodity; Essentially stable over past 5 years
0
10
20
30
40
50
60
70
2010 2011 2012 2013 2014
Mill
ion
s o
f To
ns
Other
Petroleum
Iron/Steel
Coal
Aggregates
Source: USACE, Michigan State Profile

Port of MuskegonWaterborne Tons by Commodity Group – 2006-2014
29Source: US Army Corps of Engineers (USACE) Waterborne Commerce Statistics
0
500
1,000
1,500
2,000
2,5002
00
6
20
07
20
08
20
09
20
10
20
11
20
12
20
13
20
14
Tho
usa
nd
To
ns
0%
20%
40%
60%
80%
100%
20
06
20
07
20
08
20
09
20
10
20
11
20
12
20
13
20
14
Other
Cement & Concrete
Non-Metal. Min. NEC
Limestone
Coal Lignite

Port of MuskegonWaterborne Tons by Commodity Group – 2006-2014
Source: US Army Corps of Engineers (USACE) Waterborne Commerce Statistics 30
Historically coal has been the dominant commodity handled at Muskegon;
Limestone, cement and concrete tonnage was heavily impacted by the recession,
however sporadic gains have been made in recent years during recovery;
0
200
400
600
800
1,000
1,200
1,400
1,600
2006 2007 2008 2009 2010 2011 2012 2013 2014
Tho
usa
nd
To
ns
Coal Lignite
Limestone
Non-Metal. Min.NEC
Cement & Concrete
Other

Port of Muskegon Competing Ports and 50-mile Hinterland
31
The shaded circles represent a 50-mile radius from key port facilities. As demonstrated,
Muskegon’s competitive reach is impacted by other ports, most notably Holland and Grand
Haven.
Competing facilities in
Michigan:
Holland
Manistee
Grand Haven
Ludington
St. Joseph
Detroit
Monroe

Port of Muskegon Competing Ports and 100-mile Hinterland
32
The shaded circles represent a 100-mile radius from key port facilities. Muskegon’s
competitive reach is impacted by western Michigan ports as well as Detroit for the central part
of the state including Lansing.
Competing facilities in
Michigan:
Holland
Manistee
Grand Haven
Ludington
St. Joseph
Detroit
Monroe

0
2,000
4,000
6,000
8,000
10,000
12,000
14,000
16,000
18,000
20,000
20
06
20
07
20
08
20
09
20
10
20
11
20
12
20
13
20
14
Tho
usa
nd
To
ns
Competing Ports: Port of Detroit –Decline through recession; sporadic recovery
Source: USACE, Waterborne Commerce Statistics
0%
10%
20%
30%
40%
50%
60%
70%
80%
90%
100%
20
06
20
07
20
08
20
09
20
10
20
11
20
12
20
13
20
14
Iron Ore Coal Lignite
Limestone Cement & Concrete
Non-Metal. Min. NEC Iron & Steel
Other

0
50
100
150
200
250
300
350
400
450
5002
00
6
20
07
20
08
20
09
20
10
20
11
20
12
20
13
20
14
Tho
usa
nd
To
ns
Competing Ports: Port of Holland – Smaller volumes; Decline in coal; limestone tonnage unstable
Source: USACE, Waterborne Commerce Statistics
0%
10%
20%
30%
40%
50%
60%
70%
80%
90%
100%
20
06
20
07
20
08
20
09
20
10
20
11
20
12
20
13
20
14
Limestone Coal Lignite
Sand & Gravel Iron & Steel Scrap
Other

0
200
400
600
800
1,000
1,200
20
06
20
07
20
08
20
09
20
10
20
11
20
12
20
13
20
14
Tho
usa
nd
To
ns
Competing Ports: Port of Grand Haven – Decline through recession; limestone and slag account for majority of tons
Source: USACE, Waterborne Commerce Statistics
0%
10%
20%
30%
40%
50%
60%
70%
80%
90%
100%
20
06
20
07
20
08
20
09
20
10
20
11
20
12
20
13
20
14
Limestone Slag
Coal Lignite Sand & Gravel
Cement & Concrete Non-Metal. Min. NEC
Other

Market Overview Summary
36
Staple of Great Lakes market has been bulk cargoes- Raw materials and feedstocks
- Typically captive to producer or user
- Market hit hard by recession, recovery has been slow
International tonnage through the St. Lawrence Seaway has been in decline- Discretionary cargoes, including steel, have not returned to pre-
recession levels
Port of Muskegon will lose about 60% of tonnage due to closure of Consumers Energy plant
Regional competition from Holland and Grand Haven for bulks such as limestone, salt, aggregate and potentially scrap

2A) MARKET ASSESSMENT –WATERBORNE BASE CARGOES
37

Base Waterborne Cargo Market Assessment
Focus on the current waterborne markets in which the Port of Muskegon currently competes - Coal
- Limestone
- Aggregates
- Slag
- Cement
- Minerals
Assessment of each major commodity group that identifies:- Competitive position
- Future outlook
20-year forecast of current base cargo market
38

Muskegon’s Competitive Position:Coal
Between 850,000 and 1.4 million tons handled annually over past decade
Port’s coal business will cease in 2016 with the closure of Consumers Energy Utility Plant - Plant is slated for demolition in 2018
- No alternative fuel source (natural gas) replacing coal
- Places Muskegon at risk for USACE to discontinue maintaining channel depth- Although this risk most likely mitigated through efforts of Representative Huizenga
Terminal area will become available for future use
Forecast: Tonnage discontinued immediately
39

Muskegon’s Competitive Position:Limestone, Cement, Slag and Aggregates
Historical throughput - Limestone – 400,000-500,000 tons
- Cement -50,000-125,000 tons
Used in local construction activity- These commodities are typically consumed in local 50-100 mile radius.
Key local end users include construction companies and redi-mix plants- Somewhat captive market since it is difficult to penetrate into
competing markets, and likewise difficult for competitors to make inroads into Muskegon’s hinterland
- However these commodities are handled at competing ports such as
Holland and Grand Haven
Outlook: Throughput is tied to construction projects - Health of the economy will influence tonnage
- Have witnessed growth in recent years 40

Muskegon’s Competitive Position:Minerals and Other Dry bulk
Historical throughput- Minerals (salt) – 100,000-200,000 tons
Salt used for winter road conditions
Outlook: Assumed to remain flat through the long-term
Potential opportunities:
- Foundry coke
- Pig iron- Need deep draft to handle foreign international vessels
- Potential for 50,000-125,000 tons
- Scrap – handled at Muskegon in the past- Will require ongoing discussions with regional scrap handlers
- Consolidation of terminal operations in Muskegon- Most likely dependent on land swap with City
41

Muskegon’s Competitive Position:Potential Opportunities
Consolidation of terminal operations in Muskegon- Current terminal operator in Muskegon operates multiple facilities
along Western Michigan
- Allows for more efficient operations
- Most likely dependent on land swap with City (in discussions)
- Potentially 200,000+ tons
Foundry coke and pig iron- Need deep draft to handle foreign international vessels
- Potential for 50,000-125,000 tons
Scrap – handled at Muskegon in the past- Will require ongoing discussions with regional scrap handlers
42

Port of Muskegon Summary Forecast Base Cargo - Assumptions
43
Coal
- Discontinued in 2016
Limestone, Cement and Aggregates
- Low: 1.5% CAGR based on 2014 tonnage
- High: Return to pre-recession in 2020; 3% CAGR thereafter
Minerals & Salt
- High/Low: 5-year average, flat growth
Slag
- Low: 1.5% CAGR based on 2014 tonnage
- High: Return to pre-recession in 2020; 3% CAGR thereafter
New opportunities
- Low: No capture, no incremental tons
- Moderate: Capture 100,000 tons in 2017, 2% CAGR thereafter
- High: Moderate + 200,000 tons by 2020, 2% CAGR thereafter
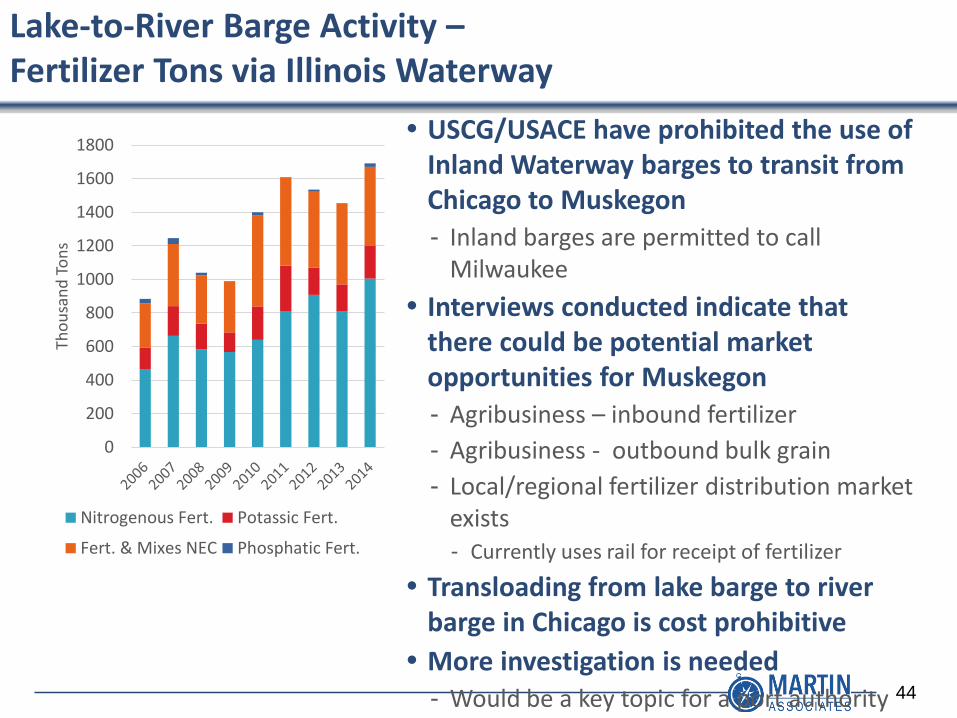
USCG/USACE have prohibited the use of Inland Waterway barges to transit from Chicago to Muskegon
- Inland barges are permitted to call Milwaukee
Interviews conducted indicate that there could be potential market opportunities for Muskegon
- Agribusiness – inbound fertilizer
- Agribusiness - outbound bulk grain
- Local/regional fertilizer distribution market exists- Currently uses rail for receipt of fertilizer
Transloading from lake barge to river barge in Chicago is cost prohibitive
More investigation is needed
- Would be a key topic for a port authority
Lake-to-River Barge Activity –Fertilizer Tons via Illinois Waterway
44
0
200
400
600
800
1000
1200
1400
1600
1800
Tho
usa
nd
To
ns
Nitrogenous Fert. Potassic Fert.
Fert. & Mixes NEC Phosphatic Fert.

Forecast of Traditional Commodity Base
Source: US Army Corps of Engineers (2006-2014), Martin Associates45
0
500
1,000
1,500
2,000
2,500
Tho
usa
nd
To
ns
High
Moderate
Low/Base

Non-cargo Opportunity – Cruise Market
Scheduled 10 cruise ship calls in 2016
- Heritage Landing – public facility
Economic impact
- 200 passengers in Port 4-8 hours
- Shore excursions, dining, etc…
Revenue potential
- Dockage and passenger fees
Development of a public dock for non-cargo operations
Conduct passenger survey to gain feedback to ensure future operations
46
SWOT Summary of Base Cargo Market
Strengths
- Deep water- Deepest on western shoreline
- Ability to handle international vessels for potential opportunities
- Established terminal operations
- On-dock rail
- Available capacity- Existing docks (not including BC Cobb) = 850,000 tons static
- Turned 2x = 1.7 million tons
- Does not factor in land swap property or BC Cobb
Weaknesses
- Unlikely that coal tonnage will be replaced
- Short line connectivity
- Terminals without rail spur: Salt, GL&V, & Verplank Cobb
- CAPEX improvements needed for some terminals 47

Summary of Base Cargo Market
Opportunities
- Tonnage tied to construction activity
- Potential land swap - Ability to consolidate terminal operations increasing efficiency
- Potential to handle new cargoes for regional foundry operations
Threats
- Declining Great Lakes market (domestic and international)
- Competing ports’ ability to serve local hinterland
- Inability to bring river barges to Muskegon limits marketing of certain bulk products – particularly fertilizer
48

2B) MARKET ASSESSMENT –NON-TRADITIONAL WATERBORNE MARKETS
49

Waterborne Cargo Market Assessment –Non-traditional & Discretionary Cargoes and Opportunities
Traditional bulk markets cannot replace loss of coal tonnage
- Need to focus on non-traditional opportunities
Focus on potential waterborne cargo opportunities in markets in which the Port does not currently compete:
- Cross-lake Ferry Service- Export
- Domestic
- Logistics Hub Activity- Agricultural products
- Deconstruction materials
- Barge - Agribusiness
- Specialty bulk products
Perform data analysis is presented identifying cargo flows into/out of Michigan
Develop Landed Cost Analyses to demonstrate Muskegon’s competitive position and advantages
Identify key issues influencing market competitiveness 50

Analysis of a Cross-lake Ferry Service
Determine feasibility of proposed cross-lake ferry operation
Cross-lake Ferry has been discussed as a relief to Chicago congestion- Rail
- Highway
Potential markets to investigate:- Michigan origin for exports through USWC/Canada to Asia
- Michigan origin for domestic cargo destined for Wisconsin/Illinois/Minnesota
- Michigan origin for exports through Cleveland to Europe
Key industries to investigate:- Agribusiness
- Consumer goods
51

Agricultural products – Data analysis to assess feasibility of Diversion to cross-lake Ferry Service
Develop database of flows of exports originating in Michigan- Data supplied by MDARD
Historical export data for key crops- Soybeans
- Corn
- Apples
- Cherries
- Dried Beans
Assess Trends - Volume
- Market share by world region
Identify key flows to determine percent available for diversion to cross-lake ferry
52

$0
$20,000,000
$40,000,000
$60,000,000
$80,000,000
$100,000,000
$120,000,000
$140,000,000
$160,000,000
$180,000,000
2006 2008 2010 2012 2014
Export Value
Soybean Exports from Michigan – Trending upward sporadically; Canada and Asia are dominant markets; Asian share has increased to 44.5%
Source: MDARD
0%
10%
20%
30%
40%
50%
60%
70%
80%
90%
100%
2006 2008 2010 2012 2014
Other
NorthernEurope
Med/Mid East
Mexico
Carib/C Amer/SAmer
Asia
Africa
Canada

$0
$20,000,000
$40,000,000
$60,000,000
$80,000,000
$100,000,000
$120,000,000
2006 2008 2010 2012 2014
Export Value
Corn Exports from Michigan – Dominated by exports to Canada; Not exhibited growth trend; loss of European market
Source: MDARD
0%
10%
20%
30%
40%
50%
60%
70%
80%
90%
100%
2006 2008 2010 2012 2014

$0
$1,000,000
$2,000,000
$3,000,000
$4,000,000
$5,000,000
$6,000,000
2006 2008 2010 2012 2014
Export Value
Apple (Fresh & Dried) Exports from Michigan – Mexican and Canadian markets dominate; With exception to 2014, Asian market has not been significant
Source: MDARD
0%
10%
20%
30%
40%
50%
60%
70%
80%
90%
100%
2006 2008 2010 2012 2014
Other
NorthernEurope
Med/MidEast
Mexico
Carib/CAmer/SAmerAsia
Africa
Canada

$0
$2,000,000
$4,000,000
$6,000,000
$8,000,000
$10,000,000
$12,000,000
2006 2008 2010 2012 2014
Export Value
Cherry (Sour, Preserved & Prepared) Exports from Michigan –Trending upward; Asian market has been growing
Source: MDARD
0%
10%
20%
30%
40%
50%
60%
70%
80%
90%
100%
2006 2008 2010 2012 2014
Other
NorthernEurope
Med/MidEast
Mexico
Carib/CAmer/SAmerAsia
Africa
Canada

$0
$10,000,000
$20,000,000
$30,000,000
$40,000,000
$50,000,000
$60,000,000
$70,000,000
$80,000,000
2006 2008 2010 2012 2014
Export Value
Dried Bean Exports from Michigan – Med and Middle East markets have been gaining market share
Source: MDARD
0%
10%
20%
30%
40%
50%
60%
70%
80%
90%
100%
2006 2008 2010 2012 2014
Other
NorthernEurope
Med/MidEast
Mexico
Carib/CAmer/SAmerAsia
Africa
Canada

Michigan Agricultural Export Tonnage: Growth in containerized shipments
0
20,000
40,000
60,000
80,000
100,000
120,000
140,0002
00
2
20
03
20
04
20
05
20
06
20
07
20
08
20
09
20
10
20
11
20
12
20
13
20
14
20
15
Short Tons
Non-containerized
Containerized
Source: MDARD

Agricultural Exports Data Summary
Canada has been dominant player in Michigan sourced exports
Soybeans represents the greatest future opportunity for Asian exports- Volume
- Increasing share
Apples and cherries also show some promise for future Asian exports, albeit at much lower volumes
Growth has occurred in containerized exports
59

Competitive factors influencing the potential to move agricultural products on Cross-lake Ferry for export
Key competing move is intermodal rail to USWC and Western Canada to serve Asian market
Cross-lake ferry must compete on- Cost
- Time
- Responsive versus efficient supply chain
In addition to hard (quantifiable) costs such as transportation, other factors (soft costs) may influence logistics routing and sourcing decisions- Equipment availability
- Peak seasonality
60

Intermodal Grain Transshipment/Transload Examples
Inland transload for export is growing – new facilities are being built in Omaha, Savannah, Kansas City and Newark
East coast ports are actively pursuing containerized exports, specifically Baltimore and Norfolk
An example of a transloading facility in Omaha:
- Empty container headed westbound for repo for export to Asia;
- Cost associated to repo, but no/limited revenue to rail carrier;
- Cut westbound haul, stuff container with grain in Omaha;
- Class I picks us railcar and continues on to West Coast port;
- Shipper pays reduced freight rate, but Class I gets adequate revenue on the haul
For a service of this nature to be successful, availability of containers in West Michigan is critical
Independent shipper is evaluating cost structures to identify feasibility
Similar service operated at Port of Milwaukee until CP discontinued service
61

Consumer goods – Data analysis to assess feasibility of Diversion to Cross-lake Ferry Service
Examine database of flows into/out of Western Michigan- Data supplied by GRACC
- Developed from survey of key regional shippers - “West Michigan Logistics Hub Assessment and Strategy
Recommendations”, May 8, 2014 prepared by MSU
Key Origins/Destinations by- Truck load
- Container
- Rail
Identify key flows to determine size of market available for diversion to cross-lake ferry
62

Traffic Distribution Inbound to Michigan
63Source: West Michigan Logistics Hub Assessment and Strategy Recommendations,
Michigan State University, May 8, 2014

Percent of Inbound Shipments to Michigan by mode and key state Origins
Truck –majority of moves from DCs in Chicago and Ohio
Container moves from IL, CA and VA- DC influenced
Rail moves long-haul markets –- Imports from CA
Green highlight indicates states that might benefit from a cross-lake service
65
Origin State Truck Loads Percent Top 10 Cumulative Origin State Containers Percent Top 10 Cumulative Origin State
Rail Cars
(converted) Percent Top 10 Cumulative
Inbound Loads 50686 Inbound 1318 Inbound 46179
IL 12476 24.6% IL 587 44.5% CA 18297 39.6%
OH 10447 20.6% CA 557 42.3% FL 5127 11.1%
IN 8195 16.2% VA 100 7.6% WA 4941 10.7%
CA 3115 6.1% AR 26 2.0% IL 4254 9.2%
NJ 2212 4.4% UT 16 1.2% AZ 2787 6.0%
WI 2094 4.1% OR 12 0.9% TX 2295 5.0%
PA 1978 3.9% WA 10 0.8% NJ 2073 4.5%
IA 1229 2.4% LA 6 0.5% ID 1734 3.8%
MO 1143 2.3% IN 2 0.2% PA 1185 2.6%
TX 944 1.9% 86.5% OH 1 0.1% 99.9% GA 834 1.8% 94.3%

Traffic Distribution Outbound from Michigan
66Source: West Michigan Logistics Hub Assessment and Strategy Recommendations,
Michigan State University, May 8, 2014

Percent of Outbound Shipments from Michigan by mode and key state Destinations
Truck – Concentrated in neighboring states
Containers outbound to CA- Indicates possible export cargoes
Rail - majority of known outbound rail moves are destined for the Pacific and Western Canada
- Indicates possible export cargoes
- “Unknown” data (62%) is believed to be consolidated in Chicago
Green highlight indicates states that might benefit from a cross-lake service 68
Destination State Truck Loads Percent Top 10 Cumulative Destination State Containers Percent Top 10 Cumulative Destination State
Rail Cars
(converted) Percent Top 10 Cumulative
Outbound 27380 Outbound 25653 Outbound 30120
OH 5755 21.0% CA 5174 20.2% Unknown 18627 61.8%
IN 4839 17.7% IL 2469 9.6% CA 2913 9.7%
IL 3738 13.7% VA 2325 9.1% Western Can 1758 5.8%
CA 1747 6.4% TX 1632 6.4% TX 1620 5.4%
PA 1646 6.0% PA 1096 4.3% OH 1482 4.9%
TX 1126 4.1% NY 961 3.7% FL 1287 4.3%
UT 1032 3.8% WA 958 3.7% MN 972 3.2%
GA 603 2.2% FL 828 3.2% CO 738 2.5%
NJ 496 1.8% GA 816 3.2% IN 363 1.2%
MD 494 1.8% 78.4% CO 706 2.8% 66.1% VT 129 0.4% 99.2%

Consumer Goods Data Summary
Based on this data, which was developed from a survey of 10 regional shippers, approximately 30%-35% on the inbound and outbound volume moved to the U.S. West Coast or Canadian West Coast as well as Wisconsin and Minnesota
Developing a potential capture scenario of this cargo that could be diverted to a ferry service would be inconclusive, since this only represents a sample of the flows into-out of Michigan
In order to identify a true capture volume for the service, a detailed cargo flow analysis using published data bases such as Transearch or Surface Transportation Waybill Sample is necessary
Furthermore, the capture volume necessary to make the service breakeven is unclear given the uncertainty of the type of vessel proposed for the ferry service
Martin Associates reached out to EcoShips to gather detailed data on the service and markets, however, EcoShips would only provide data for a fee, which was unaffordable under the scope of this study
69

Chicago, Indianapolis, Toledo and Columbus are key distribution clusters serving Michigan; Detroit is home to a smaller DC market, however the balance of the state is an inbound consumption market
70Source: Chain Store Guide, National Retail Federation

Total Landed Cost Analysis - Components
Total Landed Costs consist of:
- Dray from Western Michigan Origin to Port of Muskegon
- Port and terminal charges
- Wharfage & dockage
- Stevedoring
- Handling/truck loading
- Equipment usage
- Warehousing
- Gate charges
- Cross-lake line haul voyage
- Port, terminal and handling at Port of Milwaukee
- Harbor Maintenance Tax (HMT)
- Inventory Carrying Cost (ICC)
- Surface transportation costs (truck/rail) from Port of Milwaukee
- Intermodal rail to west Coast port for Asian exports
- Truck for domestic delivery71

Logistics Cost Analysis – Asian ExportsImplications
In terms of landed costs, labor and terminal charges are critical factors
- Unclear if factored into previous analyses
- Could be potential deal breaker
Unexperienced in documentation process etc…
Year-round option during winter months??
Cross-lake ferry adds additional leg- Handling
- Additional dwell
- Drayage time
- Queue at port
- Loading - If lift-on/lift-off service, at a rate of 10 picks per hour would take 5 hours to load
and 5 hours to discharge 50 containers
As origin moves away from local Western Michigan east to Lansing, traditional routing through Chicago via rail remains more attractive 73

Logistics Cost Analysis – Asian ExportsImplications
Viability of this service is dependent on re-establishing CP Intermodal Rail connection at Port of Milwaukee- Highly unlikely service can be supported without on-dock
connectivity
While congestion exists in Chicago, service is still reliable and shippers remain satisfied
As shown in the shipper interviews, the following factors must be considered: - Reliability of service;
- Agility;
- Frequency; and
- Individual logistics chains of BCOs
- Not all supply chains are created equal
74

Logistics Cost Analysis – European ExportsImplications
In terms of landed costs, Labor and terminal charges are critical factors
- Unclear if factored into previous analyses
Year-round option during winter months??
Cross-lake ferry adds additional leg
Handling- ILA labor in Cleveland, significantly more costly than non-union
As origin moves away from local Western Michigan east to Lansing, trucking direct to Cleveland is more cost efficient
CEE only operates twice per month- Shippers desiring flexibility and are sensitive to transit times, the
infrequency would stress delivery requirements
- Unplanned issued such as weather conditions could be deal breakers for shipments
75

Logistics Cost Analysis – Domestic Moves Implications
In terms of landed costs, cross-lake ferry appears potentially viable to Madison or local Milwaukee only from local Muskegon - Labor and terminal charges are critical factors
Cross-lake ferry adds additional leg- Handling
- Loading and discharge dwell times must be factored in
As origin moves away from local Western Michigan east to Lansing, cost differential is exacerbated
Difficult to “fabricate” a short-sea shipping market
However, two-way trade for non time-sensitive cargoes may be the best opportunity
76

Logistics Cost Analysis – Domestic Moves Increased Rate Implications
Increase in trucking rate would result in Muskegon to Madison routing becoming more cost competitive
Factors possibly contributing to an increase:- Driver shortage
- Equipment availability/unavailability
- Seasonality
- Fuel prices
- Tightened capacity
Specialized products can be impacted- Containerized
- Bulk
77

Cross-lake Ferry – Market Summary and Implications
Challenges- Cost structure
- Port and Terminal charges
- Labor
- Flexibility and agility in transit time- Asian -Despite congestion claims, Frequency of service in Chicago
- European - CEE service call Cleveland only 2x per month
- On-dock intermodal at Port of Milwaukee for Asian exports
- Year round service
- Empty containers land in Chicago- Cost to move to Michigan to load outbound
- Equalized eastbound-westbound ferry trade requires imports destined to Michigan from West Coast- Create empty container surplus in Michigan
- Need to secure anchor customer- Volume commitment
- Balanced trade EB/WB 78
Cross-lake Ferry – Market Summary and Implications
Opportunities- Specialty bulk operations
- Domestic and export market expansion
- Roll-on, Roll-off chassis drop may provide another option- Fleets, not single owner-operators
- 15 trucks/shipment
- Estimated $600-$1000/trailer – not including local drayage
79

Development of Logistics Hub
Logistics Hub concept can leverage critical mass of industry- Agricultural products
- Deconstruction/recycling/reuse
Don’t have to place all eggs in Cross-lake Ferry basket
Hub stakeholders for agribusiness:- Growers
- Co-ops
- Processors
- Distributors
- Third Party Logistics (3PL) providers
- Food hub operations
- Brokers
80

Development of a Logistics Hub
Regional concept, rather than mode specific concept
- Not necessarily all related to waterborne commerce
All modes of transportation working in concert
- Port
- Rail
- Highway
- Airport
Key attributes for success:
- Rail served facility
- FTZ capability
- Ample acreage to expand
- Dominant anchor tenant
81

Development of a Logistics Hub
Key Opportunities- Strong Agribusiness market in Western Michigan
- Exports growing, especially soybeans- Asian market
- Michigan Ag MDARD supporting initiatives for growth- American Farm Bureau: TPP will boost annual net farm income by $4.4
billion
- USDA arrangements helped organic sales grow by more that 78% over 2009-2015 period
- Export opportunities highlighted in reports www.miagexport.com
82

Development of a Logistics Hub
Stakeholder input and further investigation mandatory
- MDARD
- MABA
- Potential tenants and service providers
- Economic Development agencies
Challenges- FDA regulations and inspections
- Some larger farms already perform own value-added services
- Chain of custody from grower to buyer can vary
83

Development of a Logistics Hub
Deconstruction Study underway (MSU)
Focus on development of strategy for reclaiming and salvaging deconstructed building materials
- Value-added services
- Warehousing
Low-value commodities
- Need low-cost transportation
Deconstruction Hub slated to be built in Detroit
Market for Muskegon Hub:
- Deconstructed material stays in Michigan
- Inbound material from other states via barge a possibility???
- Stevedoring/handling charges may be too costly
Most likely grant monies available to subsidize operations???
- Sustainable
- Go green concept 84

Strategies to Increase Port Usage
Work with current terminal operators to grow base business- Specifically land swap opportunity
Develop industry-specific stakeholder groups to discuss needs to develop logistics hub operations - Agribusiness, Deconstruction/recycling/reuse
Continue to work with state government with respect to key industries in the region- Agricultural products
Stay informed of potential businesses requiring multi-modal logistics services
- Work with EDCs
Grow relationship with cruise line operators- Ensure future cruise calls – same or higher level of service
Develop port authority structure to pursue Federal and State grant opportunities 85

3) ORGANIZATIONAL STRUCTURE ANALYSIS
86

Types of Port Authorities in the United States
Operating Port:- Owns land, enters into lease agreements and provides labor for port
operations- Georgia Ports Authority
- South Carolina State Ports Authority
- Virginia Port Authority
Landlord Port:- Owns land and enters into lease agreements where tenants operate
terminals- Jacksonville
- Cleveland
- Milwaukee
Port Authority/Port Commission (Non land-owning):- Does not own land, promotes port and waterborne activity
- Cincinnati
- Pittsburgh
- Detroit88

Examples of Port Authority Structures Involving Private Terminals
Detroit
- Under existing Port Authority Act
- 5 member board
- 7 staff
- Funding
- $250,000 from both City and County
- $500,000 match from State
- Focus on maritime and water transportation
Pittsburgh
- Commission, not authority
- Under PennPORTS, liaison to Governor
- 15 member board
- Funding:
- Appropriation from Multimodal Fund $1.0-$1.4 million
- Key functions:
- Act on behalf of private terminals
- Seek grant funding
- Attend roundtable discussions
- Promote waterway (speeches, press conferences, etc.) 89

Examples of Port Authority Structures Involving Private Terminals
Cincinnati
- Formed under Ohio Revised Code Section 4582.22 –City/County
- 10 member board
- 20+ staff
- Funding
- $700,000 from both City and County, operating income from functions
- Focus:- Economic development of non-port lands
- Bond financing
Monroe
- Under 1925 Port District Act
- 5 member board, appointed by Mayor of Monroe
- 2 staff
- Funding:
- Millage from city
- Lease agreements
- Tariff
- Key focus:
- Promote water transportation – throughput
- Create jobs and taxes90

Key Elements of Proposed Language Amendment
Redefines “Port Facilities” and “Project”- Port Authority will have opportunity to provide financing for non-port owned assets
Requests incorporation of authority by City or County – single constituent- Provides the ability to focus on one unit of government and reduce competing
interests
Creates a 9-member board- 6 members would come from owners and operators of port facilities in the city and
county
Stipulates that for certain actions of the Authority, and initial bylaws to take effect, all members must concur- Hands veto power to a single entity
Provides the Authority to levy an ad valorem tax up to 2 mills
- Voted on by electors
91

Requesting Incorporation Under Current Language
Pros:
- Incorporation can be requested immediately as Heritage Landing is considered a port facility
- City and County agree on board appointments- 5 or 7 member
- Dedicated sponsor to pursue Federal transportation grants
- 50% of budget provided by the state
Cons:
- Reduces guaranteed input from private land owners & terminal/port facility operators
- May increase perception of public authority competing with/encroaching on private operations- May limit willingness to participate in P3s
92

Requesting Incorporation Under Proposed Amended Language
Pros:
- Redefines port facilities to include private terminals
- Guarantees private terminal operators a seat on the board
- City and County both set board appointments
- Dedicated sponsor to pursue Federal transportation grants
Cons:
- Two-thirds of the board is comprised of port terminal operators- Excludes other transportation entities which may have impact on Logistics Hub concept
- With veto power, board may become geared toward individual special interests and result in counter-productivity
93

Roles of the Proposed Port Authority
Promotes waterborne transportation and commerce
Supports private terminal initiatives to increase economic benefit to local and regional community
Advocates on behalf of the private terminals within its jurisdiction, however does not interfere with private terminal operations
Sponsors and pursues Federal and state grant monies in conjunction with private terminal operators and landowners
Essentially, a public entity that assists in economic development under the guise of a Port Authority
94

Keys to Success
Work with existing terminals
- Advocate on behalf of the maritime interests (port)- State legislatures
- Local/county officials
- Community groups
- Complimentary businesses and industries
Develop synergy
- Economic development
Promote P3s with existing terminals and stakeholders
Pursue grant monies
- USDOT
- TIGER
- Fastlane
- Federal Highway
95

Recommended Port Authority Structure
County-led effort
- County owns Heritage Landing and Muskegon County Airport
- County lead promotes more regional appeal
Language redefining “Port facility” and “Project” allows for potential P3s
- Continue to pursue
Board should be comprised of members from:
- EDCs
- Regional government
- Financial institutions
- Exercise caution not to create special interests
Language stipulating veto power (for any member) is not advised
96

Recommended Authority Staff and Funding
Keep lean
- Executive Director- Liaison to the State and local governments
- Marketing/Business development- Work with EDC
- Funding specialist- Grant writing
Follow Port of Monroe structure
- Retains subconsultants for most activities
- As needed
Funding
- No match from the state under language amendment
- Tax levy
- County funds
- Revenue from cruise dockage and passenger fees
97

Implications
A proposed port authority will ultimately promote commercial waterborne and logistics activity as a whole
Rather than getting involved in terminal operations, the authority will:
- Stimulate economic development - Promotion of the port to the community and legislators,
- Develop P3s with private entities - Offer attractive financing options
- Encourage investment
- Pursue logistics-based ideas that benefit the region
98