port of damietta operational efficiencypdf.usaid.gov/pdf_docs/pnadx143.pdf · port of damietta...
TRANSCRIPT
April 2008
This publication was produced by Nathan Associates Inc. for review by the United States
Agency for International Development. April 2008
This publication was produced for review by the United States Agency for International Development. It was prepared by Abdel Meguid Fouad and Raymond Lawler
PORT OF DAMIETTA OPERATIONAL EFFICIENCY EVALUATION AND RECOMMENDATIONS


Port of Damietta Operational Efficiency EVALUATION AND RECOMMENDATIONS
TECHNICAL ASSISTANCE FOR POLICY REFORM II
CONTRACT NUMBER: 263-C-00-05-00063-00
BEARINGPOINT, INC.
USAID/EGYPT POLICY AND PRIVATE SECTOR OFFICE
APRIL 2008
AUTHOR: ABDEL MEGUID FOUAD AND RAYMOND LAWLER
DISCLAIMER
This document is made possible by the support of the American people through the United States Agency for International Development (USAID). Its contents are the sole responsibility of the author or authors and do not necessarily reflect the views of USAID or the United States government.

I I P O R T O F D A M I E T T A O P E R A T I O N A L E F F I C I E N C Y
CONTENTS
1. Introduction 1
Port Operational Strengths 1
Port Operational Weaknesses 2
2. Current Port Operations 5
Berth Occupancy Rates 5
Container Terminal Operations 6
General Cargo Operations 7
Improve Rigging Systems 8
Unitize and Palletize 8
Adopt Indirect Delivery 9
Bulk Cargo Systems 11
Comparison to Other Ports 12
Alexandria 12
El-Dekheila 12
Summary and Conclusions 13
3. Operational Implications of Proposed Terminal 15
Basin and Yard Issues 16
Channel and Harbor Congestion Issues 18
Summary and Conclusions 20
4. IT Systems and Operations Control 21
Improve Data Use 21
Executive Information System 21
IT Governance 21
Data Verification 22
Upgrade Vessel Traffic Services 23
Improve Wireless Network 23
RF Site Survey Tips 23
Mesh Wireless Networking 25
Summary 26
5. Port Development 27
Efficient Cargo Handling 27
Master Planning 28

I N T R O D U C T I O N I I I
Summary and Conclusions 29
Port Operations Recommendations 29
Container Operations 29
General Cargo 30
Port Information System 30
6. General Port Sector Policy Recommendations 32
Appendix. How to Handle Wood as General Cargo A-1
Illustrations
Figures
Figure 2-1. Inappropriate Rigging for Handling Bundled Lumber 8
Figure 2-2. Indirect Discharging Operation, Warehouse or Open Storage 10
Figure 3-1. Suezmax Container Vessel 15
Figure 3-2. Proposed Terminal and Berths with 280-Meter Basin 17
Figure 3-3. Proposed Terminal and Berths with 320-Meter Basin 19
Tables
Table 2-1. Berth Occupancy Rates 5
Table 2-2. Summary of Data on Container Operations and Other Operations 5
Table 3-1. Comparison of Land Resources with Basin Width at 280 versus 320 Meters 18
Exhibits
Exhibit 4-1.
Simplify 802.11 Deployments with the Right Tools 24
Features of a Good Master Plan 28


1. Introduction
Under the Technical Assistance for Policy Reform II Program, a consultant team from Nathan
Associates assessed port operations at the Damietta Port Authority (DPA) from February 19
through March 6, 2008. The primary objectives were to
• Recommend ways to improve operating efficiencies;
• Identify and evaluate systemic problems that affect current port operations or that could affect
future development and recommend ways to address these problems; and
• Assess policy related to port operations and development and recommend changes if
necessary.
Port operations specialist Raymond Lawler and port IT specialist Abdel Meguid Fouad met with
Egypt’s Deputy Minister of Transportation, Omar Elbakry, to discuss the assessment scope and
purpose. They then visited the port at Damietta twice during the study period, meeting with the
chairman and senior managers and touring the facilities with port officials to develop a detailed
perspective on the IT system and collect detailed statistics and non quantitative data on
operations. For comparative purposes, they also toured the Ports of Alexandria and El-Dekheila
and discussed operational and development issues with senior managers.
PORT OPERATIONAL STRENGTHS
First impressions of the port at Damietta were very positive. With a minor exception, the
impressive state-of-the-art security system meets all USTSA, CSI, and ISPS security
requirements for gate processing and the securing of sensitive internal facilities, offices, and
operation areas. Visitors’ identification is validated against appointment lists, visitors’
movements are monitored, and visitors are received by authorized staff and escorted to the
persons with whom they have appointments. During the study team’s tour, a security vehicle
escorted the van provided for touring.
The port’s IT system is also modern. A considerable amount has been spent to develop an
integrated port management system that includes a gate control and truck booking and
monitoring system, a container terminal management system using NAVIS as the primary
software, and a general cargo inventory control system. System installation has been underway
for about 18 months and the systems integrator has made good progress in installing the key
hardware and software and developing customized software for integrating functions. The one
major problem is that the RDT system specified for the container terminal does not work as
required; consequently, operations are still controlled manually even though NAVIS is available.
This is having a significant negative impact on the operation of the container terminal. A
proposal for an alternative communication system is being processed.

2 P O R T O F D A M I E T T A O P E R A T I O N A L E F F I C I E N C Y
We were also impressed by the quality and quantity of capital equipment. The Damietta
Container & Cargo Handling Company (DCHC), which operates the container terminal, has 6
new post-Panamax quay gantry cranes with 50-56 meter outreach and two older Panamax
cranes with a 45-meter outreach. The post-Panamax cranes are backed up by 10 new 40-ton
rubber-tired gantry cranes (RTGs) with 2 more on order. This equipment is supplemented by 6
mobile harbor cranes, 6 reach stackers, 18 top picks, and 19 forklifts of varying capacities. The
bulk quay has a Siwertell discharger for clinker, large specialized evacuators for handling grain,
and hopper conveyor systems for loading dry bulk materials.
It was also clear that the port employs a very competent and highly skilled staff of professionals
who know their jobs and are very open to new ideas. These qualities were particularly
noticeable among the IT, document processing, operations, and engineering staff. These staff
members answered our questions in detail or quickly secured answers from other sources.
PORT OPERATIONAL WEAKNESSES
The tours also revealed several areas that need improvement if the DPA is to fulfill its mission.
Our first and general impression is that work on quays and berths proceeds very slowly. This
was particularly noticeable at the general cargo berths, where the operators used relatively
primitive methods to handle general cargo and employed ship-to-truck delivery systems, one of
the slowest ways to discharge a vessel. The operators were also using portable bagging units
on the quay to bag grain directly from the ship for loading onto trucks. This procedure nearly
triples the time to discharge a vessel. These operations also appeared to be very careless,
resulting in much damaged cargo, especially wood products. The bulk handling operations
seemed to be more productive but are not yet up to international standards.
The tour of the container terminal also provided a number of surprises. Despite the presence of
two fourth-generation container vessels, crane operations and container handling at berths 1
and 2 seemed very slow. Container discharge and stowing and vessel turnaround lacked
urgency, and yard operations were also very relaxed. It is possible that we arrived during a
scheduled break or when the vessel was waiting to be convoyed out of the port. Even so,
terminal layout was not conducive to high efficiency operations. The terminal used two relatively
incompatible operating systems—an RTG system associated with the post-Panamax cranes on
berths 1, 2, and part of 3, and a reach stacker system primarily associated with berths 3 and 4,
with stacks 3-4 wide and 3 high. RTG systems are usually used in high-density, high-throughput
operations while reach stackers are used for smaller, low-density operations. They do not mesh
well when operating together on a single terminal.
In addition, stack organization could be greatly improved, especially with regard to the service of
reefer and the handling of empty containers. These tend to be located in the back of the
terminal in a rather disorganized manner that blocks traffic lanes. Discarded junk and out-of-
service machinery also clutter the area. For example, an out-of-service RTG was parked at the
end of a stack and much junk had accumulated around its base. All in all, the combination of
poor stack organization and sloppy housekeeping prevents realizing the potential of the new
cranes since crane productivity is determined by the ability of the yard to clear or feed the hook.

I N T R O D U C T I O N 3
We were also presented an overview of the proposed container terminal and its target market,
Suezmax mother ships serving the Asia–Europe container trades. Our first impression is that
these operations will cause serious vessel congestion in the harbor, particularly with respect to
managing vessel traffic in a single-lane channel. In addition, the proposed basin width of 280
meters does not provide enough maneuvering room for tugs in the event of an emergency,
thereby creating serious safety problems for vessel berthing. Finally, the allotted yard space
does not appear to be sufficient for anything but a rapid throughput transshipment operation.
In summary, regardless of how well a port is managed, particularly a landlord port, it will have
problems. Damietta faces a number of problems that should be addressed soon, including
• High berth occupancy and low vessel discharge/stowage rates.
• The use of two incompatible operating systems at the DCHC container terminal.
• General cargo handlings systems that need to be significantly improved.
• Poor condition of road and rail access into the port.
• Conflicting land uses that impede quay operations.
In addition, the port master plan needs to be updated to guide decisions about allocating space
for new operations and facilities, and the impact of the proposed container terminal on
operations should be carefully evaluated. Chapters 2 and 3 address port operation and other
development issues; Chapter 4 addresses IT issues, and Chapter 5 addresses general policy.


2. Current Port Operations
BERTH OCCUPANCY RATES
According to DPA officials, the port has an average berth occupancy rate of 80 percent. During
our first tour of the facilities, all but three berths were occupied and at least ten vessels were
waiting in the anchorage. Table 2-1 provides a two-month sample of occupancy by berth
number. Berth occupancy rates of 70 percent or more (30-35 percent on a container berth)
indicate rising congestion in the harbor and on the quays. Rates above 90-95 percent indicate
serious congestion and operating problems that significantly affect the port’s ability to achieve
international standards of operating efficiency and services.
Table 2-1
Berth Occupancy Rates
Berth Percent Berth Percent
Cont. Ter. (1-4) 60 13 143
05 119 14 125
06 94 15 106
07 110 16 134
08 94 In Anchorage/
Lighterage
29
09 106 Gas-1 24
10 77 Gas-2 7
11 112 Port average 56.9
12 138 Avg w/o private terminals 70.0
Except in the gas and specialty terminals, the berth occupancy rates are very high, averaging
109 percent. Nine of the 16 berths had rates above 100 percent, indicating frequent
simultaneous berthing of multiple smaller vessels. Only berth 10 was below 80 percent. The
exceptionally high 60 percent occupancy rate for the container terminals indicates serious
problems with operations.
These high occupancy rates are more indicative of slow vessel discharge/stowage than of
harbor capacity to handle the existing traffic. Table 2-2 provides a statistical breakdown of
factors that affect vessel stays at berths, such as total TEUS discharged/loaded, handling rate
per working hour, and handling rate per vessel call. Measures include time at berth, tons or
TEUs discharged, calculated berth productivity per period worked, calculated berth productivity
per vessel call, and berth productivity relative to vessel size.
Table 2-2
Summary of Data on Container Operations and Other Operations
Category Hours Metric TEUs Avg

6 P O R T O F D A M I E T T A O P E R A T I O N A L E F F I C I E N C Y
Anchor Worked Per call Tons D/L Tot,/
Call
Per hr. Hr/call NRTa
<-100 TEUs/call 9.0 16.4 25.5 173.0 18.2 36.4 3.4 2.4 12,084
>-100 TEUs/call 8.7 16.2 24.9 1896.1 199.6 399.2 28.4 23.0 19,170
Total containers 8.8 16.2 25.1 994.6 104.7 209.4 15.3 12.3 15,442
Berths 1-2 5.8 13.9 19.7 1148.1 120.9 241.7 19.4 15.6 21,614
Berths 2-3 5.0 14.6 19.5 1245.86 131.1 262.3 20.4 17.2 23,488
Berths 3-4 12.4 18.4 30.9 776.6 81.8 163.5 10.1 7.7 8,167
Hours Metric Tons Other
Operations Anchor Worked Per call
Days/
call Total Per hrb Hr/call
Avg
NRT
General cargo 83.8 80.6 188.0 7.8 53.6 2.2 1.0 2,007
Refrig. cargo 46.9 68.0 115.0 4.8 1764.0 32.5 16.5 1,764
Bulk carriers 55.5 140.1 210.2 8.8 57300 409.0 272.6 10,928
a Net registered tonnage
b The exact, actual unit of measure is not clear from the data provided. Consequently, assumptions were made relative to the total amount
transported versus the NRT of the vessel.
Table 2-2 is based on a two-month sample set of statistics provided by the IT department at
Damietta. Those statistics covered time of arrival in the anchorage, berth number, time at berth,
time when worked commenced, time when finished, total cargo handled, and basic vessel
dimensional characteristics. Because of problems with the controlling RDT system, container
vessel information includes only the totals expressed in kilograms that were discharged and not
information on loaded containers. To estimate total TEUs handled per call, we converted
kilograms to metric tons and then divided by 9.5mt, which is the worldwide average weight per
TEU. Because container carriers strive to balance their outgoing containers (full exports plus
empty containers) with incoming units, we multiplied this total by 2 to represent the total TEUs
handled per call. A review of the raw number indicates that these estimates are fairly close to
the mark.
CONTAINER TERMINAL OPERATIONS
Addressing the container terminal berths there are a number of significant measures to be
noted. These are as follows:
• The load/discharge rate for small container ships is 2.4 TEUs and for large containers 23
TEUs.
• Small vessels are handled primarily at berths 3-4, which are equipped with old Panamax
cranes and serviced by a slow reach stacker operation. The relatively low average number of
TEUs handled on these berths indicates that they service primarily feeder service operations.

C U R R E N T P O R T O P E R A T I O N S 7
• Productivity at berths 1,2, and part of 3 is very low, averaging between 19-20 TEUs per
vessel working hour and 15 to 17 TEUs per call despite the availability of six modern post-
Panamax cranes.
• Handling rates for berth 3-4, which seems to focus on smaller coastal vessels, is an extremely
slow 7.7 TEUs per hour.
This poor performance is primarily the result of operational problems and poor yard
organization. Solving problems with the RDT communication system will greatly improve
planning and yard control in the short term. In addition, the yard needs to be reorganized to
better facilitate tractor movement and yard-stack interface. Reorganization will entail cleaning up
unusable equipment, parts, and trash; reconfiguring reefer service areas into RTG-serviceable
stacks integrated with service platforms providing power; and monitoring equipment in the stack.
The operators should also consider developing an off-terminal Inland Container Depot (ICD )as
is being done in El-Dekheila with the development of a multi-agent container park for handling
empty containers.
Terminal officials say they are giving priority to deepening the draft alongside the main berths to
17 meters to handle the mother ships. But this may be putting the cart before the horse. The
terminal, particularly in yard operations, is not ready to handle large volumes of transshipment
traffic or handle traffic at much higher speeds. Three things need to be done before the
operators can even consider handling the large mother ships:
1. Reorganize the entire terminal into a high-density RTG operation to facilitate horizontal
transshipment operations. This will require removing the reach stacker operation and
achieving denser organization of traffic lanes.
2. Upgrade current operations to acceptable industry standards by rapidly completing the
container terminal management system and giving staff time to become adept system users.
3. Move empty containers,Container Frieght Station( CFS )operations, and all services not
essential to container handling away from the terminal.
These upgrades can be implemented in parallel with berth deepening but must be fully
implemented before operations begin.
GENERAL CARGO OPERATIONS
General cargo operations also have problems. At Damietta, the average general cargo vessel is
very small, is transporting an average of 54 MT of cargo per call, and is being discharged at an
average of 2.2 tons per hour. When compared to similar operations elsewhere (60 -100 tons per
hour for similar cargo), these rates are among the lowest we have seen—but among the easiest
to improve if the operator is willing to make the necessary changes. Such changes are not
prohibitively expensive. Productivity at Damietta can increase 400-600 percent with three
changes: (1) improve basic rigging systems for moving cargo between vessel and shore; (2)
unitize and palletize cargo as much as possible; and (3) adopt indirect delivery systems and
increase use of forklifts with specialized attachments.
8 P O R T O F D A M I E T T A O P E R A T I O N A L E F F I C I E N C Y
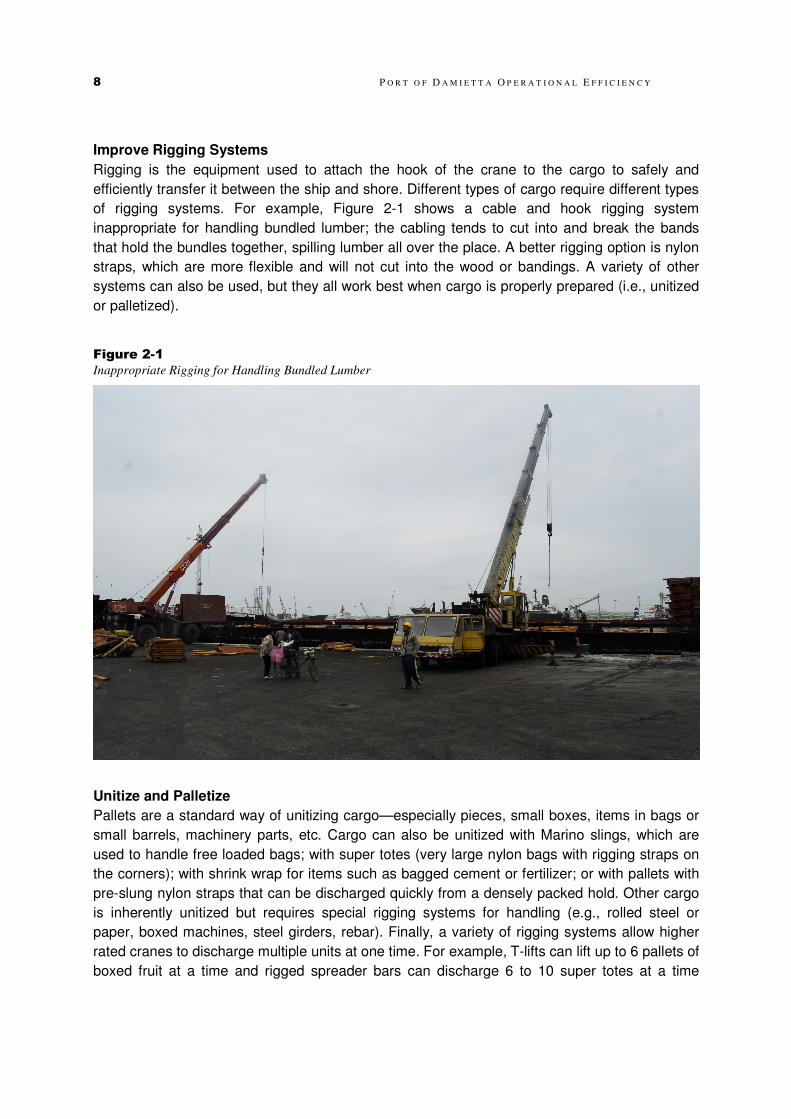
Improve Rigging Systems
Rigging is the equipment used to attach the hook of the crane to the cargo to safely and
efficiently transfer it between the ship and shore. Different types of cargo require different types
of rigging systems. For example, Figure 2-1 shows a cable and hook rigging system
inappropriate for handling bundled lumber; the cabling tends to cut into and break the bands
that hold the bundles together, spilling lumber all over the place. A better rigging option is nylon
straps, which are more flexible and will not cut into the wood or bandings. A variety of other
systems can also be used, but they all work best when cargo is properly prepared (i.e., unitized
or palletized).
Figure 2-1
Inappropriate Rigging for Handling Bundled Lumber
Unitize and Palletize
Pallets are a standard way of unitizing cargo—especially pieces, small boxes, items in bags or
small barrels, machinery parts, etc. Cargo can also be unitized with Marino slings, which are
used to handle free loaded bags; with super totes (very large nylon bags with rigging straps on
the corners); with shrink wrap for items such as bagged cement or fertilizer; or with pallets with
pre-slung nylon straps that can be discharged quickly from a densely packed hold. Other cargo
is inherently unitized but requires special rigging systems for handling (e.g., rolled steel or
paper, boxed machines, steel girders, rebar). Finally, a variety of rigging systems allow higher
rated cranes to discharge multiple units at one time. For example, T-lifts can lift up to 6 pallets of
boxed fruit at a time and rigged spreader bars can discharge 6 to 10 super totes at a time

C U R R E N T P O R T O P E R A T I O N S 9
assuming the crane can handle the weight. The appendix presents a sound method for unitizing
and handling lumber.
Adopt Indirect Delivery
An indirect delivery system (Figure 2-2) is usually the most difficult option to grasp as it is
counterintuitive to the traditional way of handling cargo in this part of the world. In this system,
cargo is placed directly on the ground and moved quickly by forklift to buffer storage, such as a
transit warehouse or open storage area. By clearing the hooks as quickly as possible, the
system maximizes the cycling of the ships’ cranes and discharges vessels as quickly as
possible. Putting cargo directly on the ground eliminates the adjusting and controlling that must
take place when putting it on a truck. If cargo is properly palletized or unitized the interchange
between it and the forklift, once the hook is disengaged, takes only one or two seconds. The
forklift should be able to move the cargo into a drop-off point in the buffer zone and return to the
ship’s hook in two minutes or less to meet the next cycle of the crane. Ports well practiced in
this method, such as Philadelphia, can discharge properly palletized cargo at a rate of 300-400
tons per hour.

10 P O R T O F D A M I E T T A O P E R A T I O N A L E F F I C I E N C Y
Figure 2-2
Indirect Discharging Operation, Warehouse or Open Storage
As cargo is discharged, a second crew inside the buffer zone receives it from the forklifts
serving the vessel, organizing it into truckload lots and loading multiple trucks at the back of the
buffer zone (see Figure 2-2). If the operator is handling a homogenous load bound for one
consignee then the entire shipment can usually be passed through the system and shipped out
in one day. For multiple consignees the process may take a little longer, but with the aid of a
warehouse inventory control system it can also be done in the same time period.
Advantages. Indirect delivery offers multiple operational and economic advantages:
• An increase in the rate of discharge and throughput (at Damietta a factor increase of 400-
600 percent).
• Continuous truck loading, whether a vessel is on the quay or not.
• A drastic reduction in the vessel berth occupancy rate.

C U R R E N T P O R T O P E R A T I O N S 1 1
• A lower per unit cost for handling cargo—50 percent or more reduction.
• A great reduction in damage to cargo.
Requirements. Using indirect delivery at Damietta will require
• A transit warehouse or open storage area behind the quay with room to queue trucks at the
back of the buffer zone.
• Four to 8 forklifts, depending on vessel size and number of hatches to be serviced. The initial
cost will pay for itself in considerable per unit cost savings as 4-5 times more cargo can be
handled in the same time period.
• Cargo palletized or unitized in a manner that permits quick and efficient handling. This means
that the operator must collaborate with the importer/consignee to ensure the cargo is prepared
properly for transport.
Cautions. Other things must also be considered when adopting indirect handling. The operator
must have an incentive to increase productivity, and for monopolies such incentives are of the
carrot and stick variety. At a minimum, the port needs to impose basic productivity standards on
the operator and provide a lease space (berth, warehouse/open storage, and truck access and
loading area) that is sufficiently large and organized to allow efficient operations. The operator
must purchase or lease appropriate rigging and cargo handling equipment and accept
responsibility for damages to the cargo when it is in his care.
In Damietta, the most appropriate place for this type of general cargo operation is berths 5-8.
The quay is fairly wide, and there are a number of large open storage areas, a large transit-type
warehouse, and a refrigerated warehouse that should already be employing the proposed
system. The biggest problem is that the railroad spur directly behind the warehouses will hinder
truck operations unless brought to grade. More important, a group of agents’ offices hinders
access to the area. If the area is properly designed and laid out, however, space behind the
warehouses is sufficient for truck loading that does not impinge on the agents’ offices.
BULK CARGO SYSTEMS
It appears that the port possesses sufficient specialized bulk handling systems—a large grain
silo/berth operation employing large vacuvators, numerous floor-loaded grain and other bulk
warehouses, portable vacuvators for discharging grain ships on open berths, a clinker handling
system, etc. All systems appear to be in good condition and well utilized. Unfortunately, two
months’ worth of data is insufficient for assessing the systems’ average productivity. According
to available data, the typical bulk carrier spends three days in the anchorage and remained on
berth six days for discharging or loading. Carriers were relatively small 11,000 NRT carrying an
average of 57,000 MT and were discharged at a rate of 409 tons per hour. These vessel
discharge and turnaround rates are about average for the systems employed. Serious problems
cannot be detected without a more detailed assessment of the systems themselves or analysis
of more comprehensive data operations.
12 P O R T O F D A M I E T T A O P E R A T I O N A L E F F I C I E N C Y
COMPARISON TO OTHER PORTS
We also toured the Ports of Alexandria and El-Dekheila to observe container terminals, general
cargo and bulk cargo areas, and IT operations. (No detailed data on productivity or other
operational aspects were gathered.) As at Damietta, both ports had excellent security, IT
systems, and modern equipment and were well run.
Alexandria
The Port of Alexandria is hemmed in by a dense urban environment, so development of new or
more efficient facilities and operations is highly constrained. Recent road construction has
greatly improved access to main facilities, but many facilities are old and were designed for a
different period of operations. This problem is particularly true for general cargo and
warehousing operations. As at Damietta, discharge is very slow, operators use inappropriate
rigging systems, and a significant amount of cargo, particularly lumber, is being damaged.
Container operations are also constrained by location and lack of space. Access to and from the
terminal is difficult. The terminal has only 3 quay cranes (2 Panamax and 1 post-Panamax) and
4 RTGS, which is insufficient for the traffic. Yard operations, which appeared to suffer from
congestion, could be better organized. There is very little space for storing empty containers.
Yard effectiveness in serving the cranes is difficult to assess without statistical data, but one can
probably safely assume that the yard shares some of the same problems and causes as
Damietta.
The bulk coal terminal next to the container terminal has seen better days. The equipment is
very old, the rail access very poor, and the whole operation highly constrained by location. The
terminal also has a variety of environmental problems.
In sum, the port’s site and growth constraints have hampered development of operationally
efficient facilities and services. Many of the upgrades suggested for Damietta apply to
Alexandria. Space rationalization and a re-evaluation of land use would also be beneficial.
El-Dekheila
The Port of El-Dekheila has significant land resources that are well planned and utilized. It has
wisely focused on specialized markets, primarily bulk products such as coal, iron ore, grains,
and fertilizers, and the bulk facilities are state of the art. The planning program seems pro-
active; for example, a container park to be used by multiple agents for empty container storage
and recycling is being developed. Warehousing operations appear to be well organized but
general cargo handling operations suffer from the same problems found at Damietta and
Alexandria.
The container terminal also has many of the same problems as at the other ports. Yard
congestion appears to be worsening. Many empty containers appear to be stored in the main
yard and near the CFS (which accounts for the need for the off-terminal container park). More
important, given the volume of traffic, the yard does not appear to have enough RTGs and yard
tractors. The brochure that was provided indicates that the terminal has 5 post -Panamax and 6
RTGS. For normal operations, the rule of thumb is 2 RTGs per crane, but this terminal has just
C U R R E N T P O R T O P E R A T I O N S 1 3
over one per crane. Also given that it is a three-berth terminal it could benefit from and
additional quay crane or two.
The port is in very good shape and has considerable room for expansion. The container
terminal and general cargo area could benefit from investment in support equipment and better
training and expert advice in modern cargo handling techniques.
SUMMARY AND CONCLUSIONS
Overall, the port at Damietta has serious problems with berth congestion due primarily to very
low berth productivity. A variety of factors contribute to this situation, as follows:
• Container terminal. Problems with the Container Terminal Management System’s (CTMS)
implementation, different handling systems in same yard, inefficient yard organization, and
secondary services, empty containers, and junk cluttering the premises.
• General cargo and some nonspecialized bulk cargo. Inappropriate handling equipment, a
preference for discharging to trucks, provision of secondary services (bagging) on quays, and
lack of cargo palletization.
• General operations. Lack of exposure to modern cargo handling methods or new
technologies that are standard in most developed ports.
• Productivity incentives. There appears to be insufficient economic and regulatory incentives
to increase productivity.
• Productivity standards. Cargo handling and vessel service operations on most quays are
contracted to private or semi-public operating companies, and port management tends to
assume that low productivity is their problem, not the port’s. The DPA makes little effort to
spur operators to improve their productivity.
Given the rapidly rising demand for new port services and plans to develop new port industries
and a Suezmax container terminal, the DPA must begin to improve berth occupancy rates and
berth productivity. Chapter 3 presents the operational implications of the proposed terminal in
detail.

3. Operational Implications of Proposed Terminal
Because neither the DPA nor the Ministry of Transportation was able to provide a copy of the
operational and economic feasibility study developed for the proposed terminal, our analysis
focuses on only three areas: (1) the effect of the design of the proposed ship basin and berthing
plan on navigation and safety; (2) the availability of land for container yard operations; and (3)
the impact of the project on vessel traffic in the harbor.
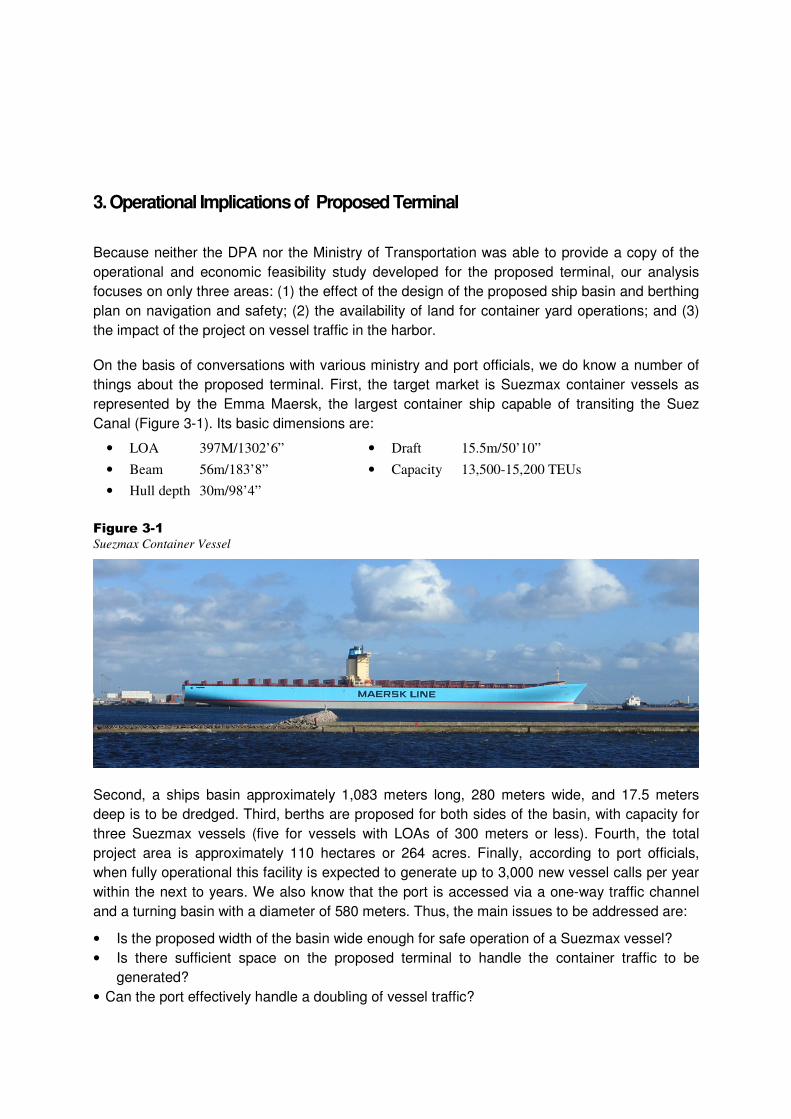
On the basis of conversations with various ministry and port officials, we do know a number of
things about the proposed terminal. First, the target market is Suezmax container vessels as
represented by the Emma Maersk, the largest container ship capable of transiting the Suez
Canal (Figure 3-1). Its basic dimensions are:
• LOA 397M/1302’6”
• Beam 56m/183’8”
• Hull depth 30m/98’4”
• Draft 15.5m/50’10”
• Capacity 13,500-15,200 TEUs
Figure 3-1
Suezmax Container Vessel
Second, a ships basin approximately 1,083 meters long, 280 meters wide, and 17.5 meters
deep is to be dredged. Third, berths are proposed for both sides of the basin, with capacity for
three Suezmax vessels (five for vessels with LOAs of 300 meters or less). Fourth, the total
project area is approximately 110 hectares or 264 acres. Finally, according to port officials,
when fully operational this facility is expected to generate up to 3,000 new vessel calls per year
within the next to years. We also know that the port is accessed via a one-way traffic channel
and a turning basin with a diameter of 580 meters. Thus, the main issues to be addressed are:
• Is the proposed width of the basin wide enough for safe operation of a Suezmax vessel?
• Is there sufficient space on the proposed terminal to handle the container traffic to be
generated?
• Can the port effectively handle a doubling of vessel traffic?

16 P O R T O F D A M I E T T A O P E R A T I O N A L E F F I C I E N C Y
Fully addressing these issues requires substantial analysis and far more information and time
than was available for our assessment. Our objective, then, is to define and analyze the
dimensions of any problems and recommend options for solving them.
BASIN AND YARD ISSUES
To maximize container yard area the developers have proposed a basin width of 280 meters, or
5 times the beam of the largest expected vessel (56 meters). This is a basic rule of thumb used
by planners for calculating the separation between berths opposite of each other. This width
allows two vessels of 56-meter beams to be stationed at opposite berths and then provides 56
meters on either side of an incoming or outgoing vessel also
with a 56-meter beam. A vessel of this size vessel will have
to be assisted by very large and powerful tugs that
commonly range from 30-35 meters LOA. If the tug must
push vertically on the vessel when it is on the basin
centerline it will have only 21-26 meters between it and the
vessel at berth behind it to maneuver. This is a very small
space to control a vessel 400 meters long and 30 meters
high.
These minimum dimensions are proposed to maximize yard
space. Is the gain in yard space worth the risk of a
catastrophic accident in the basin due to insufficient
maneuvering room? Figure 3-2 is a conceptual layout of the
proposed terminal and basin with capacity to handle three Emma Maersk size vessels. It shows
the possible positioning of four 30-meter tugs moving a vessel to a back berth between two
vessels already at berth. The assumption is that it is on course moving along the basin
centerline. But is there sufficient room between the various vessels to compensate for
• Normal deviations in course due to wind, currents, and other environmental conditions?
• The “oops” factor, or unexpected events, such as loss of power by a tug, a breakdown in
navigational equipment, or a missed calculation by the pilots or crew of the ship or tugs?
We were informed that the designers were completing desktop simulation models testing factors
that could cause problems in the basin and how the crew, pilots, and tug operators could
respond to them. The results of this study have not been received as of this writing. The
problem with such models is that they do not incorporate or assess the oops factor very well.
Given traffic congestion that this project will likely generate, it does not seem that there is
sufficient maneuvering space to react quickly and appropriately to an unexpected event.
The Oops Factor
In New York City, a large tower crane erected
on a building construction site was stabilized by
a single cable that met minimum safety
specifications for the situation. Safety
inspectors had only recently approved the site.
During operations the crane operator
accidentally cut the cable and the crane
toppled and collapsed a building, killing six
people. The accident was apparently caused
by unpredictable human error.

I M P L I C A T I O N S O F P R O P O S E D T E R M I N A L 1 7
Figure 3-2
Proposed Terminal and Berths with 280-Meter Basin

18 P O R T O F D A M I E T T A O P E R A T I O N A L E F F I C I E N C Y
What if another 40 meters were added to the basin width? How much more room would be
available to cope with unexpected events in the basin and how much less space would be
available for the yard? Figure 3-3 illustrates the trade-off between maneuvering space (risk) in
the basin and available space in the yard. Available maneuvering space between vessels would
increase to 76 meters on either side of the centerline of the incoming/outgoing vessel. Intuitively
this appears to be a more comfortable distance and certainly reduces risk. Table 3-1 compares
land resources available with a wider basin versus the original width basin.
Table 3-1
Comparison of Land Resources with Basin Width at 280 versus 320 Meters
Option Land Lost Land Remaining Ha/b, 3 Berths 4 berths 5 berths
280m (as designed) 22.4 ha 88.0 ha 29.3 ha 22 ha 17.6 ha
320m (40 meters
added)
27.0 ha 83.2 ha 27.7 ha 20.8 ha 16.6 ha
Difference 4.6 ha 4.8 ha 1.6 ha 1.2 ha 1.0 ha
In sum, the project gains a little more margin for error at the expense of 1-1.6 hectares per
berth—not a bad trade-off in the larger view. The problem is that the land directly behind the
southwest set of berths does not have enough backup yard directly behind it to effectively
absorb a surge of 3,000 to 4,000 containers as might be expected in a transshipment operation
involving Suezmax vessels. We suggest four options:
1. Move the small liquid bulk storage facilities to the proposed reclaimed area at the end of the
bulk quay and use the vacated space.
2. Go to a more dense and automated operation using rail-mounted bridge cranes.
3. Handle smaller vessels on the southwest quay and the Suezmax vessels on the northeast
side.
4. Expand the yard into the lands to the northeast and locate secondary services there
(maintenance facilities, administration, utilities, equipment, and empty storage).
There are variety of ways to overcome the minimum loss of yard space while gaining safety and
reducing the port’s overall risks. It must be kept in mind that once built, it will not be
economically possible to change it.
CHANNEL AND HARBOR CONGESTION ISSUES
If up to 3000 more vessels per year will be in the harbor annually over the next ten years, as
local officials project as a result of the new container terminal, then the port has a serious
problem. That number of vessels is a doubling of the current vessel population. The port’s
current berth occupancy rate is 109 percent on common usage quays. A doubling of traffic
amounts to 6,000 or more vessel calls per year, or an average of 17 per day. Sample data show
an average stay in port by all vessels of 2.24 days. If berth productivity does not improve the
port will have to provide berths for an average of 38 ships in the harbor per day.

I M P L I C A T I O N S O F P R O P O S E D T E R M I N A L 1 9
Figure 3-3
Proposed Terminal and Berths with 320-Meter Basin

20 P O R T O F D A M I E T T A O P E R A T I O N A L E F F I C I E N C Y
So what are the options for dealing with this problem? First, the DPA must work with the berth
operators to greatly increase berth productivity. In some cases, such as the general cargo berth,
significant increases can be had at minimum expense. This need can be accommodated by
bringing in operational experts on a regularly scheduled basis to assist operators in finding ways
to increase berth productivity and efficiency. Other cases, such as the container and some bulk
operations, will require in-depth operations planning, new technologies, and ultimately
significant investment in new infrastructure, facilities, and equipment.
Efficiencies gained on berths will reduce demand for berth space but not for passage in the
channel, particularly if the vessel sizes remain relatively the same. The current system for
convoying can only be ratcheted so far before it reaches the limits of practicability. So what are
the options? One is to gear the port’s marketing to service larger vessels at berths with high
productivity. This is a long-term strategy, however, and might not achieve the desired results.
The second more practical option is to widen the access channel to accommodate two-way
traffic or develop a second channel (given the constraints of the port this is not as likely).
SUMMARY AND CONCLUSIONS
The proposed container terminal will generate significant business and employment for the port
at Damietta and will have a major economic impact on the region. But with that success comes
a complex set of problems that the port and government have not fully evaluated. We have
highlighted some acute and likely problems—such as operational safety arising from the basin
size and vessel congestion in the port. Others include land side traffic congestion and
connections with the national transportation network, the best and most practicable use of land
in and around the project area, and upgraded systems for the control of vessel traffic in the
harbor, access channel, and anchorage.

4. IT Systems and Operations Control
The Damietta Port Authority (DPA) has had a modern IT system for two years. The port has
sufficient funds to further develop and expand the system, but could benefit from technical
assistance to ensure that the IT or automation strategy aligns with the port’s business strategy
(efficiency and profitability), that the port stays on track to achieve its strategies and goals, and
that IT performance is monitored. Areas needing improvement include data use, vessel traffic
services (VTS), and wireless implementation.
IMPROVE DATA USE
The port has already invested in a modern IT system as a first step in modernizing operations
and boosting efficiency. To capitalize on IT capabilities to improve port efficiency and to
optimize returns on IT investment, the port should implement an executive information system,
ensure IT governance, and develop a system for data verification.
Executive Information System
Senior executives use executive information systems (EIS) in making decisions that draw on
internal and external data relevant to an organization’s strategic goals. An EIS usually has
simple menus, simple interfaces, and graphical displays; produces high-level reports that pull
data from a database; and offer strong reporting and “drill-down” capabilities. They help
executives highlight, analyze, and compare trends; monitor performance; and identify
opportunities and problems. This capability is essential for port executives to monitor the port
performance in real time. Important parameters to monitor include: traffic trends, turnaround
time, berth utilization, daily revenues, revenue trends, equipment availability and utilization, and
maintenance performance reports. For the Port of Damietta, the EIS would be developed as a
software module to be added to existing applications at minimum cost.
IT Governance
IT governance means how an organization plans, directs, controls, and monitors current and
future use of information technology. Every organization—large, small, public, or private—
should ensure that its IT function supports larger strategies and objectives. The sophistication of
governance varies with size, industry, and applicable regulations. In general, the larger and
more regulated an organization, the more detailed its IT governance structure. According to the
IT Governance Institute, governance of IT focuses on five areas:
• Achieving strategic alignment of IT functions with business functions through the planning
process. True alignment occurs when the corporate side of the business communicates
effectively with IT leaders about costs, reporting, and impacts.
• Delivering on promised value by doing what is necessary to deliver the benefits promised at
the beginning of a project or investment. This may require developing a process by which

22 P O R T O F D A M I E T T A O P E R A T I O N A L E F F I C I E N C Y
certain functions are broadened or increased when a value proposition is growing, and then
narrowed or eliminated when value decreases.
• Managing resources effectively, such as by organizing staff by skills instead of line of
business so they can be deployed to various lines of business on a demand basis.
• Managing risk in a formal framework that imposes rigor on what IT measures, what it accepts
as risk, and how it reports on risks.
• Measuring performance, for example, by instituting an IT Balanced Scorecard, which
examines where IT contributes to business goals, uses resources responsibly, and develops
human resources. The scorecard system uses qualitative and quantitative measures.
IT governance implies a system in which all stakeholders, including the port executives, internal
customers and related areas such as finance and operations, have the necessary input into the
decision making process. This prevents a single stakeholder, typically IT, being blamed for poor
decisions. It also prevents users from later complaining that the system does not behave or
perform as expected.
Data Verification
The Port of Damietta IT system is using adequate data verification techniques, based on
checksum methods. However, an IT system is as good as the accuracy of the data that it
provides. In addition to the traditional internal data verification and validation techniques, the full
usage of the IT system is an excellent vehicle for verifying data and alerting users to data
discrepancies. The IT system in the DPA is used only for limited applications, mostly financial.
Even some of the financial applications—such as accounts receivables—are still not
implemented. This limited use does not allow sufficient data verification by the port internal
users.

I T S Y S T E M S 2 3
UPGRADE VESSEL TRAFFIC SERVICES
The currently installed VTS is a basic AIS/Radar system
displaying on low-resolution displays. We recommend upgrading
to high-resolution displays, new operation consoles, and higher
definition redundant radars. Detailed specifications would be
developed after a detailed site survey. These recommended
upgrades will help the VTS keep pace with near doubling of
traffic expected with the new container terminal.
IMPROVE WIRELESS NETWORK
DPA elected to deploy a wireless network compliant with IEEE
802.11b standard, and specified a traditional 2.4 GHz frequency
band. A 5.8 GHz band, however, provides better performance
and less radio frequency (RF) interference. Egypt’s National
Telecommunications Regulatory Authority (NTRA), however,
has not approved DPA to use the 5.8 GHz band and DPA is
limited to the 2.4 GHz band. Initial implementation of the
wireless network at the container terminal faced radio
interference, poor availability, and poor performance due to use
of conventional technology and limited high towers for access
points. The DPA is planning to conduct a detailed survey and replace the conventional
technology with the newer “mesh technology.”
RF Site Survey Tips
We recommend a preliminary walkthrough of the area to detect the presence of potential RF
interference and identify possible locations for mounting access points. With preliminary findings
one can more readily plan to select access point locations, as follows:
• Perform the survey using tools (Exhibit 4-1) and talk to people in the facility to learn about
other RF devices that might be in use.
• If possible and practical, prevent the interfering sources from operating. If interference sources
cannot be simply turned off (e.g., one cannot require a nearby company to turn off its wireless
LAN), it may be possible to disallow the use of Bluetooth-enabled devices where 802.11 users
reside.
• Provide adequate wireless LAN coverage. One of the best remedies for 802.11 RF
interference is to ensure the wireless LAN has strong signals throughout the areas where
users will reside. If signals get too weak, then interfering signals will be more troublesome.
• Set configuration parameters properly. If deploying 802.11 networks, try tuning access points
to channels that avoid the frequencies of interfering signals. For 802.11 frequency hopping
systems, try different hopping patterns. The 802.11e MAC layer offers some built-in RF
interference avoidance algorithms.
• Deploy the newer 802.11s wireless LANs. Most potential for RF interference is now in the 2.4
GHz band (i.e., 802.11b).
2.4 GHz versus 5GHz
The entire 2.4GHz band is 80MHz wide,
which allows only three non-overlapping
channels. The 5GHz bands have much
more spectrum available—12 non-
overlapping channels, each with 20MHz
of bandwidth. The 2.4GHz wireless
LANs can experience interference from
cordless phones, microwaves, and other
wireless LANs. Interfering signals
degrade the performance of an 802.11b
wireless LAN by periodically blocking
users and access points from accessing
the shared air medium. If potential
interference cannot be reduced to an
acceptable level, the usual option is to
deploy a 5GHz system, which is
relatively free from interfering sources.

24 P O R T O F D A M I E T T A O P E R A T I O N A L E F F I C I E N C Y
Exhibit 4-1
Simplify 802.11 Deployments with the Right Tools
Wireless LAN installation is tricky. One
cannot visualize the wireless medium.
Facility construction and silent sources of RF
interference affect the propagation of radio
waves, often in odd ways. The right tools
can ease the locating of access points.
Basic Tools. Laptop with an 802.11 PC
card and free site survey software from
radio card vendor. Most software displays
access point signal strength and quality to
determine effective operating range. One
makes a "best guess" about locations, then
places an access point at each location and
walks around with the laptop while
monitoring and noting signal levels. The goal
is to verify the maximum distances that will
maintain adequate signal levels, generally
the value that continues to enable operation
at the planned data rate (e.g., 11 Mbps). If
the best guess location doesn't provide
adequate coverage, one relocates the point
or adds points and repeats testing. To ease
the physical demand of toting a laptop, one
can use an 802.11 CompactFlash card with
a pocket PC device, such as the Compaq
iPAQ, Casio Cassiopeia, or HP Jornada.
This method, however, does not allow one to
detect RF interference between access
points and from other RF sources, such as
Bluetooth devices, microwave ovens, and
wireless phones. For one-time installations,
especially in smaller facilities, free vendor-
supplied software should be adequate.
Advanced Tools. An 802.11b spectrum
analyzer graphically illustrates the amplitude
of all signals falling within a chosen 22 MHz
channel. This enables one to distinguish
802.11 signals from other RF sources that
may cause interference, making it possible to
locate and eliminate the source of
interference or use additional access points
to resolve the problem. A spectrum analyzer
also allows one to monitor channel usage
and overlap.
802.11 limits up to three access points to
operate in the same general area without
interference and corresponding performance
impacts, causing difficulties when planning
the location and assignment of channels in
large networks. Spectrum analysis displays
these channels, enabling one to make better
decisions on locating and assigning channels
to access points.
Advanced site survey tools have been
developed by a handful of test equipment
companies, such as Berkeley Varitronics
Systems (Metuchen, New Jersey) and Softbit
(Oulu, Finland). Softbit'sTriCycle, which can
be loaded on a laptop equipped with a radio
card, provides a very useful display of nearby
access points, association status, signal
levels, and can display coverage areas. It
cuts the amount of time spent on surveys and
helps ensure accurate surveys. Berkeley’s
handheld Grasshopper has fewer graphical
features but weighs only three pounds.
Advanced tools are expensive—up to several
thousand dollars—they are best used when
installing multiple wireless LANs or when the
wireless LAN environment is complex.
Warehouses with many high metal racks and
manufacturing plants full of machinery will
wreak havoc on radio waves. In such
environments, the extra cost of advanced
tools is warranted.
When conducting the site survey, follow these general steps:
I T S Y S T E M S 2 5
• Obtain, verify, and mark a facility diagram. Before getting too far with site survey, locate
building blueprints or prepare a floor plan that shows the location of walls, walkways, etc.
Then walk through the facility to verify the accuracy of the diagram and to note barriers that
could affect the propagation of RF signals (e.g., metal racks and partitions and other items
usually not on blueprints). On the facility diagram, mark areas of fixed and mobile users. Mark
where mobile users will not go as well as where they will go. Fewer access points may be
needed if roaming areas are limited.
• Determine preliminary access point locations. Approximate the locations of access points
to ensure adequate coverage on the basis of the location of wireless users and range
estimates for the wireless LAN products. Plan for some propagation overlap among adjacent
access points, but keep in mind that channel assignments for access points will need to be far
enough apart to avoid inter-access point interference. Be certain to consider mounting
locations, which could be high metal masts or metal supports above ceiling tiles. Note suitable
locations for the access point, antenna, data cable, and power line. Consider different antenna
types; for example, an access point mounted near an outside wall could be a good location if
using a patch antenna with relatively high gain oriented within the facility (warehouse).
• Verify access point locations. Many wireless LAN vendors, including Cisco, Symbol, and
Proxim, provide free RF site survey software that identifies the associated access point, data
rate, signal strength, and signal quality. The software may be loaded onto a laptop or
PocketPC to test the coverage of each point. Or one may use a handheld site survey tool
available from several different companies. For example, Berkeley Varitronics Systems offers
handheld devices, such as Grasshopper and Scorpion, that provide advanced site survey
functions.
• Install an access point at each preliminary location, and monitor survey software
readings by walking varying distances from the access point. The access point does not
need to be connected to the distribution system because these tests simply “ping” the access
point—but AC power is necessary so carry an extension cord and learn where AC outlets
exist. Take note of data rates and signal readings at different points as you move to the outer
bounds of the access point coverage. In a multi-floor facility, perform tests on the floor above
and below the access point. Keep in mind that a poor signal quality probably indicates that RF
interference is affecting the LAN. Verifying this requires a spectrum analyzer to characterize
the interference, especially if there are no other indications of its source. Test results will
determine whether an access point needs to be relocated and retested.
• Document findings. Once a location is found to provide adequate coverage, identify it on the
facility diagrams to aid installation. Provide a log of signal readings and supported data rates
near the outer propagation boundary of each access point as a basis for any future redesign.
Mesh Wireless Networking
Mesh networking has been around for years; 802.11s is reserved for mesh networking standard.
The IEEE expects to ratify a standard for 802.11s in 2008. Instead of a hub-and-spoke model of
wireless communications—in which every device connects to a central access point, mesh
networking has every device in the area act as a repeater or router, relaying traffic for everyone

26 P O R T O F D A M I E T T A O P E R A T I O N A L E F F I C I E N C Y
else. When mesh-enabled devices are very close to each other they automatically create a
wireless mesh network, and traffic hops from device to device until it reaches the nearest
Internet access point, reducing the need for central antennas and improving wireless coverage.
Current mesh proposal is for interoperable standard for 802.11s that would be built on top of
and be compatible with the current 802.11a/b/g standards and be designed so that nodes could
automatically discover each other and form mesh networks, as well as for "Mesh Portals" that
would be able to connect to regular 802.11 networks. The port also wants to build into the
802.11s protocol quality of service standards so that the network will know what traffic to
prioritize if one were streaming video around a network.
SUMMARY
The port has already taken big steps in IT implementation, but can benefit immediately from a
technical assistance program to implement the recommendations offered in this chapter. Since
most of these recommendations are applicable to all other Egyptian ports, the technical
assistance program could be performed once to the benefit of ports that have already
implemented or are planning to implement a port IT system. We strongly recommend that the
Port of Damietta improve data use by implementing an EIS and IT governance processes and
by developing a system for verifying data. We also recommend upgrading the vessel traffic
system to cope with expected increases in traffic, and improving and expediting implementation
of the wireless network for managing port operations.

5. Port Development
EFFICIENT CARGO HANDLING
Inefficient cargo handling, with the exception of the bulk systems, is a major weakness at the
Port of Damietta as well as ports in Alexandria and El-Dekheila. Inefficient handling is a major
cause of the excessive berth occupancy rates that will hinder plans to expand the ports of
Damietta and Alexandria. We were frequently advised at all ports that cargo-handling operations
are not a concern of port authorities as those operations are in the hands of private operators.
But given the myriad problems facing the DPA in developing the new container terminal it is
clear that berth productivity is indeed DPA’s problem. For example,
• Low berth productivity leads to high berth occupancy, which leads to harbor congestion, which
leads to high costs for vessel operators, which leads to higher rates for the operators’
customers—who are also the port’s customers.
• Under basic port economics, the more cargo that passes over the quay the more money the
port earns. Wharfage fees are generally the single highest source of income for the port. By
speeding up the throughput the port provides more opportunity for additional cargo to be
handled and greater economic growth.
• All terminals and port support systems are interdependent. When one element is inefficient
other elements are affected.
• If operators do not maintain industry standards then the port’s traffic growth, marketing, and
development will be hindered. High productivity in berth and terminals sells the port to new
customers; low productivity drives customers away.
The Egyptian ports that were reviewed and the Ministry of Transport need to adopt a proactive
policy and program to work with tenants and operations to improve productivity in their
operations. This can be done a number of ways. For example,
• During initial contract negotiations and in renewal negotiations, the port and operator can
agree to minimum equipment, technical, and productivity requirements based on international
rather than local norms. Incentives for achieving target throughput and productivity levels
significantly above the minimum might also be negotiated.
• The port can provide technical assistance and training in methods that raise productivity and
reduce cargo damage.
• The port can encourage tenants to invest in new equipment and operating technologies by
sharing investment costs. For example, the port agrees to invest in certain basic infrastructure
and the tenant to supply building, equipment, and operational know-how.
• The port can foster competition among operators through such means as open stevedoring,
allocation of certain berths/backup areas to competing entities with minimum performance
requirements or privatization of semi-government operating companies.

28 P O R T O F D A M I E T T A O P E R A T I O N A L E F F I C I E N C Y
These are only a few ways that a landlord port can act to raise berth productivity—and it is
clearly in the port’s best interest to do so. The current hands-off attitude of port officials is
counterproductive and allows port congestion problems to worsen.
MASTER PLANNING
One of the best tools for guiding the effective development of ports is the port master plan. The
lack of an updated plan is affecting Damietta’s long-term development. Without an updated plan
the port does not have a foundation for making decisions or for accommodating requests from a
variety of investors for spaces in the port. Land use and operational conflicts are brewing. For
example, the allocation of a large parcel of land behind the container terminal effectively
prevents an expansion of that terminal or the development of a much-needed empty container
storage depot. It appears that the allocation of land just to the north of the new terminal to non-
port use greatly constrains options for that facility. A number of other land use conflicts could
also be addressed in a master plan.
The benefits of a current master plan are evident in the ports of Alexandria and El-Dekheila. The
former recently greatly improved external accessibility and internal traffic flows by implementing
a comprehensive transportation plan that was a component of its master plan. The latter has
allocated space properly for a container park and is developing long-term plans for additional
facilities. Officials also indicate that they are considering moving some bulk terminals, in
particular the coal terminal, to El-Dekheila to create space for development more appropriate for
Alexandria. This is a very rational way to plan the long-term development of a port.
Exhibit 5-1 Features of a Good Master Plan
• Demand analysis and long-term cargo
and fleet forecasts.
• Detailed infrastructure and land use
assessment.
• Detailed operations and technical
assessment.
• Organizational, financial, and human
resources assessments.
• Creation and evaluation (economic and
operational) of alternative short,
medium, and long-term development
scenarios.
• Identification of most appropriate
development scenarios and targets.
• Creation of a framework for the short,
medium, and long-term development.
• Overall financial and risk assessment.
• Environmental impact assessment.

P O R T D E V E L O P M E N T 2 9
SUMMARY AND CONCLUSIONS
Overall, the ports at Damietta, Alexandria and El-Dekheila are generally well managed, well
equipped, and have very good professional staffs. They also share a number of common
problems, such as low productivity in the container and general cargo operations, vessel
congestion in the harbor, and with the exception of El-Dekheila a relative lack of space to grow.
For Damietta, there are a number of specific problems that should be dealt with soon to
minimize their negative impact on major projects now being planned.
Berth Productivity. Berth productivity at Damietta is surprisingly low given the quality of capital
equipment available. Productivity is impeded by technical problems with various operating and
operations control systems, incompatible operating systems, lack of incentives for the operating
companies to increase productivity, lack of training or experience in the use of modern
technologies or cargo handling systems, and poor organization of some yards and quay support
areas.
Operational risks of proposed terminal. The proposed container terminal raises serious
concerns about safety, vessel congestion, and landside impacts. Results of desktop simulations
of basin width and operating safety are being evaluated, but the extent to which the models
incorporated the “oops” factor (human error, mechanical breakdown) is unknown. Our analysis
indicated that another 40 meters in basin width could provide an adequate safety margin for
emergency tug operations without significantly decreasing the total size of the container yard.
Although the extra width of the basin slightly decreases the size of the terminal overall, it more
directly affects the amount of space available behind the southeast quay for handling Suezmax
vessels. The port must be willing to consider a variety of options to facilitate the development of
an efficient and effective operations system.
If the terminal realizes the additional 3,000 ship calls that government officials project, this
means an average of 17 vessels per day will call the port and, if vessel dwell times do not
improve, 38 vessels in the harbor per day. This in turn implies long delays in the anchorage and
significant loss in revenue as ships go elsewhere or increase rates.
PORT OPERATIONS RECOMMENDATIONS
Our recommendations are divided into 3 parts: 1) those that are specific to Damietta; 2)
important studies to be undertaken; and 3) overall port development and general policy
considerations. With respect to Damietta, the focus is primarily on the container and general
cargo operations, IT systems, and planning issues pertaining to the proposed new container
terminal.
Container Operations
The terminal’s operators have been planning to deepen the container berths to 17.5 meters to
attract mother ships with the intent of being able to compete with the proposed new container
terminal. Before this can happen, however, they need to greatly upgrade the efficiency and
productivity of the present berths and yards. The first priority should be to complete the

30 P O R T O F D A M I E T T A O P E R A T I O N A L E F F I C I E N C Y
installation of the NAVIS CTMS system and learn how to apply it to effectively organize the yard
operation. The objective should be to upgrade the operation to be able to handle a minimum of
25 moves per crane-hour. For example, if 3 cranes are working simultaneously, the yard should
be able to efficiently accommodate 75 container moves per hour. The second priority should be
to convert the entire yard to a high density RTG system so as to accommodate the high call
volume a mother ship will generate. This conversion would also include the integration of reefer
stations into the RTG stacks at the back of the terminal to maximize the utilization of available
space.
Additionally, the operators need to clear all obstacles to efficient operations such as junk,
broken down machinery, container stripping operations, and all secondary services from the
main operations area. They also need to establish maximum allowable dwell times for
transshipment containers and install a fully secured perimeter and control system dedicated for
container terminal security. Finally, moving long-term storage of empties off the terminal to a
nearby ICD should be considered. The only empty containers that should remain on the terminal
are those scheduled to be recycled out of the country within 48 hours.
General Cargo
The general cargo operations are a problem in all three ports for very much the same reasons:
poor unitization, lack of appropriate modern handling systems, and a reliance on direct
discharge to trucks rather than indirect discharge systems to transit sheds or open storage
areas. The key focus of the operator (and port) is to significantly upgrade the unitization and
palletization of the primary types of general cargo being handled in the ports. This will require a
partnership between the operator and the port to work with the importers/shippers to define
more effective ways to package the cargo to facilitate handling both ship-shore operations and
on the quay. Once properly unitized the next step is to identify the best systems for vessel
loading and discharge. The final step will be to convert the operation to an indirect discharge
system.
To facilitate this conversion, we strongly recommend that the port or ministry secure the
services of an expert in general cargo handling systems to advise the different ports and
operators on the various options that are available for upgrading the general cargo operations
and possibly assisting the operators in procuring and implementing the new handling systems.
Port Information System
The Port Authority of Damietta (PAD) has a modern IT system which has been operational for
two years. PAD has sufficient funds to further develop and expand its IT systems. However,
there are several areas of improvement where the port can benefit from technical assistance to
ensure that the PAD aligns its IT strategy (automation) with the port’s business objectives
(efficiency and profitability), ensuring that the port stays on track to achieve its strategies and
goals, and implementing ways to measure IT performance.
Areas for improvement include:
1. Better use of data by implementing several actions:
P O R T D E V E L O P M E N T 3 1
a. Introducing an Executive Information System. b. Implementing IT Governance. c. Develop a system for data verification.
2. Vessel Traffic Services (VTS) are currently adequate. However, it is recommended that it be upgraded to accommodate expected traffic growth generated by the proposed new container terminal;
3. Improve the implementation process of the wireless network (to manage port
operations), the deployment of which is behind schedule. The port specified a hardware
and communication system for the RDTS that did not provide sufficient coverage and
reliability. Now they have re-tendered the system using “performance specifications” to
allow the system integrator to solve the problem.
Better Use of Data
The port is giving IT a high priority and has already invested in providing a modern IT system.
This action is an important first step to modernize the port operation and efficiency, but the port
needs to go further in order to capitalize on IT’s abilities to improve port efficiency and to
optimize the return on IT investment. Specifically, operations can be further improved if
managers can make more informed decisions. So the port should implement an Executive
Information System to enable managers to access real time reports.
Though notable progress has been made in the development of the existing system, the port
can benefit from a technical assistance program to implement the recommendations addressed
earlier in this report.
The Proposed Container Terminal and Port Planning
The proposed container terminal presents some serious problems with respect to vessel
operations and its impacts on the overall operations of the port. The port needs to fully address
the issue of safe vessel operations in the proposed basin and acceptable risk. Therefore, it is
strongly recommended that the port conduct the following assessments and studies:
• Conduct full-scale bridge simulations testing the risks of a 280m versus 320m wide basin
under different emergency scenarios. Simulations should involve pilots and tug captains
from the port, and experienced captains of mother container ships expecting to use the
facilities.
• Conduct a detailed assessment of the potential impact of the new terminal on overall port
operation and development.
• Conduct a detailed vessel traffic study and evaluate options for a two-way or a second
channel.
These studies can be carried out as independent studies or as part of a port master plan, the
latter of which should be undertaken in the near future to better guide port expansion and
mitigate against conflicting land uses.
With respect to enhancing Egyptian port system performance overall, we suggest the
government:

32 P O R T O F D A M I E T T A O P E R A T I O N A L E F F I C I E N C Y
• Investigate options for developing dry ports or cargo villages to house secondary port services
and port-related manufacturing industries.
• Provide technical support services for port planning, operations, IT systems, and port
development.
6. General Port Sector Policy Recommendations
This assessment has identified a number of areas for new policy considerations. Egypt needs to
address the relationship between the ports and their tenants. It is strongly recommended that
the Ministry/Port Authorities develop a pro-active program to assist tenants and operators
increase berth and terminal productivity. This policy is critical for addressing the increasing
vessel congestion in Egypt’s harbors.
Urban encroachment hinders the port’s ability to expand. While some countries are exploring
physical relocation of terminals, others are seeking to maximize physical capacity by relocating
ancillary activities outside the terminal. Experience elsewhere shows that container freight
station services, warehousing, empty container storage, container repair, car parks and truck
staging areas, hazmat storage, and value-added merchandizing, such as assembly, labeling,
and packaging, have all been relocated outside the confines of port terminals. Egypt should
make a concerted effort to identify such services in the ports and develop options for their
relocation and assess the merits of private sector investment in the new sites (loosely referred
to as Logistics Platforms).
As Egypt’s port sector continues to transform to a landlord form of port administration, there will
be opportunities to expand private sector participation. As this privatized environment evolves,
however, an oligopolistic environment will emerge, indicating a risk of anticompetitive behavior.
Private sector participation notwithstanding, port authorities in many cases will have monopoly
pricing positions for several essential services. Considering both private and public sector
dimensions, therefore, Egypt should establish an independent port regulator to ensure
acceptable performance standards and to monitor pricing/service contract behavior among port
operators. This regulatory reform effort, however, should be accompanied with a policy that
encourages competition as a means for maintaining market discipline. This will enable Egypt to
have a “light touch” regulatory approach, with a focus on monitoring competitive behavior as
opposed to setting prices.
While Egypt has undertaken notable port sector reforms that, with the recommendations
presented in this report, can induce substantially improved port performance, the country will
still be challenged to attain acceptable performance from the transport logistics chain. We have
learned from international experience, even in ports that have excellent reputations for efficiency
(e.g. Rotterdam, Amsterdam, New York, Los Angeles), that port efficiency can be constrained
by factors outside the port’s gates. Improved performance inside the terminals can be negated
by poor performance along the transport logistics chain. The paradigm for lowering transport

P O R T D E V E L O P M E N T 3 3
costs by focusing on port performance is no longer valid; today, freight corridors, of which ports
form only a part, are now competing with other freight corridors. Inter-port competition has been
replaced by inter-corridor competition, and time and cost have now been joined by reliability as
factors affecting transport competitiveness. This suggests the need for Egypt to go beyond the
port gates and promote a policy that encourages efficiency from port gates to hinterland points.
It is in the ports’ interest to improve logistics chain performance to grow their customer base. It
is in the country’s interest to improve logistics chain efficiency to enhance global
competitiveness.
Though Egypt can pursue a number of policy options for improving port and transport sector
performance, it must do so in an environment of ever-increasing security protocols. The US’s
Customs-Trade Partnership Against Terrorism program, the European Union’s Authorized
Economics Operator Program, and the impending introduction of similar guidelines from the
ASEAN community ultimately mean that Egypt will be subjected to some form of security
guidelines from the vast majority of its trading partners. While these guidelines are not
mandates, failure to comply greatly increases the likelihood for more “robust” Customs
inspections in trading partner countries, thereby increasing the risk of delay. From an economic
perspective, we know from the recent literature that each day of delay for imports in the US
incurs an extraordinary inventory cost equivalent to 0.8 percent of the value of the goods carried
in the container. So Egypt’s exporters will be challenged to secure their logistics chains to avoid
the extraordinary cost associated with delay. Egypt’s exporters have come up with their own ad
hoc solutions for guideline conformance, losing economy of scale advantages that a more
uniform approach would offer. Egypt should therefore develop its logistics systems to make it
easier for all of its exporters to comply with the security guidelines without hindering freight
movements. Today’s IT technologies offer the potential to develop a solution while actually
encouraging efficiency, with at least one firm offering a Secured Transport Logistics Chain
solution presented in Egypt two years ago. The potential efficiency gains from security solutions
offer the possibility to remove existing hinterland transport constraints and exact more efficient
utilization of freight corridors and truck fleets.


APPENDIX
How to Handle Wood as General
Cargo
Bundled wood products are not being handled efficiently or safely at the ports of Damietta and
Alexandria. Both ports are experiencing serious breakage of wood bundles and damage to cargo. Three
problems cause such breakage and each has a solution.
The wood is poorly unitized. The exporter simply places the bundle on three cross pieces and then straps
them to the bundle with .75” inch steel banding. The bundle then shears and shifts for lack of a solid
foundation to hold it together. Figure A-1 shows how to use and handle wood of different sizes (using
English units of measure). When wood cargo is discharged from the vessel it must be stacked on
preconstructed pallets. The pallets provide a solid base that will resist the shearing forces caused by
lifting. The pallets should be the same length as the wood. For wood more than 2 meters long the pallet
should be at least 1 meter wide and constructed of 2-inch (5cm) thick planks screwed into at least four
2”x4” (5x10cm) cross beans, leaving an overhang of approximately 6 inches (15cm) beyond the outside
cross beam. Screwing rather than nailing the planks into the cross beams makes them easier to
disassemble and reuse, thus greatly reducing the cost of the pallet. For thinner wood, the exporter can use
the same as in the bundle and screw two together to form the cross beams. Each plank forming the floor
of the pallet must be screwed to each cross beam for the pallet to function properly.
The steel cable and hook rigging system that stevedores use to discharge the cargo tends to break the
bands holding the bundles together. Stevedores need to use 2-inch (5cm) wide nylon web slings attached
to a steel “0”ring as shown in Figure A-1. These slings stretch and are soft; they do not cut into the bands,
and are as strong as steel. They are formed in a loop and are simply draped around the overhand at the end
of the pallet.
Forklifts with forks set only 2-3 feet apart are being used to handle the wood. This fork spacing allows the
bundles, especially those more than 2 meters long, to sag on each end, again putting significant shearing
pressure on the bands holding the bundle together. To move wood pallets on the ground, stevedores
should use a 3-forked attachment that can be automatically widened to approximately 5 feet (1.5m). The
attachment will prevent sagging at the ends of the bundle and help stabilize transport and lifting to trucks.
Both of the attachments shown in Figure A-2 can be set up with three forks.

A -2 A P P E N D I X
Figure A-1
Standard Pallet
Figure A-2
Forklift Configurations

P R O - P O O R G R O W T H E N V I R O N M E N T 3
Technical Assistance for Policy Reform II BearingPoint, Inc,
18 El Sad El Aali Street, 18th Floor, Dokki, Giza
Egypt Country Code: 12311
Phone: +2 02 3335 5507 Fax: +2 02 3337 7684
Web address: www.usaideconomic.org.eg