port of anchorage marine terminal development project ... · underwater noise survey ... maritime...
TRANSCRIPT

F I N A L U N D E R W A T E R N O I S E R E P O R T
PORT OF ANCHORAGE MARINE TERMINAL DEVELOPMENT PROJECT UNDERWATER NOISE SURVEY TEST PILE DRIVING PROGRAM ANCHORAGE, ALASKA Prepared for
United States Department of Transportation Maritime Administration 400 Seventh Street, S.W. Washington, D.C. 20590
and
Port of Anchorage 2000 Anchorage Port Road Anchorage, Alaska 99501
and
Integrated Concepts & Research Corporation 421 West First Avenue, Suite 200 Anchorage, AK 99501
December 2007
2700 Gambell Street, Suite 200 Anchorage, Alaska 99502 907.562.3366 Fax: 907.562.1297


TABLE OF CONTENTS
i
Section 1 Introduction ......................................................................................................1-1
1.1 Objectives ..............................................................................................................1-1 1.2 Underwater Sound Descriptors..............................................................................1-3 1.3 Applicable Underwater Noise Criteria ..................................................................1-5 1.4 Geographic Location .............................................................................................1-5
Section 2 Methods.............................................................................................................2-1
2.1 Acoustic Equipment...............................................................................................2-5 2.2 Equipment Calibration...........................................................................................2-5 2.3 Signal Analysis ......................................................................................................2-5
Section 3 Results ..............................................................................................................3-1
Section 4 Discussion ........................................................................................................4-1
4.1 Background Levels ................................................................................................4-1 4.2 Vibratory Pile Driving ...........................................................................................4-1 4.3 Impact Pile Driving................................................................................................4-3
Section 5 Recommendations ...........................................................................................5-1
5.1 Marine Mammal Safety Zones ..............................................................................5-1 5.2 Future Acoustic Work............................................................................................5-1
Section 6 References ........................................................................................................6-1

List of Tables, Figures, and Appendices
ii
Tables
Table 1 Definitions of Acoustical Terms Table 2 Summary of Measurements Table 3 Impact Pile #1 Signal Analyses Table 4 Impact Pile #2 Signal Analyses Table 5 Impact Pile #3 Signal Analyses Table 6 Vibratory Pile #13 Signal Analyses Table 7 Vibratory Pile #12 Signal Analyses Table 8 Vibratory Pile #3 Signal Analyses Table 9 Vibratory Pile #2 Signal Analyses Table 10 Vibratory Pile #1 Signal Analyses Table 11 Vibratory Pile #6 Signal Analyses Table 12 Dredging Operations Signal Analyses Table 13 Measured Sound Levels of Vibratory Pile Driving Table 14 Measured Sound Levels of Impact Pile Driving
Figures
Figure 1 Vicinity Map Figure 2 Pile and Measurement Locations Figure 3 Measured Sound Levels at ML1 Figure 4 Measured Sound Levels at ML3 Figure 5 Measured Sound Levels at ML4 Figure 6 Measured Sound Levels at ML5 Figure 7 Measured Sound Levels at ML6 Figure 8 Measured Sound Levels at ML8 Figure 9 Measured Sound Levels at ML9 Figure 10 Measured Sound Levels at ML10/ML11 Figure 11 Measured Sound Levels at ML12 Figure 12 Measured Sound Levels at ML13 Figure 13 Measured Sound Levels at ML14 Figure 14 Measured Sound Levels at ML16 Figure 15 Measured Sound Levels at ML18/ML19 Figure 16 Measured Sound Levels at ML20 Figure 17 Measured Sound Levels at ML21 Figure 18 Measured Sound Levels at ML22 Figure 19 Measured Sound Levels at ML23 Figure 20 Measured Sound Levels at ML25
Appendices
Appendix A Noise Survey Plan Appendix B Pile Probing Logs Appendix C Photographs Appendix D Acoustic Data

Acronyms and Abbreviations
iii
µPA microPascal dB RMS root-mean-square sound pressure level dB Peak instantaneous peak sound pressure level dB decibel dBA A-weighted decibel ft feet FR Federal Register GPS global positioning unit Hz Hertz ICRC Integrated Concepts and Research Corporation m meter MLLW mean lower low water MMPA Marine Mammal Protection Act MMSZ marine mammal safety zone ms millisecond NMFS National Marine Fisheries Service Pa Pascal Plan Noise study plan POA Port of Anchorage, legal entity Port Port of Anchorage, facilities Project Marine Terminal Redevelopment Project RMS root mean square SEL sound exposure level SLM sound level meter SPL sound pressure level TL transmission loss URS URS Corporation USACE U.S. Army Corps of Engineers VHF Very High Frequency

This page intentionally left blank.

Executive Summary
ES-1
EXECUTIVE SUMMARY
To prevent and minimize adverse impacts to marine mammals and to ensure compliance with the Marine Mammal Protection Act (MMPA) and the U.S. Army Corps of Engineers (USACE) Permit Number POA-2003-502-N (August 10, 2007), the Port of Anchorage (POA) and Department of Transportation Maritime Administration was required to conduct underwater noise surveys to measure and evaluate construction noise levels incidental to a test pile driving program conducted at the Port of Anchorage facilities (Port) in October 2007. The test program included testing of 26 steel H-piles and two sheet piles installed using both vibratory and impact hammers. An underwater noise survey was conducted October 16 through 18, 2007 to measure and evaluate noise levels associated with the pile driving and other Port activities. The survey consisted of measuring underwater sounds of impact and vibratory driving of steel H-piles, vibratory driving of one sheet pile, ambient conditions and noise levels generated by dredging operations, the pile driving barge, and a tug boat pulling the barge.
Based on the requirements of the USACE permit, the objectives of this underwater noise survey are to identify the 190, 180, and 160 decibel (dB) re 1 microPascal (µPa) root-mean-square (RMS) isopleths for each type of pile (H and sheet) and pile installation technique (vibratory and hammer).
Received RMS sound pressure levels (SPLs) during vibratory pile driving ranged from less than 120 dB re 1 µPa at 600 meters (m) to 168 dB re 1 µPa at 10 m. The greatest peak level measured was 179 dB re 1 µPa at 14 m. Based on these measurements, the distance to the 190 dB and 180 dB isopleth for vibratory pile driving would be less than 10 m. A conservative estimate of the distance to the 160 dB isopleth would be approximately 50 m. A conservative estimate of the distance to the 120 dB isopleth would be approximately 800 m. However, because the existing underwater noise levels in Knik Arm are typically 120 dB or higher, sounds from vibratory pile driving at that distance may not be discernible from the existing ambient background conditions.
Received peak SPLs during impact pile driving ranged from 173 dB re 1 µPa at 300 m to 194 dB re 1 µPa at 19 m. Received RMS SPLs ranged from 160 dB re 1 µPa at 300 m to 177 dB re 1 µPa at 19 m. Based on these measurements, the distances from the impact pile driving to the 190 dB isopleth would be 10 m, to the 180 dB isopleth would be 20 m, and to the 160 dB isopleth would be 350 m.
Therefore, the shut-down marine mammal safety zone (MMSZ) of 50 m recommended by the USACE and the National Marine Fisheries Service (NMFS) to preclude any Level A harassment is appropriate; marine mammals outside the 50 m MMSZ would not encounter any noise approaching the Level A threshold. However, the initial Level B recommended MMSZ for Level B harassment of 650 m, and subsequently modified MMSZ of 3,490 m for impact pile driving appears to be extremely conservative based on the measurements in this preliminary test pile driving study.

This page intentionally left blank.

SECTIONONE Introduction
1-1
SECTION 1 INTRODUCTION
The Port of Anchorage facility (Port) handles 75 percent of all goods shipped to the State of Alaska. It is the major gateway for Alaska's water-borne commerce and a vital element of the regional economy, generating more than $750 million each year. To keep pace with the future trends in the shipping industry, the Port will be undergoing construction to accommodate larger ships, develop larger barge berths, and improve and expand cruise ship facilities. As part of this Marine Terminal Redevelopment Project (Project), construction is planned for the next five years from 2008 through 2012. Figure 1 shows the location of the Port.
To prevent and minimize adverse impacts to marine mammals and to ensure compliance with the Marine Mammal Protection Act (MMPA) and the U.S. Army Corps of Engineers (USACE) Permit Number POA-2003-502-N (August 10, 2007), the Port of Anchorage (POA) and Department of Transportation Maritime Administration is required to conduct underwater noise surveys to measure and evaluate construction noise levels incidental to a test pile driving program performed in October 2007. The test program included 26 steel H-piles and two sheet piles installed using both vibratory and impact hammers.
The marine mammal of particular interest near the Port is the Cook Inlet beluga whale (Delphinapterus leucas). The Cook Inlet beluga whale is genetically and geographically isolated from other beluga whales in Alaska (O’Corry-Crowe et al. 1997). Results of aerial surveys conducted by the National Marine Fisheries Service (NMFS) indicated that the 1998 estimate of Cook Inlet belugas (347 whales) represented a decline of 47 percent from the 1994 estimate (653 whales). Because of the abundance data and other information presented in the status review, in 2000 NMFS designated the Cook Inlet beluga whale stock as depleted (65 FR 34590, May 31, 2000). After a second status review (71 Federal Register [FR] 14836, March 24, 2006) NMFS proposed the Cook Inlet beluga whale stock as endangered under the Endangered Species Act (72 FR 19854; April 20, 2007).
1.1 OBJECTIVES
Based on the requirements of the USACE permit, the objectives of this underwater noise survey were:
1. Begin the development of a sound index to accurately represent noise levels associated with Port construction and operation activities. This preliminary sound index was developed by characterizing the frequency composition, sound pressure levels (SPL), and transmission loss of the activity within the project footprint.
2. Identify the 190, 180, and 160 decibels (dB) re 1 microPascal (µPa) root mean square (RMS) isopleths for each type of pile (H and sheet) and pile installation technique (vibratory and hammer), and determine the 120 dB isopleth for vibratory pile driving.
3. Coordinate with the Integrated Concepts and Research Corporation (ICRC) Beluga Whale Monitoring Program to correlate construction and operation noise with beluga whale presence, absence, and behavior alteration.
As specified in the contract, URS Corporation (URS) developed a noise survey plan (Plan) prior to conducting the field work. The Plan is in accordance with the USACE permit and details the approach for conducting the noise survey during test pile driving, and coordination with beluga whale observers, construction crews, and other POA operations personnel. The Plan was submitted to

SECTIONONE Introduction
1-2
Insert Figure 1

SECTIONONE Introduction
1-3
ICRC on September 17, 2007. URS received comments from NMFS on October 18, 2007 and URS responded to comments on October 19, 2007. The Plan, comments, and response to comments are provided in Appendix A.
1.2 UNDERWATER SOUND DESCRIPTORS
Sound is a physical phenomenon consisting of minute vibrations that travel through a medium, such as air or water. Sound is generally characterized by several variables, including frequency and intensity. Frequency describes the sound’s pitch and is measured in Hertz (Hz), while intensity describes the sound’s loudness and is measured in dB. Decibels are measured using a logarithmic scale.
The method commonly used to quantify airborne sounds consists of evaluating all frequencies of a sound according to a weighting system that reflects that human hearing is less sensitive at low frequencies and extremely high frequencies than at the mid-range frequencies. This is called A-weighting, and the decibel level measured is called the A-weighted sound level (dBA). A filtering method to reflect hearing of marine mammals such as whales has not been developed for regulatory purposes. Therefore, sound levels underwater are not weighted and measure the entire frequency range of interest. In the case of marine construction work, the frequency range of interest is 10 to 10,000 Hz.
Several descriptors are used to describe underwater sounds. Table 1 summarizes commonly used terms to describe underwater sounds. Two common descriptors are the instantaneous peak SPL (dB PEAK) and the dB RMS level during the impact pulse or over a defined averaging period. The peak pressure is the instantaneous maximum or minimum overpressure observed during each pulse or sound event and is presented in Pascals (Pa) or dB referenced to a pressure of 1 µPa. The RMS level is the square root of the energy divided by a defined time period. The duration of a single pulse will be defined as the averaging period for impact pile driving. The RMS or SPL average period is not sensitive to continuous sounds from vibratory pile installation, so a period of about 1/8th of a second is appropriate for evaluating impacts to marine mammals. Other researchers have used longer periods (8.5 seconds) for vibratory pile driving, but offered no justification (Blackwell 2005). The “impulse” setting of a sound level meter uses 35-millisecond (ms) time averaging. This provides a good approximation of the RMS averaged over the duration of a pulse, since sound energy associated with most pile driving impact pulses last about 40 to 60 ms (Illingworth & Rodkin, Inc. 2001, 2005, 2006). However, analyses of pile strikes are performed to determine the appropriate relationship between these RMS calculations. Pulse duration determines the appropriate RMS time window.
Transmission loss (TL) underwater is the decrease in acoustic intensity as an acoustic pressure wave propagates out from a source. Transmission loss parameters vary with frequency, temperature, sea conditions, source and receiver depth, water chemistry, and bottom composition and topography.
Impact hammers drive the pile into the ground by applying a dynamic force to the pile butt. Vibratory hammers drive the pile into the ground by a push and pull action of counter-rotating weights. Vibratory action of the driver causes soil adjacent to the pile to become more like a viscous fluid with little or no skin friction. Impact sounds result from a rapid release of energy when the hammer strikes the pile. When a pile-driving hammer strikes a pile, a pulse propagates down the length of the pile and radiates into the water, ground substrate, and the air.

SECTIONONE Introduction
1-4
Table 1 Definition of Acoustical Terms
Term Definition
Decibel, dB A unit describing the amplitude of sound, equal to 20 times the logarithm to the base 10 of the ratio of the pressure of the sound measured to the reference pressure. The reference pressure for water is 1 micro Pascal (µPa) and for air is 20 µPa (approximate threshold of human audibility).
Sound Pressure Level, dB Sound pressure is the force per unit area, usually expressed in micro Pascals (or 20 micro Newtons per square meter), where 1 Pascal is the pressure resulting from a force of 1 Newton exerted over an area of 1 square meter. The sound pressure level is expressed in decibels as 20 times the logarithm to the base 10 of the ratio between the pressure exerted by the sound to a reference sound pressure. Sound pressure level is the quantity that is directly measured by a sound level meter.
Frequency, Hz Frequency is expressed in terms of oscillations, or cycles, per second. Cycles per second are commonly referred to as Hertz (Hz). Typical human hearing ranges from 20 Hz to 20,000 Hz.
Peak Sound Pressure (unweighted), dB re 1 µPa
Peak sound pressure level is based on the largest absolute value of the instantaneous sound pressure over the frequency range from 20 Hz to 20,000 Hz. This pressure is expressed in this report as dB re 1 µPa.
Root-Mean-Square (RMS), dB re 1 µPa
The RMS level is the square root of the energy divided by a defined time period. For pulses, the RMS has been defined as the average of the squared pressures over the time that comprise that portion of waveform containing 90% of the sound energy for one impact pile driving impulse.1
Total Acoustic Energy, dB re 1 µPa2 sec
Proportionally equivalent to the time integral of the pressure squared, and described in this report in terms of µPa2 sec over the duration of the impulse. Similar to the unweighted Sound Exposure Level (SEL) standardized in airborne acoustics to study noise from single events.
Waveforms, µPa over time A graphical plot illustrating the time history of positive and negative sound pressure of individual pile strikes shown as a plot of µPa over time (i.e., seconds).
Frequency Spectra, dB over frequency range
A graphical plot illustrating the 6 to 12 Hz band center frequency sound pressure over a frequency range (e.g., 10 to 5000 Hz in this report).
A--Weighting Sound Level, dBA
The sound pressure level in decibels as measured on a sound level meter using the A- or C-weighting filter network. The A-weighting filter de-emphasizes the low and high frequency components of the sound in a manner similar to the frequency response of the human ear and correlates well with subjective human reactions to noise.
Ambient Noise Level The background sound level, which is a composite of noise from all sources near and far. The normal or existing level of environmental noise at a given location.
1Underwater sound measurement results obtained by Illingworth & Rodkin for the Pile Installation Demonstration Project in San Francisco Bay indicated that most impact pile driving impulses occurred over a 50 to 100 millisecond (ms) period. Most of the energy was contained in the first 30 to 50 ms. Analyses of that underwater acoustic data for various pile strikes at various distances demonstrated that the acoustic signal measured using the standard “impulse exponential time-weighting” on the sound level meter (35-ms rise time) correlated to the RMS level measured over the duration of the pulse.

SECTIONONE Introduction
1-5
1.3 APPLICABLE UNDERWATER NOISE CRITERIA
Under the MMPA, NMFS has defined levels of harassment for marine mammals. Level A harassment is defined as, “Any act of pursuit, torment, or annoyance which has the potential to injure a marine mammal or marine mammal stock in the wild.” Level B harassment is defined as, “Any act of pursuit, torment, or annoyance which has the potential to disturb a marine mammal or marine mammal stock in the wild by causing disruption of behavioral patterns, including but not limited to migration, breathing, nursing, breeding, feeding or sheltering.”
Since 1997, NMFS has been using generic sound exposure thresholds to determine when an activity in the ocean that produces sound might result in impacts to a marine mammal such that a “take” by harassment might occur (70 FR 1871). NMFS is developing new science-based thresholds to improve and replace the current generic exposure level thresholds (Southall et al. 2007). However, the current Level A (injury) threshold level for impact noise is 180 dB RMS for cetaceans (whales, dolphins, and porpoise) and 190 dB RMS for pinnipeds (seals, sea lions). The current Level B (disturbance) threshold level for impact noise is 160 dB RMS for cetaceans and pinnipeds. The current Level B threshold level for continuous noise is 120 dB RMS.
1.4 GEOGRAPHIC LOCATION
Cook Inlet is a large tidal estuary flowing into the Gulf of Alaska. This shallow estuary is approximately 354 kilometers (km) long and 48 km wide. Upper Cook Inlet, north of the Forelands, is generally less than 36 m deep, with channels south of Kalgin Island that deepen to 146 m. Cook Inlet is a complex estuary with relatively fresh, turbid waters coming from several tributaries. The three primary rivers are the Knik, Matanuska, and Susitna rivers. The salinity, temperature, and suspended sediment levels vary significantly within the upper inlet as freshwater input decreases in winter. The bottom substrate is a mixture of cobbles, pebbles, silt, and clay (Moore et al. 2000).
With some of the highest tides in North America, exceeded only by those in the Bay of Fundy in Nova Scotia and Ungava Bay, Quebec, Cook Inlet’s extreme tidal fluctuation is the main force driving surface circulation in the inlet. Mean diurnal range of tides at Anchorage is 8.8 m. Mid-inlet currents range between 3 and 12 knots (Moore et al. 2000). It is also the most important natural factor to take into account when measuring underwater sound levels, as tidal noises can be important contributors to ambient levels (Urick 1983).

This page intentionally left blank.

SECTIONTWO Methods
2-1
SECTION 2 METHODS
A test pile driving program was conducted by the POA October 15 through 19, 2007. The test program included driving 33 14-inch by 90-foot long, steel H-piles installed using both vibratory and impact hammers, and one sheet pile using a vibratory hammer. Piles were vibrated in using an APE 200 vibratory hammer. Piles were initially driven about 10 feet (ft) using the vibratory hammer and then driven with an APE Delmag Model D30-42 diesel impact hammer to point of refusal or 60 ft below mean lower low water (MLLW). The piles were then removed. A summary of the test pile driving program is provided in Appendix B.
An underwater noise survey was conducted by URS October 16 through 18, 2007, to opportunistically measure and evaluate noise levels associated with the pile driving test and other Port activities. The survey consisted of measuring underwater sounds of impact and vibratory driving of steel H-piles, vibratory driving of one sheet pile, existing ambient background conditions, dredging operations, the pile driving barge, and a tug boat pulling the barge. A total of 25 measurements were taken over the three day period of the following: eleven H-piles with the vibratory hammer, three H-piles with the impact hammer, one sheet pile with the vibratory hammer, three ambient measurements, and seven measurements of various Port activities. Table 2 summarizes the measurement identification, date, time, approximate distance to the source of each measurement, water depth, and depths of the mid-column and deep hydrophones. The pile number is based on the pile driving logs provided by PND Engineers (see Appendix B). Figure 2 illustrates the locations of the piles and associated sound measurements. Photos taken during the underwater noise survey are provided in Appendix C.
All recordings were made from a 27-foot aluminum hull HarborCraft Kingfisher with two 130 horsepower outboard motors. The boat was equipped with a Garmin 2130 global positioning system (GPS) and depth finder. The motors were left on for the first two days of measurements to hold position in the current. On the third day, the motors were turned off, and the boat drifted with the current. No stationary measurements from an anchored vessel were conducted for this study.
The Garmin 2130 GPS was used initially to mark the latitude, longitude, and depth of the water at each sound measurement location. However, the device had to be turned off when it was discovered that the sound from the depth finder was interfering with noise measurements. Thereafter, the GPS was used to record the beginning location of the drift, turned off during the drift, and then turned on again at the end of the drift to record the end location. Distances were then calculated in the lab using GPS coordinates. Distances to nearby noise sources were acquired using a Bushnell Yardage Pro laser range finder. The range finder is less precise for distances beyond 500 m or under certain environmental conditions.
Two hydrophones were suspended directly from the vessel so that measurements were conducted at two depths (mid-column and deep). Due to the strong currents in Knik Arm, 10-pound weights were added near the hydrophone so that the hydrophones would be suspended vertically in the water. Another potential source of extraneous noise for hydrophones in strong current is cable strumming. Strumming is a source of noise caused by vibration of a cable being drawn through water, and it can be a serious noise interference with input into a hydrophone. Measuring sound while drifting instead of anchoring likely minimized interference from strumming.

SECTIONTWO Methods
2-2
Table 2 Summary of Measurements
Measurement ID Date/Time Description Approximate
Distance/Direction to Source
Water Depth Depth of
Hydrophone (middle/deep)
ML1 10/16/07 10:55
Pile #1 H-pile Impact
12-19 m West 12-19 m 8 m
2 m from bottom
ML2 10/16/07 12:38 Ambient NA
North 11 m None 2 m from bottom
ML3 10/16/07 13:13
Ambient near barge
30-40 m Northwest 11-13 m 7 m
2 m from bottom
ML4 10/16/07 13:53
Pile #20 H-pile Vibrate
10-80 m West 10- 17 m 7 m
2 m from bottom
ML5 10/16/07 14:12
Pile #19 H-pile Vibrate
10-40 m East 9-10 m 7 m
2 m from bottom
ML6 10/16/07 15:42
Pile #19b Sheet Vibrate
16-38m Northeast 6-7 m 4 m
2 m from bottom
ML7 10/17/07 09:07
Pile #2 H-pile Impact
45-55 m West 14 m 7 m
2 m from bottom
ML8 10/17/07 10:08
Pile #8 H-pile Vibrate
45-150 m West 12 m 5 m
2 m from bottom
ML9 10/17/07 10:53
Pile #3 H-pile Impact
117-305 m North 13-14 m 6 m
2 m from bottom
ML10 10/17/07 13:22
Pile #15 H-pile Vibrate
18-202 m West 11-15 m None
2 m from bottom
ML11 10/17/07 13:30 Dredge 16-50 m
North 11-15 m None 2 m from bottom
ML12 10/17/07 14:25
Pile #13 H-pile Vibrate
28-48 m North 9 m 4 m
2 m from bottom
ML13 10/17/07 15:11 Tug pulling barge 68-265 m
East 8-9 m 3 m 2 m from bottom

SECTIONTWO Methods
2-3
Table 2 Summary of Measurements (continued)
Measurement ID Date/Time Description Approximate
Distance/Direction to Source
Water Depth Depth of
Hydrophone (middle/deep)
ML14 10/18/07 9:50 Ambient Northwest 11 m 5 m
8 m
ML15 10/18/07 10:33 Ambient Northwest 45 m 10 m
20 m
ML16 10/18/07 10:46
Pile #12 H-pile Vibrate
149-241 m North 9 m 5 m
2 m from bottom
ML17 10/18/07 11:50 Ambient North 10 m 5 m
3 m from bottom
ML18 10/18/07 12:10
Pile #3 H-pile Vibrate
222-398 m North 10 m 5 m
3 m from bottom
ML19 10/18/07 12:10
Pile #2 H-pile Vibrate
550-770 m North 11 m 2.5 m
3 m from bottom
ML20 10/18/07 12:43
Pile #1 H-pile Vibrate
10-130 m North 9 m 4 m
2 m from bottom
ML21 10/18/07 13:05 Tug pulling barge 200-280 m
North 30 m 10 m 20 m
ML22 10/18/07 14:06
Pile #4 H-pile Vibrate
730 m Southwest 18 m 10 m
20 m
ML23 10/18/07 14:50
Pile #6 H-pile Vibrate
43-146 m North 20 m 5 m
10 m
ML24 10/18/07 15:35 Ambient NA 7 m 4 m
2 m from bottom
ML25 10/18/07 15:44 Dredge 23-30 m
North 12-19 m 4 m 2 m from bottom
All field notes were recorded in water-resistant field notebooks. Such notebook entries included calibration notes, measurement positions, sensor depth, water depth, pile-driving information, system gain setting, equipment used to make each measurement, and other construction, port operation, and vessel activities.

SECTIONTWO Methods
2-4
Insert Figure 2

SECTIONTWO Methods
2-5
2.1 ACOUSTIC EQUIPMENT
Measurements were made using G.R.A.S. CT10 hydrophones with PCB in-line charge amplifiers (Model 422E13) and PCB Multi Gain Signal Conditioners (Model 480M122). The signals were fed into Larson Davis Model 820 Type 1 Integrating Sound Level Meters (SLM) and a Marantz PMD 660 solid state digital recorder. The multi-gain signal conditioner provided the ability to increase the signal strength (i.e., add gain), so that measurements were made within the dynamic range of the instruments used to analyze the signals. The system has a flat frequency response over a range of 10 to 20,000 Hz, and a large dynamic range of over 80 dB.
2.2 EQUIPMENT CALIBRATION
Calibration of measurement systems was conducted prior to their use in the field. An acoustical piston phone and hydrophone coupler was used along with manufacturer calibration certificates. Calibration of measurement systems was established by using an acoustically certified piston phone and hydrophone coupler that fits the hydrophone. The volume correction of the hydrophone coupler using the hydrophone is known, so that the piston phone produces a known signal that can be compared against the measurement system response. The response of the measurement system is noted in the field book and applied to all measurements.
The SLMs were calibrated to the calibration tone prior to use in the field. The tone was then measured by the SLM and was recorded on to the beginning of the digital audio recordings. The system calibration status was checked by measuring the calibration tone and recording the tones. The recorded calibration tones were used for subsequent detailed analyses of recorded pile installation sounds or other sounds of interest.
2.3 SIGNAL ANALYSIS
The peak pressures and RMS average SPLs (RMSimpulse) were measured, either live using the SLM or subsequently from the digital recordings using the SLM. The Larson Davis Model 820 SLM has the ability to measure the unweighted peak sound pressure. RMS levels were measured with the SLM using the standard “impulse exponential-time-weighting” (35 ms rise time) function of the SLM. Additional subsequent analyses of the acoustical impulses were performed using a Larson Davis Model 2900 Real Time Analyzer. The real time analyzer provides narrow-band frequency and waveform analyses.
For impact pile driving, the duration of a single pulse was defined as the averaging period. Because impact pile driving results in transient noise events of varying durations, the “impulse” setting that utilizes a 35-ms time average was used for describing SPLs. Durations of impact pile driving sounds are typically 50 to 100 ms, with most energy contained within about 40 to 60 ms. The RMS measured with the impulse setting closely approximates this pulse over the duration. Past studies have shown it to be within 1 to 2 dB. This relationship was confirmed through comparison of detailed analysis of recorded signals with SPLs reported using the SLM. The SLM can approximate the un-weighted sound exposure level (SEL) of each pile strike, by measuring the one second equivalent sound energy level (Leq [1sec]).

SECTIONTWO Methods
2-6
For vibratory pile driving, the RMSfast (1/8-th second) SPL average period is not sensitive to continuous sounds from vibratory pile installation. Previous measurements of vibratory pile driving by Illingworth & Rodkin have determined the duration of about 1/8th of a second is appropriate for evaluating impacts to marine mammals. Measurements conducted of vibratory pile driving for Port MacKenzie used an 8.5-second time duration (Blackwell 2005). The analysis for this current study included both durations and found there was less than a 1 dB difference.

SECTIONTHREE Results
3-1
SECTION 3 RESULTS
A total of 25 measurements were taken over the three day study period of the following: eleven H-piles with the vibratory hammer, all three H-piles with the impact hammer, one sheet pile with the vibratory hammer, three ambient, and seven of various Port activities, as summarized in Table 2. A description of each measurement is provided below. The signal analyses for the pile driving measurements are provided in Appendix D.
ML1 Impact Pile # 1
Measurements were collected on 10/16/2007 at 9:55:30 AST during the impact driving of Pile #1 (H-type) while using the boat motors to maintain position near the pile. The measurement positions relative to the pile varied from 12 to 19 m west of the pile. Water depth was approximately 15 to 20 m. The initial sounds from the pile driving overloaded the measurement system, so signal gain was reduced to overcome this problem. During this recording, the monitoring boat had one engine engaged and one engine in neutral to maintain position in the current. Sounds from the pile driving were well above the noise generated by the boat. The deep-water hydrophone sensor was located 2 m from the bottom and the mid-column depth hydrophone sensor was located 8 m from the surface. Immediately after the pile-driving event ended, a 6-minute ambient measurement was recorded following the same drift pattern (not shown on the figure). Figure 3 illustrates the sound levels measured for ML1.
Figure 3 Measured Sound Levels at ML1
Impulse SPLs ranged from 172 to 177 dB (re 1μPa) for the deep sensor. Peak SPLs for the deep sensor ranged from 188 to 197 dB (re 1μPa). Levels slightly increased throughout the duration of the drive, and
Port of Anchorage Pile DemonstationOctober 16, 2007
Impact H-PilePile Located Between #22-#23
140
150
160
170
180
190
200
210
10:5
5
10:5
5
10:5
5
10:5
6
10:5
6
10:5
6
10:5
6
10:5
7
Time
Soun
d Pr
essu
re in
dB
Peak - 2m From BottomRMS - 2 m From Bottom
12 m19 m
18 m
SECTIONTHREE Results
3-2
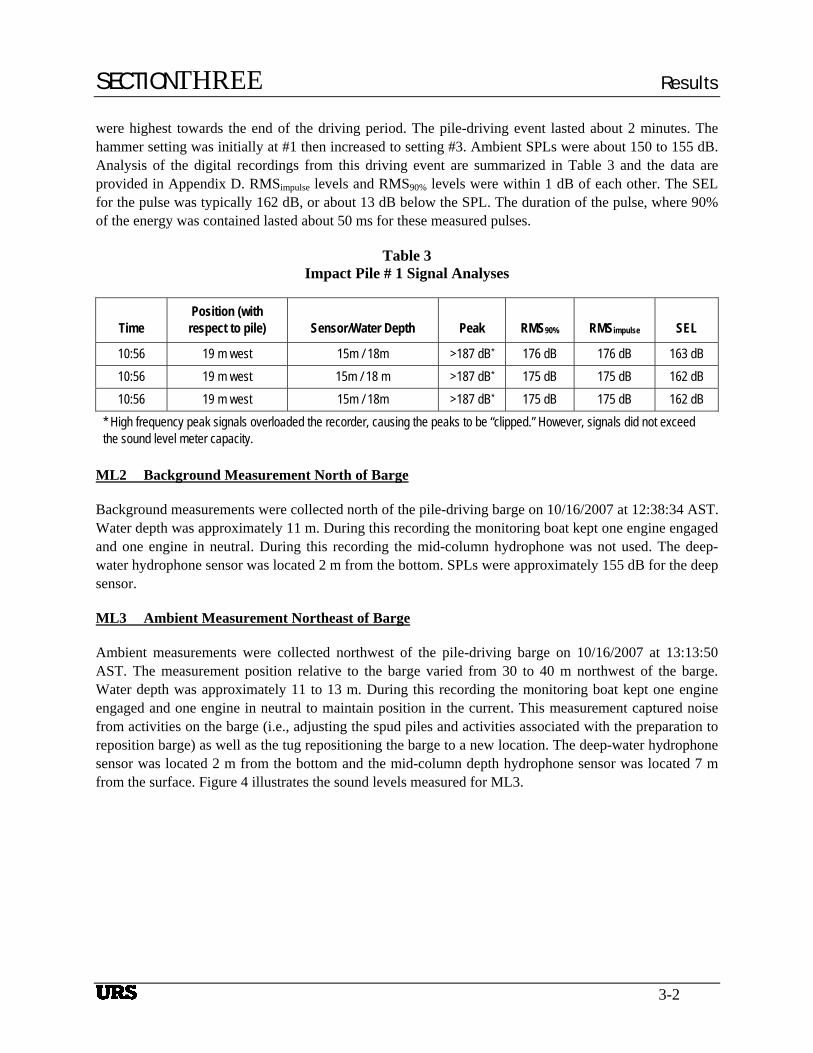
were highest towards the end of the driving period. The pile-driving event lasted about 2 minutes. The hammer setting was initially at #1 then increased to setting #3. Ambient SPLs were about 150 to 155 dB. Analysis of the digital recordings from this driving event are summarized in Table 3 and the data are provided in Appendix D. RMSimpulse levels and RMS90% levels were within 1 dB of each other. The SEL for the pulse was typically 162 dB, or about 13 dB below the SPL. The duration of the pulse, where 90% of the energy was contained lasted about 50 ms for these measured pulses.
Table 3 Impact Pile # 1 Signal Analyses
Time Position (with respect to pile) Sensor/Water Depth Peak RMS90% RMSimpulse SEL
10:56 19 m west 15m / 18m >187 dB* 176 dB 176 dB 163 dB 10:56 19 m west 15m / 18 m >187 dB* 175 dB 175 dB 162 dB 10:56 19 m west 15m / 18m >187 dB* 175 dB 175 dB 162 dB
* High frequency peak signals overloaded the recorder, causing the peaks to be “clipped.” However, signals did not exceed the sound level meter capacity.
ML2 Background Measurement North of Barge
Background measurements were collected north of the pile-driving barge on 10/16/2007 at 12:38:34 AST. Water depth was approximately 11 m. During this recording the monitoring boat kept one engine engaged and one engine in neutral. During this recording the mid-column hydrophone was not used. The deep-water hydrophone sensor was located 2 m from the bottom. SPLs were approximately 155 dB for the deep sensor.
ML3 Ambient Measurement Northeast of Barge
Ambient measurements were collected northwest of the pile-driving barge on 10/16/2007 at 13:13:50 AST. The measurement position relative to the barge varied from 30 to 40 m northwest of the barge. Water depth was approximately 11 to 13 m. During this recording the monitoring boat kept one engine engaged and one engine in neutral to maintain position in the current. This measurement captured noise from activities on the barge (i.e., adjusting the spud piles and activities associated with the preparation to reposition barge) as well as the tug repositioning the barge to a new location. The deep-water hydrophone sensor was located 2 m from the bottom and the mid-column depth hydrophone sensor was located 7 m from the surface. Figure 4 illustrates the sound levels measured for ML3.

SECTIONTHREE Results
3-3
Figure 4 Measured Sound Levels at ML3
SPLs varied from 145 to 162 dB for the deep sensor and 136 to 161 dB for the mid-column. These sounds also include noise from the monitoring boat that kept engines running to keep position, periodically engaging the propeller.
ML4 Vibrate Pile # 20
Measurements were conducted on 10/16/2007 at 13:35:32 AST during the vibratory driving of Pile #20 (H-Type) while using the boat engine to control position. The measurement positions relative to the pile varied from 10 to 80 m west of the pile. Water depth was approximately 10 to 17 m. During this recording, the monitoring boat had both engines in neutral for the majority of the event, engaging both engines for short durations to maintain position in the current, and to reposition the boat to make one more drifting pass. The deep-water hydrophone sensor was located 2 m from the bottom and the mid-column depth hydrophone sensor was located 7 m from the surface. Figure 5 illustrates the sound levels measured for ML4.
Port of Anchorage Pile DemonstationOctober 16, 2007
Ambient
120
130
140
150
160
170
180
14:1
3
14:1
4
14:2
2
14:2
3
14:2
4
14:2
5
14:2
6
14:2
7
1 4:3
5
Time
Leve
l RMS - 2 m From BottomRMS - Mid Channel

SECTIONTHREE Results
3-4
Figure 5 Measured Sound Levels at ML4
At times, there was noise induced from the current affecting the sensors. Based on review of the data and listening to the recordings, SPLs appeared to be about 163 dB at 16 and 33 m, but varied considerably through the drive. Peak sound pressures for the deep sensor were about 170 to 175 dB at 16 to 33 m.
ML5 Vibrate Pile # 19
Measurements were collected on 10/16/2007 at 14:12:13 AST during the vibratory driving of Pile #19 (H-Type) while drifting. The measurement positions relative to the pile varied from 10 to 40 m east of the pile. Water depth was approximately 9 to 10 m. During this recording, the monitoring boat had both engines in neutral for the majority of the event, engaging both engines for short durations to maintain position in the current, and to reposition the boat to make one more drifting pass. The deep-water hydrophone sensor was located 2 m from the bottom and the mid-column depth hydrophone sensor was located 7 m from the surface. Immediately after the pile was vibrated down, the pile was then vibrated up.
There was too much noise from the monitoring boat and depth finder to adequately measure the vibratory pile installation for this pile. A clean signal of the pile removal was measured at 14 m from the pile between 15:40 and 15:42. SPLs levels measured at 14 m from pile installation varied from about 150 to 168 dB. Peak SPLs for the deep sensor ranged from 165 to 178 dB. The highest SPLs occurred at the end
Port of Anchorage Pile DemonstationOctober 16, 2007Vibrate H-Pile #20
120
130
140
150
160
170
180
190
14:3
5
14:3
6
14:3
7
14:3
8
14:3
9
14:4
0
14:4
1
14:4
2
14:4
3
14:4
4
14:4
5
Time
Leve
l RMS - 2 m From BottomRMS - Mid ChannelPeak - 2 m From Bottom
33m
10 m 78 m
16 m33 m
36 m
31 m
Both Engines Engaged
Both Engines Loud
Repositioning Boat for Second Passby
First Drifting Passby
Second Drifting Passby

SECTIONTHREE Results
3-5
of the pile removal using the vibratory driver/extractor. Figure 6 illustrates the sound levels measured for ML5.
Figure 6 Measured Sound Levels at ML5
ML6 Vibrate Sheet Pile # 19b
Measurements were collected on 10/16/2007 at 15:42:55 AST during the short period that a sheet pile was vibrated at the Pile #19 location while drifting in the tidal current. The measurement positions relative to the pile varied from 16 to 38 m northeast of the pile. Water depth was approximately 6 to 7 m. During this recording, the monitoring boat had both engines in neutral. The deep-water hydrophone sensor was located 2 m from the bottom and the mid-column depth hydrophone sensor was located 4 m from the surface. This was the only sheet pile installation measured.
It should be noted that the sheet pile was visibly damaged (it had an obvious bend), and when driven it “slapped” back and forth. It is unknown if noise measurements collected during this test would be representative of noise that would be generated from a sheet pile in good condition, advanced during construction of a bulkhead where each sheet would be partially supported by an adjacent sheet pile. Figure 7 illustrates the sound levels measured for ML6.
Port of Anchorage Pile DemonstationOctober 16, 2007Vibrate H-Pile #19
130
135
140
145
150
155
160
165
170
175
180
15:1
2
15:1
3
15:1
4
15:1
5
15:1
7
15:1
8
15:1
9
15:2
0
15:2
1
15:2
2
15:2
3
15:2
4
15:4
0
15:4
1
Time
Leve
l RMS - 2 m From BottomRMS - Mid ChannelPeak - 2m From Bottom32.6 m
40-m
24-m
9-m
28-m
Repositioned Boat Closer to Pile
Vibrate Pile Down
Vibrate Pile Up
14-m
14-m
Stop and Re-Start Vibratory Hammer
Noise

SECTIONTHREE Results
3-6
Figure 7 Measured Sound Levels at ML6
At about 15 m, SPLs varied from 163 to 169 dB for the deep sensor and 160 to 166 dB for the mid-column sensor. Peak pressures for the deep sensor were about 181 dB. At 35 to 40 m, SPLs ranged from 155 to 160 dB for both deep and mid-column sensors. Peak SPLs for the deep sensor were about 174 dB. At 25 m, SPLs were lower, about 150 to 155 dB.
ML7 Impact Pile # 2
Measurements were obtained on 10/17/2007 at 09:07:30 AST during the impact driving of Pile #2 (H-type) while drifting at approximately 1 knot or 0.5 m per second. The measurement positions relative to the pile varied from 45 to 55 m west of the pile. During this recording, the monitoring boat had both engines in neutral for the majority of the event. Water depth was approximately 14 m. The deep-water hydrophone sensor was located 2 m from the bottom and the mid-column depth hydrophone sensor was located 7 m from the surface. After the pile-driving event ended, a 9-minute ambient measurement was recorded following the same drift pattern.
Impulse SPLs for both the deep and mid-column sensor were typically 168 dB, with a maximum of almost 174 dB for two pulses at the beginning of the event. Peak SPLs ranged from 180 to 190 dB. Digital recordings of the sounds generated by the impact pile driving were analyzed. The results are summarized in Table 4 and the data are provided in Appendix D. The SPLs for the pulse was similar or slightly higher than the impulse SPLs. These varied by about 1 dB. The SEL for the pulse was typically
Port of Anchorage Pile DemonstationOctober 16, 2007Vibrate Sheet Pile
Location #19
130
140
150
160
170
180
190
16:4
2
16:4
3
16:4
3
16:4
3
16:4
3
16:4
4
Time
Leve
l RMS - 2 m From BottomRMS - Mid ChannelPeak - 2 m From Bottom
16-m
21-m
34-m
38-m
24-m

SECTIONTHREE Results
3-7
155 dB to 157 dB, or typically 11 dB below the SPL. The pulse durations were about 50 ms, but varied from pulse to pulse (50 to 70 ms).
Table 4 Impact Pile #2 Signal Analyses
Time Position (with respect to pile) Sensor/Water Depth Peak RMS90% RMSimpulse SEL
10:08 45 m west 12m / 14m 182 dB 169 dB 168 dB 157 dB 10:10 54 m west 12m / 14 m 179 dB 166 dB 165 dB 155 dB 10:11 55 m west 12m / 14m 181 dB 168 dB 168 dB 156 dB
ML8 Vibrate Pile # 8
Measurements were conducted on 10/17/2007 at 10:08:15 AST during the vibratory driving of Pile #8 (H-Type) while drifting. The measurement positions relative to the pile varied from 45 to 150 m from the pile. During this recording, the monitoring boat had both engines in neutral for the majority of the event. Water depth was approximately 12 m. The deep-water hydrophone sensor was located 2 m from the bottom and the mid-column depth hydrophone sensor was located 5 m from the surface. During this recording, the depth finder on the boat was used and affected some of the measurements. Figure 8 illustrates the sound levels measured for ML8.
Figure 8 Measured Sound Levels at ML8
Port of Anchorage Pile DemonstationOctober 17, 2007Vibrate H-Pile #8
140
145
150
155
160
165
170
175
180
185
190
11:0
8
11:0
9
11:1
0
11:1
1
Time
Leve
l RMS - 2 m From BottomRMS Mid ChannelPeak - 2 m From Bottom
17-m 46-m19-m

SECTIONTHREE Results
3-8
Due to the high background levels caused by the monitoring boat, measurements of pile driving sounds were made for the first four minutes when positioned within 50 m of the pile. Vibratory installation sounds were difficult to identify above background levels when over 50 m from the activity. SPLs ranged from 155 to 160 dB at 17 to 19 m from the pile. Levels dropped off to below 155 dB at 46 m. As indicated by the variation in peak pressures, noise from the depth finder affected the measurements.
ML9 Impact Pile # 3
Measurements were collected on 10/17/2007 at 10:53:50 AST during the impact driving of Pile #3 (H-type) while drifting at approximately 0.7 knots. The measurement positions relative to the pile varied from 117 to 305 m north of the pile. Water depth was approximately 13 to 14 m. The deep-water hydrophone sensor was located 2 m from the bottom and the mid-column depth hydrophone sensor was located 6 m from the surface. After the pile-driving event ended, a 2-minute ambient measurement was recorded following the same drift pattern. Figure 9 illustrates the sound levels measured for ML9.
Figure 9 Measured Sound Levels at ML9
Impulse SPLs ranged from about 170 dB at 117 m to 162 dB at 308 m. Peak sound pressures ranged from about 186 dB at 117 m to less than 175 dB at 270 m or further away. Ambient or background SPLs were below 150 dB. Recordings of pulses generated by the impact pile driving were analyzed. The data are
Port of Anchorage Pile DemonstationOctober 17, 2007
Impact H-Pile
140
145
150
155
160
165
170
175
180
185
190
11:5
3
11:5
4
11:5
4
11:5
5
11:5
5
11:5
6
11:5
6
11:5
7
11:5
7
11:5
8
1 1:5
8
11:5
9
Time
Leve
l RMS - 2 m From BottomRMS Mid ChannelPeak - 2 m From Bottom
178 201 29629128284277274267263256242229 305302146117

SECTIONTHREE Results
3-9
summarized in Table 5 and provided in Appendix D. In general, RMSimpulse levels and RMS90% levels were within 2 dB of each other. The SEL for the pulse was 8 to 12 dB below the SPL. The duration of the pulse increased with distance from the pile; therefore, the RMSimpulse that uses a fixed 35-ms time constant was higher than the pulse RMS or RMS90% at distances beyond 200 m. Pulse durations were generally 50 to 80 ms at 120 to 190 m and exceeded 100 ms for distances beyond 200 m.
Table 5 Impact Pile #3 Signal Analyses
Time Position (with respect to pile) Sensor/Water Depth Peak RMS90% RMSimpulse SEL
Deep Sensor (2m above bottom) 11:54 120 m north 11m / 13-14m 183 dB 168 dB 170 dB 158 dB 11:54 150 m north 11m / 13-14m 181 dB 169 dB 168 dB 157 dB 11:56 190 m north 11m / 13-14m 178 dB 165 dB 162 dB 154 dB 11:57 230 m north 11m / 13-14m 173 dB 160 dB 162 dB 151 dB
Mid-Depth Sensor 11:54 140 m north 6m / 13-14m 183 dB 170 dB 168 dB 157 dB 11:56 200 m north 6m / 13-14m 176 dB 163 dB 163 dB 153 dB 11:59 300 m north 6m / 13-14m 176 dB 160 dB 161 dB 151 dB
ML10/ML11 Vibrate Pile # 15 and Dredge
Measurements were collected on 10/17/2007 at 13:22:00 AST during the vibratory driving of Pile #15 (H-Type) while drifting with the engines in neutral. The measurement positions relative to the pile varied from 18 to 202 m west of the pile. Water depth was approximately 11 to 15 m. The deep-water hydrophone sensor was located 2 m from the bottom and there was no mid-column sensor during this recording. Near the end of the vibratory installation the monitoring boat drifted to within 130 to 140 m from the USACE dredging operations. After the vibratory hammer stopped, the USACE dredging operations were recorded for an additional 4 minutes, at a distance of approximately 16 to 50 m north of the dredger. Figure 10 illustrates the sound levels measured for ML10/ML11.

SECTIONTHREE Results
3-10
Figure 10 Measured Sound Levels at ML10/ML11
SPLS for the vibratory pile installation ranged from 164 dB at about 20 m to 145 dB at 100 m with lower levels beyond 100 m. Background SPLs were between 135 dB and 145 dB. Peak sound pressures for the vibratory pile installation ranged from 172 dB at about 20 m to 160 dB or less at and beyond 100 m. SPLs for the dredging operation ranged from less than 140 dB to 165 dB at 20 to 25 m. Peak sound pressures ranged from less than 160 dB to 173 dB.
ML12 Vibrate Pile # 13
Measurements were collected on 10/17/2007 at 14:25:28 AST during the vibratory driving of Pile #13 (H-Type) while drifting with the engines in neutral. The measurement positions relative to the pile varied from 28 to 48 m north of the pile. Water depth was approximately 9 m. The deep-water hydrophone sensor was located 2 m from the bottom and the mid-column hydrophone sensor was located 4 m from the surface. Immediately after the vibratory installation stopped, the ambient noise level was recorded for approximately 2 minutes. Figure 11 illustrates the sound levels measured for ML12.
Port of Anchorage Pile DemonstationOctober 17, 2007Vibrate H-Pile #15
~ 18-202 Meters From Pile
130
135
140
145
150
155
160
165
170
175
180
185
190
195
200
14:2
2
14:2
3
14:2
4
14:2
5
14:2
6
14:2
7
14:2
8
14:2
9
14:3
0
14:3
1
14:3
2
14:3
3
14:3
4
Time
Leve
l
RMS-2-m From BottomPeak - 2-m From Bottom
Vibrate Pile Manson Dredging Operations
18 m 31 m19 m190 m50 m

SECTIONTHREE Results
3-11
Figure 11 Measured Sound Levels at ML12
SPLs for the vibratory pile installation ranged from 137 to 153 dB for the deep sensor and 138 to 153 dB for the mid-column sensor. Peak SPLs ranged from less than 155 to 163 dB for the deep sensor (peak pressures less than 155 dB were not recorded). Sound levels were loudest at about 40 m, when levels quickly increased for a short period. In general, there was about a 10 dB variation in levels that was probably not attributable to changes in position. When pile installation was complete, background levels were measured at about 125 to 132 dB. The digital audio recordings of the vibratory pile installation were analyzed. These data are summarized in Table 6 and provided in Appendix D.
Table 6 Vibratory Pile #13 Signal Analyses
Time Position (with respect to pile) Depth RMS0.125sec RMS8.5sec Reported SLM
15:27 45m north 7m / 9m 144 dB 143 dB 144 dB 15:29 40m north 7m / 9m 150 dB 149 dB 149 dB 15:31 35m north 7m / 9m 142 dB 139 dB 140 dB 15:32 25m north 7m / 9m 124 dB 124 dB 132 dB
Port of Anchorage Pile DemonstationOctober 17, 2007Vibrate H-Pile #13
~ 28-48 Meters From Pile
125
130
135
140
145
150
155
160
165
170
175
15:2
5
15:2
6
15:2
7
15:2
8
15:2
9
15:3
0
15:3
1
15:3
2
15:3
3
Time
Leve
l RMS - 2 m From BottomRMS Mid ChannelPeak - 2 m From Bottom
Stop Vibrate
Hit something hard and started pulling pile back out
28 m 41 m48 m

SECTIONTHREE Results
3-12
ML13 Ambient Measurement of Tug Pulling Barge
Ambient measurements were obtained south of the Port (near the boat ramp) of the tug Glacier Wind pulling the pile-driving barge back to the dock on 10/17/2007 at 15:11:37 AST. The measurement position relative to the barge varied from 68 to 265 m east. Water depth was approximately 8 to 9 m. During this recording, the monitoring boat had both engines in neutral. This measurement captured noise from the tug pulling the barge, and positioning the barge at the dock. There was virtually no current during this measurement. The deep-water hydrophone sensor was located 2 m from the bottom and the mid-column depth hydrophone sensor was located 3 m from the surface. Figure 12 illustrates the sound levels measured for ML13.
Figure 12 Measured Sound Levels at ML13
Ambient SPLs prior to the tug and barge activity were about 130 to 135 dB. When the barge and tug were operating nearby, SPLs varied from about 145 to 160 dB. The tug and barge were most likely the source of the elevated noise levels measured. The variation in sound level did not appear to be strictly distance dependent.
ML14 Ambient Measurement in Mid-Channel Northwest of Barge
Ambient measurements were collected northwest of the pile driving barge in the middle of the channel on 10/18/2007 at 9:50:10 AST. The measurement location was in an area of swirling eddies, very far away
Port of Anchorage Pile DemonstationOctober 17, 2007
Ambient Measurements Near Boat RampTug Pulling Barge 68-265 meters
120
130
140
150
160
170
180
190
16:1
1
16:1
2
16:1
3
16:1
4
16:1
5
16:1
6
16:1
7
16:1
8
16:1
9
16:2
0
16:2
1
16:2
2
16:2
3
16:2
4
16:2
5
16:2
6
16:2
7
Time
Leve
l
RMS - 2 m From BottomRMS Mid Channel
Tug Pulling Barge

SECTIONTHREE Results
3-13
from any apparent noise sources. Water depth was approximately 11 m. During this recording the boat had both engines in neutral to begin with, then partway through the measurement, both engines were turned off. During this measurement, two different fighter jets flew over. There was minimal current during this measurement. The deep-water hydrophone sensor was located 8 m from the surface and the mid-column depth hydrophone sensor was located 5 m from the surface. Figure 13 illustrates the sound levels measured for ML14.
Figure 13 Measured Sound Levels at ML14
Noise associated with the boat resulted in SPLs that varied from about 120 to 145 dB. Ambient SPLs without any of the boat engine operations were typically 105 to 115 dB. Noise from what appeared to be fighter jet flyovers produced levels up to 130 dB. However, the source of the underwater noise could not be confidently identified as aircraft noise, although jets flew over at about these times.
ML15 Ambient Measurement in Mid-Channel Northwest of Barge
Ambient measurements were collected northwest of the barge in the middle of the channel on 10/18/2007 at 10:33:10 AST. The measurement location was about 650 m from the pile installation. Water depth was approximately 45 m. The boat had both engines turned off. During this measurement an 18-foot aluminum boat passed by. While making this ambient noise measurement, Pile #11 was installed using the vibratory hammer. The deep-water hydrophone sensor was located 20 m from the surface and the mid-column depth hydrophone sensor was located 10 m from the surface. Levels varied from 115 dB to 130 dB, but pile installation sounds could not be isolated from the background levels.
Port of Anchorage Pile DemonstationOctober 18, 2007
Ambient Measurements In Mid Channel - Northwest of Barge
100
110
120
130
140
150
160
170
180
10:5
0
10:5
1
10:5
2
10:5
3
10:5
4
10:5
5
10:5
6
10:5
7
10:5
8
10:5
9
11:0
0
11:0
1
11:0
2
11:0
3
11:0
4
11:0
5
11:0
6
11:0
7
11:0
8
11:0
9
11:1
0
Time
Leve
l
RMS - 2 m From BottomRMS Mid Channel
Turned Both Engines Off
Instrument noise
Instrument noise or AFB jet flyovers
Boat engines on and engaginggear periodically

SECTIONTHREE Results
3-14
ML16 Vibrate Pile # 12
Measurements were collected on 10/18/2007 at 10:46:42 AST during the vibratory driving of Pile #12 (H-Type) while drifting. The measurement positions relative to the pile varied from 149 to 241 m north of the pile. Water depth was approximately 9 m. The deep-water hydrophone sensor was located 2 m from the bottom and the mid-column hydrophone sensor was located 5 m from the surface. Immediately after the vibratory installation stopped, the ambient noise level was recorded capturing the Manson dredging operations (approximately 365 m south). The depth finder was turned on for approximately 1 minute prior to stopping the ambient recording. Approximately 15 minutes after the vibratory pile installation was complete, the vibratory hammer started to remove the pile. Figure 14 illustrates the sound levels measured for ML16.
Figure 14 Measured Sound Levels at ML16
SPLs that were 135 to 140 dB at about 150 m when the pile was installed and dropped off to about 130 dB as the measurement position drifted to 250 m from the pile. There was typically a 3-dB variation in SPLs at any position. Ambient measurements were conducted following pile installation. The dredging operation about 365 m away made up much of the ambient noise environment, about 118 to 130 dB. The boat depth finder was used for a short period and captured in the noise measurements. SPLs associated with vibratory removal of the pile were louder, with variations from 140 to 120 dB as the position changed from 249 m to 284 m. Sounds analyzed from digital audio recordings of vibratory pile installation are summarized in Table 7 and the data are provided in Appendix D.
Port of Anchorage Pile DemonstationOctober 18, 2007
Vibrate Pile 12 - North of Barge~ 35' Water
100
110
120
130
140
150
160
170
180
190
11:4
6
11:4
7
11:4
8
11:4
9
11:5
0
11:5
1
11:5
2
11:5
3
11:5
4
11:5
5
11:5
6
11:5
7
11:5
8
11:5
9
12:0
0
12:0
4
12:0
5
12:0
6
12:0
7
12:0
8
Time
Leve
l RMS - 2 m From BottomRMS Mid ChannelPeak - 2 m From Bottom
Vibrate Down 149-241 meters
Vibrate Up 247-284 meters
Depth Finder Turned On
Ambient Ambient
Manson Dredger Approaching~365 meters south
245m285m
160m 220m

SECTIONTHREE Results
3-15
Table 7 Vibratory Pile #12 Signal Analyses
Time Position (with respect to pile) Depth RMS0.125sec RMS8.5sec Reported SLM
12:05 250m north 7m / 9m 138 dB 135 dB 136 dB 12:07 280m north 7m / 9m 129 dB 127 dB 129 dB 12:08 Background 7m / 9m 123 dB 120 dB 121 dB
ML17 Ambient Measurement North of Barge
Ambient measurements were collected north of the barge on 10/18/2007 at 11:50:30 AST. The measurement location was far away from any potential noise sources. During this measurement, the water was very calm, almost glassy, and there was no current (slack tide). Water depth was approximately 10 m. The boat had both engines turned off. The deep-water hydrophone sensor was located 3 m from the bottom and the mid-column depth hydrophone sensor was located 5 m from the surface. SPLs were approximately 120 dB for both sensors.
ML18/ML19 Vibrate Pile # 3/#2
Measurements were collected on 10/18/2007 at 12:10:12 AST during the vibratory piling of Pile #3 (H-Type) while drifting with the engines off. The measurement positions relative to the pile varied from 222 to 398 m north of the pile. Water depth was approximately 10 m. The deep-water hydrophone sensor was located 3 m from the bottom and the mid-column hydrophone sensor was located 5 m from the surface. Immediately after the vibratory installation stopped, the ambient noise level was recorded continuously until the pile installation began for Pile #2.
Measurements were conducted during the vibratory installation of Pile #2 (H-Type) while drifting. The measurement positions relative to the pile varied from 550 to 770 m north of the pile. Water depth was approximately 11 m. The deep-water hydrophone sensor was located 3 m from the bottom and the mid-column hydrophone sensor was located 2.5 m from the surface. Figure 15 illustrates the sound levels measured for ML18/ML19.

SECTIONTHREE Results
3-16
Figure 15 Measured Sound Levels at ML18/ML19
SPLs for Pile #3 vibratory pile installation ranged from about 125 to 140 dB for both deep and mid-depth sensors. Peak sound pressures were less than 160 dB. SPLs for Pile #2 vibratory installation ranged from about 110 to 130 dB for the deep sensor and just over 110 dB to 140 dB for the mid-column sensor. Peak sound pressures were less than 160 dB. Sounds analyzed from digital audio recordings of vibratory pile installation for Pile #3 are summarized in Table 8 and the data are provided in Appendix D. Sounds analyzed from digital audio recordings of vibratory pile installation for Pile #2 are summarized in Table 9 and the data are provided in Appendix D.
Table 8 Vibratory Pile #3 Signal Analyses
Time Position (with respect to pile) Depth RMS0.125sec RMS8.5sec Reported SLM
13:10 260m north 9m / 11m 130 dB 128 dB 130 dB 13:16 325m north 9m / 11m 134 dB 132 dB 129 dB 13:17 325m north 9m / 11m 136 dB 134 dB 136 dB 13:18 350m north 9m / 11m 134 dB 133 dB 134 dB
Port of Anchorage Pile DemonstationOctober 18, 2007
Vibrate Piles #3 and #2~ 35' Water
100
110
120
130
140
150
160
170
180
13:1
0
13:1
1
13:1
2
13:1
3
13:1
4
13:1
5
13:1
6
13:1
7
13:1
8
13:1
9
13:2
0
13:2
1
13:2
2
13:2
3
13:2
4
13:2
5
13:2
6
13:2
7
13:2
8
13:2
9
13:3
0
13:3
1
13:3
2
Time
Leve
l
RMS - 2 m From BottomRMS Mid Channel
Vibrate Down Pile 3 222-398 meters
Vibrate Down Pile 2 549-768 meters
Hydrophone On Bottom
Adjusting Hydrophones -
On Bottom
275m310m
365m245m

SECTIONTHREE Results
3-17
Table 9 Vibratory Pile #2 Signal Analyses
Time Position (with respect to pile) Depth RMS0.125sec RMS8.5sec Reported SLM
13:22 Background 9m / 11m 115 dB 112 dB 115 dB 13:16 550m north 9m / 11m 121 dB 120dB 122 dB
ML20 Vibrate Pile #1
Measurements were collected on 10/18/2007 at 12:43:10 AST during the vibratory driving of Pile #1 (H-Type) while drifting with the engines off. The measurement positions relative to the pile varied from about 10 to 130 m north of the pile. Water depth was approximately 9 m. The deep-water hydrophone sensor was located 2 m from the bottom and the mid-column hydrophone sensor was located 4 m from the surface. Immediately after the vibratory installation stopped, ambient levels were recorded. Figure 16 illustrates the sound levels measured for ML20.
Figure 16 Measured Sound Levels at ML20
SPLs for the vibratory pile installation ranged from 135 to 150 dB for both sensors. Peak sound pressures ranged from less than 155 to 166 dB for the deep sensor. Ambient SPLs were 120 to 125 dB. Sounds analyzed from recordings of vibratory pile installation are summarized in Table 10 and the data are provided in Appendix D.
Port of Anchorage Pile DemonstationOctober 18, 2007
Vibrate Pile# 19-129 Meters to Pile
100
110
120
130
140
150
160
170
180
13:4
3
13:4
4
13:4
5
13:4
6
13:4
7
13:4
8
13:4
9
13:5
0
13:5
1
13:5
2
13:5
3
13:5
4
13:5
5
Time
Leve
l RMS - 2 m From BottomRMS Mid ChannelPeak - 2-m From Bottom
Vibrate Down Pile 1
Ambient
14m 50 m 88 m 126 m

SECTIONTHREE Results
3-18
Table 10 Vibratory Pile #1 Signal Analyses
Time Position (with respect to pile) Depth RMS0.125sec RMS8.5sec Reported SLM
13:45 40m north 7m / 9m 141 dB 140 dB 141 dB 13:46 50m north 7m / 9m 140 dB 138 dB 140 dB 13:49 80m north 7m / 9m 147 dB 145 dB 148 dB 13:49 80m north 7m / 9m 141 dB 139 dB 144 dB
ML21 Ambient Measurement of Tug Pulling Barge Out of Port
Ambient measurements were obtained while a tug was pulling a barge out of the Port of Anchorage on 10/18/2007 at 13:05:05 AST. This measurement was taken during the slack tide. Water depth was approximately 30 m. The sound survey boat had both engines turned off. The measurement lasted approximately 6 minutes, and the distance to the tug and barge ranged from 200 to 280 m. The deep-water hydrophone sensor was located 20 m from the surface and the mid-column depth hydrophone sensor was located 10 m from the surface. SPLs were approximately 135 dB when the tug was about 200 m away. Figure 17 illustrates the sound levels measured for ML21.
Figure 17 Measured Sound Levels at ML21
Port of Anchorage Pile DemonstationOctober 18, 2007
Tug Pulling Barge Out of Port~100' Water
100
110
120
130
140
150
160
14:0
5
14:0
6
14:0
7
Time
Leve
l
RMS - 2 m From BottomRMS Mid Channel
197 meters
229 meters
279 meters

SECTIONTHREE Results
3-19
ML22 Vibrate Pile #4
Measurements were collected on 10/18/2007 at 14:06:45 AST during the vibratory driving of Pile #4 (H-Type) while drifting with the engines off. The measurement position relative to the pile was approximately 730 m southwest of the pile. Water depth was approximately 18 m. The deep-water hydrophone sensor was located 20 m below the surface and the mid-column hydrophone sensor was located 10 m below the surface. Immediately before and after the vibratory installation, the ambient noise level was recorded. During the ambient recording, the Manson dredging operations were within approximately 550 m of the sensors. Figure 18 illustrates the sound levels measured for ML22.
Figure 18 Measured Sound Levels at ML22
SPLs measured during vibratory pile installation ranged from 127 to 136 dB for both the deep and mid-column depth sensors when activity was about 730 m away. These levels were likely affected by other underwater sounds. Dredging operations were louder, with SPLs of about 120 to 140 dB. This activity was about 550 to 650 m away from the drifting measurement position during pile installation.
ML23 Vibrate Pile #6
Measurements were collected on 10/18/2007 at 14:50:55 AST during the vibratory driving of Pile #4 (H-Type) while drifting with the engines off. The measurement position relative to the pile was approximately 43 to 146 m north of the pile. Water depth was approximately 20 m. The deep-water hydrophone sensor was located 10 m from the surface and the mid-column hydrophone sensor was
Port of Anchorage Pile DemonstationOctober 18, 2007
Vibrate H-Pile #4 & Ambient MeasurementsSouthwest of Barge ~60' Water
100
110
120
130
140
150
160
14:2
014
:21
14:2
214
:23
14:2
414
:25
14:2
614
:27
14:2
814
:29
14:3
014
:37
14:3
814
:39
14:4
014
:41
14:4
214
:43
14:4
414
:45
14:4
614
:47
14:4
814
:49
14:5
014
:51
14:5
214
:53
14:5
415
:04
15:0
515
:06
15:0
715
:08
15:0
915
:10
15:1
115
:12
15:1
315
:14
15:1
515
:16
15:1
715
:18
15:1
915
:20
Time
Leve
l
RMS - 2 m From BottomRMS Mid Channel
Manson Dredger ~550-650 meters
Vibrate Pile #4 ~ 730 meters
Manson Dredger ~550 meters
Relocate Further West in Channel
288-302 Meters West of Barge
~ 890 Meters West of Barge526-717 Meters West of Barge

SECTIONTHREE Results
3-20
located 5 m from the surface. Immediately after the vibratory installation, the ambient noise level was recorded. During this recording the dredging operations were not in the area. The pile was vibrated down and then vibrated back up without pausing in between; this recording is both of the installation and removal of Pile #6. Figure 19 illustrates the sound levels measured for ML23.
Figure 19 Measured Sound Levels at ML23
SPLs for the vibratory pile installation were about 140 dB at 43 m and dropped off to about 130 dB at 146 m. Levels were similar at both deep and mid-column depth sensors. Ambient levels following the pile installation were about 125 to 130 dB. Peak sound pressures were about 154 dB at 50 m and less than 150 dB beyond about 90 m. Sounds analyzed from recordings of vibratory pile installation are summarized in Table 11 and data are provided in Appendix D.
Table 11 Vibratory Pile #6 Signal Analyses
Time Position (with respect to pile) Depth RMS0.125sec RMS8.5sec Reported SLM
15:51 45m north 18m / 20m 141 dB 140 dB 140 dB 15:53 85m north 18m / 20m 139 dB 137 dB 136 dB 15:56 100m north 18m / 20m 134 dB 132 dB 132 dB 15:58 Background 18m / 20m 129 dB 126 dB 124 dB
Port of Anchorage Pile DemonstationOctober 18, 2007
Vibrate Pile #643-146 Meters North of Pile
100
110
120
130
140
150
160
170
180
15:5
0
15:5
1
15:5
2
15:5
3
15:5
4
15:5
5
15:5
6
15:5
7
15:5
8
15:5
9Time
Leve
l RMS - 10-m From SurfaceRMS Mid ChannelPeak - 10-m From Surface
Vibrate Down Pile 43-146 meters
Ambient
122 m 82 m 43 m
SECTIONTHREE Results
3-21
ML24 Ambient Measurement North of Barge
Ambient measurements were recorded north of the pile-driving barge on 10/18/2007 at 15:35:42 AST. Water depth was approximately 7 m. The boat had both engines turned off. The measurement lasted approximately 4 minutes. The deep-water hydrophone sensor was located 2 m from the bottom and the mid-column depth hydrophone sensor was located 4 m from the surface. SPLs varied from 120 to 130 dB for both sensors.
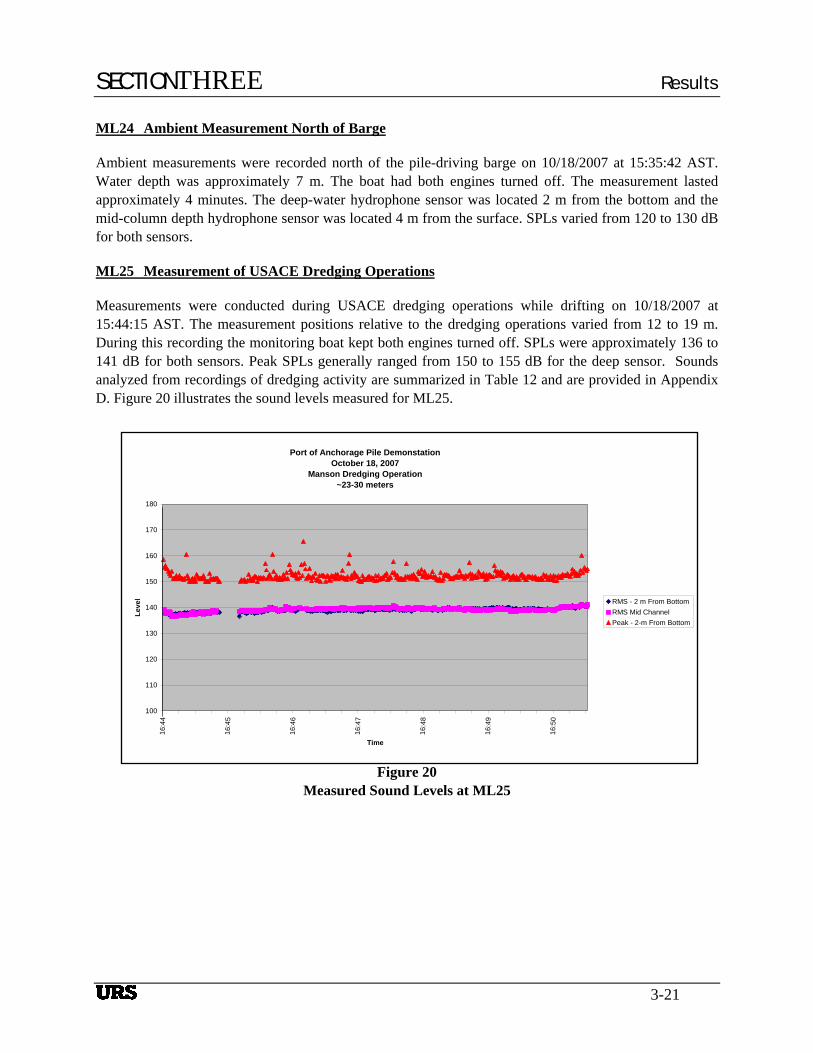
ML25 Measurement of USACE Dredging Operations
Measurements were conducted during USACE dredging operations while drifting on 10/18/2007 at 15:44:15 AST. The measurement positions relative to the dredging operations varied from 12 to 19 m. During this recording the monitoring boat kept both engines turned off. SPLs were approximately 136 to 141 dB for both sensors. Peak SPLs generally ranged from 150 to 155 dB for the deep sensor. Sounds analyzed from recordings of dredging activity are summarized in Table 12 and are provided in Appendix D. Figure 20 illustrates the sound levels measured for ML25.
Figure 20 Measured Sound Levels at ML25
Port of Anchorage Pile DemonstationOctober 18, 2007
Manson Dredging Operation~23-30 meters
100
110
120
130
140
150
160
170
180
16:4
4
16:4
5
16:4
6
16:4
7
16:4
8
16:4
9
16:5
0
Time
Leve
l RMS - 2 m From BottomRMS Mid ChannelPeak - 2-m From Bottom

SECTIONTHREE Results
3-22
Table 12 Dredging Operations Signal Analysis
Time Position Depth RMS0.125sec RMS8.5sec Reported SLM
15:51 25m north 18m / 20m 140 dB 139 dB 140 dB 15:58 Background 18m / 20m 129 dB 126 dB 124 dB

This page intentionally left blank.

SECTIONFOUR Discussion
4-1
SECTION 4 DISCUSSION
4.1 BACKGROUND LEVELS
The ambient background SPLs obtained in this study were highly variable, ranging from 105 to 135 dB re 1 µPa. The lowest background SPLs were measured during periods when the recording vessel outboard motors were off and far from any visible noise sources (105 to 120 dB re 1 µPa at ML14 and ML17, respectively). The highest background SPLs were measured when the tugs were pulling the barge (135 dB re 1 µPa at 200 m). Other sources of noise in the Port area consisted of dredging operations, boats, ships, and aircraft overflights from Elmendorf Air Force Base, all of which contribute to the high noise levels in Upper Cook Inlet. Measured SPLs associated with dredging operations ranged from 120 to 140 dB at 550 m and the levels from the recording vessel ranged between 120 and 145 dB re 1 µPa. These levels are consistent with other measurements conducted in Cook Inlet by Blackwell and Greene (2002) and Blackwell (2005).
Noise from the monitoring boat affected the measurement at times. This mostly occurred on the first two days when the captain was reluctant to cut the engines to drift; therefore, the captain engaged the engines more frequently to maintain position. The GPS system only worked when the depth sensor was operating, so that added to noise measured in some instances. Local noise from the survey boat reached 150 dB at times.
4.2 VIBRATORY PILE DRIVING
Received RMS SPLs during vibratory pile driving ranged from less than 120 dB re 1 µPa at 600 m to 168 dB re 1 µPa at 10 m, as summarized in Table 13. The greatest peak level measured was 179 dB re 1 µPa at 14 m. Most of the energy during vibratory installation of piles was between 400 and 2500 Hz. Blackwell (2005) reported higher levels of vibratory pile driving (163-165 dB re 1 µPa at 56 m) at Port MacKenzie. However, the piles for that study were 150-ft tall, 36-inch steel piles that were driven 40 to 50 ft into the bottom. This study measured 90-ft tall, 14-inch H-piles that were driven to 60 ft below MLLW, these are smaller piles that produce less noise in the water column.

SECTIONFOUR Discussion
4-2
Table 13 Measured Sound Levels of Vibratory Pile Driving
Measured Sound Pressure Levels (dB re 1 µPa)
Deep Sensor Mid-Depth Sensor Measurement
ID Pile ID Description Water Depth
Peak RMS Peak RMS
Pile #20 15 m West 10-17m 175 dB 163 dB -- 162 dB ML4
Pile #20 33 m West 10-17m 170 dB 160 dB -- 158 dB Pile #19 14 m East 10m 165 dB 152 dB -- 152 dB
ML5 Pile #19 14 m East 10m 178 dB 168 dB -- 167 dB Pile #8 15 m West 12m 172 dB 157 dB -- 159 dB Pile #8 20 m West 12m 170 dB 158 dB -- 157 dB ML8 Pile #8 45 m West 12m -- 153 dB -- 151 dB Pile #15 20 m West 11-15m 170 dB 162 dB -- -- Pile #15 55 m West 11-15m 163 dB 147 dB -- -- Pile #15 100 m West 11-15m 160 dB <145 dB -- --
ML10
Pile #15 Background 11-15m -- 140 dB -- -- Pile #13 45 m North 9m 156 dB 145 dB -- -- Pile #13 45 m North 9m 162 dB 152 dB -- -- Pile #13 40 m North 9m -- 138 dB -- --
ML12
Pile #13 30 m North 9m -- 142 dB -- -- Pile #12 Down 160 m North 9m -- 132 dB -- 132 dB
Pile #12 Down 220 m North 9m -- 130 dB -- 130 dB
Pile #12 Up 250 m North 9m -- 135 dB -- 135 dB Pile #12 Up 280 m North 9m -- 130 dB -- 130 dB
ML16
Pile #12 Background 9m -- 121 dB -- 121 dB Pile #3 260 m North 11m -- 130 dB -- 130 dB
ML18 Pile #3 325 m North 11m -- 138 dB -- 138 dB Pile #2 550 m North 11m -- 122 dB -- 122 dB
ML19 Pile #2 600 m North 11m -- <120 dB -- <120 dB

SECTIONFOUR Discussion
4-3
Table 13 Measured Sound Levels of Vibratory Pile Driving (continued)
Measured Sound Pressure Levels (dB re 1 µPa)
Deep Sensor Mid-Depth Sensor Measurement
ID Pile ID Description Water Depth
Peak RMS Peak RMS
Pile #1 40 m North 9m -- 142 dB -- 142 dB Pile #1 50 m North 9m -- 140 dB -- 140 dB Pile #1 80 m North 9m -- 138 dB -- 138 dB Ml20
Pile #1 short part 90 m North 9m 158 dB 148 dB -- 148 dB
ML22 Pile #4 730 m Southwest 11m -- <120 dB -- <120 dB Pile #6 45 m North 20m -- 140 dB -- 141 dB Pile #6 85 m North 20m -- 138 dB -- 138 dB ML23 Pile #6 100 m North 20m -- 134 dB -- 134 dB
Based on these measurements, the distance to the 190 dB and 180 dB isopleth (Level A) for vibratory pile driving would be less than 10 m. At ML4, an RMS level of 160 dB at 33 m was measured. A conservative estimate of the distance to the 160 dB isopleth (Level B) would be approximately 50 m, as all measurements at less than this distance were below 160 dB re 1 µPa. For the most part, it was difficult to measure levels down to 120 dB (Level B) as URS proceeded west into the central channel of Knik Arm due to noise effects from the strong current. Some measurements to the north indicate the distance to the 120 dB isopleth was about 600 m (ML19), but higher levels were measured to the west (ML22), where a combination of sources affected the measurements as well as noise-induced currents. A conservative estimate of the distance to the 120 dB isopleth would be approximately 800 m, as all measurements at this distance or beyond were below 120 dB re 1 µPa.
4.3 IMPACT PILE DRIVING
Peak SPLs during impact pile driving in this study ranged from 173 dB re 1 µPa at 300 m, to 194 dB re 1 µPa at 19 m, as summarized in Table 14. Received RMS SPLs ranged from 160 dB re 1 µPa at 300 m to 177 dB re 1 µPa at 19 m. Most of the energy during the impact driving was between 100 and 1500 Hz. Blackwell (2005) reported higher levels for impact pile driving (206 dBpeak at 62 m, 189 dBRMS at 62 m) at Port MacKenzie. However, the piles for that study were 150-ft tall, 36-inch steel piles that were driven 40 to 50 ft into the bottom. This study measured 90-ft tall, 14-inch H-piles that were driven to 60 ft below MLLW, these are significantly smaller piles that produce less noise in the water column.
Illingworth & Rodkin, Inc. have previously measured comparable SPLs for similar H-type piles driven with an impact hammer near Fort Bragg (Noyo River) and Alameda, California. For Noyo River, SPLs were measured at 168 dB at 47 m, 156 dB at 70 m, and 158 dB at 90 m (Illingworth & Rodkin 2003). Based on the data collected in that study, the radius of the 160 dB MMSZ was approximated at 75 m from

SECTIONFOUR Discussion
4-4
the pile. This approximation was based on adjustments to all data for the loudest event measured. There was a variation in noise levels over the duration of a driving event. For most pile driving events measured, pile driving noise increased by 5 to 10 dB over the initial levels. A short duration measurement of an H-pile being vibrated (to stab for impact driving) produced levels of 152 dB at 40 m.
For Alameda, levels were 182 dB at 10 m and 166 dB at 40 m (Illingworth & Rodkin 2007). Sheet piles were measured at Port of Oakland with SPLs of 165 dB at 10m. The range was 160 to 170 dB, with most levels below 165 dB. A tug boat passing by at 30 m at Port of Oakland produced a maximum SPL of 150 dB (160 dB peak).
Based on measurements from these referenced studies, the distance to the 190 dB isopleth (Level A) for impact pile driving would be 10 m, the distance to the 180 dB isopleth (Level A) would be 20 m, and the distance to the 160 dB isopleth (Level B) would be 350 m.
Table 14 Measured Sound Levels of Impact Pile Driving
Measured Sound Pressure Levels (dB re 1 µPa)
Deep Sensor Mid-Depth Sensor Measurement
ID Pile ID Description Water Depth
Peak RMS SEL Peak RMS SEL ML1 Impact #1 19 m West 15-20m 194 dB 177 dB 163 dB -- -- --
Impact #2 45 m West 14m 185 dB 173 dB -- -- 173 dB -- ML7
Impact #2 55 m West 14m 184 dB 168 dB 156 dB -- 169 dB -- Impact #3 120 m North 14m 183 dB 170 dB 158 dB -- 171 dB -- Impact #3 145 m North 14m 181 dB 168 dB 157 dB 183 dB 167 dB 157 dB Impact #3 195 m North 14m 178 dB 165 dB 154 dB 178 dB 165 dB 154 dB Impact #3 230 m North 14m 176 dB 162 dB 151 dB 175 dB 161 dB 151 dB Impact #3 275 m North 14m 173 dB 158 dB -- -- 161 dB --
ML9
Impact #3 300 m North 14m 173 dB 160 dB -- -- 161 dB --

SECTIONFIVE Recommendations
5-1
SECTION 5 RECOMMENDATIONS
5.1 MARINE MAMMAL SAFETY ZONES
As summarized in Section 1.2, NMFS has defined levels of harassment for marine mammals. The current Level A (injury) threshold level for impact noise is 180 dB RMS for cetaceans and 190 dB RMS for pinnipeds. The current Level B (disturbance) threshold level for impact noise is 160 dB RMS for cetaceans and pinnipeds. The current Level B threshold level for continuous (vibratory pile) noise is 120 dB RMS.
Based on the measurements obtained in this current test pile study at the Port, the distance to the 190 dB and 180 dB isopleth for vibratory pile driving would be less than 10 m. A conservative estimate of the distance to the 160 dB isopleth for vibratory pile driving would be approximately 50 m, as all measurements at less than this distance were below 160 dB re 1 µPa. A conservative estimate of the distance to the 120 dB isopleth would be approximately 800 m, as all measurements at this distance or beyond were below 120 dB re 1 µPa. However, because the existing underwater noise levels in this area of Knik Arm are typically 120 dB or higher, sounds from vibratory pile driving may not be audible at that distance.
Based on the current study measurements for impact pile driving, the distance to the 190 dB isopleth for impact pile driving would be 10 m, the distance to the 180 dB isopleth would be 20 m, and the distance to the 160 dB isopleth would be 350 m. Therefore, the shut-down MMSZ of 50 m recommended by the USACE and NMFS to preclude any Level A harassment is appropriate; marine mammals outside the 50 m MMSZ would not encounter any noise approaching the Level A threshold. However, the initial Level B recommended MMSZ of 650 m, and the subsequently modified MMSZ of 3,490 m for impact pile driving, appears to be overly conservative based on the measurements obtained in this preliminary test pile driving study.
5.2 FUTURE ACOUSTIC WORK
This section provides recommendations for any future underwater noise surveys to be conducted for the Project, based on experiences within this limited test pile driving program.
• Add a stationary hydrophone on the pile driving barge or other fixed station. This would allow measurements in the near-field, as well as provide simultaneous measurements of the same noise source at different distances. However, due to the strong tidal currents that could cause cable strumming and complications caused by large fluctuations in depth, this approach may require refinement to result in useful data.
• Obtain measurements of other Port activities that occur regularly, such as the container ships that typically arrive on Tuesdays.
• Improve communication with the construction contractor so that all start/stop times of pile driving activities are anticipated to facilitate sound measurements for all pilings. During the current study, the investigators attempted to stay in contact via cell phones, but found that it was

SECTIONFIVE Recommendations
5-2
difficult to hear the rings and that the cell phone signal was unreliable. Therefore, we recommend that all involved parties (boat captain, construction contractor, beluga monitors) use VHF radios for the duration of the workday.
• Improve communication with the onshore beluga monitoring team, and supplement the marine mammal observation capability on the research vessel.
• Because the noise levels associated with the engines of the recording vessel often made it difficult to discern the vibratory pile driving activity at distances greater than 50 m, it is important to turn the motors off and drift, as appropriate safety precautions allow. The vessel used in this study used a GPS with a depth finder. This depth finder produced an audible tone which also contaminated several of the measurements. Therefore, it is important for the study personnel to use a GPS not equipped with a depth finder.
• Measurement of impact and vibratory piling installation should be conducted during actual construction activities in 2008 to confirm that noise levels generated when pilings are driven fully to refusal or maximum depth are consistent with the noise levels recorded during the October 2007 pile driving test.

SECTIONSIX References
6-1
SECTION 6 REFERENCES
Blackwell, S.B. 2005. Underwater measurements of pile-driving sounds during the Port MacKenzie dock modifications. August 13 through 16, 2004. Report from Greeneridge Sciences, Inc., Goleta, CA and LGL Alaska Research Associates, Inc., Anchorage, AK. In association with HDR Alaska, Inc., Anchorage, AK; for Knik Arm Bridge and Toll Authority, Anchorage, AK; Department of Transportation and Public Facilities, Anchorage, AK; and Federal Highway Administration, Juneau, AK. 33 p.
Blackwell, S.B. and C.R. Greene Jr. 2002. Acoustic measurements in Cook Inlet, Alaska during August 2001. Greeneridge Report 271-2. Report from Greeneridge Sciences, Inc., Santa Barbara for National Marine Fisheries Service, Anchorage, AK. 43 p.
Illingworth & Rodkin, Inc. 2001. Final data report: Noise and vibration measurements associated with the Pile Installation Demonstration Project for the San Francisco-Oakland Bay Bridge East Span. Submitted to the State of California, Department of Transportation, District 4, Toll Bridge Program, August 2001.
Illingworth & Rodkin, Inc. 2003. Underwater Sound Levels Associated with Pile Driving Activities Associated with Construction of the Noyo Bridge. Report to Caltrans. March 18 and revised April 9, 2003.
Illingworth & Rodkin, Inc. 2005. Hydroacoustic Monitoring Report – San Francisco-Oakland Bay Bridge East Span Seismic Safety project. Prepared for the State of California, Department of Transportation under contract to Parsons Brinckerhoff. May 2005.
Illingworth & Rodkin, Inc. 2005. Letter to Bill Chase (Ballena Isle Marina) reporting Results of Underwater Sound Measurements for H-Type Piles at Ballena Isle Marina Breakwater Repair May 13, 2005.
Illingworth & Rodkin, Inc. 2006. Port of Oakland Berth 30 – Underwater Sound Measurements for the Installation of Steel Sheet Piles with a Hydraulic Vibratory Hammer. Report to the Port of Oakland, May 8, 2006.
Illingworth & Rodkin, Inc. 2007. Port of Oakland Berth 35/37 – Underwater Sound Measurements for the Installation of Steel Sheet Piles with a Hydraulic Vibratory Hammer. Report to the Dutra Group, January 23, 2007.
Moore, S.E., K.E.W. Shelden, L.K. Litzky, B.A. Mahoney and D.J. Rugh. 2000. Beluga, Delphinapterus leucas, habitat associations in Cook Inlet, Alaska. Marine Fisheries Review 62:60-80.
O'Corry-Crowe, G.M., R.S. Suydam, and A. Rosenberg. 1997. Phylogeography, population structure and dispersal patterns of the beluga whale Delphinapterus leucas in the western Nearctic revealed by mitochondrial DNA. Molecular Ecology 6:955-970.

SECTIONSIX References
6-2
Southall, B.L., A.E. Bowles, W.T. Ellison, J.J. Finneran, R.L. Gentry, C.R. Greene Jr., D. Kastak, D.R. Ketten, J.H. Miller, P.E. Nachtigall, W.J. Richardson, J.A. Thomas, and P.L. Tyack. 2007. Marine mammal noise exposure criteria: Initial scientific recommendations. Aquatic Mammals, Special Issue 33.
Urick, R.J. 1983. Principles of Underwater Sound, 3rd ed. McGraw-Hill, New York, NY. 423 p.

This page intentionally left blank.

APPENDIXA Noise Survey Plan

This page intentionally left blank.

APPENDIXB Pile Probing Logs

This page intentionally left blank.

APPENDIXC Photographs

This page intentionally left blank.

APPENDIXD Acoustic Data

This page intentionally left blank.