porphyry copper exploration of the hualapai mountains
TRANSCRIPT
UNLV Theses, Dissertations, Professional Papers, and Capstones
8-1-2014
Porphyry Copper Exploration of the Hualapai Mountains, Mohave Porphyry Copper Exploration of the Hualapai Mountains, Mohave
County, Arizona, USA: A Multi-faceted Approach County, Arizona, USA: A Multi-faceted Approach
Patrick Kevin Meazell University of Nevada, Las Vegas
Follow this and additional works at: https://digitalscholarship.unlv.edu/thesesdissertations
Part of the Geochemistry Commons, and the Geology Commons
Repository Citation Repository Citation Meazell, Patrick Kevin, "Porphyry Copper Exploration of the Hualapai Mountains, Mohave County, Arizona, USA: A Multi-faceted Approach" (2014). UNLV Theses, Dissertations, Professional Papers, and Capstones. 2195. http://dx.doi.org/10.34917/6456425
This Thesis is protected by copyright and/or related rights. It has been brought to you by Digital Scholarship@UNLV with permission from the rights-holder(s). You are free to use this Thesis in any way that is permitted by the copyright and related rights legislation that applies to your use. For other uses you need to obtain permission from the rights-holder(s) directly, unless additional rights are indicated by a Creative Commons license in the record and/or on the work itself. This Thesis has been accepted for inclusion in UNLV Theses, Dissertations, Professional Papers, and Capstones by an authorized administrator of Digital Scholarship@UNLV. For more information, please contact [email protected].
PORPHYRY COPPER EXPLORATION OF THE HUALAPAI MOUNTAINS, MOHAVE COUNTY,
ARIZONA, USA: A MULTI-FACETED APPROACH
by
Patrick Kevin Meazell II
Bachelor of Science in Geology University of Georgia
2009
A thesis submitted in partial fulfillment of the requirements for the
Master of Science – Geoscience
Department of Geoscience College of Sciences
The Graduate College
University of Nevada, Las Vegas August 2014

Copyright by Patrick Kevin Meazell II, 2014.
All Rights Reserved

ii
THE GRADUATE COLLEGE
We recommend the dissertation prepared under our supervision by
Patrick Kevin Meazell II
entitled
Porphyry Copper Exploration of the Hualapai Mountains, Mohave County,
Arizona, USA: A Multi-Faceted Approach
is approved in partial fulfillment of the requirements for the degree of
Doctor of Philosophy - Geosciences
Department of Geoscience
Jean Cline, Ph.D., Committee Co-Chair
Adam Simon, Ph.D., Committee Co-Chair
Wanda Taylor, Ph.D., Committee Member
Barbara Luke, Ph.D., Graduate College Representative
Kathryn Hausbeck Korgan, Ph.D., Interim Dean of the Graduate College
August 2014

iii
ABSTRACT
Porphyry Copper Exploration of the Hualapai Mountains, Mohave County, Arizona, USA:
A Multi-Faceted Approach
By
Patrick Kevin Meazell II
Dr. Jean S. Cline, Examination Committee Chair
Professor
University of Nevada, Las Vegas
A variety of exploration methods including geologic mapping, trace- and major-level
geochemical analyses, fluid inclusion petrography, remote sensing, and SWIR clay spectroscopy
were used to investigate the potential for porphyry Cu-Mo mineralization at the Wikieup
prospect, in the southern Hualapai Mountains of northwestern Arizona. Aspects of the Mineral
Park mine were used as an analogue to guide exploration due to the proximity and similar
geology of the area.
The Hualapai Mountains are a series of northwest-trending Precambrian gneisses,
schists, granitoids and amphibolites that have been cut by younger intrusive rocks. Within the
Wikieup study area, the intrusive rocks include aplite dikes that are crosscut by a younger set of
rhyolite dikes, and the youngest porphyry dikes which crosscut both the aplite and the rhyolite.
Mineralized quartz veins are commonly associated with the Precambrian-porphyry contact.
Mineralized quartz vein samples were collected from historic mines, prospecting pits,
and outcropping quartz veins throughout the Wikieup prospect and the adjacent areas.
Samples were analyzed by ICP-MS for 51 elements including Mo, Cu, Pb, Zn, Ag, Au, and Mn. A
geochemical zonation pattern similar to that of the mining district of Mineral Park was
observed, with Au-Ag rich areas in the middle of Wikieup study area and Pb-Zn rich areas in the

iv
southern parts of the prospect. Two areas known as Devil’s Canyon and Wikieup Queen were
identified as Cu-Mo anomaly centers to the south. A Mn halo was detected around Devil’s
Canyon.
SWIR spectral data collected with the TerraSpec were evaluated to identify clay
mineralogy. Results show the presence of AlOH minerals such as illite, kaolinite, and sericite
within the Cu-Mo anomalies, and patterns of white mica crystallinity and composition indicate
strong alteration near the Cu-Mo anomalies.
Fluid inclusion petrography revealed a zonation of fluid inclusions from north to south
across the study area. Fluid inclusion assemblages associated with Au-Ag mineralization in the
middle of the Wikieup study area contained irregularly shaped, two-phase inclusions and
smaller two-phase, regularly-shaped, liquid-rich inclusions. Two-phase, regularly-shaped, liquid-
rich fluid inclusions were observed associated with the Pb-Zn metal zone. Fluid inclusion
assemblages from the Cu-Mo centers to the south of the claims contain three- and four-phase
halite bearing, regularly-shaped inclusions with an occasional daughter crystal coexisting with
vapor-rich, two-phase inclusions, indicating fluid immiscibility.
Band ratio transformation analysis of ASTER Level-1B satellite images provided
additional information regarding the zoning of alteration minerals. Surface reflectance
absorption features at 2.20 µm and 2.26 µm reveal the presence of Al hydroxide minerals such
as illite, kaolinite, sericite, and muscovite, and Fe hydroxide minerals such as jarosite within the
Devil’s Canyon and Wikieup Queen areas. This zone of alteration continues south into an
unmapped area of Bronco Wash.

v
Results of these studies indicate that the area south of the Can-Cal claims has the
greatest potential for porphyry copper mineralization. The original Can-Cal claims are consistent
with the fringes of porphyry copper mineralization where hydrothermal conditions where
cooler.

vi
ACKNOWLEDGEMENTS
I would like to thank my advisor, Dr. Jean Cline for her instruction and motivation
throughout the last two years. Jean offered helpful advice through every step of this project
and was always available for consultation. Thanks also to Adam Simon, who was instrumental in
the inception of this project.
I would like to thank Can-Cal Resources, Ltd., for the financial support that made this
project possible. I am very grateful for the help and wisdom of Luis Vega, who provided the
initial exploration ideas that started this project. Luis guided this project in its infancy, and is
also responsible for making the exploration of Devil’s Canyon possible, which helped tie this
project together. The fieldwork would also not have been possible without Tim Howell, who
was always a helpful hand in the field.
I would also like to thank Josh Ellis and Scott Craig of Kinross Gold, Inc., for teaching me
about applied SWIR spectroscopy and providing me with free Terraspec analysis. Thanks also to
Caleb Stroup for discussing ideas with me in a skeptical, yet positive manner.
Finally I would like to thank my friends and family. I am eternally grateful for their
unending support and patience. Without them, this project would never have been completed.

vii
TABLE OF CONTENTS
ABSTRACT ........................................................................................................................................ iii ACKNOWLEDGEMENTS ................................................................................................................... vi LIST OF TABLES .................................................................................................................................ix LIST OF FIGURES ............................................................................................................................... x CHAPTER 1 INTRODUCTION ...................................................................................................... 1 CHAPTER 2 BACKGROUND ........................................................................................................ 3 Mineral Park and the Wallapai Mining District of the Cerbat Mountains .......................... 3 Geology of the Wallapai Mining District ............................................................................ 3 Alteration in the Wallapai Mining District .......................................................................... 6 Mineral Park Mineralization .............................................................................................. 7 Wallapai Mining District Metal Zoning .............................................................................. 9 Mineral Park Fluid Inclusions ............................................................................................. 9 Geology of the Hualapai Mountains ................................................................................ 11 The Wikieup Study Area ................................................................................................... 12 CHAPTER 3 METHODS ............................................................................................................. 15 Geology ............................................................................................................................. 15 Petrography ..................................................................................................................... 15 Geochemistry ................................................................................................................... 15 Clay Mineralogy ............................................................................................................... 16 Fluid Inclusion Petrography ............................................................................................. 17 Remote Sensing ............................................................................................................... 18 CHAPTER 4 GEOLOGY ............................................................................................................. 20 Primary Lithology .............................................................................................................. 20
Primary Lithology Interpretation ...................................................................................... 23
Quartz Monzonite Porphyry Geochemistry ...................................................................... 24
Quartz Monzonite Porphyry Metals Interpretation ......................................................... 27
Quartz Monzonite Porphyry Trace Elements ................................................................... 28
Quartz Monzonite Porphyry Trace Elements Interpretation ............................................ 29
Alteration .......................................................................................................................... 29
Alteration Interpretation .................................................................................................. 32
Hydrothermal Mineralization ........................................................................................... 34
Mineralized Vein Interpretation ....................................................................................... 35
Mineralized Vein Geochemistry ........................................................................................ 36
Mineralized Vein Geochemistry Interpretation ................................................................ 39

viii
CHAPTER 5 FLUID INCLUSION PETROGRAPHY ........................................................................ 41 Fluid Inclusion Petrography Interpretations ..................................................................... 42 CHAPTER 6 REMOTE SENSING ................................................................................................ 45 Mineral Park – Visual-Near Infrared ................................................................................. 45
Mineral Park – Shortwave Infrared ................................................................................... 45
Wikieup Study Area – Visual-Near Infrared ...................................................................... 46
Wikieup Study Area – Shortwave Infrared ....................................................................... 47
Wikieup Study Area – SWIR Classified Image ................................................................... 47
Remote Sensing Interpretations ....................................................................................... 47 Synthesis Map ................................................................................................................... 48
CHAPTER 7 CONCLUSIONS ...................................................................................................... 50 Can-Cal Area ...................................................................................................................... 50
Devil’s Canyon ................................................................................................................... 51
Wikieup Queen ................................................................................................................. 52
Bronco Wash ..................................................................................................................... 53
Recommendations ............................................................................................................ 54
APPENDICES ................................................................................................................................. 109 Appendix A. Sample List .................................................................................................. 110
Appendix B. Whole Rock Geochemistry ......................................................................... 116
Appendix C. Terraspec Analysis ...................................................................................... 122
Appendix D. Mineralized Quartz Vein Geochemistry ..................................................... 126 Appendix E. Radiometric Dating Results ......................................................................... 136
REFERENCES ................................................................................................................................. 143 VITA .............................................................................................................................................. 146

ix
LIST OF TABLES
Table 1 Table 2 Table 3
Geochemical methods ..........................................................................................106 Geochemical results of selected metals from quartz monzonite porphyry .........107 Geochemical results of selected metals from quartz veins ..................................108

x
LIST OF FIGURES
Figure 1 Figure 2 Figure 3 Figure 4 Figure 5 Figure 6 Figure 7 Figure 8 Figure 9 Figure 10 Figure 11 A Figure 11 B Figure 11 C Figure 11 D Figure 11 E Figure 11 F Figure 11 G Figure 11 H Figure 11 I Figure 12 Figure 13 Figure 14 Figure 15 Figure 16 Figure 17 Figure 18 Figure 19 Figure 20 Figure 21 Figure 22 Figure 23 Figure 24 A Figure 24 B Figure 24 C Figure 24 D Figure 24 E Figure 24 F Figure 24 G Figure 24 H Figure 24 I Figure 24 J Figure 24 K Figure 24 L Figure 25 Figure 26
Map of northwest Arizona ..................................................................................... 55 Geology of the Wallapai Mining District ................................................................ 56 Metal Zoning in the Wallapai Mining District......................................................... 57 Location of the Wikieup study area ....................................................................... 58 Shortwave infrared spectra of white mica minerals .............................................. 59 Shortwave infrared spectra of white micas of different compositions ................. 60 Geology of the Wikieup study area ........................................................................ 61 Primary lithologies of the Wikieup study area ....................................................... 62 Photomicrograph of white rhyolite under crossed polarized light ........................ 63 Wikieup area breccias ............................................................................................ 64 Cu distribution of quartz monzonite porphyry ...................................................... 65 Mo distribution of quartz monzonite porphyry ..................................................... 66 Pb distribution of quartz monzonite porphyry....................................................... 67 Zn distribution of quartz monzonite porphyry ....................................................... 68 Ag distribution of quartz monzonite porphyry ...................................................... 69 Mn distribution of quartz monzonite porphyry ..................................................... 70 As distribution of quartz monzonite porphyry ....................................................... 71 Sb distribution of quartz monzonite porphyry ...................................................... 72 Bi distribution of quartz monzonite porphyry ........................................................ 73 Trace element geochemistry of porphyry systems of Arizona ............................... 74 Alteration map of the Wikieup study area ............................................................. 75 Primary clay and mineral distribution from spectroscopic measurements ........... 76 K/Al vs. Na/Al molarity graph of unweathered quartz monzonite porphyry ......... 77 Alteration in hand sample ...................................................................................... 78 Map of white mica crystallinity distribution .......................................................... 79 Map of white mica composition distribution ......................................................... 80 Propylitic alteration of Precambrian granite .......................................................... 81 Map of kaolinite presence ...................................................................................... 82 Mineralized vein types ........................................................................................... 83 Mineralized breccia from Devil’s Canyon ............................................................... 84 Map of vein type distribution ................................................................................. 85 Cu distribution of mineralized veins ....................................................................... 86 Mo distribution of mineralized veins ..................................................................... 87 Pb distribution of mineralized veins ....................................................................... 88 Zn distribution of mineralized veins ....................................................................... 89 Ag distribution of mineralized veins ....................................................................... 90 Au distribution of mineralized veins ...................................................................... 91 Mn distribution of mineralized veins ..................................................................... 92 As distribution of mineralized veins ....................................................................... 93 Sb distribution of mineralized veins ....................................................................... 94 Bi distribution of mineralized veins ........................................................................ 95 Se distribution of mineralized veins ....................................................................... 96 Te distribution of mineralized veins ....................................................................... 97 Photomicrographs of fluid inclusion assemblages ................................................. 98 Distribution of fluid inclusion assemblages ............................................................ 99

xi
Figure 27 Figure 28 Figure 29 Figure 30 Figure 31 Figure 32
Visual-near infrared image of the Wallapai Mining District ................................. 100 Shortwave infrared image of the Wallapai Mining District .................................. 101 Visual-near infrared image of the Wikieup study area ........................................ 102 Shortwave infrared image of the Wikieup study area ......................................... 103 Color classified image of the Wikieup study area ................................................ 104 Synthesis map ....................................................................................................... 105

1
CHAPTER 1
INTRODUCTION
Arizona has been the site of continuing mining and mineral exploration since settlers
roamed across the West in search of legendary mineral deposits. Mining activities have been
ongoing since the 1860’s in the Cerbat Mountains of northwest Arizona, where the continuously
inhabited town of Chloride sits. Over the past century, exploration has focused on southern
Arizona, where large-scale disseminated copper deposits related to Laramide-aged intrusions
have been found. These deposits occur in trends and clusters, and supply the U.S. with the
majority of its copper. As a result of the focus on southern Arizona, northern Arizona has been
underexplored and has seen little exploration since the 1960s. Recently, the presence of
Laramide-aged intrusions has led to a resurgence in exploration of the Hualapai Mountains of
northwestern Arizona.
The Hualapai Mountains have not been mapped in detail, and doing so is the first step in
any geologic investigation. Advances in science have led to the creation of new tools to guide
exploration. Today’s laboratory techniques can provide much more accurate analyses of the
metals within rocks than in the past, which can lead to identification of geochemical footprints.
Applied spectroscopy allows us to identify important details of clays and minerals that were
impossible to distinguish during previous exploration attempts. Fluid inclusions reveal details of
the ancient hydrothermal fluids and the conditions under which they formed. Satellite imagery
is yet another tool more recently available, which allows us to see large scale mineralogic
patterns related to ore-forming processes. Each of these techniques provides a piece to the
puzzle and can help vector towards ore.

2
Such techniques are applied to the Wikieup prospect, currently held by Can-Cal
resources. This area sits on the eastern flank of the southern Hualapai Mountains, between the
porphyry copper deposits of Bagdad to the southeast and Mineral Park to the northwest (Figure
1). The purpose of this project is to investigate the hypothesis that the surface geology of the
Hualapai Mountains indicates the presence of a proximal porphyry copper system within the
area. This hypothesis is tested by characterizing the igneous rocks and veins of the Hualapai
Mountains by a variety of field and laboratory techniques. The goal of this project is to advance
our understanding of the economic potential of the Hualapai Mountains in order to aid future
exploration.

3
CHAPTER 2
BACKGROUND
Mineral Park and the Wallapai Mining District of the Cerbat Mountains
The best place to look for a new mineral deposit is near the cross beams of a mine, and
the best way to understand mineralized systems is to study similar deposits. For this reason, the
deposit at the Mineral Park mine was used as an analogue for the type of system for which we
were searching. The Mineral Park porphyry copper deposit is located in the center of the
Wallapai Mining District within the Cerbat Mountains of northwestern Arizona. The Mineral
Park mine is 50 miles north-northwest of the Wikieup study area (Figure 1).
Geology of the Wallapai Mining District
The geology of the Wallapai Mining district and the Mineral Park area has been
described in detail by Thomas (1949), Dings (1951), and Wilkinson et al. (1982). Figure 2 shows
the geology of the Wallapai Mining District as mapped by Dings (1951). The following
descriptions of the geology, alteration, and mineralization have been compiled from these
authors.
Precambrian Rocks
The Yavapai series of Precambrian metamorphic rocks makes up the majority of the
Cerbat Mountains. Rocks belonging to this group include an amphibolite composed of
hornblende and plagioclase that grades into a hornblende schist, biotite schist, chlorite schist, or
diorite gneiss.
4
Granite varies in color, texture, and mineral composition. The granite is most commonly
light-grey, medium-grained, gneissic granite with a small percentage of biotite. Zircons from
the granite gneiss were dated by U-Pb as having an age of 1,740 Ma (Silver, 1967).
Granite pegmatite dikes stem from irregularly shaped pegmatite bodies. These dikes
are typically less than a meter wide and discontinuous; therefore, they do not appear in Figure
2. The pegmatite is composed of quartz and potassium feldspar +/- muscovite. Early
researchers (Dings, 1951) believed the pegmatite was related to the Laramide-age Ithaca Peak
stock; however, the pegmatite was dated by Rb-Sr as having an age of 1,515 to 1,606 Ma
(Wasserburg and Lanphere, 1965).
Ithaca Peak Stock
The Ithaca Peak Stock is a light-grey, fine- to medium-grained porphyritic granite.
Outcrop of this rock is seldom unaltered. The Ithaca Peak Stock occurs as dikes and also as
large, circular outcrops in the center of the Wallapai Mining District. Phenocrysts make up only
a few percent of the volume of the rock. Phenocrysts are mainly pink orthoclase 2-5 mm in
length. Irregular quartz phenocrysts are less abundant and 0.15 – 0.25 mm in width. Biotite and
hornblende phenocrysts make up less than 7% of the rock. The groundmass consists of quartz
and orthoclase. Accessory minerals include microcline, microperthite, oligioclase, titanite,
magnetite, apatite, zircon, and minerals that are likely related to hydrothermal alteration
including sericite, chlorite, and kaolinite. Hydrothermal alteration of the Ithaca Peak stock is
dated as having an age of 73.3 +/- 2.6 Ma by K-Ar on vein biotite (Mauger and Damon, 1965).

5
Granite Porphyry Dikes
Granite porphyry dikes genetically related to the Ithaca Peak stock form irregularly
shaped, elongated bodies 15-75 m thick. These dikes are aligned parallel to northwest-trending
fractures that they sometimes fill. Porphyry dikes are more common at higher elevations within
the Mineral Park mine. Dikes contain a higher percentage of phenocrysts than the exposed
large intrusion.
Aplite Dikes
Aplite dikes are present but not common. They form short, narrow bodies, and do not
appear on Figure 2. These dikes consist of fine-grained, equigranular quartz and potassium
feldspar. These dikes have been interpreted as unrelated to mineralization within the Wallapai
mining district.
White Rhyolite Dikes
Rhyolite dikes occur at the geographic center of the main intrusive body at Mineral Park,
and have been interpreted to be genetically related to mineralization. Theses dikes trend north-
northwest and range in thickness from 1-30 m. The rhyolite dikes cut the Ithaca Peak stock and
are the youngest intrusive in the Wallapai District. These white rocks are aphanitic and only
rarely contain quartz or potassium feldspar phenocrysts.

6
Alteration in the Wallapai Mining District
Potassic
Potassic alteration is the earliest hydrothermal alteration at Mineral Park and is spatially
related to the ore shell. Potassic alteration is both selectively pervasive in large volumes and
also veinlet controlled, forming localized selvages. Secondary biotite replaced hornblende and
primary biotite in a 2.5 km2 area in the center of the system. Hornblende is commonly
completely replaced by shreddy biotite plus quartz and magnetite. Secondary biotite
replacement of primary biotite is never complete, and commonly only occurs along the primary
biotite rims. Potassic alteration commonly produced sagenitic rutile in the biotite. Secondary
biotite also occurs as scattered, small flakes in the groundmass of the porphyry, or in small
biotite + quartz veinlets.
Replacement of plagioclase by potassium feldspar is also both pervasive and vein-
controlled. This alteration may be complete or partial as rims on plagioclase phenocrysts.
Potassium feldspar alteration is not as widespread as secondary biotite alteration.
Phyllic
Phyllic alteration is the most widespread and pervasive alteration present at Mineral
Park. The phyllic alteration assemblage of quartz-pyrite-sericite is controlled by veins, but
completely overprints potassic alteration in the mine and extends 100’s of meters beyond the
potassic alteration. Sericite is more common where felsic rocks, rather than mafic rocks, were
altered.

7
Propylitic
The Precambrian amphibolite is locally epidotized in the Wallapai Mining District. In the
Mineral Park mine, chlorite occurs in veinlets and replaced biotite close to veinlets. Alteration
of mafic minerals to calcite, chlorite, and minor epidote is present throughout the open pit. This
alteration style is interpreted to have formed as the hydrothermal system cooled.
Mineral Park Mineralization
Lang and Eastoe (1988) described five types of mineralized veins at the Mineral Park
Mine. Paragenetic sequence was determined by cross-cutting relationships. These veins are
described from oldest to youngest below.
Anhydrite-molybdenite veins
These veins are composed of quartz + molybdenite + biotite + anhydrite +/-
chalcopyrite. Molybdenite occurs along the vein contact with the host rock. Quartz is fine-
grained near the edge of the vein and more coarse-grained in the center of the vein.
Chalcopyrite occurs as a trace mineral in the center of the veins.
Quartz-molybdenite veins
These veins consist of quartz + molybdenite +/- pyrite. Molybdenite occurs along the
contact of the vein and the host rock, and pyrite occurs at the center of the vein. There is no
variation in the texture of the quartz in these veins.

8
Anhydrite-chalcopyrite veins
These veins are composed of quartz + potassium feldspar + pyrite + sphalerite + biotite +
anhydrite + rutile + chalcopyrite + magnetite + calcite + chlorite. Galena and albite may occur in
these veins as well (Wilkinson, 1981). Pyrite and magnetite are intergrown with each other.
Chalcopyrite is much more abundant in these veins than in the anhydrite – molybdenite veins.
There is no textural zonation in these veins.
Quartz-pyrite veins
The composition of these veins varies from host-rock to host-rock. In felsic host rocks
these veins consist of quartz + sericite + pyrite + minor calcite +/- chalcopyrite. In mafic host
rocks these veins are composed of quartz + pyrite + calcite + chlorite + epidote +/- sericite +/-
chalcopyrite. These veins contain up to 1% hypogene chalcopyrite and supergene chalcocite
after pyrite.
Polymetallic quartz veins
Polymetallic quartz veins are the only type of mineralization to occur throughout the
entire Wallapai Mining District. These veins were an important early source of ore and have
been described by Thomas (1949), Dings (1951), Eaton (1980), and Lang and Eastoe (1988).
These veins are composed of alternating bands of quartz-sulfide material and fault gouge
material consisting of crushed and rolled quartz sulfide and wall rock. Common minerals in
these veins include quartz, pyrite, sericite, arsenopyrite, sphalerite, galena, chalcopyrite, and
carbonate minerals. Minor amounts of native Au, native Ag, Ag sulfosalts, tetrahedrite,
kaolinite, epidote, pyrrhotite, chalcocite, and covellite are found. Galena in these veins is
argentiferous.

9
These veins strike parallel to the northwest trending structures that dominate the area
and dip near vertical. The veins range from 10 cm to 10 m wide and pinch and swell along strike
lengths of 30 m to 4 km.
Wallapai Mining District Metal Zoning
The Wallapai Mining District surrounding the mineralized porphyry system at Mineral
Park displays a classic zoning of metals (Figure 3). This map was created by examining historic
production records, dump samples, and drill hole data and the resulting zoning pattern was
described by Eidel et al. (1968), Wilkinson et al. (1982), and most recently by Lang and Eastoe
(1988). Mo and Cu occur near the center of the system, associated with the hottest fluids. The
concentration of Mo dissipates away from center, and Cu becomes the dominant metal. Pb, Zn,
and As are more abundant within polymetallic veins at an intermediate distance from the center
of the system. The most distal reaches of the system that experienced the coolest hydrothermal
fluids contain anomalous concentrations of Au and Ag. A Mn halo occurs at the Cu-Mo to Cu
transition near the center of the district.
Mineral Park Fluid Inclusions
Fluid Inclusions from the Mineral Park deposit were studied by Lang and Eastoe (1988).
Four types of fluid inclusions were identified based on phase relationships.

10
Type I inclusions
Type I inclusions are two-phase, liquid-rich inclusions, with less than 50 vol % vapor.
These inclusions are the most common, occurring in all vein types. Type I fluid inclusions are up
to 40 µm in diameter. These inclusions have a moderate salinity, but do not contain a daughter
salt crystal.
Type IA fluid inclusions occur in quartz; they are unrelated to fractures and may be
primary. These inclusions occur in quartz + molybdenite, anhydrite + molybdenite, and
anhydrite + chalcopyrite veins.
Type IB fluid inclusions are spatially associated with type II vapor-rich inclusions and
occur attached to anhydrite in quartz + molybdenite, anhydrite + molybdenite, and anhydrite +
chalcopyrite veins. Opaque daughter crystals are not found in these inclusions.
Type IS fluid inclusions are secondary inclusions found in fractures in quartz. These
inclusions are smaller than other type I inclusions and have a negative crystal shape. Opaque
daughter crystals of pyrite and chalcopyrite are sometimes found in these inclusions.
Type II Inclusions
Type II inclusions are two-phase, vapor-rich inclusions that have a low salinity. These
inclusions are irregularly shaped and less than 10 µm in diameter. These inclusions occur
attached to solid inclusions of anhydrite and biotite in quartz + molybdenite, anhydrite +
molybdenite, and anhydrite + chalcopyrite veins.

11
Type III Inclusions
Type III inclusions contain halite as a daughter mineral. These inclusions are amoeboid
shaped and 5-50 µm in diameter. These inclusions occur in quartz + molybdenite, anhydrite +
molybdenite, and anhydrite + chalcopyrite veins.
Type IV Inclusions
Type IV inclusions contain a separate CO2 phase. Only one such inclusion was found at
Mineral Park, occurring in a quartz-molybdenite vein; therefore, it was regarded as an outlier
and did not receive much study.
Hydrothermal Evolution
Lang and Eastoe (1988) used fluid inclusions to argue that the hydrothermal system at
Mineral Park evolved over time. The coexistence of liquid- and vapor-rich inclusions in quartz-
molybdenite veins shows that the fluids responsible for Mo mineralization experienced
immiscibility at 370° – 410° C. Cu mineralization was related to nonboiling, saline fluids at 380°
– 420° C. The quartz-pyrite veins formed from low salinity, nonboiling fluids at 320° - 350°. The
polymetallic veins formed from nonboiling, low salinity fluids at 200° - 400° C.
Geology of the Hualapai Mountains
The Hualapai Mountains are the southern continuation of the Cerbat Mountains (Figure
1). The geology of the Hualapai Mountains is similar to that of the Cerbat Mountains. The
majority of the range is composed of Precambrian gneisses, schists, and granites dated at 1.6
and 1.4 Ga (Nyman et al., 1994). Many younger intrusions occur throughout the Hualapais, but

12
most have not been studied in detail. The porphyritic Diamond Joe Peak intrusion, located
twelve miles north of the study area has been dated at 71.9 +/- 1.5 Ma by K-Ar (Damon et al.,
1997).
Siwiec (2003) studied the structure and petrology of the western flank of the northern
Hualapai Mountains in detail. He describes seven types of Precambrian metamorphic and
igneous rocks including migmatitic gneiss, metasedimentary schist, amphibolite, orthogneiss,
and three types of granite; however, this study makes no mention of Laramide intrusions or any
related alteration or mineralization.
The Wikieup Study Area
The Wikieup study area is located on the eastern flank of the southern Hualapai
Mountains, 6.5 km west-southwest of the town of Wikieup (Figures 1 and 4). The study area
includes twelve square miles of claims held by Can-Cal Resources, as well as three adjacent
areas to the south: Devil’s Canyon, Bronco Wash, and Wikieup Queen (Figure 4). The study area
is not in a recognized mining district and little has been published concerning the geology and
mineral deposits of the study area. While numerous small scale historic mines are located
within the study area, there are no production records. No published geologic studies have
been conducted at Devil’s Canyon or Bronco Wash.
Can-Cal Area
Can-Cal Resources, Ltd. acquired 162 lode claims covering 3,240 acres in 2006. In 2008,
a geologic reconnaissance of the area was completed by Duncan Bain (Bain, 2008). No mapping
was completed, though Bain states that the geology of the area is similar to the Cerbat

13
Mountains. Numerous small-scale historic mines and polymetallic veins containing quartz,
pyrite, chalcopyrite, galena, sphalerite and magnetite and were found within the area. The
author concluded that mineralization within the area is consistent with a mesothermal vein
system that may be related to a proximal porphyry copper system such as Mineral Park to the
north. The author recommended that the claims be mapped and prospected in detail.
Wikieup Queen Area
Wikieup Queen is the location of the most substantial recent exploration in the area.
Hecla Mining Company conducted a 3.5 mile induced polarization survey and drilled a 662’ hole
between 1962 and 1963 (Hanson, 1977). Hanson (1977) described Precambrian rocks including
gneisses, schists, quartzite, diabase dikes and quartz-feldspar dikes. Although no dating was
done, Hanson described a quartz-monzonite porphyry and related latite-porphyry dikes of Late
Cretaceous to Early Tertiary age, basing their age on the lithologic similarity to Laramide-aged
porphyry dikes and copper deposits in Arizona. The youngest rocks of the Wikieup Queen area
include basalt plugs and an unconsolidated, non-bedded, pebble to boulder conglomerate, both
concluded to be Late Tertiary to Pleistocene in age. The porphyry and related dikes were the
focus of exploration by the Cenard Oil and Gas company, and interpreted to be related to the
copper and molybdenum anomaly of the area.
A geochemical soil survey and magnetic survey carried out by Hanson (1977) resulted in
the identification of several drill targets near the contact separating the Precambrian rocks from
the quartz-monzonite porphyry. As a result, one core hole was drilled on a molybdenum soil
anomaly. The hole was designed to go to 1,200 m, but ended after 997 m due to a loss of
circulation. No significant Cu or Mo were encountered in the core. The author concluded that

14
more drill-testing is needed in the Wikieup Queen area in order to prove or disprove the
presence of a significant mineralized system.
Currently, Wikieup Queen is being explored by Bluestone Resources, who drilled eleven
holes to a depth of up to 380 meters in 2011. Cu and Mo mineralization was encountered only
in the top 78 meters of drill core.

15
CHAPTER 3
METHODS
Geology
The study area was mapped at a 1:24,000 scale. Mapping focused on the Can-Cal area
with one day spent in the Wikieup Queen area and a half day in Devil’s Canyon. Aerial photos
were used to identify outcrops of interest, which were then visited. The rocks and alteration
were described in the field. Special attention was paid to the identification and measurements
on intrusions, structures, and veins. All sample collection was completed during this mapping
project. All samples and the analytical techniques applied to each are tabulated in Appendix A.
Petrography
Rock samples were cut with a tile saw and examined macroscopically to better
understand the lithology. Polished thin sections were made from representative unaltered,
altered, and mineralized samples. These thin sections were examined with transmitted plane
polarized light to identify nonopaque minerals, and reflected plane polarized light to identify
opaque minerals. Mineral percentages were visually estimated.
Geochemistry
Forty samples of hydrothermal veins were collected from historic mines, prospecting
pits, and outcrop. The samples were analyzed by ALS Minerals in Reno, NV. The samples were
crushed, homogenized, and digested by aqua regia. The samples were analyzed by inductively

16
coupled mass spectrometry for 51 elements (Table 1). The samples were also analyzed for Au
by fire assay fusion inductively coupled plasma atomic emission spectroscopy in order to obtain
a low limit of detection.
Sixteen samples of unaltered quartz monzonite were collected from road cuts and
unweathered outcropping dikes. The samples were sent to ALS Minerals in Reno, NV, where
they were crushed, homogenized, and digested using a four-acid method. The whole rock
samples were analyzed by X-ray fluorescence spectroscopy for oxides and inductively coupled
plasma mass spectrometry for 48 elements (Table 1).
Clay Mineralogy
Hand samples were selected for analysis based on the visible presence of clay minerals.
Samples were analyzed with the ASD TerraSpec 4 Standard-Res Mineral Analyzer with a
wavelength range of 350-2500 nanometers. This instrument features three separate
spectrometers, one with a wavelength range of 350-700 nanometers and a resolution of 3
nanometers, another with a wavelength range of 700-1400 nanometers and a resolution of 10
nanometers, and another spectrometer with a range of 1400-2500 nanometers and a resolution
of 10 nanometers. Prior to interpretation, data from the three spectrometers were spliced
together with ASD ViewspecPro software. Characteristic visual-near infrared and shortwave
infrared absorption features were identified with The Spectral Geologist (TSG) software. The
best matches from the TSG spectral library were used to identify clay minerals.
The formation of smectite, illite, or muscovite is dependent on the temperature of the
hydrothermal system and these mineralis can be distinguished using Terraspec analysis. AlOH
17
bonds absorb infrared light at ~2208 nanometers, while water molecules in the interlayer sites
of sheet silicates absorb light at 1900 nanometers. The depth of these absorption features was
recorded with TSG software. The ratio of the relative absorption at these two wavelengths
provides a white mica crystallinity index (Figure 5) and is a proxy for temperature of white mica
formation in a hydrothermal system.
The exact position of the minimum point of the 2208 nanometer absorption feature is
variable based on composition (Figure 6) and was recorded and interpreted with TSG. Under
neutral conditions, muscovitic illite forms with a wavelength close to 2208 nanometers. In
acidic conditions, paragonitic illite forms with a wavelength less than 2200 nanometers. In
alkaline conditions, phengitic illite forms with a wavelength close to 2220 nanometers.
Fluid Inclusion Petrography
Fourteen mineralized hydrothermal quartz veins were selected for preparation of
doubly polished thick sections based on location, geochemical results, presence of sulfide
mineralization, and quality of the quartz. Fluid inclusions were studied under plane polarized
transmitted light. The inclusions were measured, described, and counted, with special emphasis
placed on the number of phases present, the phase ratios, and the presence of halite and other
daughter crystals.
The origin of the fluid inclusions was determined based on the classification of Roedder
(1984) and Goldstein and Reynolds (1994). Primary fluid inclusions trap the original
hydrothermal fluid that precipitated the host mineral, and are found within mineral growth
zones. Secondary fluid inclusions occur within healed fractures in the crystals, and crosscut
mineral growth zones. These inclusions are commonly found along curved planes or trails.

18
Pseudo-secondary fluid inclusions are similar to secondary fluid inclusions, but the planes they
occur within end at a mineral growth zone. Fluid inclusions not displaying characteristics of
primary, secondary, or pseudo-secondary inclusions were described as unknown in origin.
Fluid inclusions were grouped into assemblages based on consistency of phase ratios as
well as the shape and origin of the inclusions. Fluid inclusions within each assemblage trapped
the same hydrothermal fluid at the same conditions.
Remote Sensing
The Advanced Spaceborne Thermal Emission and Reflection Radiometer (ASTER) is a
multispectral imaging instrument aboard NASA’s TERRA Earth orbiting satellite launched in
1999. The instrument contains 14 separate bands covering a wide spectral region from the
visible-near infrared (VNIR) to the shortwave infrared (SWIR) and thermal infrared (TIR). The
VNIR bands range from 0.52 µm to 0.86 µm and have a ground resolution of 15 meters. The
SWIR bands have a range of 1.6 µm to 2.43 µm and have a ground resolution of 30 meters. The
TIR bands have a range of 8.125 µm to 11.65 µm and have a ground resolution of 90 meters.
Level 1B data for the Mineral Park and Wikieup study areas were downloaded from
NASA’s Reverb website (http://reverb.echo.nasa.gov). These data were processed with ENVI
software. The VNIR bands 3-2-1 were combined into a Red-Green-Blue image. Using the
bandmath feature of the ENVI software, the SWIR band 4 was divided by SWIR bands 5, 6, and 7.
The resulting bands were combined into a Red-Green-Blue false color image that highlights the
AlOH absorption feature at 2.20 µm and 2.21 µm and the FeOH absorption feature at 2.24 µm

19
(Di Tomasso & Rubenstein, 2007). This produces an image where AlOH and FeOH mineralized
areas are white against an otherwise colorful background.
20
CHAPTER 4
GEOLOGY
Prior to this study, the Wikieup study area was not mapped in detail. The first goal of
this project was to better understand the surface geology. Figure 7 shows the geology of the
Wikieup study area mapped in 2012. Photographs of the most commonly encountered rocks
are shown in Figure 8.
Primary Lithology
Precambrian Rocks
The Precambrian suite of rocks described by Hanson (1978) and Siwiec (2003) make up
the majority of the Wikieup study area. Mapped rocks include migmatitic granite (Figure 8a),
augen gneiss, biotite schist (Figure 8b), amphibolite, quartzite, and diabase. All Precambrian
rocks were mapped as Precambrian rocks. No distinction between individual members of the
Precambrian rock suite was made during mapping and no measurements of these rocks were
recorded.
Potassium Feldspar – Quartz Pegmatite
Pegmatite dikes and pods occur sporadically located throughout the Can-Cal area.
While commonly found adjacent to northwest-striking quartz monzonite porphyry dikes, the
orientation of the pegmatite is not regular (Figure 7).
The pegmatite (Figure 8c) is composed of potassium feldspar (55%), quartz (37%),
muscovite (7%), and minor tourmaline (1%). Crystals are typically 2-5 cm in length. The texture

21
of the pegmatite is most commonly massive and coarse-grained; however, locally there are
distinct differences. The most coarse-grained pegmatite occurs in the northern Can-Cal area,
where black tourmaline crystals up to 12 cm in length and 3 cm in diameter occur. Pegmatite
transitions to the south, containing finer crystals and exhibiting a graphic granitic texture locally
in the southern Can-Cal area.
Aplite
Aplite dikes occur in Devil’s Canyon and the central Can-Cal areas. These dikes are 3-8
meters thick, strike 50°, and cut through Precambrian rocks. The dip of these structures is
vertical. The most pronounced of these dikes is 1.2 km long (Figure 7).
The aplite (Figure 8d) is composed of potassium feldspar (60%), quartz (36%), magnetite
(3%), and muscovite (1%). Magnetite crystals are parallel, tabular, and 1-2 mm long and 0.5 mm
wide. Muscovite is bladed in shape and rims the magnetite grains.
White Rhyolite
Aphanetic white rhyolite forms two massive, semi-continuous dikes striking 350° and
dipping 70°E to vertical (Figure 7). The dikes are 10’s of meters wide and can be followed for six
kilometers. The white rhyolite cuts the pegmatite west of the Can-Cal area and cuts the aplite
dike in the south central Can-Cal area. This unit is resistant to weathering and forms
topographic highs throughout the Wikieup study area.
The white rhyolite (Figure 8e) is composed of quartz (70%), plagioclase (20%), white
mica (10%), and minor biotite (Figure 9). Quartz and plagioclase crystals are 80 µm in length.
The white mica occurs as blades up to 100 µm in length.

22
Quartz Monzonite Porphyry
Quartz monzonite porphyry dikes occur in the Can-Cal, Devil’s Canyon, and Wikieup
Queen areas (Figure 7). The swarms of dikes strike 315° – 335°. The dikes are 3-30 m in width
and reach 3 km in length. The highest concentration of porphyry dikes is in the southwest Can-
Cal area, where the dikes trend toward Devil’s Canyon. The porphyry dikes cut the Precambrian
rocks, pegmatite, aplite, and white rhyolite.
The porphyry dikes are composed of 40% phenocrysts and 60% groundmass (Figure 8f).
The phenocrysts consist of plagioclase (45%), potassium feldspar (25%), biotite (20%), quartz
(8%), apatite (1%) and pyrite (1%). Plagioclase and potassium feldspar crystals reach 3 mm in
diameter. Hexagonal books of biotite reach 2.5 mm in diameter. Rounded quartz “eyes” reach
3 mm in diameter. Pyrite crystals reach 0.5 mm in diameter. Apatite crystals reach 1 mm in
diameter. The groundmass of the rock is composed of quartz (60%) and potassium feldspar
(40%). Groundmass crystals are ~40 µm in diameter and display a jigsaw texture.
Polymict Breccias
Two breccias are present in the southwest Can-Cal area and in Devil’s Canyon. Both
occurrences of the breccia are heavily altered (Figure 10). Both breccias are clast-supported,
with subangular to rounded clasts.
The breccia body in the southwest Can-Cal area (Figure 10a) is exposed in an excavated
2m x 2m trench. The orientation and size of the breccia body is unclear; however, it does
appear to extend past the current excavation. Primary lithology of the clasts of this breccia
cannot be identified due to extreme clay alteration and oxidation. Most of the original texture
of the clasts is gone, replaced by highly crystalline illite and quartz. Some clasts appear to have

23
a porphyritic texture and are likely altered quartz monzonite porphyry. Clasts from this breccia
are up to 10 cm in width. The matrix of this breccia is composed of quartz and limonite.
The Devil’s Canyon breccia sample is from a circular outcrop ~5m wide that cuts
Precambrian rocks. The primary rock types in this breccia include semi-rounded clasts of
Precambrian rocks, aplite, and quartz monzonite porphyry. The clasts are up to 4 cm in
diameter. The matrix of this breccia is silicified rock flour.
Basalt
Basalt forms two “plugs” similar to those described by Hanson (1977) north of Wikieup
Queen. The basalt was mapped (Figure 7), but due to the unlikeliness of its relation to a
porphyry copper system, the rock was not studied in detail.
Alluvium
Alluvium fills the valley to the east of the Hualapai Mountains and an east-west drainage
cutting through part of the Can-Cal area. The alluvium is unconsolidated and composed of sand
to cobble sized fragments of the rocks described above.
Primary Lithology Interpretation
The Precambrian suite of rocks dominates the Wikieup study area, much like the rest of
the Hualapai and Cerbat mountains. Crosscutting relationships show the relative timing of
emplacement of the intrusions. The first post-Precambrian intrusions were the pegmatite and
aplite, which have very similar mineralogies and may be genetically related. These rocks are
older than the quartz monzonite porphyry, which cuts them. They are found in structures that

24
exhibit somewhat random orientations. Thus, these rocks are not obviously related to the
Laramide event that likely controlled the orientation of the porphyry dikes. Based on cross-
cutting relationships the white rhyolite was emplaced after the aplite. Intrusion of the quartz
monzonite porphyry dikes was the final intrusive event in the study area. The polymict breccia
at Devil’s Canyon contains clasts of Precambrian rocks, aplite, and quartz-monzonite porphyry,
and is therefore younger than the intrusions.
The semi-rounded clasts present in both breccias suggest at least moderate
transportation and tumbling prior to lithification. Breccia pipes are relatively common in
porphyry deposits (Sillitoe, 2010), a fact that makes Devil’s Canyon and the southwest Can-Cal
area appear favorable from an exploration prospective.
The abundance of the quartz monzonite porphyry dikes is greatest in the southwest part
of the Can-Cal claim block, indicating increased intrusive activity and fracturing near Devil’s
Canyon. In the eastern Can-Cal area the abundance of the quartz monzonite porphyry dikes
increases towards the south, indicating increased intrusive activity and fracturing near Wikieup
Queen.
Quartz Monzonite Porphyry Geochemistry
The quartz monzonite porphyry is the lithologic unit most closely associated with
observed base and precious metal mineralization in the Wikieup study area. Geochemical
analysis of 16 quartz monzonite porphyry samples has provided the chemical makeup of the
rock. Fresh, minimally altered rock was selected for analysis. The samples were collected from
the dike swarms in the Can-Cal area and at Wikieup Queen. One additional sample was
25
collected from the southern edge of the Can-Cal area; however, no fresh samples were found in
Devil’s Canyon. The samples were analyzed by X-ray fluorescence spectroscopy for oxides and
inductively coupled plasma mass spectrometry for 48 elements (Table 1). All geochemical data
are tabulated in Appendix B.
Metals
Trace metal concentrations of the quartz monzonite porphyry were examined to
identify any geochemical patterns. Table 2 contains the data used for the following
observations as well as the average crustal abundances as reported by Taylor (1964).
Cu
Figure 11 A shows the distribution of Cu concentrations in unaltered quartz monzonite
porphyry samples. Samples in the western dike swarm that cut across the southwest corner of
the Can-Cal area have low concentrations of Cu. The sample with the highest concentration of
Cu (620 ppm) is from Wikieup Queen. This sample contains a concentration of copper more
than sixty times higher than the average granite (Turekian and Wedepohl, 1961). The next
highest concentration of Cu is from a sample in the western Can-Cal area (49.3 ppm). Two other
samples with high Cu values (40.2 ppm and 36 ppm) were collected from east of the Can-Cal
area and from the Wikieup Queen.
Mo
Figure 11 B shows the distribution of Mo concentrations in unaltered quartz monzonite
porphyry samples. The two samples with the greatest concentrations of Mo were collected
from Wikieup Queen. All other samples contain Mo values lower than the average granite,
which is 1 ppm (Vinogradov et al., 1958).

26
Pb
Figure 11 C shows the distribution of Pb in unaltered quartz monzonite porphyry
samples. Samples with the highest concentration of Pb are from the western Can-Cal area and
Devil’s Canyon. Samples from Wikieup Queen contain low concentrations of Pb.
Zn
Figure 11 D shows the distribution of Zn in unaltered quartz monzonite porphyry
samples. The sample with the highest concentration of Zn is from Wikieup Queen and contains
more than three times the average amount of Zn found in granite, which is 40 ppm (Turekian
and Wedepohl, 1961). The next greatest concentration of Zn is from east of the Can-Cal area.
Quartz monzonite porphyry from the western Can-Cal area contains low concentrations of Zn.
Ag
Figure 11 E shows the distribution of Ag in unaltered quartz monzonite porphyry
samples. The samples with the highest concentrations of Ag are found east of the Can-Cal area
and in Wikieup Queen. These samples contain a concentration of Ag six times higher than the
average granite, which is 0.04 ppm (Turekian and Wedepohl, 1961). Samples from the western
Can-Cal area contain low concentrations of Ag.
Mn
Figure 11 F shows the distribution of Mn in unaltered quartz monzonite porphyry
samples. All reported values of Mn are below the average concentrations of granite, which is
400 ppm (Turekian and Wedepohl, 1961). The samples with the highest concentration of Mn

27
are from Wikieup Queen. Samples with the lowest concentration of Mn are from the central
and western Can-Cal area.
As
Figure 11 G shows the distribution of As in unaltered quartz monzonite porphyry
samples. The samples with the highest concentration of As are from the northwestern Can-Cal
area. Samples from the Wikieup Queen and the southwestern, central, and eastern Can-Cal
area contain low concentrations of As.
Sb
Figure 11 H shows the distribution of Sb in unaltered quartz monzonite porphyry
samples. The sample with the highest concentration of Sb (1.53 ppm) is from the central Can-
Cal area. The sample with the next highest concentration of Sb (0.74 ppm) is from Wikieup
Queen. Samples from the western Can-Cal area contain low concentrations of Sb.
Bi
Figure 11 I shows the distribution of Bi in unaltered quartz monzonite porphyry samples.
The samples with the highest concentration of Bi are from Wikieup Queen. Samples from the
western Can-Cal area contain low concentrations of Bi.
Quartz Monzonite Porphryry Metals Interpretation
Even with the small sample size, a metal zonation pattern centered at Wikieup Queen is
indicated. Wikieup Queen contains elevated levels of Cu, Mo, Mn, Ag, Bi and Zn. The Bi-Zn zone
may extend west from Wikieup Queen to the central Can-Cal area. Sb is not consistent with this

28
trend. The zone of elevated Pb is northwest of Wikieup Queen. The As zone is most distal to
Wikieup Queen. Further sampling might more firmly establish the metal zoning pattern.
Quartz Monzonite Porphyry Trace Elements
Lang and Titley (1998) showed that productive and unproductive porphyry systems can
be distinguished by trace metal compositions. Productive porphyry systems display
characteristically low values of Mn, Y, and the high field strength elements (Hf, Ta, Zr, and Nb).
Figure 12 A shows a plot of yttrium versus the high field strength elements for a number
of Laramide porphyry systems including Mineral Park, Bagdad, and Diamond Joe. Barren and
subproductive systems generally contain >~10 ppm Y and >~250 Σ HFSE. Productive porphyry
systems all contain <15 ppm Y and <300 Σ HFSE. All of the 16 samples of quartz monzonite
porphyry from the Wikieup study area contain 5-12 ppm Y and 78-190 Σ HFSE, clearly plotting in
the area of productive deposits.
Figure 12 B shows a plot of yttrium versus manganese for the same systems as above.
Barren and subproductive systems generally contain >10 ppm Y and >400 ppm Mn. Productive
porphyry systems all contain <15 ppm Y and <400 ppm Mn. Quartz monzonite porphyry from
the Wikieup study area contains 5-12 ppm Y and 150-389 ppm Mn, again plotting clearly in the
productive region of the graph.
29
Quartz Monzonite Porphyry Trace Elements Interpretation
Samples of quartz monzonite porphyry from the Wikieup study area have a trace and
high field strength element signature similar to rocks associated with productive Laramide
porphyry systems of the southwestern US (Lang and Titley, 1998). Quartz monzonite porphyry
rocks from the Wikieup study area contain elevated trace elements commonly present in
productive porphyry systems. These analyses are consistent with the presence of a
hydrothermal system in the Wikieup study area that may contain porphyry-style mineralization.
Alteration
Figure 13 shows alteration zones mapped in the Wikieup study area, based on field
observations and laboratory analyses. The analysis and identification of clays was facilitated by
use of the ASD TerraSpec 4 Standard-Res Mineral Analyzer. Spectral data are tabulated in
Appendix C. Figure 14 shows the distribution of clay minerals identified using the TerraSpec on
hand samples collected throughout the Wikieup study area.
Potassic Alteration
Potassic alteration is characterized by the replacement of primary minerals by
secondary potassium feldspar and biotite. Potassic alteration is not abundant in the Wikieup
study area; however, two altered samples based on geochemical analysis experienced a loss in
Na and increase in K that typifies potassic alteration (Figure 15). These samples were collected
from the Wikieup Queen area. In outcrop, potassic alteration was observed locally in Devil’s
Canyon and at the Wikieup Queen (Figure 13). Secondary potassium feldspar replaced
phenocrysts of plagioclase and the matrix of quartz monzonite porphyry along selvages of

30
quartz veins that reached two cm in width, producing the typical salmon pink color in hand
sample (Figures 16 A, B). Secondary biotite was not observed in the Wikieup study area.
Phyllic Alteration
Phyllic alteration is characterized by the replacement of igneous minerals by quartz,
pyrite, and white micas including muscovite and illite. Phyllic alteration is found throughout the
project area, most commonly in the southern Can-Cal area (Figure 13). Phyllic alteration is
pervasive in the quartz monzonite porphyry, occurring in plagioclase feldspars throughout the
rock. Muscovites and illites of varying compositions replaced plagioclase phenocrysts and
matrix in the quartz monzonite porphyry (Figure 16 C).
White mica properties were identified with the TerraSpec multispectral infrared
analyzer. The distribution of the crystallinity of white micas is shown in Figure 17. Low
crystallinity white micas are most concentrated within and beyond the western Can-Cal area and
in Devil’s Canyon. High crystallinity white micas are found in the southwestern and central areas
of the Can-Cal claims with a few additional high crystallinity white micas identified in the
northeast corner, and just east of the southeast corner of the Can-Cal area, and in Devil’s
Canyon and Wikieup Queen.
The composition of white micas was also examined with the TerraSpec multispectral
infrared analyzer. Figure 18 shows a map of the distribution of white mica composition based
on AlOH wavelength. The majority of white micas in the Wikieup study area are muscovites that
formed under neutral conditions. Four samples collected in the eastern part of the Can-Cal area
have a phengitic composition. One sample each from Devil’s Canyon, the central Can-Cal area,
and the southwestern Can-Cal area, and two samples from the western Can-Cal area have a
paragonitic composition.

31
Propylitic Alteration
Propylitic alteration occurs scattered locally throughout the study area (Figure 13).
Epidote veins up to 3 cm thick are found in Precambrian rocks and aplite dikes. In the
Precambrian rocks, a chlorite + white mica selvage extends up to 4 cm from an epidote vein
(Figure 19). Chlorite replaces biotite to varying degrees in the selvage (Figure 19). Biotite near
the vein is completely altered to chlorite. Further away, biotite is only partially altered to
chlorite and a tiger-stripe pattern can be observed. Outside of the selvage the biotite is fresh.
Epidote veins do not cut quartz monzonite porphyry, however semi-complete chlorite
replacement occurs within biotite books in this rock in the form of tiger-stripe banding similar to
that present in the Precambrian rocks.
Argillic Alteration
Low temperature clay alteration occurs in Devil’s Canyon and the Can-Cal area.
Montmorillonite is the most dominant mineral of this assemblage and is present in the north,
central, and western parts of the Can-Cal area as well as Devil’s Canyon (Figure 14). This low
temperature alteration product of plagioclase is identical in appearance to illite (Figures 16 C,
D), making field distinctions difficult.
Kaolinite is the dominant clay mineral in one sample from west of the Can-Cal area
(Figure 14). However, kaolinite is also found in Devil’s Canyon, Wikieup Queen, and the dike
swarm in the southwestern Can-Cal area as a minor clay mineral (Figure 20). Kaolinite is not
present in the central or eastern Can-Cal area.

32
Oxidation
Oxides of sulfide minerals are commonly present within fractures and on the surface of
outcrop. Goethite occurs in the southwest Can-Cal area where it commonly fills the fractures in
the quartz monzonite porphyry. Goethite also replaces the rims of biotite books within the
quartz monzonite porphyry and adds a brownish hue to the rock in outcrop.
Jarosite occurs in the southwest Can-Cal area. The yellow staining is most notable in the
southwest Can-Cal breccia. Identification of jarosite was confirmed with the Terraspec.
Manganese oxide fills fractures in the white rhyolite and quartz monzonite porphyry.
The manganese oxide has a dendritic texture and is common in weathered rocks.
Green copper oxide minerals occur in Devil’s Canyon, Wikieup Queen, and the
southwest corner of the Can-Cal area. The oxides were mined at Wikieup Queen, and traces of
the historic mining operation including turquoise chips are still found on the surface near in the
eastern part of the area. In Devil’s Canyon, copper oxide minerals are a minor constituent of a
polymetallic vein. Copper oxides are disseminated throughout a quartz monzonite porphyry
dike near the massive sulfide in the southwestern Can-Cal area.
Alteration Interpretation
Alteration within the Wikieup study area reflects the presence of hydrothermal fluids
and alteration zoning is also indicated. Potassic alteration is a result of high temperature
hydrothermal fluid (> 400°C) reaction with rocks (Sillitoe, 2010), therefore Devil’s Canyon and
Wikieup Queen experienced the hottest hydrothermal conditions and are closest to an inferred

33
intrusion. As potassic alteration is not widespread in the mapped area, the center of the
hydrothermal system is some distance from the mapped area or at depth below the surface.
Phyllic alteration is created by cooler fluids, therefore the Can-Cal area is more distal to
the center of the system than the areas to the south. The crystallinity of white micas indicates
that the hottest hydrothermal fluids in the Can-Cal area were located in the southwestern
section of the study area. Fluids in the eastern Can-Cal area were least acidic and therefore may
not have been related to magmatic-hydrothermal fluids.
Montmorillonite, one of the low-temperature argillic alteration clay minerals, occurs in
Devil’s Canyon and the Can-Cal area and may be related to surficial weathering. However, the
presence of other low temperature clays may indicate a relationship to a hydrothermal system.
Kaolinite forms in low temperature, low pH systems, and may have formed from reaction of
alumino-silicate minerals with acidic fluids that formed from meteoric fluid oxidation of pyrite.
The presence of jarosite is another clear indication of acidic supergene conditions, as jarosite is
deposited from fluids with a pH < 2 (Dilles and Einaudi, 1992). Such low pH waters are
important remobilizers of Cu, which may lead to the formation of a supergene blanket of copper
minerals under certain oxidizing and conditions.
The presence of Fe- and Cu-oxide minerals indicates sulfide minerals have indeed been
dissolved and metal was mobilized. A substantial amount of Fe and Cu may therefore have been
deposited from a hydrothermal system. The southwestern part of the Can-Cal area where
goethite, jarosite, and Cu-oxides occur is downhill of Devil’s Canyon to the south. Devil’s Canyon
also contains Cu mineralization. It is therefore possible that meteoric fluid in Devil’s Canyon
oxidized pyrite and created acidic fluids that remobilized Cu to the southwestern Can-Cal area
where the fluids were buffered and the copper deposited as Cu-oxide.

34
Hydrothermal Mineralization
A variety of mineralized quartz veins occur throughout the study area, commonly at the
Precambrian-quartz monzonite porphyry contact. Mineralized samples were collected from
historic mines, prospecting pits, and outcrop. The veins were categorized based on mineralogy
(Figure 21).
Quartz + Magnetite Veins
Quartz-magnetite veins occur in the northern Can-Cal area. Quartz is the dominant
mineral, making up 90% of the vein. The quartz is translucent and slightly milky-white in
appearance. Specular hematite locally occurs on fracture surfaces. Local magnetite veins
commonly exhibit hematite staining along fractures. These veins do not contain sulfide
minerals.
Polymetallic Quartz + Pyrite + Galena Veins
Polymetallic quartz veins occur in Devil’s Canyon, Wikieup Queen, and the southern
Can-Cal area. These veins commonly contain euhedral quartz crystals up to 3 cm in length.
Quartz forms a dogtooth pattern, and pyrite and galena commonly conform to the quartz
crystals and occupy the centerline of the veins. This quartz is more translucent than the quartz
in the magnetite veins.
Massive Sulfide Sphalerite + Pyrite + Chalcopyrite + Galena Vein
A vein of massive sulfide (Figures 21 E, F) was collected from a waste pile in the
southwest Can-Cal area. Brown and black sphalerite is the dominant mineral in this vein.
Euhedral pyrite forms inclusions in chalcopyrite and sphalerite. Galena also forms inclusions
within the edges of pyrite crystals.

35
Breccia Mineralization
The polymict breccia in Devil’s Canyon (Figure 10 B) contains sulfides throughout the
clasts and the matrix. Pyrite is more abundant than chalcopyrite, occurs as clasts up to 700 µm
wide, and forms 300 µm wide veins cutting through clasts and matrix (Figure 22). Chalcopyrite
occurs as smaller scattered crystals up to 20 µm wide. Bornite was observed in outcrop, but not
encountered in polished section.
The polymict breccia from the southwest Can-Cal area contains a leached matrix of
quartz + Fe-oxide. This breccia is heavily altered and sulfide minerals are no longer present in
the matrix or clasts.
Mineralized Vein Interpretation
Figure 23 shows a map of the distribution of mineralized vein types, which suggests the
study area exhibits metal zoning based on the presence of sulfide veins. The northern Can-Cal
area is barren of hydrothermal sulfide minerals and does not contain any mineralized veins. The
western Can-Cal area is dominated by quartz + magnetite veins, whereas polymetallic veins
dominate the central Can-Cal area as well as Devil’s Canyon and Wikieup Queen.
Based on the vein mineralization, Wikieup Queen, Devil’s Canyon and the southwest
corner of the Can-Cal area are most prospective to porphyry copper mineralization due to the
presence of sulfide minerals. The presence of mineralized breccia in Devil’s Canyon suggests the
potential for porphyry style mineralization at depth. The rounded clasts of the breccia show
that there was significant and dynamic transport before deposition. Sulfides occur in the clasts,
indicating the presence of sulfide mineralization at depth.

36
Mineralized Vein Geochemistry
Geochemical analysis of mineralized vein samples was used to produce metal
abundance maps in order to identify patterns of metal distribution. Concentrations of the
metals most useful to Cu-exploration are tabulated in Table 3. The distribution of these metals
is illustrated in Figures 24 A-L. All data used for the creation of these figures are tabulated in
Appendix D.
Cu
Figure 24 A shows the distribution of Cu abundance in mineralized samples collected
from the study area. Cu values are lowest in the northern part of the study area and increase
towards the south. The highest-grade Cu samples (15,900 ppm and 11,250 ppm) were collected
from the Devil’s Canyon area. The next highest grade samples come from the southwestern
Can-Cal area (4,230 ppm), the south central Can-Cal area (3,370 ppm), and Wikieup Queen
(2,310 ppm and 2,020 ppm). Remaining samples contain less than 712 ppm Cu.
Mo
Figure 24 B shows the distribution of Mo concentrations in mineralized samples. Mo
values are lowest in the north and increase towards the south. Samples from the Can-Cal area
range from 0.5 ppm to 23.6 ppm. Wikieup Queen contains the largest number of elevated Mo
samples, with five samples containing greater than 200 ppm Mo. The highest grade sample
from Wikieup Queen contains 1,840 ppm Mo, while the lowest grade sample from that locality
contains 76.7 ppm Mo. Devil’s Canyon contains two of the highest grade Mo samples collected
in the study area, with values of 2,390 ppm and 1,430 ppm.

37
Pb
Figure 24 C shows the distribution of Pb concentrations in mineralized samples. The
highest concentrations of Pb are located in the south central Can-Cal area. Devil’s Canyon and
Wikieup Queen contain low to moderate Pb values.
Zn
Figure 24 D shows the distribution of Zn concentrations in the mineralized samples.
Elevated Zn values are scattered throughout the area, with no clear anomalous zones identified.
The highest-grade sample of Zn (4,470 ppm) is from the mineralized breccia in Devil’s Canyon.
Zn values are low in the northern, central, and western Can-Cal areas. Most samples from
Wikieup Queen contain low concentrations of Zn.
Ag
Figure 24 E shows the distribution of Ag concentrations in mineralized samples. The
highest-grade Ag samples are from the south-central Can-Cal area. Samples from Devil’s Canyon
and Wikieup Queen contain low Ag concentrations.
Au
Figure 24 F shows the distribution of Au concentrations in mineralized samples. The
highest-grade Au samples are from veins in the central part of the study area and in the central
Can-Cal area. Samples from Devil’s Canyon and Wikieup Queen contain low Au concentrations.
The distribution of Au and Ag are generally similar.

38
Mn
Figure 24 G shows the distribution of Mn concentrations in mineralized samples.
Samples with the highest concentration of Mn form a west-northwest trend from the south
central to the southwestern Can-Cal area. Mn values are low in Cu and Mo mineralized samples
from Devil’s Canyon, Wikieup Queen, and in samples from the north and eastern Can-Cal area.
As
Figure 24 H shows the distribution of As in mineralized samples. As values are highest in
the central part of the Can-Cal area, and are low in Devil’s Canyon. Most samples from Wikieup
Queen are low in As, with the exception of one sample.
Sb
Figure 24 I shows the distribution of Sb concentrations in mineralized samples. Samples
with the highest concentration of Sb are from the south-central Can-Cal area. Sb values are low
in Devil’s Canyon, Wikieup Queen, and the western and northern Can-Cal area.
Bi
Figure 24 J shows the distribution of Bi concentrations in mineralized samples. Samples
with the highest concentration of Bi are from Wikieup Queen and the southwestern Can-Cal
area. Bi values are low in Devil’s Canyon and the northern, central, and eastern Can-Cal area.
Se
Figure 24 K shows the distribution of Se concentrations in mineralized samples. Samples
from Wikieup Queen contain the highest concentration of Se (40.1 ppm, 34.1 ppm, 22 ppm, and
10.5 ppm). All other samples contain <10 ppm Se.

39
Te
Figure 24 L shows the distribution of Te concentrations in mineralized samples. The
highest-grade sample of Te is from Wikieup Queen and contains 62.6 ppm of the metal. The
next two highest-grade samples are from the southwestern Can-Cal area. Relatively low
concentrations of Te are found in Devil’s Canyon and the northern and central Can-Cal area.
Mineralized Vein Geochemistry Interpretation
The number of veins sampled and analyzed as part of this study is low compared to
typical efforts of corporate exploration groups. However, even with a small sample size, the
map patterns of metal concentrations in geochemistry of mineralized veins zoning are
consistent with that of the nearby Mineral Park porphyry copper deposit (Lang and Eastoe,
1988). Cu and Mo are spatially related, occurring in elevated values in the same veins. Cu and
Mo occur in greatest abundance south of the Can-Cal area in Devil’s Canyon and the Wikieup
Queen area. The Cu-Mo centers represent the hottest part of a typical porphyry hydrothermal
system.
Enriched Se values form a clear anomaly at Wikieup Queen, where values are an order
of magnitude greater than the rest of the Wikieup study area. The presence of elevated Se
values is consistent with other porphyry systems (Cohen, 2012), where they indicate an ore zone
at depth.
Pb, Zn, Au, Ag, As, and Sb are found in polymetallic veins in the center of the Can-Cal
area and north of a potential porphyry center at Devil’s Canyon and/or Wikieup Queen. These

40
veins may represent distal, cooler regions of the hydrothermal system, similar to Mineral Park
(Figure 3).
Mn is found in a narrow northwest trending belt north of Devil’s Canyon. Further
sampling from the area may result in identification of a Mn halo encircling the Mo-anomaly at
Devil’s Canyon, similar to that identified at Mineral Park (Lang and Eastoe, 1988).
The northern Can-Cal area contains barren quartz veins that are not elevated in
indicator metals. These veins may be unrelated to the polymetallic veins or they represent the
coolest part of the hydrothermal system furthest from the heat source.
Bi and Te anomalies are found above some porphyry systems (Cohen, 2012). In the
Wikieup study area, these metals do not show any clear patterns; however, this may be resolved
with further sampling.

41
CHAPTER 5
FLUID INCLUSION PETROGRAPHY
Visible fluid inclusions occur within seven mineralized quartz vein samples. No
inclusions of primary origin were identified, and most fluid inclusions were less than 10 um in
length. All fluid inclusions observed were of secondary or unknown origin. Five types of fluid
inclusions were identified and classified based on phase present (Figure 25) and counted. Figure
26 shows the relative distribution of each fluid inclusion assemblage across the Wikieup study
area. No CO2-bearing phases were found in any fluid inclusions.
Type I
Type I fluid inclusions are two-phase, liquid + vapor, liquid-rich inclusions. The vapor
bubble in these inclusions occupies >30 volume % of the inclusion. Type I fluid inclusions are
present in all analyzed samples.
Type IA fluid inclusions are a subset of type I fluid inclusions. These inclusions are less
than 10 µm and approach a negative crystal shape. Type IA inclusions commonly occur along
fracture planes, suggesting a secondary origin. These inclusions occur in nearly every analyzed
sample with the exception of one sample from Devil’s Canyon.
Type IB fluid inclusions are a subset of Type I inclusions that are larger than other Type I
inclusions and they have a highly irregular shape. These inclusions are thin and elongate,
typically 12-25 µm in length. These inclusions are found only in the central Can-Cal area.

42
Type II
Type II fluid inclusions are three-phase, liquid + vapor + opaque daughter inclusions.
These inclusions are liquid rich, with a vapor bubble < 30 volume % of the inclusion. Type II
inclusions are less than 12 µm in length and semi-regularly shaped. The opaque daughter
crystal is triangular in shape. These inclusions are found only in veins from Wikieup Queen.
Type III
Type III fluid inclusions are two-phase, liquid plus vapor and vapor-rich, with a vapor
bubble occupying 60-70 volume % of the inclusion. These fluid inclusions are 8 – 20 µm in
diameter. Type III inclusions occur in the quartz veins from Devil’s Canyon and Wikieup Queen.
Type IV
Type IV inclusions are > 3-phase liquid plus vapor inclusions that contain a daughter salt
crystal, with a vapor bubble that occupies < 50 volume % of the inclusion. Type IV fluid
inclusions locally contain a triangular-shaped opaque daughter crystal. These inclusions are
present in the polymetallic quartz veins of Devil’s Canyon and Wikieup Queen. These inclusions
are commonly spatially associated with type III vapor-rich inclusions.
Fluid Inclusion Petrography Interpretations
Fluid inclusions in the study area exhibit a zoning pattern that can help vector towards a
potential porphyry copper deposit. Figure 26 shows that the distribution of fluid inclusions
across the study area is not random, and different zones of the study area are characterized by
different types of fluid inclusions. Type I inclusions dominate the Can-Cal area, while type III and

43
type IV inclusions are predominately in Devil’s Canyon. Wikieup Queen is characterized by the
presence of type II opaque daughter-bearing inclusions as well as type I and some type III and
type IV inclusions.
Type I two-phase, liquid-vapor fluid inclusions in samples collected from Can-Cal’s claim
block likely trapped relatively low-temperature, low-salinity aqueous fluids that were not
boiling. These inclusions may be unrelated to a porphyry system due to the liquid-vapor ratio
and the lack of halite or other daughter crystals. Type IA inclusions, owing to their negative
crystal shape, were probably trapped at somewhat higher temperatures than type IB inclusions,
which have a highly irregular form.
Type IV inclusions from the Wikieup Queen area (Figure 26) that contain halite and an
opaque daughter crystal trapped a more saline, metal-bearing fluid. The opaque daughter
crystal in type II inclusions is interpreted to be chalcopyrite based on its shape and the location
of the veins within a Cu anomaly. The presence of opaque daughter crystals suggests these
fluids, when trapped, were transporting metals including copper. These fluids are consistent
with those found at moderate to significant depths within porphyry systems, generally below
the boiling horizon. These fluid inclusions are consistent with a fluid source from depth,
potentially related to a porphyry system. The presence of coexisting liquid-rich an vapor-rich
inclusions indicates that boiling occurred below the sampling level in the system and may have
contributed to the copper mineralization in this area.
Mineralized veins from Devil’s Canyon contain the greatest concentration of coexisting
type III vapor-rich and type IV halite-bearing inclusions. These inclusions indicate that the fluids
were saline and undergoing immiscibility, indicating that processes responsible for metal
transport and deposition in porphyry systems occurred near this locality. The presence of
44
immiscible fluids is consistent with the presence of a porphyry-style boiling horizon at or below
the elevation of the samples. Boiling and related mineral deposition occur at pressure-
temperature conditions at which the single-phase hydrothermal fluid is no longer stable and the
fluid separates into vapor and brine; boiling can continue as the fluids rise to the surface. The
presence of fluid inclusions representing immiscibility at Devil’s Canyon may be related to a
zone of porphyry-style mineralization in this general region.

45
CHAPTER 6
REMOTE SENSING
ASTER satellite imagery was obtained from the public domain and used to create false-
color maps of both the Mineral Park and the Wikieup study areas. These images make it
possible to see large-scale geologic structures not visible on the surface due to size and the
infrared reflectance, and also large-scale zoning of hydrothermal alteration minerals.
Mineral Park – Visual-Near Infrared
Figure 27 was prepared using level 1B ASTER data. This image shows the Mineral Park
porphyry copper deposit and the surrounding Wallapai Mining District in visible-near infrared
light. The Mineral Park mine is the white smiley face in the center of the image. The bright
white represents abundant very fine clay-sized particles of clay minerals related to mining
operations. The black pixels in the center of the mine represent water. Red in this image
corresponds to vegetation. The contact between the Cerbat Mountains and alluvium to the
west is easy to interpret due to the smoother texture of the alluvium in the valley. Faint red
trails from vegetation show that the alluvium drains to the southwest near the mountains, but
trends to the south with increasing distance from the mountains.
Mineral Park – Shortwave Infrared
Figure 28 shows the Wallapai Mining District in shortwave infrared light. This image was
created by applying bandmath to combine bands 4/5, 4/6, and 4/7 into a RGB image in order to

46
investigate the presence of clay alteration minerals within the area. These bands highlight
absorption features at 2.16 µm, 2.2 µm, and 2.26 µm, respectively. The most strongly clay
altered areas appear white in this image. This image has a lower resolution than the previous
image, but the amount of structural and alteration information is significantly greater. A large
part of the area surrounding the mine is white, illustrating a broad zone of hydrothermal
alteration.
This map includes a number of linear features as well. South of the mine these features
trend northwest and north towards the mine. These features are interpreted as the northwest
trending porphyry dikes and north trending rhyolite dikes of the Wallapai Mining District
mapped by Dings (1951) (Figure 2). The dikes are white because they contain abundant in AlOH
and FeOH minerals as a result of hydrothermal alteration of Al- and Fe-bearing minerals.
Wikieup Study Area – Visual-Near Infrared
Figure 29 was created by combining ASTER bands 3-2-1 and shows the Wikieup study
area in visible-near infrared light, similar to the image of Mineral Park in Figure 27. This image is
a close representation of what the area looks like in true visual colors, with the exception of
vegetation, which is red. Not much geologic information can be interpreted from this image,
with the exception of the two white rhyolite dikes. These dikes are visible as north trending
white linear features located west of and in the middle of the Can-Cal area. Other intrusions are
not apparent in this image.

47
Wikieup Study Area – Shortwave Infrared
Figure 30 was created by combining ASTER bands 4/5-4/6-4/7 and shows the Wikieup
study area in shortwave infrared light, similar to the image of Mineral Park in Figure 28. The
Precambrian rocks are brownish-black, and alluvium is greenish-tan. White in this image
represents the presence of AlOH and FeOH minerals, which are found in the Can-Cal area and
which can be used to identify the white rhyolite and quartz monzonite porphyry dikes.
Individual dikes can be followed for several miles in this image. The presence of AlOH and FeOH
minerals increases to the south of the Can-Cal area. Devil’s Canyon, Bronco Wash, and Wikieup
Queen are zones of abundant AlOH and FeOH mineralization.
Wikieup – SWIR Classified Image
Figure 31 is a color-classified image based on Figure 30, manipulated in order to
highlight the whitest pixels of the image. In this image, red corresponds to the highest
concentration of AlOH and FeOH minerals. Areas of lesser AlOH and FeOH minerals are green,
and areas of no AlOH and FeOH minerals are blue. This image more clearly shows the increase
in AlOH and FeOH minerals to the south of the Can-Cal area. Linear structures leading from
Devil’s Canyon, the Can-Cal area, and Wikieup Queen to Bronco Wash are also revealed. The
red feature in the northeast corner of the image is the Big Sandy River.
Remote Sensing Interpretations
In SWIR, the Wikieup study area displays many similar traits to the Wallapai Mining
District that encompasses the Mineral Park deposit. The combination of bands used to create
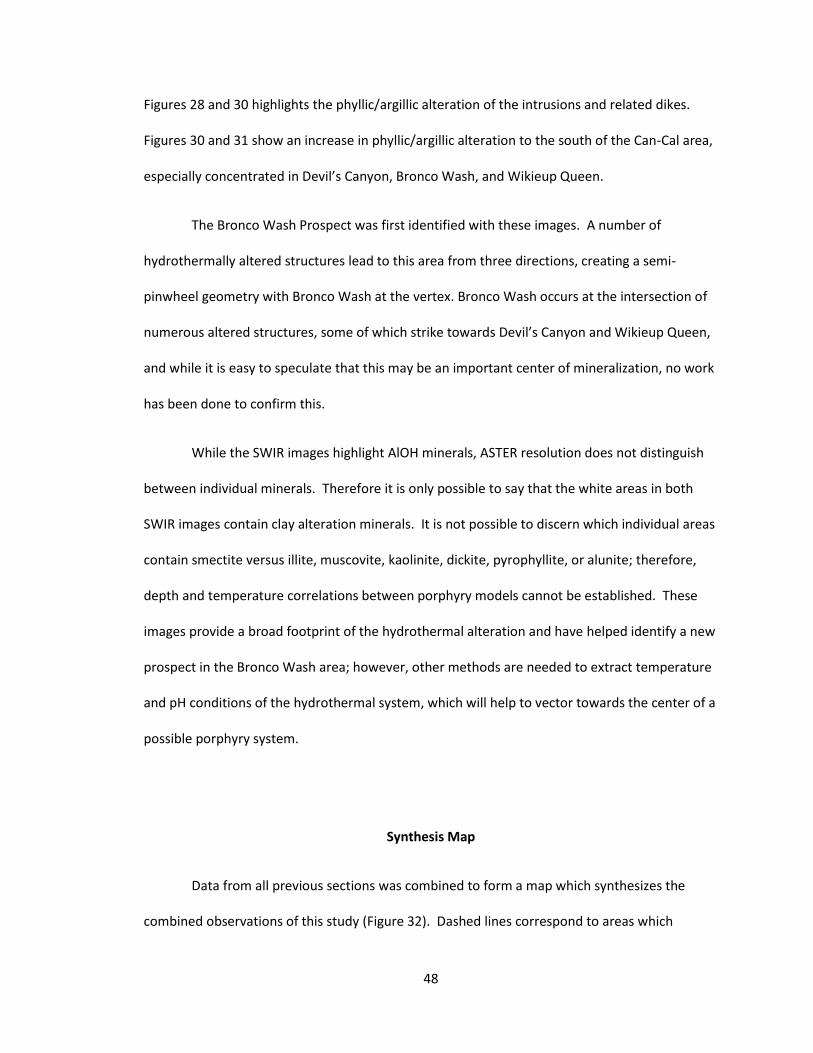
48
Figures 28 and 30 highlights the phyllic/argillic alteration of the intrusions and related dikes.
Figures 30 and 31 show an increase in phyllic/argillic alteration to the south of the Can-Cal area,
especially concentrated in Devil’s Canyon, Bronco Wash, and Wikieup Queen.
The Bronco Wash Prospect was first identified with these images. A number of
hydrothermally altered structures lead to this area from three directions, creating a semi-
pinwheel geometry with Bronco Wash at the vertex. Bronco Wash occurs at the intersection of
numerous altered structures, some of which strike towards Devil’s Canyon and Wikieup Queen,
and while it is easy to speculate that this may be an important center of mineralization, no work
has been done to confirm this.
While the SWIR images highlight AlOH minerals, ASTER resolution does not distinguish
between individual minerals. Therefore it is only possible to say that the white areas in both
SWIR images contain clay alteration minerals. It is not possible to discern which individual areas
contain smectite versus illite, muscovite, kaolinite, dickite, pyrophyllite, or alunite; therefore,
depth and temperature correlations between porphyry models cannot be established. These
images provide a broad footprint of the hydrothermal alteration and have helped identify a new
prospect in the Bronco Wash area; however, other methods are needed to extract temperature
and pH conditions of the hydrothermal system, which will help to vector towards the center of a
possible porphyry system.
Synthesis Map
Data from all previous sections was combined to form a map which synthesizes the
combined observations of this study (Figure 32). Dashed lines correspond to areas which

49
indicate the presence of hydrothermal conditions consistent with porphyry-style mineralization
from each data set. From an exploration standpoint, the most interesting areas are where a
number of these zones overlap. The convergence of geochemical, remote sensing, vein type,
and white mica data make the southwest corner of the Can-Cal area promising; however, the
lack of potassic alteration and coexisting multiphase fluid inclusions makes the areas to the
south more interesting.Devil’s Canyon and Wikieup Queen both contain the appropriate
alteration, fluid inclusions, geochemistry, vein type, and remote sensing data to indicate a
nearby porphyry center.

50
CHAPTER 7
CONCLUSIONS
Can-Cal Area
Results from this study indicate that Can-Cal’s claims coincide with a possible
polymetallic vein system distal to porphyry copper mineralization. The claim block is not likely
to contain a near-surface porphyry copper deposit.
Quartz veins from Can-Cal’s claims are low in Mo, which occurs at the hot center of
porphyry copper deposits. Most quartz veins in the claim block are also low in copper, with the
exception of one sample from the southwest area near Devil’s Canyon. The veins on the Can-Cal
claims instead contain elevated levels of Pb, Zn, Ag, and Au, which typically exist in the cooler,
more distal parts of a porphyry system. A northwest-trending belt of high Mn values cuts across
the southwestern claims, and may be part of a halo related to mineralization at Devil’s Canyon.
Whole rock geochemistry of the quartz monzonite porphyry from Can-Cal’s claims
support the interpretation that the area does not contain porphyry copper mineralization
because no samples collected from the area are potassically altered. Whole rock samples also
do not contain the most elevated concentrations of Cu and Mo. Instead, analyses indicate
elevated values of some base and precious metals in samples from the Can-Cal claim block,
possibly reflecting a distal part of a porphyry system.
Two-phase, liquid-rich fluid inclusions in quartz in Can-Cal’s claims support the
interpretation of an area of relatively low temperature base or precious metal mineralization
rather than Cu-Mo mineralization. The fluid inclusions show that the hydrothermal fluids in
Can-Cal’s claims were relatively low temperature, low salinity, and did not contain high
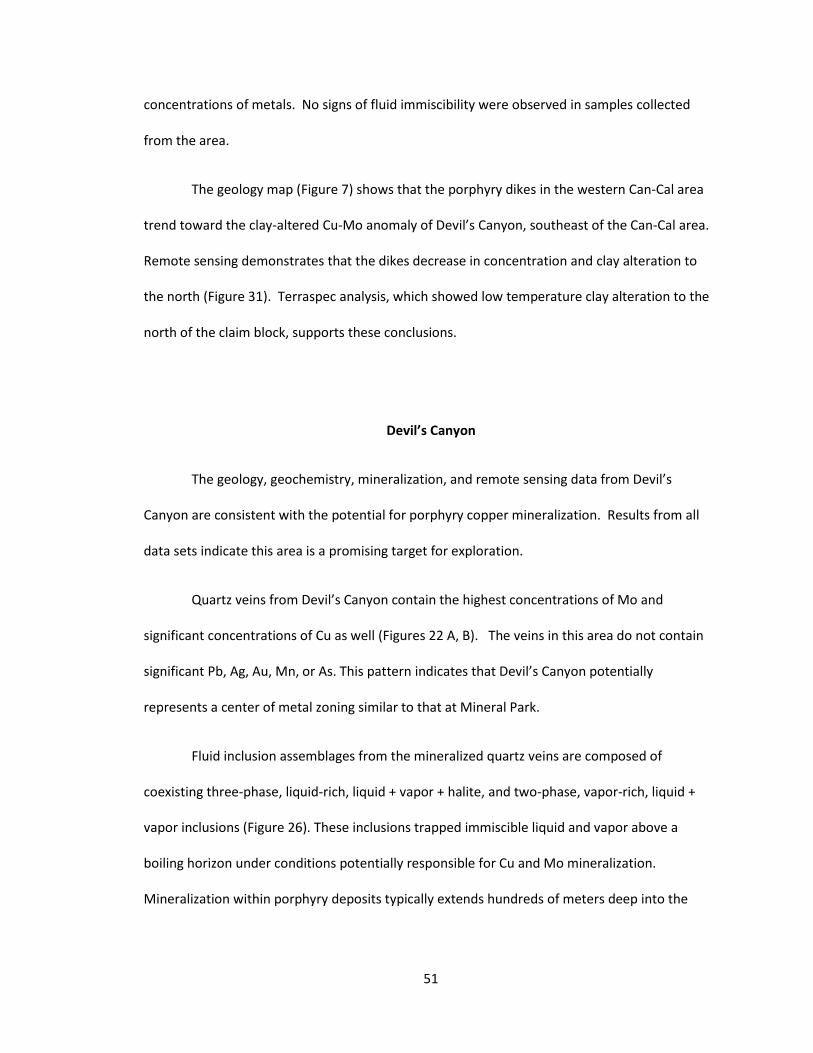
51
concentrations of metals. No signs of fluid immiscibility were observed in samples collected
from the area.
The geology map (Figure 7) shows that the porphyry dikes in the western Can-Cal area
trend toward the clay-altered Cu-Mo anomaly of Devil’s Canyon, southeast of the Can-Cal area.
Remote sensing demonstrates that the dikes decrease in concentration and clay alteration to
the north (Figure 31). Terraspec analysis, which showed low temperature clay alteration to the
north of the claim block, supports these conclusions.
Devil’s Canyon
The geology, geochemistry, mineralization, and remote sensing data from Devil’s
Canyon are consistent with the potential for porphyry copper mineralization. Results from all
data sets indicate this area is a promising target for exploration.
Quartz veins from Devil’s Canyon contain the highest concentrations of Mo and
significant concentrations of Cu as well (Figures 22 A, B). The veins in this area do not contain
significant Pb, Ag, Au, Mn, or As. This pattern indicates that Devil’s Canyon potentially
represents a center of metal zoning similar to that at Mineral Park.
Fluid inclusion assemblages from the mineralized quartz veins are composed of
coexisting three-phase, liquid-rich, liquid + vapor + halite, and two-phase, vapor-rich, liquid +
vapor inclusions (Figure 26). These inclusions trapped immiscible liquid and vapor above a
boiling horizon under conditions potentially responsible for Cu and Mo mineralization.
Mineralization within porphyry deposits typically extends hundreds of meters deep into the

52
boiling zone, which means there is potential for Devil’s Canyon to contain significant Cu and Mo
mineralization.
Remote sensing data show that Devil’s Canyon is one of three zones exhibiting the
strongest clay alteration (Figures 30, 31) identified in this study. Alteration at Devil’s Canyon
contains a greater abundance of Al-OH minerals, such as illite and kaolinite, than the area
including the Can-Cal claims to the north. Devil’s Canyon exhibits pervasive clay alteration,
consistent with the tops of porphyry centers.
Terraspec analysis further supports the interpretation that Devil’s Canyon is potentially
associated with porphyry copper mineralization. Hydrothermally altered clay minerals from the
area include kaolinite and paragonite. These minerals form under acidic conditions, such as
those related to the formation of porphyry copper mineralization. Kaolinite is a low temperature
mineral, but it may be the result of oxidation of pyrite, indicating the presence of sulfide
mineralization within the area.
Wikieup Queen
Wikieup Queen is interpreted as a potential center of porphyry copper mineralization.
This area exhibits a broad footprint of elevated Mo and significant Cu as well (Figures 22 A, B).
The veins do not contain significant Pb, Ag, Au, or Mn and this area has a metal zoning pattern
similar to that surrounding Mineral Park.
Fluid inclusion assemblages from the Wikieup Queen area (Figure 26) support this
interpretation. Coexisting three-phase, liquid-rich, liquid + vapor + halite, and two-phase, vapor-
rich inclusions representing fluid immiscibility are found in mineralized quartz. The presence of

53
three-phase, liquid-rich, liquid + vapor + opaque daughter crystal inclusions indicates these
fluids transported metals, consistent with a magmatic fluid source. The Wikieup Queen area
may represent a somewhat deeper zone than Devil’s Canyon, a separate center, or may be
related to Devil’s Canyon.
Remote sensing shows that Wikieup Queen is an area of intense hydrothermal clay
alteration (Figures 30 and 31). AlOH minerals are abundant up to 1.5 miles from the center of
the area suggesting the former presence of a large hydrothermal system. Terraspec analysis
further indicates the presence of highly crystalline illite as well as muscovite and kaolinite
(Figures 14 and 15). Muscovite forms from hot hydrothermal fluids and kaolinite forms from
acidic hydrothermal fluids. Such broad, intense clay alteration is consistent with porphyry
copper mineralization.
While mineralized quartz veins, fluid inclusion assemblages, remote sensing, and
Terraspec analysis support the conclusion that the Wikieup Queen area is consistent with
porphyry copper-style mineralization, the most important information comes from surface
geology and whole rock analysis. The Wikieup Queen exhibits potassic alteration, found both in
outcrop (Figure 13) and through whole rock geochemistry (Figure 12). Potassic alteration results
from fluid-rock reaction of high temperature hydrothermal fluids that transported metals and is
commonly found within the centers of porphyry systems.
Bronco Wash
The Bronco Wash area is located ~1.5 miles south of Can-Cal’s southeastern claims. This
area was discovered by remote sensing after the conclusion of field activities. Therefore, no

54
geology, geochemistry, fluid inclusion, or Terraspec data are available for this area. However,
the area contains ample hydrothermal clay alteration (Figures 30 and 31), and therefore
warrants further study.
Bronco Wash is at the intersection of several clay-altered structures that trend west,
northwest (toward Devil’s Canyon), north, northeast, and east (toward Wikieup Queen).
Intersected structures can produce areas of focused fluid flow and mineralization. The fact that
this area is a center of a several radiating, clay-altered structures means that this area is a
promising prospect in the Wikieup district.
Recommendations
The southern Hualapai Mountains contain many geologic features consistent with the
presence of porphyry copper mineralization. Further mapping and geochemical sampling is
needed in order to delineate the Cu-Mo anomalies and investigate Bronco Wash. Clay minerals
should be sampled from all altered units, and areas of high-acid minerals including pyrophyllite
and dickite should be the focus of increased efforts.
After or concurrent with additional surface geology and geochemistry, geophysical
techniques may be used to investigate the subsurface. Resistivity, gravity, induced polarization
and aeromagnetic surveys could be conducted to further gauge the subsurface potential for
mineralization.
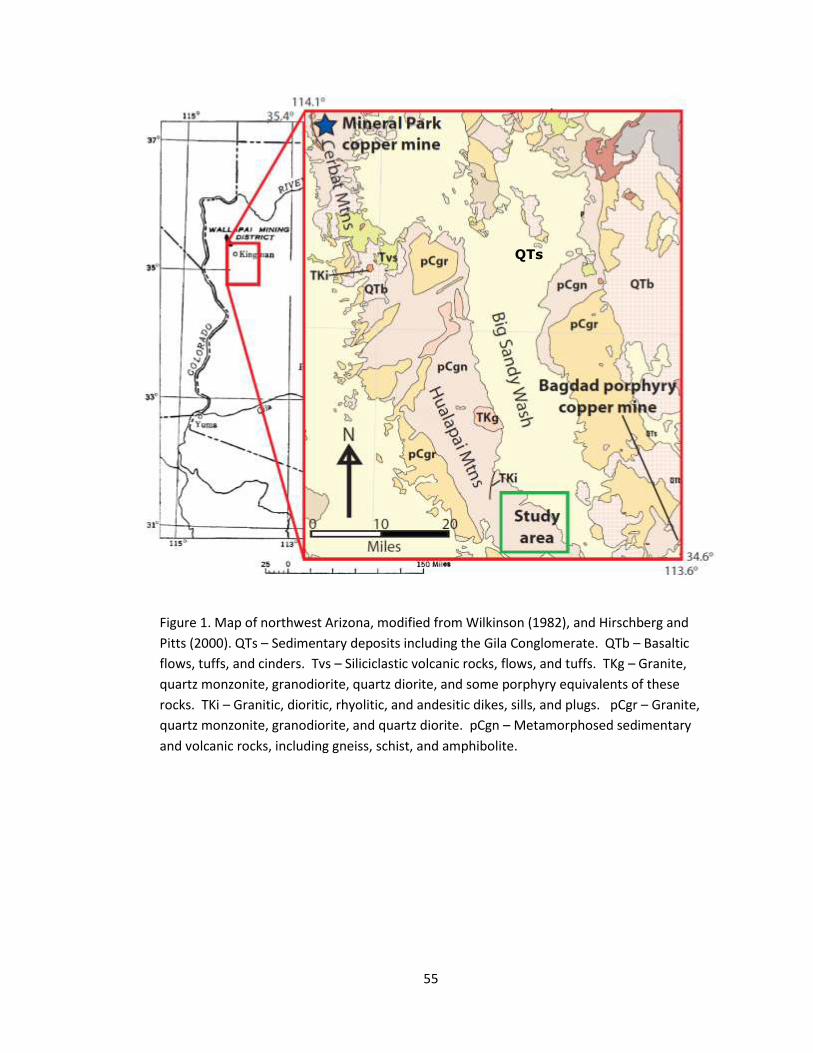
55
Figure 1. Map of northwest Arizona, modified from Wilkinson (1982), and Hirschberg and
Pitts (2000). QTs – Sedimentary deposits including the Gila Conglomerate. QTb – Basaltic
flows, tuffs, and cinders. Tvs – Siliciclastic volcanic rocks, flows, and tuffs. TKg – Granite,
quartz monzonite, granodiorite, quartz diorite, and some porphyry equivalents of these
rocks. TKi – Granitic, dioritic, rhyolitic, and andesitic dikes, sills, and plugs. pCgr – Granite,
quartz monzonite, granodiorite, and quartz diorite. pCgn – Metamorphosed sedimentary
and volcanic rocks, including gneiss, schist, and amphibolite.
QTs

56
Figure 2. Geology of the Wallapai Mining District, from Dings (1951). The Mineral
Park Mine is in the southeast in an area originally covered by alluvium and the Ithaca
Peak Stock. Note the mineralized veins trending toward the mine.
Rocks

57
Figure 3. Metal zoning in the Wallapai Mining District. The Ithaca Peak Stocks are located in the
center of the district within the Cu-Mo zone and surrounded by a Mn halo and the Cu zone. The
Pb-Zn and As zones are further away from the stocks, and the Ag-Au zones are most distal.
Adapted from Lang and Eastoe (1988).
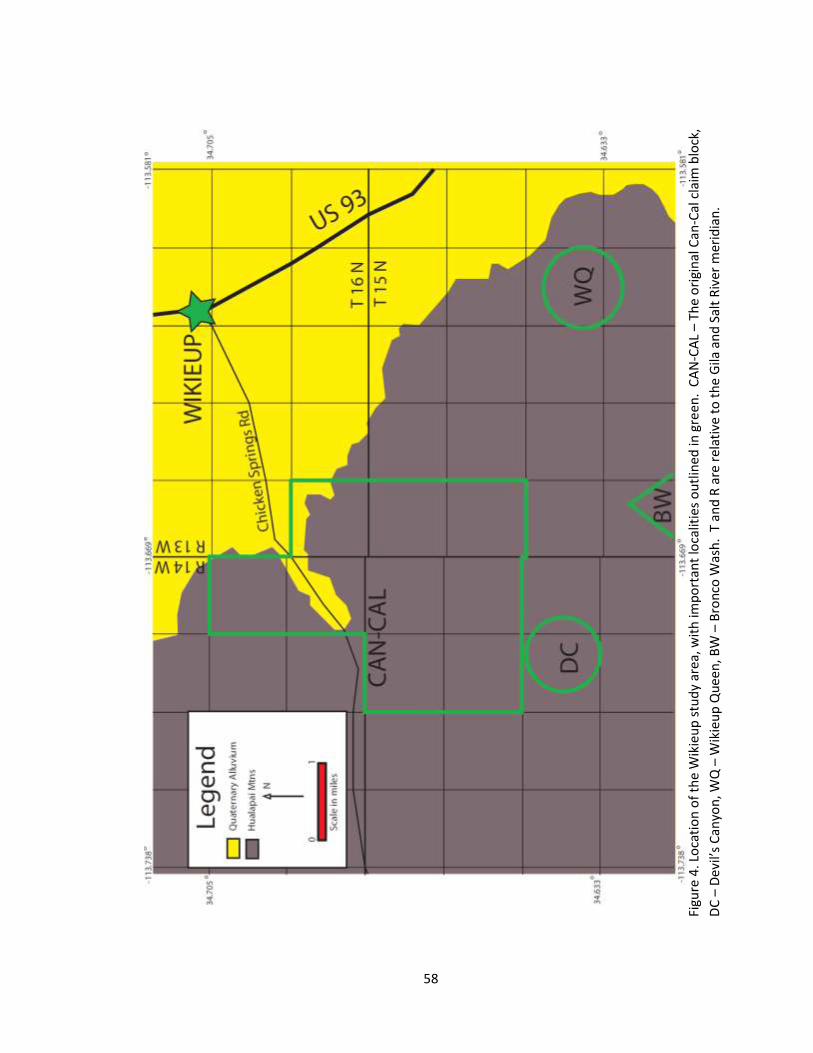
58
Figu
re 4
. Lo
cati
on
of
the
Wik
ieu
p s
tud
y ar
ea, w
ith
imp
ort
ant
loca
litie
s o
utl
ined
in g
reen
. C
AN
-CA
L –
Th
e o
rigi
nal
Can
-Cal
cla
im b
lock
,
DC
– D
evil’
s C
anyo
n, W
Q –
Wik
ieu
p Q
uee
n, B
W –
Bro
nco
Was
h.
T an
d R
are
rel
ativ
e to
th
e G
ila a
nd
Sal
t R
iver
mer
idia
n.

59
Figure 5. Shortwave infrared spectra of white mica minerals. The vertical axis reflectance,
measured from 0 (complete absorption) to 1 (complete reflectance). Note the difference in
relative depth of the water feature at 1900 nm and the AlOH feature at ~2200 nm. These two
features are characteristic of white micas. By measuring the absorption of these two features
we can determine the approximate temperature of the hydrothermal fluid that precipitated the
mineral. Smectite forms under cool conditions, and features a much deeper water absorption
feature than AlOH feature. Illite forms under warm conditions, and features a similar absorption
depth for water and AlOH. Muscovite forms under hot conditions, and features a deeper
absorption feature for AlOH than water.
0
0
0
1
1 1

60
Figure 6. Shortwave infrared spectra of white micas of different compositions. The vertical axis
reflectance, measured from 0 (complete absorption) to 1 (complete reflectance). Note the
difference in the wavelength of the AlOH feature (~2208 nm), which changes with the mineral
composition. The difference in composition is related to the pH of the altering fluid. Muscovite
forms under neutral conditions and has an AlOH feature with a minimum wavelength at 2208
nm. Phengite forms under alkaline conditions and has an AlOH feature with a minimum
wavelength greater than 2212 nm. Paragonite forms under acidic conditions and has an AlOH
feature with a minimum wavelength less than 2203 nm.

61
Figu
re 7
. G
eolo
gy o
f th
e W
ikie
up
stu
dy
area
. D
C –
Dev
il’s
Can
yon
. W
Q –
Wik
ieu
p Q
uee
n.
BW
– B
ron
co W
ash
.

62
Figure 8. Primary lithogies of the Wikieup study area. A. Precambrian granite. Sample XGR-01.
B. Precambrian schist. Sample XGR-02. C. Quartz-feldspar pegmatite. Sample 3.05.002.
D. Aplite dike. Sample 3.04.001. E. White rhyolite dike. Sample 3.02.001. F. Quartz monzonite
porphyry. Sample 7.01.011.

63
Figure 9. Photomicrograph of white rhyolite under crossed polarized light. Note the presence of
white mica and biotite that cannot be seen in hand sample. Sample 3.02.001.

64
Figure 10. Wikieup area breccias. A. Heavily clay-altered breccia from the southwest Can-Cal
area. Sample GWM-BR. B. Silicified polylithic breccia from Devil’s Canyon. Sample 6.01.BR01.

65
Figure 11. A. Cu distribution of quartz monzonite porphyry. The highest grade sample of Cu is in
Wikieup Queen, which has a Cu concentration more than ten times higher than found elsewhere
in the study area.

66
Figure 11. B. Mo distribution of quartz monzonite porphyry. The two highest-grade samples are
from Wikieup Queen. Mo values are low across the Can-Cal area.

67
Figure 11. C. Pb distribution of quartz monzonite porphyry. There is not a great range in Pb
values, however, the highest-grade samples are from the northwest corner of the Can-Cal area
and the northern edge of Devil’s Canyon. Wikieup Queen contains relatively low Pb values.

68
Figure 11. D. Zn distribution of quartz monzonite porphyry. The highest grade Zn samples are
found in the southeast corner of the study area, and values decrease moving northwest.

69
Figure 11. E. Ag distribution of quartz monzonite porphyry. The highest grade Ag samples are
found in the southeast corner of the study area.

70
Figure 11. F. Mn distribution of quartz monzonite porphyry. The highest grade Mn values are
found in Wikieup Queen, while the Can-Cal area contains slightly lower values of Mn.

71
Figure 11. G. As distribution of quartz monzonite porphyry. As values are highest in the western
Can-Cal area. As values are lower in Devil’s Canyon and Wikieup Queen.

72
Figure 11. H. Sb distribution of quartz monzonite porphyry. There is not a great range in Sb
values across the study area, however, the highest grade sample is from the south central Can-
Cal area.

73
Figure 11. I. Bi distribution of quartz monzonite porphyry. Bi values are low in the western part
of the study area and higher in the central and western parts of the study area. The highest
grade sample is from Wikieup Queen.

74
Figure 12. Trace element geochemistry of porphyry systems of Arizona. Data for barren,
subproductive, and productive systems are from Lang and Titley (1998). A. High-field strength
elements versus yttrium. Note that the Wikieup samples plot closer to productive systems than
unproductive systems. B. Manganese versus yttrium. The Wikieup samples clearly plot
alongside productive porphyry systems.
B.
A.
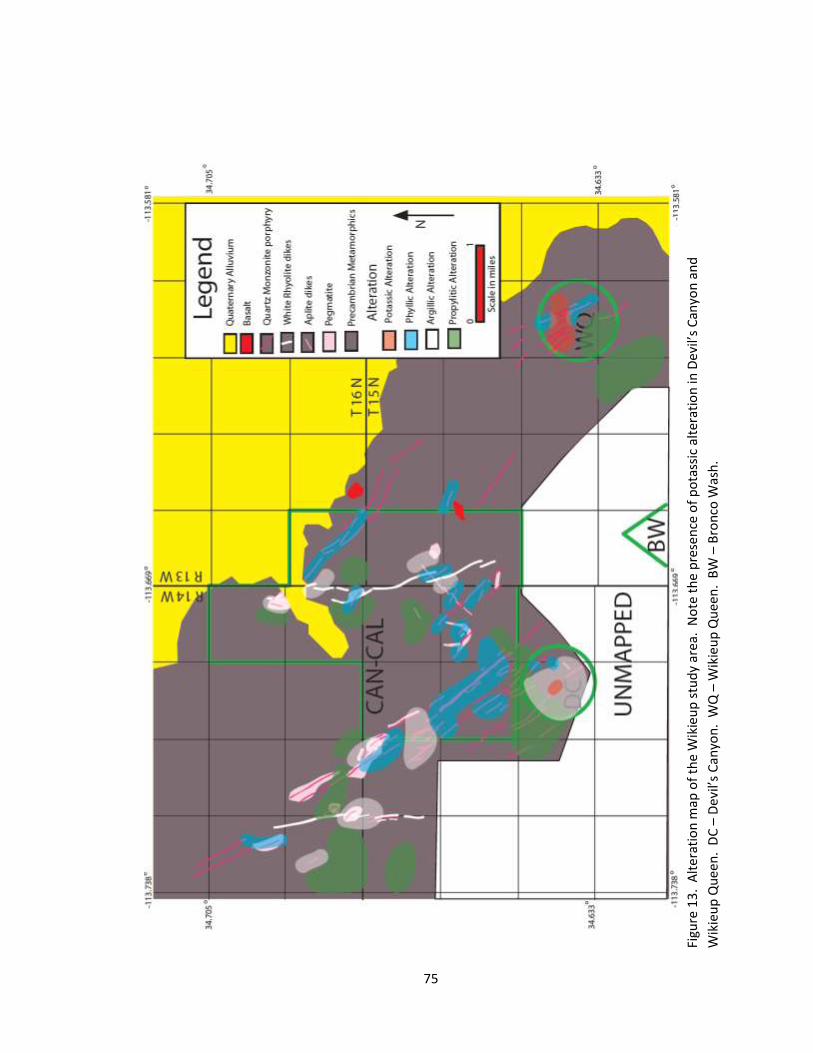
75
Figu
re 1
3.
Alt
era
tio
n m
ap o
f th
e W
ikie
up
stu
dy
area
. N
ote
th
e p
rese
nce
of
po
tass
ic a
lter
atio
n in
Dev
il’s
Can
yon
an
d
Wik
ieu
p Q
uee
n.
DC
– D
evil’
s C
anyo
n.
WQ
– W
ikie
up
Qu
een
. B
W –
Bro
nco
Was
h.

76
Figure 14. Primary clay and mineral distribution from spectroscopic measurements. The
majority of primary clays observed are illite. Muscovite occurs in the south central Can-Cal area
and Wikieup Queen. Montmorillonite is scattered across the study area, however, the highest
concentration of the low temperature clay is in the northwest Can-Cal area. Kaolinite is the
dominant mineral in only one sample, which is from northwest of the Can-Cal area.

77
Figure 15. K/Al vs. Na/Al molarity graph of unweathered quartz monzonite porphyry. Note most
samples plot near the Granite – Syenite zones, except for two samples from Wikieup Queen
which plot in the Potassic zone. These two samples have lost Na and gained K as a result of hot
hydrothermal alteration.

78
Figure 16. Alteration in hand sample. A. Pink K-feldspar replacement of quartz monzonite
porphyry matrix at Devil’s Canyon. Sample 6.01.01. B. Secondary K-feldspar alteration of quartz
monzonite porphyry at Wikieup Queen. Sample 1.05.009. C. White illite replacement of
feldspar phenocrysts of quartz monzonite porphyry in the Can-Cal area. Sample 5.03.005. D.
White montmorillonite replacement of feldspar phenocrysts of quartz monzonite porphyry in
the Can-Cal area. Sample 3.04.011. E., F. Propylitic alteration of Precambrian granite with
epidote vein (ep) and chlorite (cl) selvage. Samples 3.02.007 and 6.03.003.

79
Figure 17. Map of white mica crystallinity distribution. Low and medium crystallinity white
micas representing the coolest hydrothermal conditions dominate the western Can-Cal area.
Very high crystallinity white micas representing the hottest hydrothermal conditions occur in
the southern and northeastern Can-Cal areas.

80
Figure 18. Map of white mica composition distribution. The majority of samples analyzed are
muscovitic in composition. Phengitic samples are found in the eastern Can-Cal claim block.
Paragonitic samples are found in Devil’s Canyon and the south, west, and central Can-Cal areas.

81
Figure 19. Propylitic alteration of Precambrian granite. A. Sample 3.02.007. B. Fresh biotite
distal to the vertical epidote vein (ep). C. Partial “tigerstripe” chlorite replacement of biotite
closer to the epidote vein. D. Near complete chloritization of biotite near the epidote vein.

82
Figure 20. Map of kaolinite presence. Kaolinite occurs as a major or minor mineral in the
western Can-Cal area, Devil’s Canyon, and Wikieup Queen.

83
Figure 21. Mineralized vein types. A. Quartz + magnetite (mt) vein with oxidized hematite, from
west Can-Cal area. Sample 2.03.004. B. Quartz vein with hematite staining from west Can-Cal
area. Sample 5.01.006. C. Polymetallic vein with pyrite (py) and galena (gl) from south of the
Can-Cal area. Sample 1.01.001. D. Multigenerational polymetallic vein with euhedral quartz
from central Can-Cal area. Sample 1.04.012. E., F. Massive sulfide vein with sphalerite (sp),
pyrite (py), and quartz (qz), from southwest Can-Cal area. Samples 5.03.011, 5.03.012.

84
Figure 22. Mineralized breccia from Devil’s Canyon. A. Disseminated chalcopyrite and pyrite
with quartz clasts under both reflected and transmitted plane polarized light. B. Pyrite veins
under reflected plane polarized light. Sample 6.01.BR01

85
Figure 23. Map of vein type distribution. The Can-Cal area contains a variety of mineralized
veins. The western Can-Cal area contains predominantly quartz + magnetite veins, while
polymetallic quartz veins dominate south-central Can-Cal area. A massive sulfide vein and a
mineralized breccia are found nearby in the southwest Can-Cal area. Devil’s Canyon contains
polymetallic quartz veins as well as a mineralized breccia. Wikieup Queen contains only
polymetallic veins. No mineralized veins were found in Can-Cal’s northern claims.

86
Figure 24. A. Cu distribution of mineralized veins. Increased concentration is indicated by size
and color. Samples with the highest concentration of Cu are found in Devil’s Canyon and the
southern Can-Cal area. Wikieup Queen also contains elevated concentrations of Cu. Cu
concentrations are low in the central, western, and northern Can-Cal area.

87
Figure 24. B. Mo distribution of mineralized veins. The highest concentration of Mo is found in
samples from Devil’s Canyon and Wikieup Queen. Samples from the Can-Cal area do not
contain elevated concentrations of Mo.

88
Figure 24. C. Pb distribution of mineralized veins. Samples with the highest concentration of Pb
are from the south-central and south eastern Can-Cal area. Wikieup Queen contains one
sample with high Pb. Devil’s Canyon and the western Can-Cal area do not contain elevated
levels of Pb.
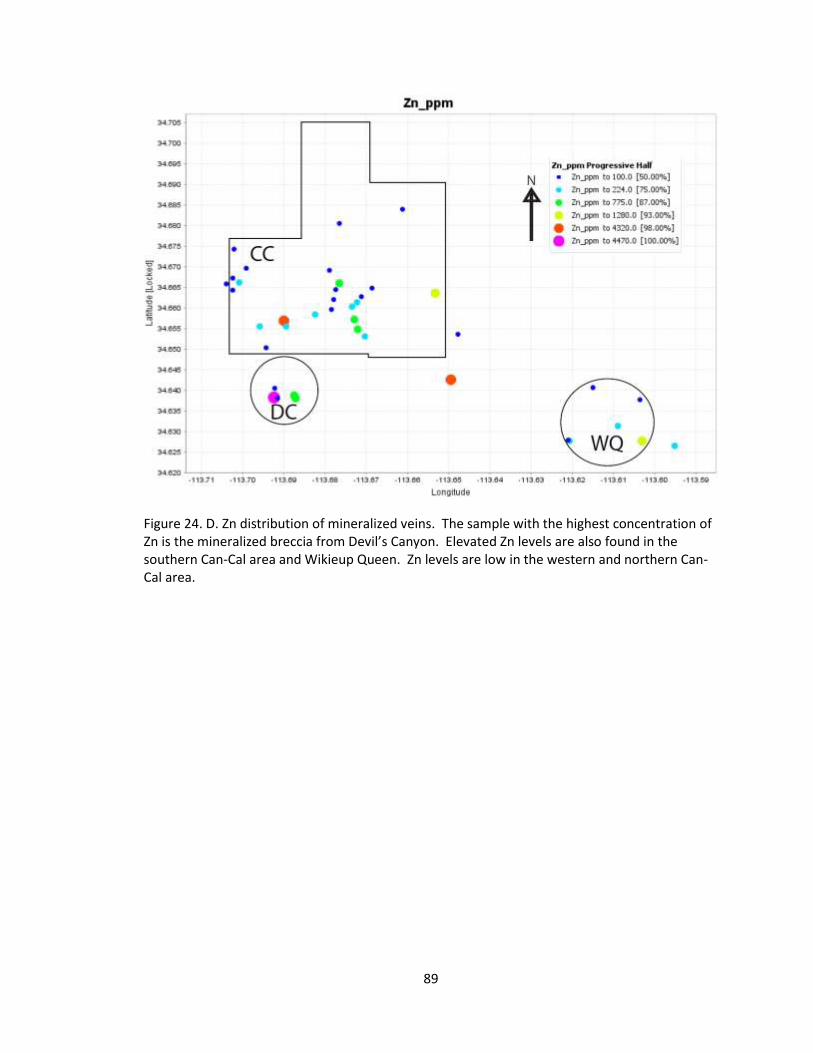
89
Figure 24. D. Zn distribution of mineralized veins. The sample with the highest concentration of Zn is the mineralized breccia from Devil’s Canyon. Elevated Zn levels are also found in the southern Can-Cal area and Wikieup Queen. Zn levels are low in the western and northern Can-Cal area.

90
Figure 24. E. Ag distribution of mineralized veins. Ag concentrations are elevated in the south-
central Can-Cal area. Ag concentrations are low in Wikieup Queen and the western and
northern Can-Cal areas. Devil’s Canyon contains a mixture of low and slightly elevated
concentrations of Ag.

91
Figure 24. F. Au distribution of mineralized veins. Elevated concentrations of Au are found in
the south-central and southeastern Can-Cal area. Low Au concentrations are found in Devil’s
Canyon, Wikieup Queen, and the western Can-Cal area.

92
Figure 24. G. Mn distribution of mineralized veins. Elevated Mn values are found in the western
and south central Can-Cal areas. Low Mn values are found in Devil’s Canyon, Wikieup Queen,
and the eastern Can-Cal area.
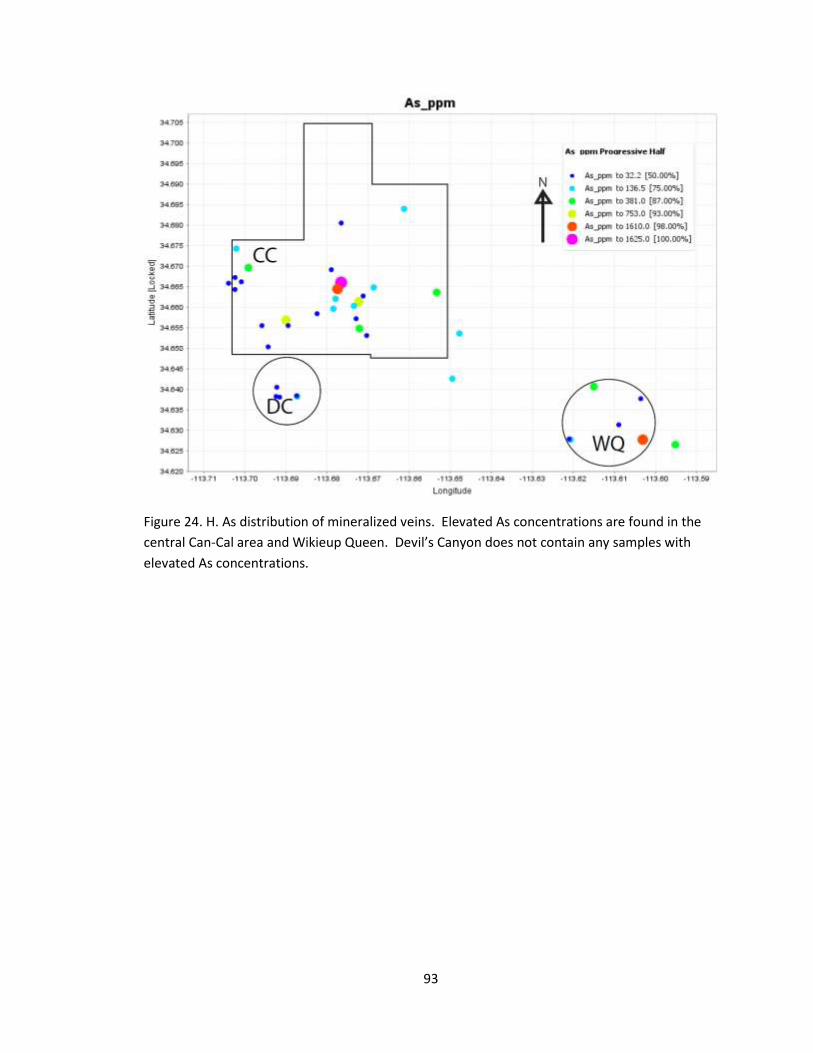
93
Figure 24. H. As distribution of mineralized veins. Elevated As concentrations are found in the
central Can-Cal area and Wikieup Queen. Devil’s Canyon does not contain any samples with
elevated As concentrations.

94
Figure 24. I. Sb distribution of mineralized veins. Samples with elevated Sb values are
concentrated in south-central and eastern Can-Cal area. Devil’s Canyon and Wikieup Queen do
not contain elevated amounts of Sb.
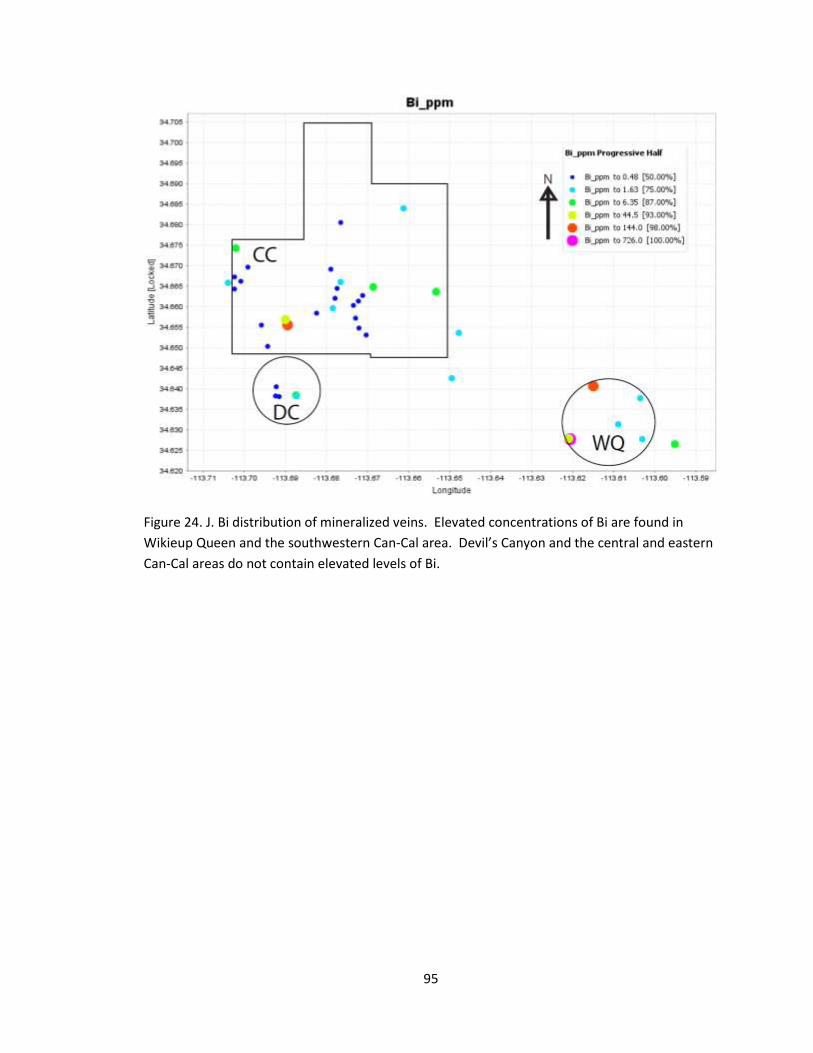
95
Figure 24. J. Bi distribution of mineralized veins. Elevated concentrations of Bi are found in
Wikieup Queen and the southwestern Can-Cal area. Devil’s Canyon and the central and eastern
Can-Cal areas do not contain elevated levels of Bi.

96
Figure 24. K. Se distribution of mineralized veins. Elevated concentrations of Se are found in
Wikieup Queen. All other areas contain low concentrations of Se relative to Wikieup Queen.

97
Figure 24. L. Te distribution of mineralized veins. Elevated Te concentrations are found in
Wikieup Queen and the southwestern Can-Cal area. Devil’s Canyon and the central and eastern
Can-Cal areas do not contain elevated levels of Te.

98
Figure 25. Photomicrographs of fluid inclusion assemblages. A. Two-phase, liquid-rich type I
inclusions. B. Type IA inclusions with a negative crystal shape. C. Type IB irregular-shaped
inclusions from Can-Cal area. D. Type II inclusion with triangular opaque from Wikieup Queen.
E. Coexisting type III vapor-rich and type IV liquid + vapor + halite inclusions from Devil’s Canyon.
F. Coexisting type III and type IV inclusions from Devil’s Canyon.
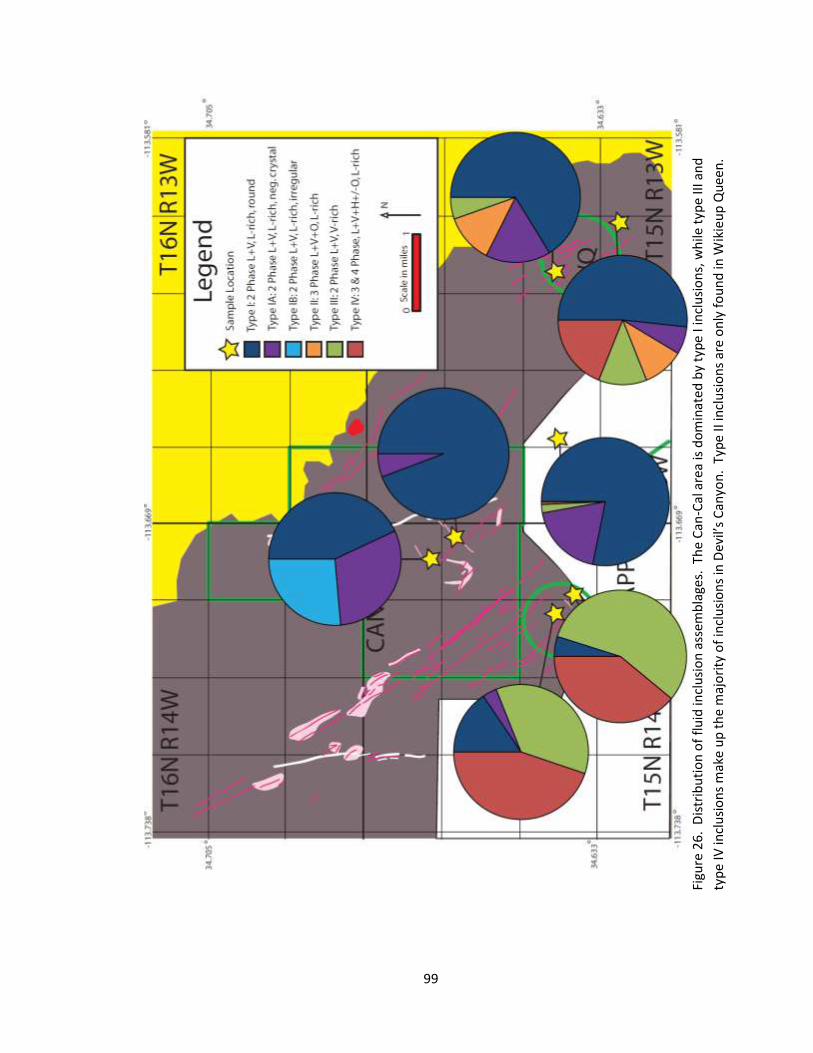
99
Figu
re 2
6.
Dis
trib
uti
on
of
flu
id in
clu
sio
n a
ssem
bla
ges.
Th
e C
an-C
al a
rea
is d
om
inat
ed
by
typ
e I i
ncl
usi
on
s, w
hile
typ
e II
I an
d
typ
e IV
incl
usi
on
s m
ake
up
th
e m
ajo
rity
of
incl
usi
on
s in
Dev
il’s
Can
yon
. Ty
pe
II in
clu
sio
ns
are
on
ly f
ou
nd
in W
ikie
up
Qu
een
.

100
Figure 27. Visual-near infrared image of the Wallapai Mining District. The Mineral Park mine is
the white face in the center of the image, with pools of water creating the black eyes and smile.
The Cerbat Mountains are red where vegetation is most abundant.
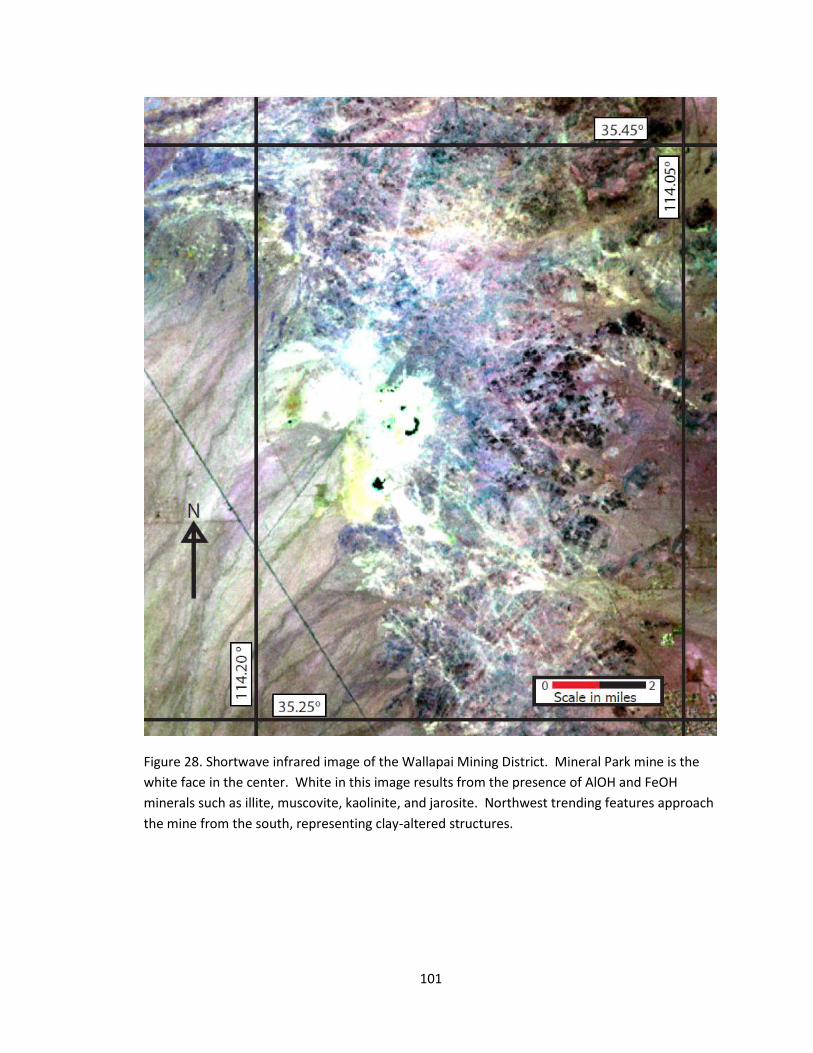
101
Figure 28. Shortwave infrared image of the Wallapai Mining District. Mineral Park mine is the
white face in the center. White in this image results from the presence of AlOH and FeOH
minerals such as illite, muscovite, kaolinite, and jarosite. Northwest trending features approach
the mine from the south, representing clay-altered structures.

102
Figure 29. Visual-near infrared image of the Wikieup study area. The Big Sandy River is the
bright red feature in the northeast corner. The white rhyolite dikes are visible in this image,
however, other geologic details are more faint.

103
Figure 30. Shortwave infrared image of the Wikieup study area. White in this image
corresponds to the presence of clay alteration, and corresponds very well with the rhyolite and
quartz monzonite porphyry dikes mapped earlier. Clay alteration increases south of the Can-Cal
area, and is strongest in Devil’s Canyon, Bronco Wash, and Wikieup Queen.

104
Figure 31. Color classified image of the Wikieup study area. Blue represents no clay alteration,
green represents light alteration, and red represents areas of most abundant clay alteration.
Bronco Wash is at the intersection of several clay-altered structures, which trend toward the
area from Devil’s Canyon, the Can-Cal area, and Wikieup Queen.

105
Figure 32. Synthesis map. This map incorporates all of the data sets from this study. Dashed,
colored lines represent zones of prospective porphyry mineralization from each method. The
broadest region in red which encompasses most of the area south of Can-Cal’s claims
corresponds to clays discovered by processing of ASTER data. The small zones in yellow
correspond to where fluid inclusions indicate immiscibility. The green zones show where metals
indicate the center of a porphyry system may be. Polymetallic quartz veins and mineralized
breccias occur within the areas of light blue dashed lines. White micas formed by the warmest
conditions occur in the areas of dark blue. Areas with high-temperature potassic alteration are
shown in magenta.

106
Sample Type Digestion Analysis Elements Analyzed
Hydrothermal Veins
Aqua Regia ICP-MS Ag, Al, As, Ba, Be, Bi, Ca, Cd, Ce, Co, Cr, Cs, Cu, Fe, Ga, Ge, Hf, In, K, La, Li, Mg, Mn, Mo, Na, Nb, Ni, P, Pb, Rb, Re, S, Sb, Sc, Se, Sn, Sr, Ta, Te, Th, Ti, Tl, U, V, W, Y, Zn, Zr
Hydrothermal Veins Aqua Regia Fire Assay Au
ICP-AES
Whole Rock Four-acid XRF SiO2, Al2O3, Fe2O3, CaO, MgO, Na2O, K2O, Cr2O3, TiO2, MnO, P2O5, SrO, BaO, LOI
Whole Rock Four-acid ICP-MS Ag, Al, As, Ba, Be, Bi, Ca, Cd, Ce, Co, Cr, Cs, Cu, Fe, Ga, Ge, Hf, In, K, La, Li, Mg, Mn, Mo, Na, Nb, Ni, P, Pb, Rb, Re, S, Sb, Sc, Se, Sn, Sr, Ta, Te, Th, Ti, Tl, U, V, W, Y, Zn, Zr
Table 1. Geochemistry methods. Results for hydrothermal veins are tabulated in Appendix D.
Results for whole rock are tabulated in Appendix B.
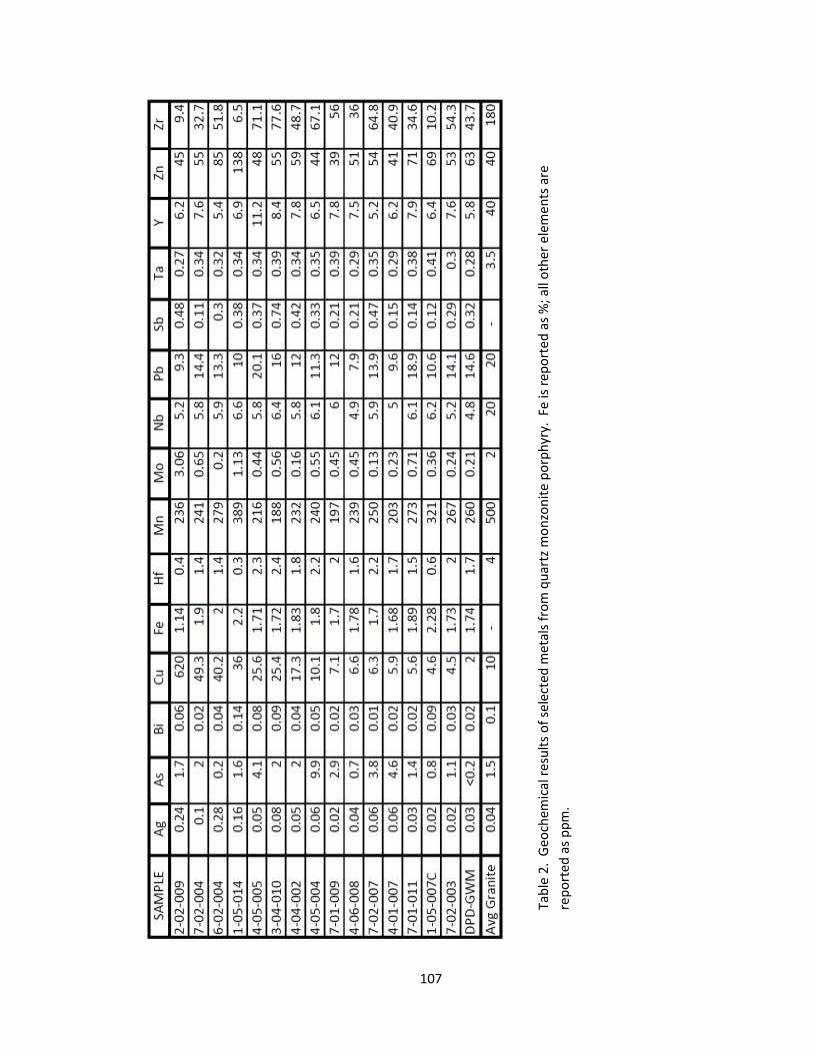
107
Tab
le 2
. G
eoch
emic
al r
esu
lts
of
sele
cted
met
als
fro
m q
uar
tz m
on
zon
ite
po
rph
yry.
Fe
is r
epo
rte
d a
s %
; all
oth
er e
lem
ents
are
rep
ort
ed a
s p
pm
.

108
SAMPLE Ag (ppm)
As (ppm)
Bi (ppm)
Cu (ppm)
Mn (ppm)
Mo (ppm)
Pb (ppm)
Sb (ppm)
Se (ppm)
Te (ppm)
Zn (ppm)
Au (ppb)
6-01-003 159 27.5 1.73 15900 129 2190 89.9 1.72 5.3 0.97 775 0.152
2-02-001 7.86 1030 0.53 1715 134 1840 4150 6.28 34.1 0.21 1280 0.205
6-01-LV 63.4 136.5 1.19 11250 82 1430 340 38.7 9.2 1.04 244 0.268
2-02-008 17.7 8.4 1.63 2310 57 425 103 0.35 6.2 0.16 139 0.003
6-02-001 5.08 16.2 7.89 363 433 416 83.1 1.8 22 0.19 92 0.007
6-02-002 28.6 118 726 2020 164 322 304 1.09 40.1 1.94 149 0.006
2-02-011 8.39 381 6.35 131 49 204 162.5 3.81 10.5 2.08 110 0.190
2-02-010 2.32 8.1 0.98 997 78 203 22.3 0.77 2.6 0.26 23 0.009
1-05-018 0.9 183.5 144 159.5 39 76.7 69 1.21 0.3 62.6 31 0.016
3-04-004 0.16 19.1 0.28 176 66 23.6 4.4 0.18 <0.2 0.03 15 0.004
6-01-004 3.33 9.1 0.18 385 39 21.1 20.2 1.17 1.1 0.16 26 0.016
6-01-002 4.57 32.2 0.33 190 71 20.3 21.4 1.42 0.3 0.11 7 0.024
4-04-004 7.03 119 0.64 166 59 16.1 113.5 2.86 1.8 0.17 28 0.022
3-03-008 0.1 6 0.09 6.5 2980 13.35 8.5 0.17 1 0.01 142 0.002
1-04-012 470 1625 1.5 129.5 41 12.8 8020 11.3 1.1 0.04 315 4.07
3-03-002 0.53 8 0.03 10.1 3400 11.75 39.5 0.75 0.7 0.02 224 0.002
4-03-004 59.7 345 0.2 1265 1040 11.2 270 59.3 0.6 0.07 441 0.222
4-05-003 6.39 122.5 2.74 459 171 11.15 26.6 2.54 4.3 1.76 21 0.005
5-03-011 174 419 44.5 4230 80 10.6 3560 7.14 2.5 25.4 2580 1.125
4-05-001 0.32 249 0.2 44.5 41 8.62 6.8 2.01 0.4 0.07 6 <0.001
3-03-007 23.7 73.8 1.42 3370 95 7.99 16.1 2.99 7.7 0.59 41 0.207
GWM-BR 202 20.9 50.7 495 22 7.57 2640 0.98 1.5 9.43 109 1.36
4-03-001 45.6 19.5 0.44 371 1710 3.83 13450 145 1 0.05 636 0.096
6-01-008 1.13 44.4 2.02 89.3 42 3.81 9.4 1.41 1.5 0.42 10 0.026
3-04-006 175 753 0.24 479 84 3.71 29100 129.5 0.3 0.06 170 8.9
6-02-005 2.68 70.5 1.56 433 76 3.17 69.9 0.78 1.1 0.15 8 0.461
1-06-008 13.85 332 3.09 277 59 2.82 3710 40 2.4 0.34 1100 8.21
6-01-BR 2.99 16.3 0.41 1225 319 2.61 127 1.96 1.2 0.39 4470 0.03
1-01-001 42.3 37.2 0.74 712 48 2.25 11100 19.6 0.3 3.16 4320 23.6
5-01-007 0.18 6.8 0.48 30.5 482 2.1 78.8 0.51 0.4 0.05 10 0.006
2-03-004 5.92 23.6 0.41 91.1 55 2.08 84.8 1.25 0.9 1.64 31 0.044
4-04-012 121 1610 0.22 27.9 115 2.01 316 2.07 <0.2 0.04 100 1.455
5-02-006 4.55 5.3 0.35 187.5 72 1.77 104.5 0.07 0.9 0.06 53 <0.001
5-01-006 0.24 5.5 0.17 11.8 489 1.63 85.1 0.55 0.2 0.05 32 <0.001
3-04-007 35.5 76.9 0.01 287 227 1.45 979 40.1 <0.2 <0.01 161 0.957
5-03-004 6.87 115.5 0.03 17.1 485 1.36 28.5 0.9 0.2 0.01 54 0.078
4-03-005 2.85 27.2 0.17 30.6 1060 1.31 71.3 3.49 0.6 0.04 118 0.033
5-01-008 1.26 10.9 1.23 280 206 0.98 14 0.39 0.8 0.2 28 0.001
5-03-001 0.31 1.8 0.03 32.8 64 0.62 3.7 0.18 0.3 0.09 5 <0.001
5-02-005 0.1 <2 0.05 10.9 3070 0.55 10 0.09 0.6 0.01 124 <0.001
Table 3. Geochemical results of selected metals from quartz veins.

109
APPENDICES

110
Appendix A.
Sample List

111

112

113
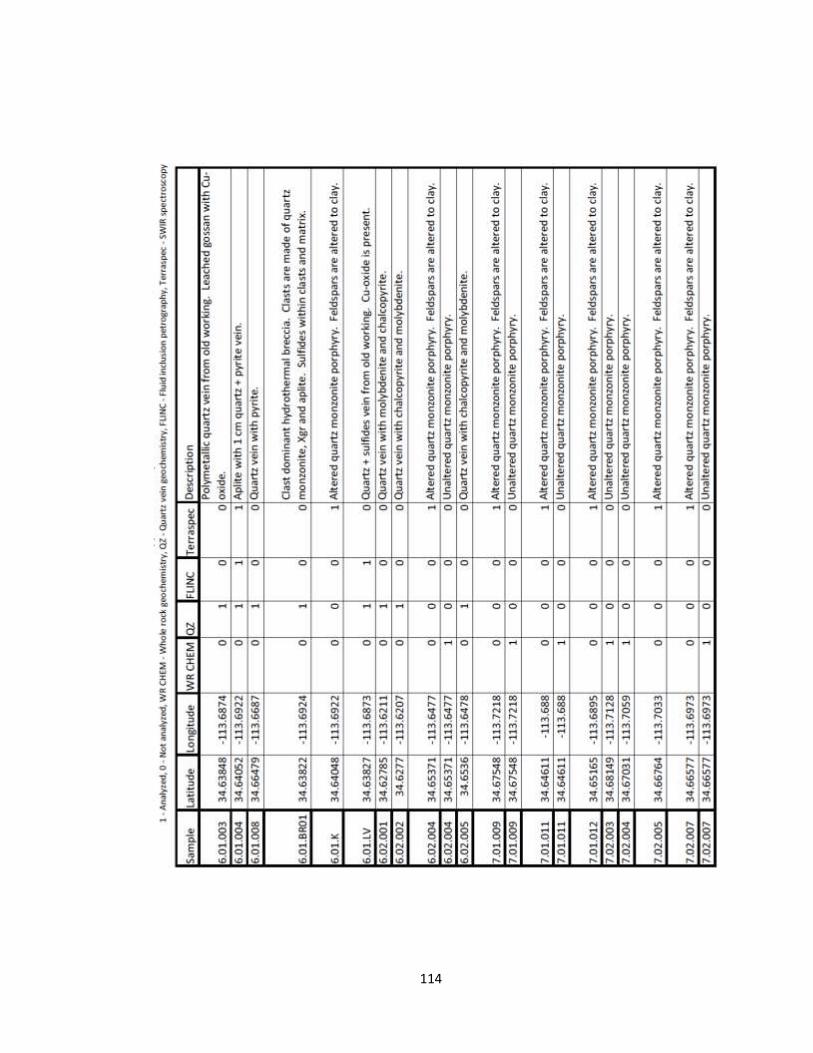
114

115

116
Appendix B.
Whole Rock Geochemistry

117
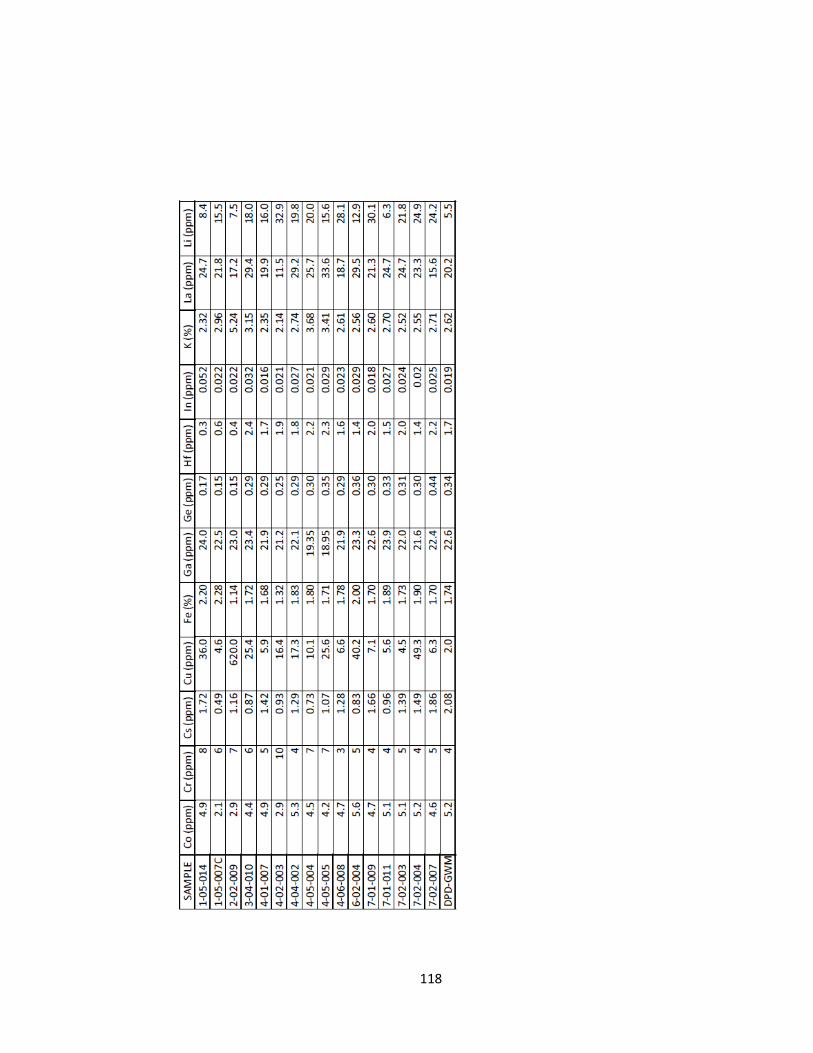
118

119

120

121

122
Appendix C.
Terraspec Analysis

123

124

125

126
Appendix D.
Mineralized Quartz Vein Geochemistry

127

128

129

130

131
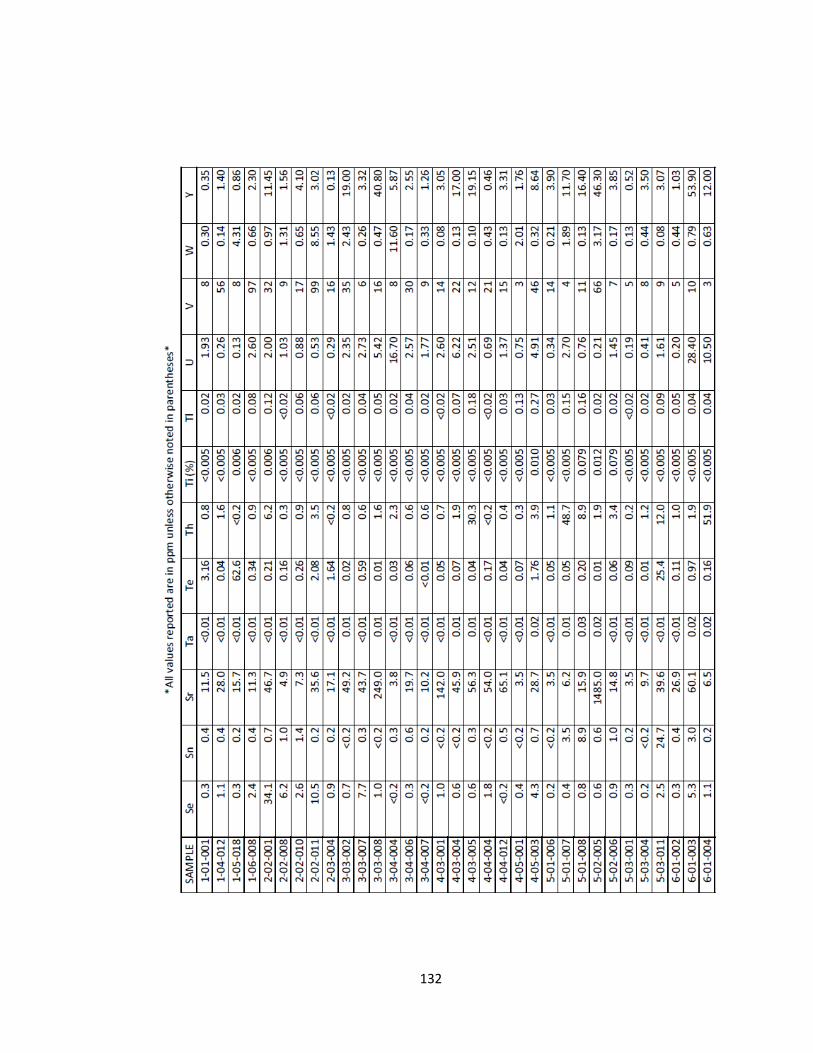
132

133

134

135
136
Appendix E.
Radiometric Dating Results
Radiometric dating was attempted on three samples: White rhyolite – whole rock,
Pegmatite – adularia, and Potassic alteration – adularia. The samples were analyzed by 40Ar/39Ar
method at the Nevada Isotope Geochronology Lab. Results from the white rhyolite give an
apparent plateau age of 71.13 +/- 0.50 Ma. This is consistent with the nearby Laramide-aged
intrusions associated with mineralization at Mineral Park and Baghdad. Due to crosscutting
relationships previously discussed, the pegmatite is older than 71.13 Ma and the quartz
monzonite porphyry dikes are younger than this age.
The results from the pegmatite and potassic alteration do not have a plateau and are
not reliable. No inferences should be made in regards to these two data sets. The poor-quality
data and lack of an apparent age plateau may be due to a number of factors, including: excess
Ar added to the system post-mineralization, recent alteration/weathering, mineral intergrowths
within the potassium feldspar, and sampling error. To achieve better results for the pegmatite it
is suggested to attempt to date the muscovite, which is more stable than potassium feldspar.
The next attempt to date potassic alteration should use fresh rock from drill core in order to
minimize the effects of weathering.

137
50
54
58
62
66
70
74
78
82
86
90
0 20 40 60 80 100
Ag
e (
Ma)
%39Ar Released
White Rhyolite
Plateau age = 71.13 ± 0.50 Ma
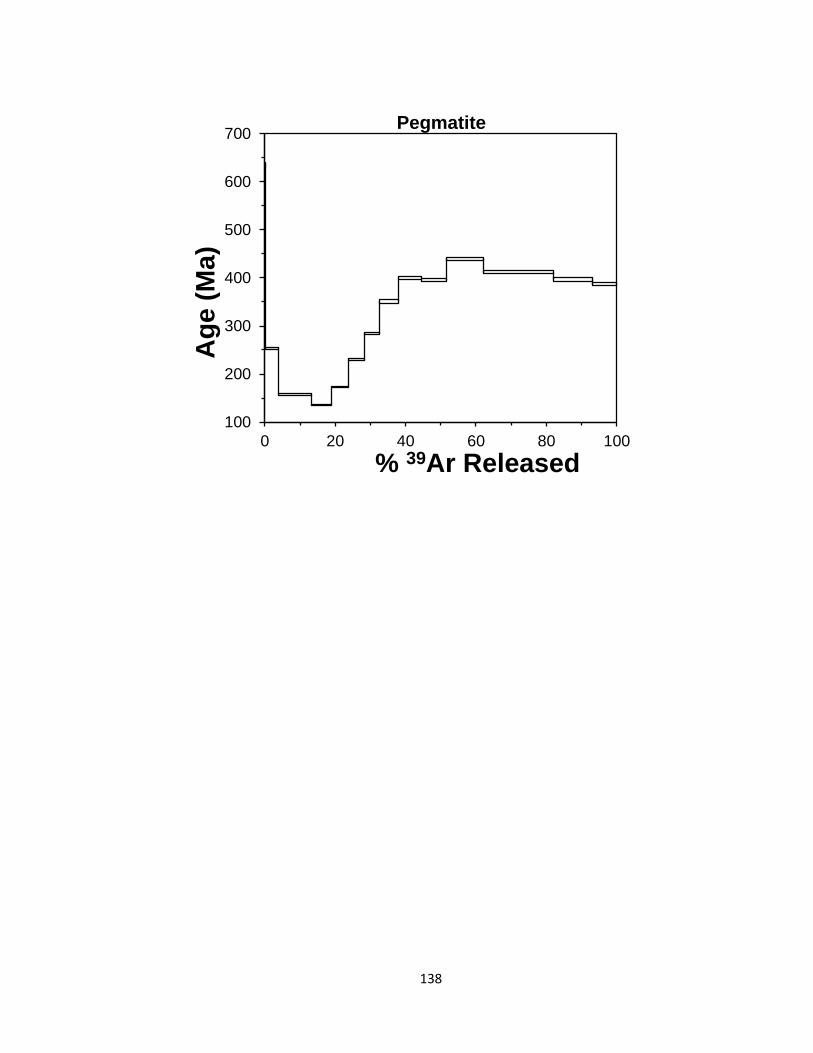
138
100
200
300
400
500
600
700
0 20 40 60 80 100
Ag
e (
Ma
)
% 39Ar Released
Pegmatite

139
0
10
20
30
40
50
60
70
80
90
100
0 20 40 60 80 100
Ag
e (
Ma
)
% 39Ar Released
Potassic Alteration

140
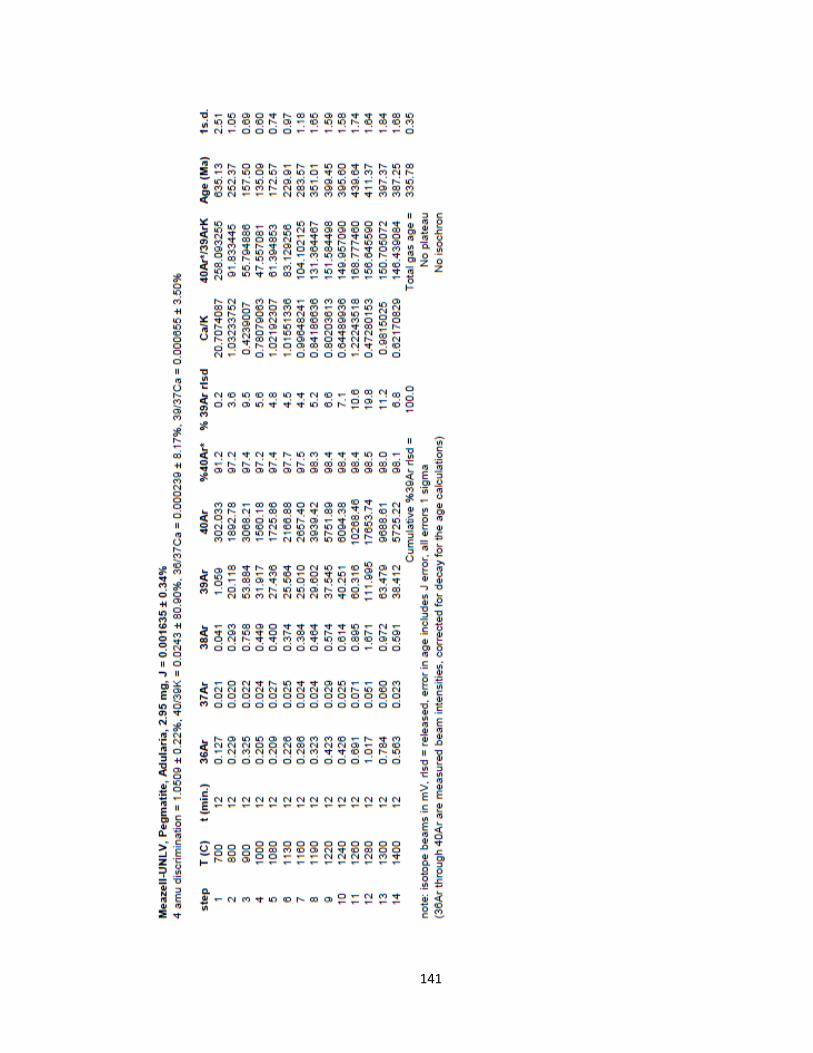
141

142

143
REFERENCES
Bain, D., 2008, Report on preliminary exploration, Wikieup mining project, Wikieup area, S.W.
Arizona, unpublished report for Can-Cal resources.
Cohen, J., 2012, Mineralogy and geochemistry of hydrothermal alteration at the Ann-Mason
porphyry copper deposit, Nevada: Comparison of large-scale ore exploration techniques
to mineral chemistry: M.S. Thesis, Oregon State University.
Damon, P. E., Shafiquallah, M., Harris, R. C., and Spencer, J. E., 1997. Compilation of
unpublished Arizona K-Ar dates from the University of Arizona Laboratory of Isotope
Geochemistry, 1971-1991. Arizona Geological Survey Open-file Report 96-18, p. 12-13.
Di Tommaso, I., and Rubinstein, N., 2007, Hydrothermal alteration mapping using ASTER data in
the Infiernillo porphyry deposit, Argentina: Ore Geology Review, vol. 32, pp 275-290.
Dilles, J.H., and Einaudi, M.T., 1992, Wall-rock alteration and hydrothermal flow paths about the
Ann-Mason porphyry copper deposit, Nevada – a 6-km vertical reconstruction:
Economic Geology, vol. 87, pp. 1962-2001.
Dings, M.G., 1951, The Wallapai Mining District, Cerbat Mountains, Mohave County, Arizona:
Contributions to Economic Geology, Geologic Survey Bulletin 978-E, pp 123-163.
Eidel, J.J., Frost, J.E., and Clippinger, D.M., 1968, Copper-molybdenum mineralization at Mineral
Park, Mohave County, Arizona, in Ridge J. D., ed., Ore deposits of the United States,
1933-1967: New York, vol. 2, pp. 1258-1281.
Goldstein, R.H., and Reynolds, T.J., 1994, Systematics of fluid inclusions in diagenetic minerals:
Society for Sedimentary Geology Short Course, 31, pp 199.

144
Hanson, S.C., 1977, The economic geology of the Wikieup prospect, Mohave County, Arizona:
Ph.D. Dissertation, University of Idaho.
Hirschberg, D.M., and Pitts, G.S., 2000, Digital geologic map of Arizona: a digital database
derived from the 1983 printing of Wilson, Moore, and Cooper 1:500,000-scale map:
USGS Open-file report 00-409.
Lang, J.R., and Eastoe, C.J., 1988, Relationships between a porphyry Cu-Mo deposit, base and
precious metal veins, and Laramide intrusions, Mineral Park, Arizona: Economic
Geology, vol. 83, pp. 551-567.
Lang, J.R., and Titley, S.R., 1998, Isotopic and geochemical characteristics of Laramide magmatic
systems in Arizona and implications for the genesis of porphyry copper deposits:
Economic Geology, vol. 93, pp. 136-170.
Mauger, R.L., and Damon, P.E., 1965, K-Ar ages of Laramide magmatism and copper
mineralization in the southwest: Atomic Energy Commission Annual Report COO-689-
50, pp. A-II-1 – A-II-8.
Nyman, M.W., Karlstrom, K.E., Kirby, E., and Graubard, C.M., 1994, Mesoproterozoic
contractional orogeny in western North America – Evidence from 1.4 Ga plutons:
Geology, vol. 22, pp. 901-904.
Roedder, E., 1984, Fluid Inclusions: Mineralogical Society of America, Reviews in Mineralogy, vol.
12, pp. 644.
Sillitoe, R.H., 2010, Porphyry copper systems: Economic Geology, vol. 105, pp. 3-41.

145
Silver, L.T., 1967, Apparent age relations in the older Precambrian stratigraphy of Arizona
(abstract): I.U.G.S. Comm. Geochronology Conference on Precambrian Stratified Rocks,
Edmonton, Canada, p. 87.
Siwiec, B.R., 2003. Tectonic implications of the Paleoproterozoic structure and metamorphism
in the northern Hualapai Mountains, Mohave County, Arizona, M.S. Thesis, Northern
Arizona University.
Taylor, S.R., 1964. Abundance of chemical elements in the continental crust: a new table,
Geochemica et Cosmochimica Acta, vol. 28, pp. 1273-1285.
Thomas, B.E., 1949, Ore deposits of the Wallapai district, Arizona: Economic Geology, vol. 44,
pp. 663-705.
Turekian, K.K., and Wedepohl, K.H., 1961, Distribution of the elements in some major units of
the Earth’s crust: Geological Society of America Bulletin, vol. 72, pp. 175-192.
Vinogradov, A.P., Vainshtein, E.E., and Pavlenko, L.I., 1958, Tungsten and molybdenum in
igneous rocks (as related to the geochemistry of tungsten): Geokhimiya, vol. 5, pp. 497-
509.
Wasserburg, G.J., and Lanphere, M.A., 1965, Age determinations in the Precambrian of Arizona
and Nevada: Geological Society of America Bulletin, vol. 76, pp. 735-758.
Wilkinson, W.H., Vega, L.A., and Titley, S.R., 1982, Geology and ore deposits at Mineral Park,
Mohave County, Arizona, in Titley, S.R., ed., Advances in geology of the porphyry copper
deposits, southwestern North America: Tucson, University of Arizona Press, pp. 523-542.

146
VITA
Graduate College University of Nevada, Las Vegas
Patrick Kevin Meazell II
Degrees: Bachelor of Science, Geology, 2009 University of Georgia
Thesis Title: Poprhyry Copper Exploration of the Hualapai Mountains, Mohave County, Arizona: A Multi-faceted Approach
Organizations: Society of Economic Geologists Geological Society of Nevada
Arizona Geological Society Conference Presentations: Meazell, K., Cline, J., and Simon, A., Porphyry Cu-Mo Exploration of the Hualapai
Mountains, AZ, USA: Society of Economic Geologists Annual Meeting, Whistler, BC, 2013.