pork versus public goods: an experimental study of public good
TRANSCRIPT

Economic Theory manuscript No.(will be inserted by the editor)
Pork Versus Public Goods: An Experimental Study of
Public Good Provision Within a Legislative Bargaining
Framework
Guillaume R. Frechette · John H.
Kagel · Massimo Morelli
Received: date / Accepted: date
Abstract We experimentally investigate a legislative bargaining model withboth public and particularistic goods. Consistent with the qualitative impli-cations of the model: There is near exclusive public good provision in thepure public good region, in the pure private good region minimum winningcoalitions sharing private goods predominate, and in the “mixed” region pro-posers generally take some particularistic goods for themselves, allocating theremainder to public goods. As in past experiments, proposer power is notnearly as strong as predicted, resulting in public good provision decreasing inthe mixed region as its relative value increases, which is inconsistent with thetheory. JEL classification: C7, D72, C92, C52.
This research was partially supported by: National Science Foundation Grants No. 0213312,0519205, 0519045, 0721111, and 0924780; the Mershon Center at The Ohio State Univer-sity, and the Center for Experimental Social Science and the C.V. Starr Center at NewYork University. We thank the editor and referees, Alan Wiseman, Johanna Goertz, PedroDal Bo, participants at the Seminaire Matuszewski at Universite Laval and at the CitibankWorkshop in Economic Theory at Brown University, Society for Economic Design 5th Con-ference on Economic Design, Social Dilemmas Conference, Experimental and BehavioralConference, Allied Social Science Associations Annual Meeting, CIRANO conference onIndividual Decisions and Political Process for useful comments and Kirill Chernomaz fordeveloping the software employed in conducting the experiment along with helping to runthe experimental sessions. The software was developed using zTree (Fischbacher 2007). Anyopinions, findings, and conclusions or recommendations in this material are those of theauthors and do not necessarily reflect the views of the National Science Foundation or theother funding agencies.
G. FrechetteNew York University, Department of Economics and CESS
J. KagelOhio State University, Department of Economics, 10 Arps Hall, 1945 N High Street, Colum-bus OH 43210; Tel. 614-292-4182.E-mail: [email protected]
M. MorelliColumbia University, Departments of Economics and Political Science
2 Frechette, Kagel and Morelli
Keywords Legislative Bargaining, Public Goods, Efficiency.
1 Introduction
One of the most important questions in economics and political science is un-derstanding how any collective body makes decisions, and, in particular, underwhat conditions we can expect an efficient provision of public goods by suchcollective bodies. Public good provision is a key aspect of what governmentsand legislatures do, with governments and legislatures typically being the mostimportant suppliers of public goods. Even in countries where the governmentis not the most important supplier of goods like health care and education,it is often the sole supplier of some key public goods such as defense and lawenforcement. However, collective decision making bodies are far from being“benevolent unitary actors.” Rather their members are constantly trading offthe virtues of the public goods under consideration against the attractivenessof spending the money on particularistic goods (pork) benefiting themselvesindividually or their districts.1 Theoretical and experimental methods can helpclarify this trade-off, with our goal in this paper being to identify and charac-terize the behavioral patterns of a collective body facing these types of choices.
Most of the experimental literature on public good provision has focussedon voluntary contribution mechanisms, or provision point mechanisms, inwhich individual agents decide between allocating their personal endowmentto their own private use or to benefit the group as a whole. Both of thesemechanisms have a very different structure from the one legislators face inbargaining over budget allocations, as public goods (both level and scope)have to be determined by some collective-choice procedure, and there alwaysare particularistic goods available as alternative ways to use the budget. Thus,we need to turn to a reasonably appropriate model that explicitly considers thepolitical process by which public goods are provided to capture the competingforces at work in political institutions.
For the most part, legislative bargaining theory has focused either on dis-tributive politics2 or on policy decisions. Only recently have there been majorefforts to model legislators’ incentives to provide public goods when the al-ternative use of the budget is to provide particularistic goods.3 Volden and
1 Particularistic goods here can be local public goods in the sense that they primarilyyield benefits within the district the legislator represents. In this sense public goods referto more global public goods which are enjoyed by all districts.
2 The paper by Battaglini and Palfrey in this issue contains a dynamic model of dis-tributive politics and a rich experimental analysis thereof. Their results are not directlycomparable with ours, not even in the treatment where the theory that we test predictsonly particularistic goods in equilibrium, since the two models are very different.
3 There is a line of research incorporating collective and particularistic elements (e. g.,Austen-Smith and Banks 1988, Crombez 1996, Banks and Duggan 2000, Baron and Dier-meier 2001, Jackson and Moselle 2002, Morelli 1999, Goertz 2006), but those models do notcapture the explicit trade-offs resulting from the fact that private and public good spendingare alternative uses of the same fixed budget.

Pork vs. Public Goods: An Experimental Study 3
Wiseman (2005, henceforth VW) provide a benchmark model for our exper-imental analysis, since they model a bargaining game where legislators canagree on any division of the budget between particularistic and collective goodspending.4
Previous experimental work on legislative bargaining has focused on purelydistributive settings. The motivation behind these experiments has been toinvestigate the ability of the (stationary) subgame perfect equilibrium (hence-forth SSPE) outcome to characterize allocations compared to alternative mod-els, to measure the bargaining power of the agenda setter, and to determinewhether or not Riker’s minimum-winning-coalition view of bargaining is con-firmed (see for instance McKelvey 1991; Frechette, Kagel and Lehrer 2003(henceforth FKL); Diermeier and Morton 2004; Diermeier and Gailmard 2006;Frechette, Kagel and Morelli, 2005a, b (henceforth FKM(2005a, b))).5
Adding the possibility of proposing different combinations of private andpublic goods introduces a number of interesting new behavioral questions:Given that the public good provides benefits to everyone, will agents be bi-ased (relative to the theory) in favor of public good provision out of equity,efficiency or some other considerations? Can the possibility of public goodsincrease proposer power in some situations? What happens to the proposedcombinations of private and public goods when the relative value legislatorsplace on private goods changes?
The VWmodel extends the Baron-Ferejohn (1989, henceforth BF) alternating-offer model of majoritarian bargaining to a legislature determining how to al-locate a fixed budget between public goods that benefit all legislators’ districtsand particularistic goods that benefit an individual district. In its closed-rule,infinite-horizon form, someone is picked at random to make a proposal, thenthe others simultaneously vote yes or no on it. If the majority rejects the pro-posal then a new proposer is chosen at random, with the process repeatinguntil an allocation is determined (with discounting on the size of the budget).6
Legislators utility functions attach value to the public and private goods, withweights being the same across all legislators. This utility function and theweight associated with the value of public versus particularistic goods can bethought of as a reduced form expression incorporating the impact of the elec-toral system; e.g., in systems where a politician’s survival is determined moreby what happens locally, then the weight put on public goods will be smallerthan when their survival depends more on what happens nationally.
4 Lizzeri and Persico (2001) capture some of the trade-offs between public and privategoods in party platforms. Leblanc, Snyder and Tripathi (2000) and Battaglini and Coate(2006) also contain interesting predictions about legislative bargaining when deciding onmultiple policy issues. We focus on the VW model because it explicitly deals with thecomparative statics we are interested in, namely the changes in bargaining behavior aslegislators’ utility from pork relative to common interest policies varies.
5 There are many more recent, closely related, experimental investigations of Baron andFerejohn (1989) type models: Kagel, Sung, and Winter 2010; Diermeier and Gailmard 2006;Battaglini, Nunnari, and Palfrey 2010; Drouvelis, Montero, and Sefton 2007.
6 The discounting is designed to capture delay costs, including the fact that legislatorsmay not be reelected to enjoy the fruits of their labor.

4 Frechette, Kagel and Morelli
In our experiment we vary these weights across treatment conditions inorder to produce (1) a situation in which there is a unique equilibrium inwhich only public goods are provided (a dominant strategy for all players),(2) a “mixed region” in which both public and private goods are providedand (3) a region with only private goods provided within a minimum winningcoalition (henceforth MWC). The model predicts that in the mixed regionthe proposer takes some private goods for herself, allocating the remainderof the budget to public goods. Further, using the standard subgame perfectequilibrium logic, as the relative value of private goods increases, the proposeroffers more public goods in order to keep responders on their “participationconstraint.”
Our main experimental results can be summarized as follows: Within thepure public good region, the vast majority of offers are all public goods. Inthe pure private good region, the predominant tendency is for MWCs withno public goods. In the mixed region we observe a multiplicity of allocationswhich, over time, slowly converges toward “equilibrium type allocations” withprivate goods allocated exclusively to the proposer, and the remainder of thebudget devoted exclusively to the public good. The level of the public good issubstantially higher than predicted under the SSPE allocation, as proposersare unable to get a favorable vote for anything approaching the SSPE. Thatis, there is far less proposer power within the mixed region than predicted,consistent with the limited proposer power found in past legislative bargain-ing models with only particularistic goods (e.g., Diermeier and Morton, 2004;FKM, 2005a, b), as well as the results reported here for the all private goodsregion. Unlike past experiments where the absence of high levels of proposerpower had no impact (at least directionally) on the comparative static predic-tions of the model, in this case it does: the share of the budget allocated to thepublic good decreases within the mixed region as the value of the public gooddecreases, contrary to the model’s prediction that more public goods need tobe provided in the mixed region to keep potential coalition partners on theirparticipation constraint.
Our experiment has implications for the public goods literature as it an-alyzes an entirely different framework for public good provision compared tovoluntary contribution and provision point mechanisms that are typically in-vestigated.7 Our results are similar in some dimensions to VCM and provisionpoint experiments (e. g., the level of public good provision is higher than pre-dicted throughout most of the mixed region). However, there are some majordifferences: Given the marginal per capita return (MPCR) of a contributionto the public good within the mixed region, public goods provision is sub-stantially higher than reported in VCM games and does not decrease overtime as typically reported in VCM games. These differences reflect differencesin equilibrium outcomes between the legislative bargaining game and VCMgames, as well as the constraints placed on proposer power typically reportedin legislative bargaining games. The experiment also has implications for the
7 See Potters, Sefton and Vesterlund (2007) for an example of such an experiment.
Pork vs. Public Goods: An Experimental Study 5
“other regarding preference literature” that has grown up around bilateralbargaining games in the economics literature (i.e., concern for others’ incomethat goes beyond the usual assumption that only own income matters). Theseimplications are discussed in the concluding section of the paper.
The plan of the paper is as follows: Section 2 outlines the Volden-Wiseman(2005) model that serves as our benchmark. Sections 3 and 4 give the experi-mental design and the results, respectively. Summary and concluding remarksare reported in Section 5.
2 Benchmark Model and Related Hypotheses
In this section we describe the VW (2005) model.Consider a legislature of N politicians, representing different legislative
districts, who have to make a collective decision on how to allocate a fixedbudget between a public good and private goods (pork barrel projects). LetN be an odd number. Denoting by y the share of the budget allocated tothe public good and by x the N -dimensional vector of private good sharesallocated to the N legislators (y +
∑N
i=1xi ≤ 1), the utility function of each
legislator is given by8
Ui(x, y) = αxi + (1− α)yq
where α ∈ [0, 1] is the relative weight of private goods in the utility function9
and q represents the absolute value (or return) of spending a dollar in publicgood production.10 Each legislator has the same probability of being selectedby Nature as the proposer of a division of the (unitary) budget. If at least(N − 1)/2 responders accept the proposal the budget is divided according tothe proposal. If the majority rejects, another random proposer is selected, andthe budget shrinks using the discount factor δ. The status quo is no budgetallocation. The bargaining game is a straightforward extension of the (closedrule) infinite horizon bargaining game of BF (1989) to a budget division involv-ing two dimensions - public and particularistic goods. The solution concept isstationary subgame perfection (SSPE).
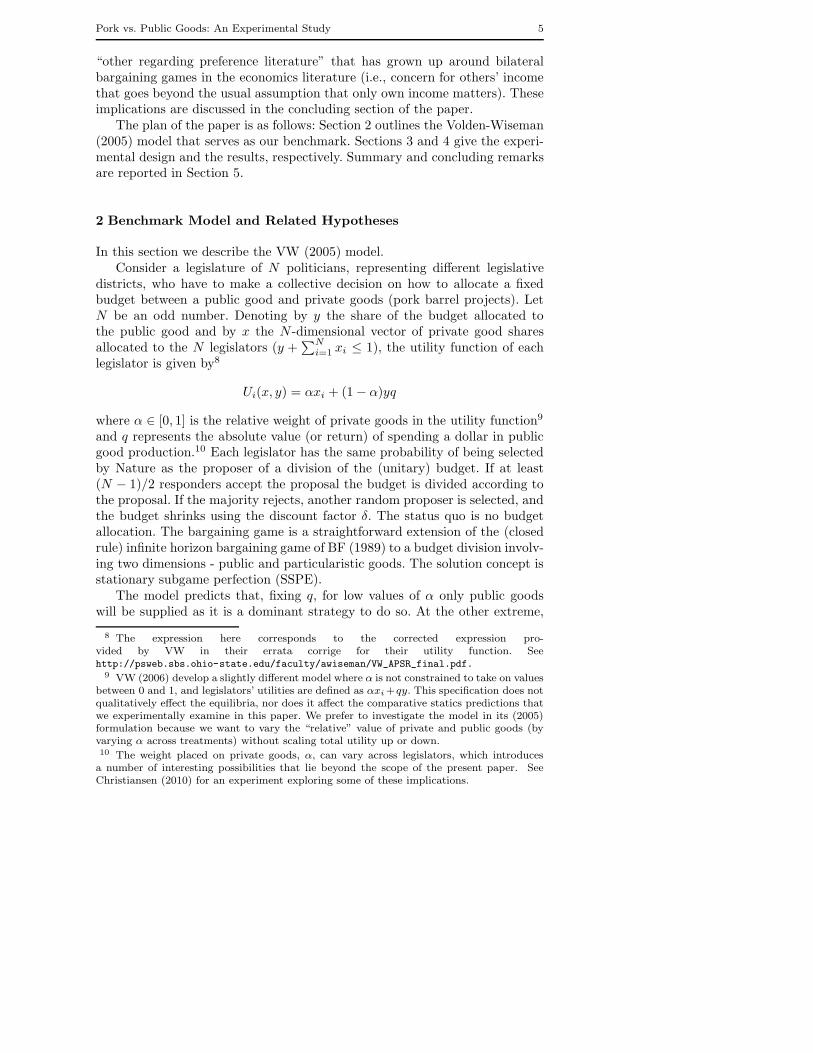
The model predicts that, fixing q, for low values of α only public goodswill be supplied as it is a dominant strategy to do so. At the other extreme,
8 The expression here corresponds to the corrected expression pro-vided by VW in their errata corrige for their utility function. Seehttp://psweb.sbs.ohio-state.edu/faculty/awiseman/VW_APSR_final.pdf.
9 VW (2006) develop a slightly different model where α is not constrained to take on valuesbetween 0 and 1, and legislators’ utilities are defined as αxi+qy. This specification does notqualitatively effect the equilibria, nor does it affect the comparative statics predictions thatwe experimentally examine in this paper. We prefer to investigate the model in its (2005)formulation because we want to vary the “relative” value of private and public goods (byvarying α across treatments) without scaling total utility up or down.10 The weight placed on private goods, α, can vary across legislators, which introducesa number of interesting possibilities that lie beyond the scope of the present paper. SeeChristiansen (2010) for an experiment exploring some of these implications.

6 Frechette, Kagel and Morelli
0 ΑCM ΑMP 1Α0
1
y
Fig. 1 Public Good Contribution
for high values of α only private goods will be supplied, in which case onlymembers of a minimum winning coalition (MWC) receive positive shares. Forintermediate values of α the public good is supplied and the proposer takessome private benefits for himself, but does not offer private benefits to anyoneelse. The lower bound on the mixed region is given by
αCM =q
1 + q.
The upper bound on the mixed region is given by
αMP =q(N + 1)
2 + q(N + 1).
If α < q/(1 + q) it is a dominant strategy to offer only public goods asparticularistic have a lower marginal utility than the public good. If α ∈
[αCM , αMP ), a proposer has no incentive to deviate and offer all public goodseven though such a proposal would surely be approved. The proposer prefersthe mixed outcome to the all public goods outcome since he is better off takinga share of the budget for himself while still getting his proposal passed.
In the mixed region, as α increases, the proposer decreases the share ofthe budget he takes for himself in terms of private benefits. In other words,the theory predicts a non monotonic relationship between the supply of thepublic good and the value legislators place on private goods (α) as can beseen in Figure 1. Thus, starting with low values for the private good (lowvalues of α) the budget share going to private goods is zero. Once α reachesαCM the budget share for private goods jumps up (with all of it going to theproposer), only to decrease within the mixed region up to the point where thevalue of α becomes so high that only private goods are offered within a MWC

Pork vs. Public Goods: An Experimental Study 7
(at which point the share going to the proposer remains constant for furtherincreases in α). In addition, under the SSPE all stage one proposals pass, sothat bargaining ends with the first proposal.
3 Experimental Design
Each experimental session used a legislature/committee comprised of N = 5subjects, with the value of the public good q = 0.7 and the discount factorδ = 0.8 constant for all treatments. Thus the range for the mixed regionis given by [αCM , αMP ) = [0.412, 0.677). The different values of α used inexperimental treatments were 0.3, 0.45, 0.55, 0.65 and 0.75. N and δ wereselected to correspond to values used in previous experimental studies of theBF game. Given those parameters, q was selected to provide a reasonably widemixed region.
Subjects were told that they had to decide how to divide 50 “francs” be-tween “... two types of allocations: (i) allocations to individual voters or (ii)allocations to the group of voters as a whole (called the group allocation).”They were told the payoff in francs allocated to the group as a whole as wellas the payoff in dollars and that those were a function of “...francs allocated toyou as an individual as well as your share of the group allocation.” Everythingwas computerized with subjects screens automatically calculating the conver-sion rate from the group allocation to individual payoffs, as well as the dollarpayoffs for any proposed allocation.11
Table 1 gives the equilibrium predictions for each value of α. The shareof the budget devoted to the public good is reported as well as the sharegoing to the proposer, along with payoffs (listed in dollars). Note that exceptfor the case of pure private goods (α = 0.75), shares to responders representonly payoffs from the public good. In the pure private goods case, sharesare allocated only to members of the minimum winning coalition (MWC).Table 1 also shows the efficiency levels predicted under the SSPE. In all casesefficiency is maximized when y = 1 as this provides maximum total moneypayoffs. Efficiency is measured as the ratio of the difference in the sum of theutilities (monetary payoffs) in equilibrium and the sum of the utilities wheny = 1.
Between 10 and 20 subjects were recruited for each experimental session,so that there would be a minimum of 2, and a maximum of 4, groups of5 subjects bargaining simultaneously in each session.12 After each bargaininground (when all groups had reached agreement on an allocation), subjects were
11 http://homepages.nyu.edu/~gf35/print/frechette_2011a_oa.pdf provides sample in-structions and screen shots.12 Our intention was to have a minimum of 15 subjects in each session, but in some casesenough extras showed up to be able to run four bargaining groups. Two sessions fell shortof the desired 15 subjects and were conducted with 10 subjects each (see Table 2 below).There are no discernible differences between sessions as a consequence of the number ofsubjects present.
8 Frechette, Kagel and Morelli
Table 1 Theoretical Predictions
α Budget Share Payoffs EfficiencyPublic Good Private Allocation Proposer Responders
0.3 1 0 $24.50 $24.50a 1.0000.45 0.483 0.517 $20.93 $9.30a 0.6040.55 0.583 0.417 $20.65 $9.18a 0.7280.65 0.680 0.320 $18.74 $8.33a 0.8500.75 0 0.68 $25.50 $6.00b 0.857
Note: α = weight placed on private goods in members utility function.
a Given to all respondersb Given to coalition partners within a minimum winning coalition.
randomly re-matched. Subject numbers also changed randomly between bar-gaining rounds (but not between the stages within a given bargaining round).
Procedures for each bargaining round were as follows: First all subjectsentered a proposal on how to allocate the 50 francs. Then one proposal waspicked randomly to be the standing proposal. This proposal was posted onsubjects’ screens giving the amounts in francs allocated to each subject alongwith the dollar shares implied by the given allocation as determined by theutility function Ui(x, y) along with the value of α in effect for that treatment.13
Proposals were voted up or down, with no opportunity for amendment. If asimple majority accepted the proposal the payoff was implemented and thebargaining round ended. If the proposal was rejected, the process repeateditself (hence initiating a new stage of the same bargaining round). Completevoting results were posted on subjects’ screens, giving the dollar amount allo-cated by subject number along with the francs allocated to the public good,whether that subject voted for or against the proposal, and whether the pro-posal passed or not.14
A total of 15 sessions, all with inexperienced subjects, were conducted.Table 2 lists the values of α along with the number of subjects in each ses-sion. Sessions 1-13 all employed 12 bargaining rounds, with one of the rounds,selected at random, to be paid off on.15 Sessions 14 and 15 employed a cross-over design with an initial set of 12 bargaining rounds with values of α equalto 0.45 and 0.55, respectively. These were followed by another 8 bargainingrounds in which the value of α was changed from 0.45 to 0.55 in session 14
13 For example, in the α = 0.55 treatment, if a proposal allocated 40 francs to the publicgood, and the remaining 10 francs to the proposer, subjects would see the implied dollarallocations ($12.60 for responders, $18.10 for the proposer) on their screens for all playersalong with the allocations in francs.14 Screens also displayed the proposed shares and votes for the last three bargaining roundsas well as the proposed shares and votes for up to the past three stages of the currentbargaining round. Other general information such as the number of votes required for aproposal to be accepted were also displayed.15 These cash bargaining rounds were preceded by a bargaining round in which subjectswere “walked through” the various contingencies resulting from, for example, accepting orrejecting offers.

Pork vs. Public Goods: An Experimental Study 9
Table 2 Experimental Sessions
Treatments Number of Number of Rounds for Final Payment in $ (per subject)(value of α) Session Subjects Rounds Payment Min Max Average
0.3 1 10 12 1 27.60 30.40 29.302 15 12 1 32.50 32.50 32.503 15 12 1 31.10 32.50 32.09
0.45 4 15 12 1 25.40 27.60 26.615 20 12 1 21.50 27.30 25.00
0.55 6 20 12 1 19.10 26.10 21.487 25 12 1 20.70 25.00 23.03
0.65 8 20 12 1 8.00 22.70 15.619 15 12 1 15.40 25.60 18.2010 20 12 1 8.00 28.40 15.60
0.75 11 15 12 1 8.90 20.20 15.7312 20 12 1 8.40 22.30 15.5613 15 12 1 8.00 26.80 15.18
0.45 to 0.55 14 10 20a 2 39.30 45.40 420.55 to 0.45 15 15 20a 2 37.40 44.20 40.81
a See text.
and from 0.55 to 0.45 in session 15.16 These cross-over sessions were conductedas the between session results with α = 0.45 and .55 failed to show the pre-dicted increase in the budget share allocated to the public good. This designwas employed to enable us to use own subject control to test this sensitivecomparative static prediction of the model, and to provide subjects with themost striking contrast in terms of their own payoffs for the predicted increase(decrease) in public good allocation following the increase (decrease) in α thatthe theory predicts. In both of these sessions, subjects were paid on the basisof one random draw from each of the two sets of bargaining rounds. However,these draws were only made after both sets of bargaining rounds had beencompleted, while the planned change in the value of α, along with the extra8 bargaining rounds, was only announced at the end of the first set of 12bargaining rounds.17
Subjects were recruited through e-mail solicitations from students enrolledin economics classes at Ohio State University. This resulted in recruiting abroad cross-section of undergraduate students. All subjects received a par-ticipation fee of $8 along with whatever monetary allocation they obtainedfrom the randomly selected bargaining round(s). Sessions lasted between anhour and fifteen minutes to an hour and forty five minutes. Table 2 gives theminimum, maximum, and average earnings including the show-up fee for eachsession.
16 These crossovers were announced after completion of the initial set of bargaining rounds,and were completed well within the time frame for which subjects were recruited. Uponcompletion of the entire session, a single round was randomly selected for payment from thefirst set of bargaining rounds as well as from the second set.17 That is, instructions for the first 12 bargaining rounds were in all respects the same asthe instructions for the corresponding sessions without the change in the value of α.

10 Frechette, Kagel and Morelli
This design generates four central questions for investigation: (1) Do ne-gotiations stop immediately as predicted? (2) Are proposals within each re-gion “equilibrium type” proposals? (3) Do proposers exploit their power aspredicted? (4) Do we observe the predicted relation between α and y acrossregions as well as within the mixed region?
The rest of the paper will be organized as follows. First, the performance ofthe SSPE predictions of the model will be evaluated in terms of the four ques-tions noted above. These results will be organized by first presenting evidencedealing with a question, followed by a summary of the evidence in the formof a “Conclusion.” Second, the main deviations from the theory identified inthe mixed public and private good region will be explored. Finally, we discussthe present results in relationship to results from other legislative bargainingexperiments as well as their implications for the public goods literature andthe other regarding preference literature.
4 Results
4.1 Overview of Experimental Results
Most bargaining rounds had only 1 stage (ended with the first proposal votedon), as the theory predicts. More specifically, 86% of bargaining rounds endedin stage 1, 13% in stage 2, and 1% in stages greater than 2 (with 5 being themaximum number of stages in any bargaining round). These numbers are es-sentially unaffected when looking at rounds 10 and above when subjects wouldhave had more experience with the game.18 There were minimal differences intime to agreement across treatments, with treatments which had large num-bers of public good offers taking slightly fewer stages (on average) to reachagreement (reflective of the fact that all public good allocations were alwaysaccepted).19
Conclusion 1 The vast majority of bargaining rounds ends in stage 1 as thetheory predicts, with only 1% of all bargaining rounds extending beyond stage2.
The number of subjects who were offered strictly positive amounts of pri-vate goods is reported in Table 3.20 Looking at all rounds, the modal of-fer consists of equilibrium type allocations with α = 0.30, 0.55 and 0.75 (noprivate allocations with α = 0.30, all private goods split between a MWC
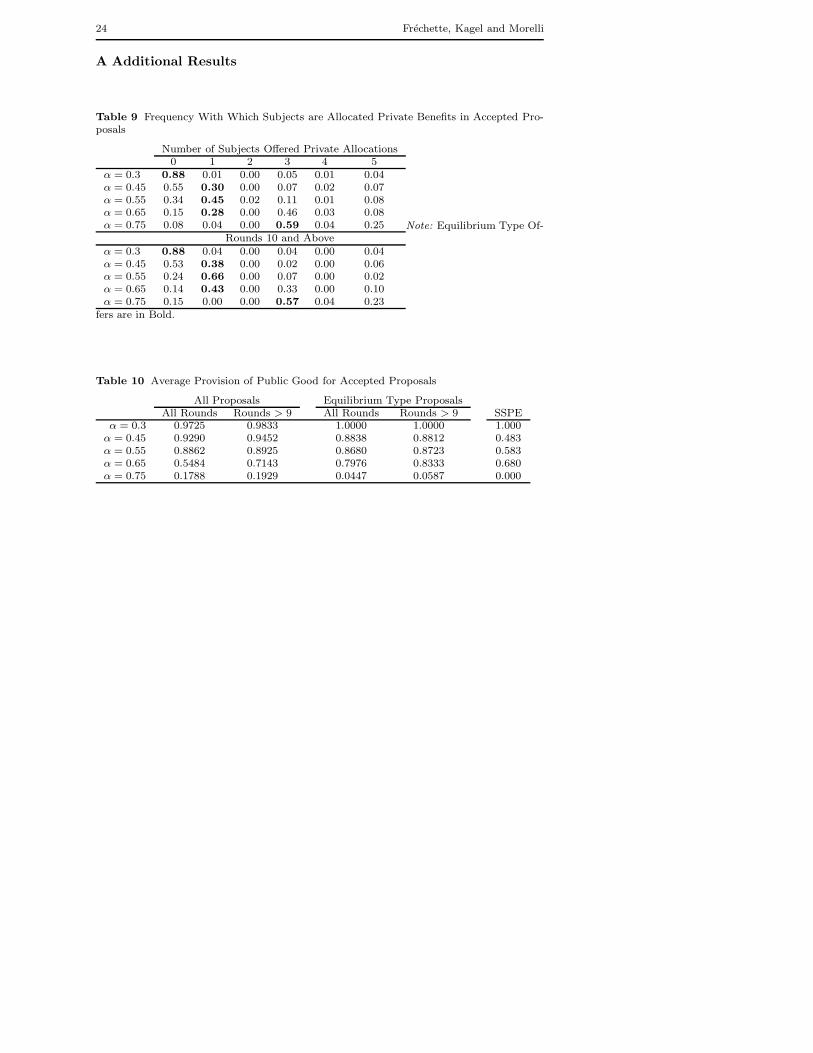
18 Given that most of the data is in stage 1, the data analysis that follows uses stage 1data only, unless noted otherwise. This is done for convenience, as it makes comparisonssimpler since we do not have to worry about the effect of discounting on payoffs.19 For α = 0.3, the average number of rounds to agreement was 1.05 versus 1.27 for α =0.65, with the other averages between these two values. A Kruskal-Wallis test rejects thenull of equality across all α, but one cannot reject the null that α = 0.3 and 0.45 are thesame, while α = 0.55, 0.65, and 0.75 are the same.20 The appendix contains a table equivalent to Table 3 except that it only includes acceptedoffers. The relative frequencies are very similar to those shown in Table 3.

Pork vs. Public Goods: An Experimental Study 11
Table 3 Frequencies With Which Different Numbers of Subjects Were Allocated PrivateBenefits: All Offers (including those not voted on).
Number of Subjects Offered Private Allocations0 1 2 3 4 5
α = 0.3 0.80 0.01 0.00 0.07 0.02 0.10α = 0.45 0.54 0.32 0.01 0.05 0.01 0.07α = 0.55 0.28 0.43 0.01 0.13 0.04 0.11α = 0.65 0.09 0.27 0.00 0.44 0.03 0.17α = 0.75 0.06 0.03 0.00 0.62 0.05 0.25
Rounds 10 and Aboveα = 0.3 0.82 0.02 0.00 0.08 0.02 0.08α = 0.45 0.53 0.40 0.01 0.02 0.00 0.04α = 0.55 0.28 0.57 0.01 0.08 0.02 0.04α = 0.65 0.06 0.41 0.01 0.39 0.01 0.12α = 0.75 0.09 0.01 0.00 0.73 0.02 0.15
Note: Equilibrium Type Offers are in Bold.
with α = 0.75, and only 1 player, the proposer, receiving private goods withα = 0.55). The two notable exceptions are α = 0.45 and 0.65, at either end ofthe mixed region, where equilibrium type allocations also consist of 1 player,the proposer, receiving private goods. In contrast to this prediction, there aretoo many all public proposals with α = 0.45 and too many MWC type offerswith α = 0.65. Equilibrium type offers are more frequent for all treatments inrounds 10 and above, indicative of a clear, consistent learning process favor-ing equilibrium type allocations for all treatments except for α = 0.30 (whichremained quite steady throughout). These learning patterns are reported indetail in Section 4.2 below.21 These changes are sufficiently strong that forrounds 10 and above the modal offer is an equilibrium type offer for α = 0.65,and equilibrium type offers have increased from 32% to 40% for α = 0.45.
The α = 0.3 condition reveals some inefficiencies as 20% of all proposalsinvolve some private goods. However, these misallocations are relatively smallin magnitude, as the average share of the budget allocated to the public goodwas 92.9% calculated over all rounds, and 96.1% for rounds 10 and above(see Table 4). Finally, in round 12, these allocations of particularistic goodsrepresent just 2% of the budget.
Conclusion 2 Looking at all rounds, the modal offer yields private benefitsto as many subjects as the theory predicts with the exception of α = 0.45 andα = 0.65, with too many all public good offers in the first case and too manyplayers receiving private goods in the second case. There is learning/adjustmentgoing on within sessions in that equilibrium type offers are more common inlater bargaining rounds for all values of α.
21 For the cross-over sessions we include data for all 8 bargaining rounds after the changein α when characterizing experienced play (periods 10 and above). We do so on the groundsthat subjects are already quite familiar with the structure of the game. Results for experi-enced play are robust to limiting the data to the last 3 bargaining periods before and afterthe crossover.

12 Frechette, Kagel and Morelli
Table 4 Average Proposed Provision of Public Good
All Proposals Equilibrium Type ProposalsAll Rounds Rounds > 9 All Rounds Rounds > 9 SSPE
α = 0.3 0.929 0.961 1.000 1.000 1.000α = 0.45 0.905 0.934 0.860 0.871 0.483α = 0.55 0.802 0.858 0.843 0.847 0.583α = 0.65 0.450 0.569 0.777 0.762 0.680α = 0.75 0.148 0.114 0.049 0.026 0.000
Table 4 gives the average proposed share of the budget allocated to the pub-lic good by treatment for all proposals and for equilibrium type proposals.22
It also shows the share predicted under the SSPE. Public good allocations areonly slightly smaller, on average, when going from α = 0.3 to α = 0.45. How-ever, the distributions are statistically different between these two treatments(rank sum test, p-value < 0.1 for all rounds and < 0.05 for rounds 10 andabove).23 All of the other pairwise comparisons of the distribution of publicgood allocations between treatments are statistically significant at the 1% levelor better. In particular, there is a statistically significant decrease in the bud-get share devoted to public goods going from α = 0.45 to α = 0.55 and thento α = 0.65, contrary to what the theory predicts.24 This difference, althoughrelatively small going from α = 0.45 to α = 0.55 is quite robust. For examplesuppose that we drop all the subjects who always propose only public goodswith α = 0.45 on the grounds that they are simply miscalibrated, which biasesthe average allocation against what the theory predicts.25 Then looking at thecross-over sessions, using own subject differences as the unit of observation,the average share of the budget allocated to the public good for all proposalsfor all rounds is 0.88 with α = 0.45 versus 0.78 with α = 0.55, and 0.89 versus0.83 in rounds 10 and above, with both these differences statistically significantat the 5% level. Going from α = 0.55 to α = 0.65, the decrease in the budgetshare going to public goods is quite dramatic, in large measure because of thelarge number of proposals allocating private goods to three players instead ofone. Finally, note the small share allocated to the public good with α = 0.75,close in size to the misallocation (but in the opposite direction) as in the allpublic good region (α = 0.3).
Within the mixed region, even conditioning on equilibrium type propos-als, the average proposed share of the budget allocated to the public good
22 Average accepted shares are quite similar to proposed shares, see Table 10 in the ap-pendix.23 Throughout the paper descriptive statistics use all the relevant data, with statisticaltests averaging all the observations for a given subject first, using subject averages as theunit of observation (except when regressions are estimated).24 This is established two ways. One way is using the ranksum test for all rounds exceptthose after round twelve. The other is using the Wilcoxon matched-pairs signed-ranks testusing data from the cross-over sessions. In both cases we can reject a null hypothesis of nodifference in favor of a smaller allocation with α = 0.55 at the 0.01 level or better.25 This accounts for 9 out of 25 subjects for all rounds and 11 out of 25 subjects for rounds10 or higher in the cross-over sessions.

Pork vs. Public Goods: An Experimental Study 13
Table 5 Theoretical Predictions and Observed Averages for Accepted Offers
Budget Share Payoffsα Public Private to Proposer Respondersa
Good Proposer
SSPEb 1 0 $24.50 $24.500.3 Average Allc 0.973 0.009 $23.96 $23.90
Avg. Eq. Typed 1 0 $24.50 $24.50SSPE 0.483 0.517 $20.93 $9.30
0.45 Average All 0.929 0.049 $18.99 $18.01Avg. Eq. Type 0.884 0.111 $19.51 $17.04
SSPE 0.583 0.417 $20.65 $9.180.55 Average All 0.886 0.080 $16.15 $14.19
Avg. Eq. Type 0.868 0.127 $17.17 $13.70SSPE 0.680 0.320 $18.74 $8.33
0.65 Average All 0.548 0.223 $13.95 $8.58Avg. Eq. Type 0.798 0.187 $15.86 $9.90
SSPE 0 0.68 $25.50 $3.000.75 Average All 0.179 0.319 $13.53 $6.27
Avg. Eq. Type 0.045 0.396 $15.25 $5.63
a Average over all 4 responders even when less than 4 subjects are allocated strictlypositive amounts.
b SSPE = predicted under the stationary subgame perfect equilibrium.c Average All = averages for all accepted offers.d Avg. Eq. Type = averages for equilibrium type offers.
decreases throughout. Although this contradicts one of the key comparativestatic predictions of the model, this reflects the absence of proposer power atanywhere near the levels predicted under the SSPE, consistent with the ratherlimited proposer power reported in earlier legislative bargaining experimentswith all particularistic goods. This in turn is related to the fact that proposersare sensitive to the level of earnings inequality that potential coalition partnersare willing to vote for (see Section 4.2 below).
Conclusion 3 Public good provision decreases monotonically throughout asthe value of private goods (α)increases, contrary to the model’s prediction thatwithin the mixed region public good provision increases as α increases. This istrue whether we consider all proposals or condition on equilibrium type pro-posals.
Table 5 gives the SSPE prediction in terms of public versus particularisticgood allocations, as well as the payoffs to the proposer and responder. It alsoreports the average for all accepted offers, and the average conditional on theaccepted offer being an equilibrium type allocation.26 Note that in the case
26 Up to this point, tables used all the data with the equivalent table restricting attentionto accepted offers in the Appendix. The advantage of using all offers is mainly increasedsample size (as well as the fact that conclusions are not materially affected using onlyaccepted offers). The reason for the change of focus here to only accepted offers is thatproposer power (which is what this table is used to study) is only relevant to the extent thatit can be exercised. If proposers ask for a lot, but their offers are rejected, then they do nothave proposer power.

14 Frechette, Kagel and Morelli
of α = 0.75, since the equilibrium calls for a MWC, responders payoffs mustbe multiplied by 2 to know how much coalition partners within the MWC arebeing offered.
Focusing on proposer power, the average payoff difference between pro-posers and responders is $0.06, $0.98, $1.96, $5.37, and $7.26 for the α equalto 0.3, 0.45, 0.55, 0.65, and 0.75 treatments respectively. Conditioning on theoffer being an equilibrium type offer, the differences are $2.47, $3.47, and $5.96for α equal to 0.45, 0.55 and 0.65, and $3.99 within the MWC for α = 0.75.Other than for all proposals with α = 0.3, the higher payoffs of proposers are allstatistically significant (p < 0.01 Wilcoxon matched-pairs signed-ranks test),with proposer power increasing as α increases. However, the higher payoffs rep-resent only a fraction of what proposers are predicted to take for themselves:21%, 30%, 33%, and 31% of what they are predicted to make with α equalto 0.45, 0.55, 0.65, and 0.75, respectively (percentages are for the equilibriumtype offers).
Conclusion 4 Proposers exploit their power by taking greater shares thanresponders in every treatment where they are predicted to do so. However,the level of proposer power is significantly less than predicted under the SSPEin all treatments.
To summarize, the theory performs well on many dimensions. First, sub-jects almost always agree on a division in round 1 as predicted. Second, thereis some proposer power in both the mixed region and in the all private goodsregion, and this increases as α increases. Third, the share of the budget al-located to public goods decreases going from α = 0.3 to α = 0.45 and fromα = 0.65 to α = 0.75. There are however four main deviations from the theory.First, the extent to which proposer power is exercised is far from what is pre-dicted in the SSPE. Second, in the α = 0.45 treatment the modal offer is anall public goods offer. Third, in the α = 0.65 treatment the modal offer in thelast three rounds consists of an equilibrium type offer, but this is not the casewhen all rounds are considered. Fourth, the fraction of resources allocated topublic goods decreases as α increases within the mixed region.
In the next section we focus on these differences from equilibrium pre-dictions within the mixed region. Of particular interest is the fact that thefraction of resources allocated to public goods decreases as α increases as thiscontradicts one of the key comparative static predictions of the model. Expe-rience with experimental outcomes has taught us, and most of the profession,that the main gravitational forces inherent in any given model will often be atplay even though the point predictions of the model are not satisfied. However,breakdowns in comparative static predictions are rarer, and are suggestive ofmore fundamental deficiencies, so that we take them much more seriously.
4.2 Deviations from Equilibrium Predictions in the Mixed Region
This section elaborates on the main factors we believe underlie the paucity ofequilibrium type proposals with α = 0.45 and 0.65, as well as the failure of

Pork vs. Public Goods: An Experimental Study 15
Table 6 Types of Proposals in Round 1
Number of Subjects Offered Private Allocations0 1 2 3 4 5
α = 0.3 0.68 0.00 0.03 0.08 0.05 0.18α = 0.45 0.11 0.11 0.02 0.18 0.00 0.18α = 0.55 0.25 0.18 0.00 0.23 0.05 0.28α = 0.65 0.07 0.07 0.00 0.51 0.04 0.31α = 0.75 0.04 0.04 0.00 0.38 0.08 0.46
.1
.2
.3
.4
.5
.6
.7
.8
.9
1 2 3 4 5 6 7 8 9 10 11 12
Period
Alpha = 0.3 Alpha = 0.45Alpha = 0.55 Alpha = 0.65Alpha = 0.75
Fig. 2 Fraction of Equilibrium Type Offers
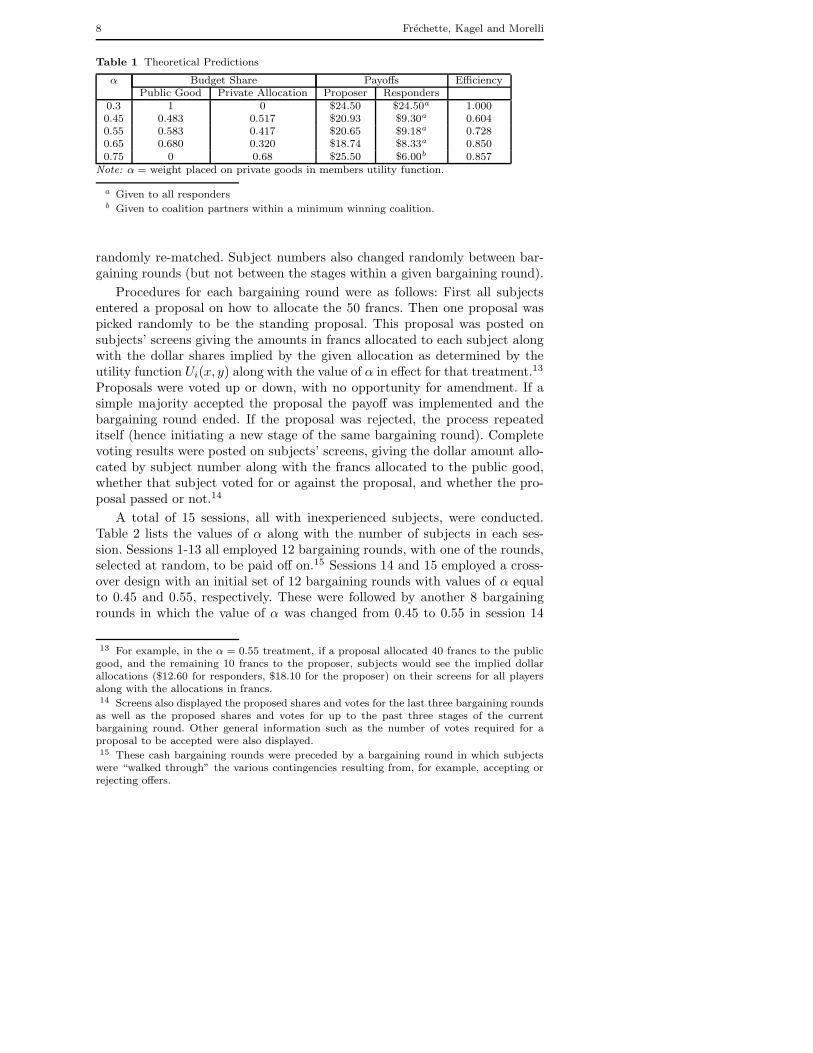
public good allocations to increase within the mixed region. First, for all valuesof α within the mixed region players’ first impulse is not to provide equilibriumtype allocations. This is shown in Table 6 which reports proposals in the firstbargaining round of each treatment: These average 12% of all proposals inthe mixed region, which is substantially less than the round one frequency ofequilibrium type proposals for α = 0.30 or 0.75. Further, as shown in Figure 2,there are steady increases in the frequency of equilibrium type allocations forall values of α within the mixed region, which, arguably, at least for α = 0.55or 0.65, would ultimately result in frequencies of equilibrium type allocationslike those reported for α = 0.30 and 0.75 as subjects gained more experience.In this context, one reason why the frequency of equilibrium type allocationsin rounds 10 and above within the mixed region are less than those found withα = 0.30 or 0.75 is that they have far more ground to make up compared tothese other treatments.
In addition to initial tendencies, voting patterns of responders place signifi-cant constraints on what kinds of proposals will be passed. In particular voting

16 Frechette, Kagel and Morelli
Table 7 Random Effects probit Estimates of the Determinants of Vote
α = 0.3 α = 0.45 α = 0.55 α = 0.65 α = 0.75Own Payoff 16.03*** 43.41*** 27.95*** 22.43*** 20.99***
(5.57) (6.81) (2.56) (2.02) (1.89)Payoff to the Proposer -6.28 -20.16*** -7.75*** -6.49*** -0.54
(5.68) (4.46) (1.60) (1.57) (0.97)Constant -2.71*** -5.05 -3.81*** -1.54*** -2.55***
(0.60) (1.47) (0.51) (0.54) (0.41)ρ 0.26§§§ 0.69§§§ 0.36§§§ 0.27§§§ 0.04
(0.12) (0.11) (0.09) (0.09) (0.09)Observations 380 528 640 528 480Number of subjects 40 60 70 55 50
Note: Standard errors in parentheses. * significant at 10%; ** significant at 5%; *** signifi-cant at 1% using a likelihood ratio test
behavior limits the amount of proposer power that can be exercised. Table 7shows this, where votes are regressed on own payoffs as well as payoffs to theproposer (votes of proposers are excluded from these regressions), the table
also report the estimates of ρ defined asσ2
α
σ2α+1
where σ2α is the variance of the
subject specific random effects.27 Own payoff is significant in every treatment.However, for the mixed region the proposer’s payoff has a negative impacton the likelihood that a proposal will be accepted. This limits the ability ofproposers to exploit their power. This is especially true for the α = 0.45 and0.55 treatments.
These voting patterns impact the growth of, as well as the nature of,equilibrium-type allocations that will pass in the mixed region. In particu-lar, they go a long way to account for the fact that for α = 0.45, all publicgood allocations grow faster than equilibrium type allocations (from 0.11 inround 1 to 0.53 in rounds 10 and above versus 0.11 to 0.40 for equilibriumtype allocations). With α = 0.45 the average payoff to proposers for equilib-rium type allocations that pass averaged $0.26 more than for an all publicgood allocation ($19.51 versus $19.25). This small increase in proposers’ pay-offs carries with it considerably greater risk of rejection, as 14% of equilibriumtype allocations are rejected for α = 0.45 as opposed to no rejections of anall public good allocation. Thus, for α = 0.45, there is little to be gainedfrom an equilibrium type allocation, with its attendant risk of rejection andbudget shrinkage, compared to an all public good allocation. In contrast, withα = 0.55 proposers earned $1.42 more than an all public good allocation, astronger incentive to provide equilibrium type proposals than with α = 0.45,with essentially no difference in the likelihood of these proposals being re-jected (a 13% rejection rate with α = 0.55, with the all public good allocationcontinuing to be passed 100% of the time.)
For α = 0.65 the main rival to an equilibrium type allocation is one inwhich there is a MWC with all private goods, albeit one with a reasonably
27 As such ρ measures the extent of the individual subject effects. ρ has a minimum valueof 0 (no individual subject effects) and a maximum value of 1 (all the variance in the erroris explained by individual subject effects).
Pork vs. Public Goods: An Experimental Study 17
Table 8 Budget Share Allocated to Public Good
α Median Voter Max EV Actuala PredictedIndifferent Proposer
0.45 78.8% 88.9% 87.1% 48.3%0.55 75.8% 83.8% 84.7% 58.3%0.65 70.7% 67.7% 76.2% 68.0%
a Equilibrium type proposals only; rounds > 9.
large share of the budget allocated to public goods as well (averaging 24% ofthe budget in round one for these proposals). It takes proposers some timeto figure out that they can get more from equilibrium type allocations thanMWC type allocations, while also having a better chance of their proposalsbeing accepted: $15.86 versus $13.86, with 85% of equilibrium type allocationspassed compared to 75% of MWC allocations.28
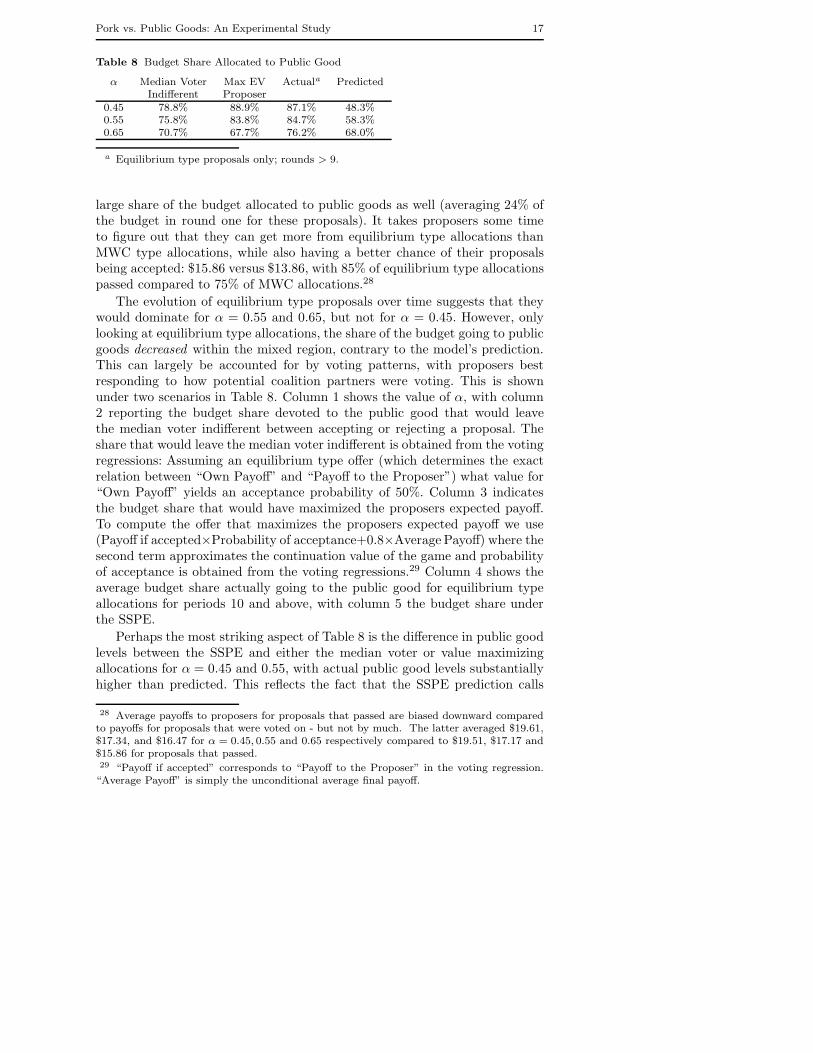
The evolution of equilibrium type proposals over time suggests that theywould dominate for α = 0.55 and 0.65, but not for α = 0.45. However, onlylooking at equilibrium type allocations, the share of the budget going to publicgoods decreased within the mixed region, contrary to the model’s prediction.This can largely be accounted for by voting patterns, with proposers bestresponding to how potential coalition partners were voting. This is shownunder two scenarios in Table 8. Column 1 shows the value of α, with column2 reporting the budget share devoted to the public good that would leavethe median voter indifferent between accepting or rejecting a proposal. Theshare that would leave the median voter indifferent is obtained from the votingregressions: Assuming an equilibrium type offer (which determines the exactrelation between “Own Payoff” and “Payoff to the Proposer”) what value for“Own Payoff” yields an acceptance probability of 50%. Column 3 indicatesthe budget share that would have maximized the proposers expected payoff.To compute the offer that maximizes the proposers expected payoff we use(Payoff if accepted×Probability of acceptance+0.8×Average Payoff) where thesecond term approximates the continuation value of the game and probabilityof acceptance is obtained from the voting regressions.29 Column 4 shows theaverage budget share actually going to the public good for equilibrium typeallocations for periods 10 and above, with column 5 the budget share underthe SSPE.
Perhaps the most striking aspect of Table 8 is the difference in public goodlevels between the SSPE and either the median voter or value maximizingallocations for α = 0.45 and 0.55, with actual public good levels substantiallyhigher than predicted. This reflects the fact that the SSPE prediction calls
28 Average payoffs to proposers for proposals that passed are biased downward comparedto payoffs for proposals that were voted on - but not by much. The latter averaged $19.61,$17.34, and $16.47 for α = 0.45, 0.55 and 0.65 respectively compared to $19.51, $17.17 and$15.86 for proposals that passed.29 “Payoff if accepted” corresponds to “Payoff to the Proposer” in the voting regression.“Average Payoff” is simply the unconditional average final payoff.

18 Frechette, Kagel and Morelli
for substantially more income inequality between proposers and respondersthan is achievable under either scenario: - income differences of over $11 inboth cases, with proposers earning more than twice as much as those theywould be counting on to vote in favor of such proposals. This is a level ofincome inequality that would stand little, if any, chance of passing (p < 0.01for α = 0.45 and p < 0.05 for α = 0.55 ), and which virtually never surfacedin the proposed allocations. Alternatively, consider the extreme scenario ofsimply keeping public good provision at the same level (70.7%) required tokeep the median voter indifferent with α = .65, for lower values of α: Thevoting regressions indicate that such a proposal would have had a 39.3% chanceof passing with α = .55, with an expected payoff to the proposer if passed of$7.50. In case of rejection, with the game continuing and δ = .8, a reasonableupper bound for what the proposer might expect after rejection is $12.60,compared to settling for an all public good allocation in the first place of$15.75, with all public good allocations always passing.30 Thus, given howplayers were voting, proposers would have had to be reasonably strong risktakers, for public good shares remaining constant (no less decreasing) in goingfrom α = .65 to α = .55. And they would have had to be even more risk lovingto keep public good shares constant in moving to α = .45. As such therewas hardly any room for public good shares to increase as α increased withinthe mixed region, reflective of the low levels of proposer power identified inearlier BF voting game experiments with only private goods. These low levelsof proposer power are, in turn, reflective of a breakdown in the assumptionunderlying the SSPE that only own income matters.
4.3 Discussion
In the case where α = 0.75 the results reported here are similar to resultsreported in previous experiments investigating the BF model. With α = 0.75the theory calls for an all private goods allocation within a MWC, which isthe modal outcome observed. There is some learning involved as the frequencyof MWCs is increasing throughout a session. The frequency of MWCs is verysimilar to results from prior experiments on multilateral bargaining with onlyparticularistic goods. For example, FKM (2005b) report between 61% and90% MWCs, depending on the treatment, with committees/legislatures of 3subjects, and FKM (2005a) report between 63% and 83% MWCs, dependingon the treatment, with committees/legislatures of 5 subjects. Here too thefrequency of MWCs grows, more or less continuously, throughout a session.Within the MWC, proposers obtain significantly more private goods than theircoalition partners, which is qualitatively what the theory predicts, but theyobtain much less than the SSPE predicts. The level of proposer power ob-served with α = 0.75 is close to what has been observed in previous legislative
30 The $12.60 comes from an all public good allocation which is greater than the expectedvalue of the SSPE allocation, the average actual allocation, or the average equilibrium typeallocation. With all payoffs multiplied δ.

Pork vs. Public Goods: An Experimental Study 19
bargaining experiments with all particularistic goods. Here, proposer’s takein a MWC is about 38% of the resources, while in FKL and FKM (2005a)proposers take about 40% of the resources under comparable procedures.31
Two additional results find a parallel in our earlier studies of the BF model.First, most bargaining rounds end in stage 1. That result has been observed inall of our prior experiments. Second, the fact that the proposer’s share, whichis typically greater than the shares offered to coalition partners, negativelyaffects voting has also been observed in one or more treatments in previousstudies of the BF model (FKL, FKMa, b).
The mixed region, where both public and private goods are provided, isrelatively narrow within the theory. It appears that it is even narrower behav-iorally, as (i) the modal choice just coming out of the all public goods region(α = .45) is still all public goods (with equilibrium type allocations comingin a close second) and (ii) MWCs with all private goods dominate proposalsearly on in the neighborhood (α = .65) of the mixed region close to the allprivate goods region. With respect to point (ii) however, learning is such thatin later bargaining rounds equilibrium type proposals constitute the modaloffer, with these proposals continuing to grow. In some sense it’s not terriblysurprising that the mixed region is narrower than predicted since in this caseequilibrium-type allocations are not quite so clear cut, unless subjects are do-ing the sorts of detailed calculations that the theory implies. Also note thatunder the constraints of having five players and δ = 0.8 (parameter valuesthat were selected in order to make the underlying bargaining structure closeto our earlier experiments with all particularistic goods), we selected q (thereturn on the public good) to make the mixed region as large as possible.
Our results have implications for the other regarding preference literaturein economics. First, the abundance of MWC proposals with α = 0.75 (also re-ported in previous experiments with only particularistic goods) indicates thatsubjects do not have a taste for maximizing the benefits for the least welloff as some have argued (Charness and Rabin, 2002; Englemann and Strobel,2004).32 Second, in the region where the model predicts only private goods,an all public goods allocation would have provided an egalitarian distributionthat was also a more efficient allocation (in the sense of providing more to-tal benefits) than an MWC with all private goods. Nevertheless, all publicgood allocations only accounted for 6% of all proposals overall, even thoughsuch proposals were almost certain to be passed. Rather subjects opted over-whelmingly for MWCs which provided greater benefits to the members of thecoalition than they could have gotten with an all public good allocation. These
31 Both experiments involved legislatures with 5 members with δ = 0.8 in FKL and δ = 1in FKM(2005a).32 Further, with respect to games with only particularistic goods Montero (2007) showsthat the standard models of other regarding preferences (e.g., Fehr and Schmidt, 1999)predict that proposer would exhibit even more proposer power than if subjects didn’t haveother regarding preferences, and this is in clear contradiction with the data in this experimentand previous experiments as well. See Bolton and Ockenfels (2005) for a recent discussionof the performance of different models of other regarding preferences in bilateral bargaininggames.

20 Frechette, Kagel and Morelli
results are inconsistent with recent suggestions from the other regarding pref-erences literature that subjects have a taste for efficiency (see, for example,Charness and Rabin, 2002). The primary difference between the present ex-periment and these other experiments is that the present experiment involvesbargaining and these other studies involved simple dictator games. The clearsuggestion from a number of dictator game experiments is that the results arenot robust to small perturbations in the game, no less in the results transfer-ring to bargaining environments.33
Our results have connections to VCM type public goods games. Eventhough there are radical differences in the structure between the present gameand VCM games, they do have in common a well defined marginal per capitareturn (MPCR) for public good allocations that provides a basis for compar-ing across games. There are several major, relevant characteristics to VCMgames with moderate numbers of players: (i) public good contributions typi-cally start rather high and then trial off over time but rarely are reduced tozero, (ii) the starting level of public goods contributions is often surprisinglyhigh but rarely exceeds 50% of the total possible contributions to begin with,and (iii) the level of public goods contributions is a decreasing function of theMPCR (see Ledyard, 1995 for a survey of the public goods literature). Withrespect to the first and second characteristics, sometimes our data matches it,other times it does not. Take, for example, the α = 0.55 treatment which hasan MPCR of 0.57, close to the 0.50 value often employed in VCM games. Here,the level of public good provision averages slightly over 80% of the maximumpossible contribution and is increasing over time rather than decreasing (86%of the maximum possible in the last several rounds), consistent with charac-teristics (i) and (ii) above (see, for example, Croson, 1996).34 In contrast, withα = 0.75, we have an MPCR of 0.23 which is close to the 0.30 level others haveused (see, for example, Isaac and Walker, 1988). In this case our results aremuch closer to those reported for VCM games as public good contributions aredecreasing throughout the session, and start out with public good levels thatare reasonably similar in the two cases (a little over 20% overall in our caseversus a little over 30% in Isaac and Walker with four players). Characteristic(iii), decreasing public goods levels with the MPCR decreasing, is commonto both cases, and provides one candidate explanation for the reduced publicgoods contributions in the mixed region, as subjects react in a “natural” way
33 Battaglini and Palfrey (2011) also reject the possibility that social preferences drive theirobserved deviations from equilibrium outcomes. However, a difference between our modeland Battaglini and Palfrey’s dynamic bargaining model is that risk aversion can produce themore equitable outcomes that they observe, whereas in the BF model risk aversion generatesmore unequal outcomes than predicted with risk neutrality (Harrington, 1990). If all playersshare the same risk aversion and this is common knowledge, then the continuation value ofthe game is lower with risk aversion (as compared to without risk aversion). This is becauseof the risk of being excluded from the winning coalition in future rounds of the bargainingprocess. Hence the proposer will offer lower shares to coalition members and keep morefor himself. This argument is similar to the argument of Montero for why other regardingpreferences lead a proposer to take more for himself in this game.34 Croson’s (1996) strangers treatment, which is what ours amounts to, has an initialcontribution rate of just over 40%.

Pork vs. Public Goods: An Experimental Study 21
to the reduced value of the public good. Of course, the overwhelming differ-ence between the present game and VCM games, particularly in cases such asα = 0.55 where the results are very different, is that in our case large publicgood provision is an equilibrium outcome, whereas in the VCM game its adominated strategy (assuming players only care about own income).
5 Conclusions
We investigated a simple model of public goods provision within a legislativebargaining framework. In the model, legislators/committee members have pref-erences over public and private goods that they must decide between given afixed budget constraint. (Taxes required to support the budget are exogenousto the model.) Our experimental treatment conditions focus on varying theweight subjects place on public versus private goods, spanning the range ofpredicted outcomes from all public goods, to mixed public and private goods,to exclusively private goods. We put special emphasis on the mixed region asit provides novel predictions in that private goods will only be allocated to theproposer, and public good provision will increase as the value of public goodsdecrease.
Many of the qualitative predictions of the model find support: Bargainingtypically ends in round 1, there is proposer power in all treatments (albeit, lessthan predicted), equilibrium type allocations tend to dominate throughout,and where they do not within the mixed region, they are growing over time.The one major qualitative failure of the model is that public good allocationsdecrease within the mixed region, rather than increase as the theory predicts.We have argued that this is reflective of much weaker proposer power thanpredicted under the SSPE, a result reported in earlier voting game experimentswith all private goods, as well as in the all private goods region reported onhere.
References
1. Austen-Smith D, Banks JS (1988) Social choice theory, game theory, andpositive political theory. Annual Review of Political Science 1:259–287
2. Banks JS, Duggan J (2000) A bargaining model of collective choice. Amer-ican Political Science Review 94(1):73–88
3. Baron DP, Diermeier D (2001) Elections, governments, and parlia-ments under proportional representation. Quarterly Journal of Economics116(3):933–967
4. Baron DP, Ferejohn JA (1989) Bargaining in legislatures. American Po-litical Science Review 83(4):1181–1206
5. Battaglini M, Coate S (2006) A dynamic theory of public spending, tax-ation and debt, mimeo
6. Battaglini M, Palfrey TR (2011) Dynamics of distributive politics. Eco-nomic Theory In this issue

22 Frechette, Kagel and Morelli
7. Battaglini M, Nunnari S, Palfrey TR (2010) Political institutions and thedynamics of public investment, mimeo
8. Bolton GE, Ockenfels A (2005) A stress test of fairness measures in modelsof social utility. Economic Theory 25:957–982
9. Charness G, Rabin M (2002) Understanding social preferences with simpletests. The Quarterly Journal of Economics 17(3):817–869
10. Christiansen N (2010) Greasing the wheels: Pork and public goods contri-butions in a legislative bargaining experiment, mimeo
11. Crombez C (1996) Minority governments, minimal winning coalitions andsurplus majorities in parliamentary systems. European Journal of PoliticalResearch 29(1):1–29
12. Croson R (1996) Partners and strangers revisited. Economics Letters53:25–32
13. Diermeier D, Gailmard S (2006) Self-interest, inequality, and entitlementin majoritarian decision-making. Quarterly Journal of Political Science1:327–350
14. Diermeier D, Morton R (2004) “Proportionality versus Perfectness: Exper-iments in Majoritarian Bargaining” in Social Choice and Strategic Behav-ior: Essays in the Honor of Jeffrey S. Banks, ed. by David Austen-Smithand John Duggan. Berlin: Springer. Forthcoming
15. Drouvelis M, Montero M, Sefton M (2007) The paradox of new members:Strategic foundations and experimental evidence, ceDEx Discussion Paper
16. Engelmann D, Strobel M (2004) Inequality aversion, efficiency and max-imin preferences in simple distribution experiments. American EconomicReview 94(4):857–869
17. Fehr E, Schmidt KM (1999) A theory of fairness, competition and coop-eration. Quarterly Journal of Economics 114(3):817–868
18. Fischbacher U (2007) z-tree: Zurich toolbox for readymade economic ex-periments. Experimental Economics 10(2):171–178
19. Frechette GR, Kagel JH, Lehrer SF (2003) Bargaining in legislatures: Anexperimental investigation of open versus closed amendment rules. Amer-ican Political Science Review 97(2):221–232
20. Frechette GR, Kagel JH, Morelli M (2005) Behavioral identification incoalitional bargaining: An experimental analysis of demand bargainingand alternating offers. Econometrica 73(6):1893–1938
21. Frechette GR, Kagel JH, Morelli M (2005) Nominal bargaining power, se-lection protocol and discounting in legislative bargaining. Journal of PublicEconomics 89(8):1497–1517
22. Goertz JMM (2006) Sequential demands in multi-issue legislative bargain-ing, mimeo
23. Harrington JE (1990) The role of risk preferences in bargaining whenacceptance of a proposal requires less than unanimous approval. Journalof Risk and Uncertainty 3:135–154
24. Isaac M, Walker JM (1988) Group size effects in public goods provision:The voluntary contributions mechanism. The Quarterly Journal of Eco-nomics 103(1):179–199

Pork vs. Public Goods: An Experimental Study 23
25. Jackson M, Moselle B (2002) Coalition and party formation in a legislativevoting game. Journal of Economic Theory 103:49–87
26. Kagel JH, Sung H, Winter E (2010) Veto power in committees: an exper-imental study. Experimental Economics 13(2):167–188
27. Leblanc W, Snyder J, Tripathi M (2000) Majority-rule bargaining and theunder provision of public investment goods. Journal of Public Economics75(1):21–47
28. Ledyard JO (1995) “Public Goods” in Handbook of Experimental Eco-nomics, ed. by John H. Kagel and Alvin E. Roth. Princeton: PrincetonUniversity Press, 111-194
29. Lizzeri A, Persico N (2001) The provision of public goods under alternativeelectoral incentives. American Economic Review 91(1):225–239
30. McKelvey RD (1991) “An Experimental Test of a Stochastic Game Modelof Committee Bargaining” in Contemporary Laboratory Research in Polit-ical Economy, ed. by Thomas R. Palfrey. Ann Arbor: University of Michi-gan Press
31. Montero M (2007) Inequity aversion may increase inequity. EconomicJournal 117(519):192–204
32. Morelli M (1999) Demand competition and policy compromise in legisla-tive bargaining. American Political Science Review 93:809–820
33. Potters J, Sefton M, Vesterlund L (2007) Leading-by-example and sig-naling in voluntary contribution games: an experimental study. EconomicTheory 33:169–182
34. Volden C, Wiseman AE (2005) Bargaining in legislatures over particular-istic and collective goods, paper Presented at the 76th Annual Meetingsof the Southern Political Science Association, January 5-9, New Orleans,Louisiana
35. Volden C, Wiseman AE (2006) Bargaining in legislatures over particular-istic and collective goods. American Political Science Review 101(1):79–92
24 Frechette, Kagel and Morelli
A Additional Results
Table 9 Frequency With Which Subjects are Allocated Private Benefits in Accepted Pro-posals
Number of Subjects Offered Private Allocations0 1 2 3 4 5
α = 0.3 0.88 0.01 0.00 0.05 0.01 0.04α = 0.45 0.55 0.30 0.00 0.07 0.02 0.07α = 0.55 0.34 0.45 0.02 0.11 0.01 0.08α = 0.65 0.15 0.28 0.00 0.46 0.03 0.08α = 0.75 0.08 0.04 0.00 0.59 0.04 0.25
Rounds 10 and Aboveα = 0.3 0.88 0.04 0.00 0.04 0.00 0.04α = 0.45 0.53 0.38 0.00 0.02 0.00 0.06α = 0.55 0.24 0.66 0.00 0.07 0.00 0.02α = 0.65 0.14 0.43 0.00 0.33 0.00 0.10α = 0.75 0.15 0.00 0.00 0.57 0.04 0.23
Note: Equilibrium Type Of-
fers are in Bold.
Table 10 Average Provision of Public Good for Accepted Proposals
All Proposals Equilibrium Type ProposalsAll Rounds Rounds > 9 All Rounds Rounds > 9 SSPE
α = 0.3 0.9725 0.9833 1.0000 1.0000 1.000α = 0.45 0.9290 0.9452 0.8838 0.8812 0.483α = 0.55 0.8862 0.8925 0.8680 0.8723 0.583α = 0.65 0.5484 0.7143 0.7976 0.8333 0.680α = 0.75 0.1788 0.1929 0.0447 0.0587 0.000