pore water pressure measurement in field investigations€¦ · sgi pore pressure measuring system...
TRANSCRIPT

ROYAL SWEDISH
GEOTECHNICAL INSTITUTE
PROCEEDINGS
No 13
PORE WATER PRESSURE
MEASUREMENT IN FIELD
INVESTIGATIONS
By
TORSTEN KALLSTENIUS and
ALF WALLGREN
STOCKHOLM 1956
ROYAL SVEDISH
GEOTECHNICAL INSTITUTE
PHOCEEDINCS
No 13
PORE WATER PRESSURE
l1EASURE1VIENT IN FIELD
INVESTIGATIONS
By
TOHSTEN KALLSTENIUS and
ALF WALLGREN
STOCKHOLM 1956
Ivur Hmggstriims noktryckeri AB
Stockholm 1957
Contents
Preface 5
sect 1 Fundamental Considerations 7
1 a Requisite Accuracy of Measurements 7 1 b Time Lags 8
1 b 1 Installation Time Lag 8 1 b 2 Measurement Time Lag 10
1 c Time Lag in Practice 13 1 c 1 Filter Design 14
1 d Special Considerations on Pore Pressure Meter Design 15 sect 2 Early Hydraulic Meters of the Institute 15
2 a Vasby Meter 15 2 b Surte Meter 17 2 c Experience with First Hydraulic Meters 20
sect 3 First Electro Pneumatic Meter of the Institute 24 3 a Principles 24 3 b Design and Use 26
sect 4 SGI Pore Pressure Measuring System 30 4 a Principles 30 4 b Instrument Connection 31 4 c Filter Pipe 34
4 c 1 Design 34 4 c 2 Filter Pipe in Practice 35
4 d Oil-Filled Pick-Up 37 4 d 1 Principles 37 4 cl 2 Design and Construction 38
4 e Electro Pneumatic Pick-Up 43 4 e 1 Principles 43 4 e 2 Design and Construction 44
4 f Recording Instruments 47 4 f 1 Ink Recorder 47 4 f 2 Optical Recorders 47
4 g Experience with SGI System 49 sect 5 Precision Pick-Up 54 sect 6 Conclusions 57 sect 7 Summary 58
Preface
This report contains a description of the development of pore water pressure
meters at the undersigned Institute during the period from 1947 to 1955 carried out by the Mechanical Department under the direction of its head Mr Torsten Kallstenius who prepared this report
During the years 1948 to 1950 Mr Henry Ericsson former Assistant Head lVIechanical Department was in charge of construction and tests After that
his successor 1V[r Alf VVallgren continued this work
Stockholm June 1956
ROYAL SWEDISII GEOTECHNICAL INSTITUTE
sect 1 Fundamental Considerations
Determination of pore water pressure is nowadays generally known to be in1portant in correct solutions of many geotechnical problems eg in dealing with the stability of foundations earthworks heavy storages and soil slopes which can be influenced by this pressure Furthe1 consolidation processes and seepage can be observed by means of pore water pressure measurements
Therefore pore water pressure measurernents should also be included m routine field investigations
This report deals with the development of the meters and the methods of measurement used by the Institute in its field investigations which are mostly made in clays
In our investigations the pore vater pressure meters arc provided with filter points at the ends of pipes which are more or less vertically installed The filter points permit the pore water to move freely while they keep the soil away from the measuring elements
sect l a Requisite Accuracy of ifeasurements
The requisite accuracy of pore pressure 1neasurements is determined by the problen1 to be solved From this point of view we can distinguish between two main types of problems
The first type does not generally require high accuracy In problems of this type the results are influenced by many factors other than the pore pressure Some of these factors are of statistical nature An example is the ordinary stability calculation when it is based npon sampling and determination of stratification etc It is evident that many of the factors involved in this case cannot be determined exactly A final result vithin an accuracy of say plusmn5 would at present be regarded as very satisfactory In problems of this type a pore pressure determination within similar limits of accuracy referred to the depth of the meter point below ground level is quite sufficient
The second type of problem which requires high accuracy or sensitivity deals with pore pressure alone In such cases if the problem is influenced by any other factors they are either empirically knmvn or of secondary interest
The second type may be exemplified by an area where the limit of stability has been indicated by slides caused by excess pore pressure I-Iere the changes in pore pressure should be measured very accurately This requires an instrushyment that is sensitive to small changes We should generally be satisfied with a sensitivity of say one per cent of the water pressure corresponding to the depth of the meter point below ground level Another example is the detcrmi-
7
nation of ground water seepage by means of pore pressure measurements in several points along a line In that case great accuracy is needed in order that different measurements may be combined so as to determine vater-level gradients
In problems of the latter type only a high sensitivity is sometimes desired but sometimes the requisite absolute accuracy must also be higher than in problems of the first type
We can specify our requirements as follows 1) An ordinary pore pressure meter should be able to measure the pore
pressure within an accuracy of plusmn5 of the depth of the meter point below ground level and should have a sensitivity that is about five times as high Such a meter would be sufficient for 1nost geotechnical problems In practice it should be simple and rugged
2) A precision pore pressure meter will be needed only for special problems of the above-mentioned second type or for research purposes Its accuracy and sensitivity should be as high as possible In order to ensure this it may be neccessary that the meter should be used by specialists in measurements
sect 1 b Time Lags
Important factors in the design -of pore pressure n1eters arc the time lags which affect the measurements in low-permeability soils These lags are of two different kinds VVe shall call them installation time lag and measuremcnt time lag Hvorslev has dealt with these questions in some reports1 2 which also contain bibliographies
sect 1 b 1 Installation Time Lag
The pore pressure meter pipes can be installed in two fundamentally different ways Either a hole is bored in the ground and the meter is installed and sealecl in this hole (cf Ref 1 p 78-81) or the meter is pressed axially into the ground In both cases the natural pore pressure is very much disturbed In the former method the influence of the installation upon the pore pressure is dependent on the method of hole boring and the pore pressure can be either increased or decreased If the pore pressure is in excess in so1ne thin layer there is a clanger of break-through from this layer to the neighbouring pervious layers In some cases such a break-through cannot be sealed afterwards VVhen the pipe is pushed down the danger of break-through is small but on the other hand the initial pore water overpressures near the meter point are very high The Institute normally prefers the latter method which is dealt with in what follows
l I-Ivorslev M Juul Subsurface Exploration and Sampling of Soils for Chmiddotil Engineering Purposes Vicksburg 194S (US Waterways Exper Stat)
2 Hvorslev M Juul Time Lag and Soil Permeability in Ground Water Observations Vicksburg 1)51 (US Waterways Exper Stat BuH No 36)
8
To estimate the excess pore pressure we may consider the idealized case of a solid rod with the radius R
0 cm penetrating into a medium having the
modulus of elasticity E kgcm From the theories of elasticity and plasticity one can deduce expressions for the interior pressure Omax required to increase the radius of a very small spherical or cylindrical hole to the radius Ro- Such expressions have been given by several authors Odenstad1 has applied the theories also for a sensitive material where the shear strength r1 is decreased to the value a middot rI in the plastic zone which surrounds the spherical hole For the spherical case the pressure should be
a = r middot plusmn(a In~+ 1) (1) rnax 1 3 3r
According to this expression Omax should be independent of the radius R 0 bull
A numerical evaluation of Eq (1) is dependent on the choice of the apparent modulus of elasticity E which in its turn ought to be dependent on e g the pore vater flow
EIf we put -- = 1 000 and a = 1 we obtain
3 I Omax 10 r 1 (2)
which is of the same order as the so-called Nc-value2
In a saturated clay the corresponding initial excess pore pressure ought to be slightly less than the value Omax given above Eq (1) however does not inshyclude such influences as dynamis forces skin friction gases in the soil etc In a clay with r1 = 03 kgcm2 ve have measured initial excess pore pressures of the n1agnitude of 25 kgcm2 which vould give Omax =8 Trmiddot
The zone of excess pore pressure will in practice extend to a boundary situated at a certain distance from the rod Frmn theory it can be inferred that the radius of this zone is roughly proportional to the radius of the rod or pipe
After the pipe has been installed a consolidation process begins This causes pressure gradients which generally decrease with the time The time required in order that the excess pore pressure shall decrease to a certain definite value is the installation time lag This value depends on the problem and correshysponds to the requisite accuracy in other words it depends on the permissible error in measurements
The consolidation time varies within wide limits with many factors Thereshyfore ve have confined ourselves to a few simple tests
Fig 1 shows the results of an experiment made to find out the installation time lag as a function of the diameter of the pipe Two pipes which were different in diameter but equal in filter area were pushed down 10 metres into a saturated clay having a permeability of r-v 10-s cmsec Pore pressure measure-
S Odenstad Spanning och deformation i en oiindlig rymd (Slress and Deformation in an Infinite Space) Stockholm 1051 Unpublished
See for instance E G 1Ieyerhof The Ultimate Bearing Capacity of Foundnlions - GCotechshynique 1951 Vol 2 Nr 4bull p 301-332
1
9
o 02 03 04 05 2 3 4 5 10 20 30 40 Days
Time after installation of pipe
Fig 1 Test for determination of installation time lag
ments were made with identical interior systems Thus the difference between the observed values gives the difference in time lag We notice that equal pressures are obtained after four days with the 0 42 mm pipe and ten days with the 0 60 mm pipe This seems to indicate that the influence upon the time lag is roughly proportional to the square of the pipe diameter W c also tried to keep the interior of the pipe open to facilitate consolidation but the effect was not very noticeablc
Installation time lags varying from a few minutes to hvo weeks have been observed in practice
In cases where the installation time lag is of great importance the diameter of the meter point and the diameter of the parts of the meter close to this point should be as small as possible
sect 1 b 2 Measurement Time Lag
The amount of energy which is required for n1casurements is in the present case taken from the pore water which must enter or leave the pore pressure meter when the pore pressure changes As the pore vater flows through the soil pressure losses will arise They cause gradients which will gradually decrease if all other conditions remain unchanged
These pressure losses determine that maximum rate of pore pressure change with the time at vhich the meter gives an indication that is correct within a desired accuracy A theory specially adapted to our requirements is briefly expounded in what follows
1 Deduced in co~operalion with Mr Justus Osterman Head of the Institute
10
vc suppose that a soil is saturated with water is free from gases and has a pore pressure== us gcm2 bull ~re assume a pore pressure meter to be installed in this soil and to give at a certain definite moment a pressure reading ui gcm2 bull
We put ~-u=Llu w
where obviously L11t is the error in gcm2 bull In many cases u8 1nay be regarded as constant but it is mostly variable with the time (t)
~=1(0 W From Eqs (3) and (4) we obtain by differentiation with respect to the time
iJJu iJj(t) iJu _Jt = at - Jt ( ~)
If the pore water volume entering the meter per unit time is V11 cm3sec and if the meter requires the volume f) em3 to alter its reading one gem2 (f is by us called volume factor and has thus the dimension cm5 g) then vc obtain
V=~middot e (6)
In the soil around the meter point the flowing pore water causes certain pressure losses which give the pressure gradient
i = i)~ = = le~ (7)
where v is the flow velocity in cmsec k is the coefficient of permeability in cmmiddot1g sec r is the distance in cm from the meter point to a certain definite soil element and Ji is the area in cm2 of a sphere with the radius 1middot ve consider the filter area (A) to be represented by an equivalent radius r
0 Thus A=bull
== 4-rr Further we assume the soil layer to have large dimensions The water flowing
to the meter is assumed to come from a great distance These assumptions are allmvable as we intend only to form an estimate of the measurement time lag
From Eq (7) we obtain
= L1 u = __ middotJ dmiddot (8)
4nmiddotk r
Combining Eqs (6) and (8) gives
e iJuLlu= -~= (9)
2kl1rA 0
Jt By combining Eqs (5) and (9) we get
d L1 U + 2 le v--x bullAU= f (t) ( )10iJt e iJt
11
From Eqs (3) (5) and (10) we can immediately find the pore pressure(= u)
e du~=u+-~=middot- (lOaj 2cVnA dt
Eq (10 a) makes it clear that the meter will indicate the pore pressure in the soil correctly at maxima or minima in lti This does not mean that the maxima and minima of u arc obtained directly but they can be calculated from Eq (10 a)
By solving Eq (10) we get the general expression
1 0 ( 2kVrrA ] 2kVrrAQ f t) --r-r--middott - ~--middott
du= (du)-+ f Jt e middotdt e (11) [
Ve are now particularly interested in two special cases Firstly there is the case where us is constant while at the time t == 0 ui differs from this value by 6 1i
0 bull Here we can calculate the time T in seconds corresponding to a
certain maxilnum permissible error Li ur T can be regarded as the measureshyment time lag in this ease Eq (11) can then be transformed into
e du1 --==middot In - (11 a)
2kVnA dur
Secondly there is the case where we want to know the maximum permissible
rate of change J)u at which du is less than the permissible error du We can l t
obtain a simple solution if ve assume that the pore vater flow is constant ie Lht == L1 uT == a constant
By solving Eq (11) we obtain
an edu=-middot (11 b)
dt 2cVnA
which is closely related to Eq (10 a) This expression-although a simplifishycation-is useful if ve have plotted a diagram representing the pore pressure as a function of the time and if ve want to know whether the meter has been sufficiently responsive
From Eqs (11 a) and (11 b) we find that the time lag in saturated soils which
are free from gases is determined by the instrument ( ~) by the soil (le) 2 nA
and by the type of problem (dur) It may be useful to illustrate Eqs (11 a) and (11 b) by some calculations
Let us for instance con1pare the cases below
12
Case I An open pipe 6 cm in outer diameter and 5 cm in inner diameter combined with a filter 6 cm in diameter and 30 cm in height
Case II The same device as in Case I except that the inside diameter is decreased to one cm
Case III The same device as in Case II except that the inner system 1s closed and the 1neasurements are made vith a Bourdon gauge
Case IV The same device as in Case III except that the height of the filter is decreased to 5 cm
In all these cases we measure in a clay with k == 10-s cm4 g sec (or cms)
The calculation is given in the table below
Case Volume factor 0
cmtgtg 2nA
cm dur
gcm2
du dt
gcm sec
Time lag T ford u0 = 40 gcm2
I 195 84 20 086 bull 10-G 18G days
II 078 84 20 022 middot I0-4 74 days
III 3 -10-4 84 20 056 -10-1 41 min
IV 3 bull 10-4 343 20 023 middot 10-1 10 min
This table shows that the open pipe in Case I can hardly be used in soils of low permeability Leakage even if small as well as rain water evaporation condensation etc can cause errors which make the measuring results unreshyliable even if the pore pressure is very stable
The narrow open pipe in Case II can probably be used for measuring fairly constant pore pressure It is not advisable to decrease the diameter any further because air bubbles might block the pipe
The replacement of the open system in Case II by the closed system in Case III has a considerable influence on the measurement time lag
It is probably significant for practical measurements that the changes in the volume factors are greater and hence have a greater influence on the results than the normal differences in filter area
sect 1 c Tiine Lag in Practice
In practice the permissible time lags depend on the rate of change in pore pressure with the time
Dynamic problems require extremely small volume factors (sect 1 b 2) None of the instruments discussed in what follows can be applied to such problems
Rapid pore pressure changes in thick layers of low-permeability soils are generally caused by changes in external loads In a large area this can be due to landslides changes in water table above ground level heaped stores and also to rapid erection of buildings etc Locally rapid pore pressure changes may be caused by pile-driving sampling or field testing drainage excavations etc
13
In most of the above cases it is better to use a pore pressure meter having a very small volume factor (eg that in Case III sect 1 b 2)
Slow pore pressure changes can be presumed to occur when large 10v-permeshyability soil masses consolidate under fairly constant conditions For such problems the meter used in Case II would do It is however often economical to save time by quick measurements Small time lags are also technically valuable for correct evaluation of the pore pressure changes In practice it is therefore always recommendable to use meters vhich have the smallest volume factors possible without being too intricate or expensive1 ve think a volume factor of 03 to 1o middot 10-3 cm5g is economical for a normal instrument intended for use in low permeability soils
In sand where the permeability is high 1nore rapid changes in pore pressure may probably occur Nevertheless volume factors of the order of 10-2 cm5g may be expected to be suitable for sand
Instruments vith a membrane which is pressed back to a zero position at the moment of 1neasurement 1nust cause great pore water flow and correshysponding errors in measurements In soils of low permeability such instruments should not be used They arc not ineluded in this report
1 1 c 1 Filter Design
If the pipe is pushed down the diameter of the filter should be a little smaller than that of the pipe
Now two contradictory requirements concerning the pipe diameter have been stated in sect 1 b A small installation time lag requires a small diameter of pipe and a small measurement time lag requires a great filter area and hence preferably a great filter diameter
Provided the meter has a small volume factor (sect 1 b 2) we may use a fairly small filter area and the diameters of the pipe and the filter should therefore be reduced as much as is practically possible without jeopardizing the strength and the rigidity of the iustallation
The optimum length of the filter depends on the type of problem For instance if we want to measure the pore pressure in a thin soil layer of high permeability surrounded by a soil of low permeability it is most probable that the permeable layer will be found by using a fairly long filter The time lag calculations in this case must be based on a reduced filter area In another case such a long filter may form an undesirable passage between two adjacent layers differing in pore pressure
Although a long filter has the greatest filter area at a given diameter a short filter affords more reliable information on the level of 1neasurement has a higher strength and is easier to construct
1 Vihere stationary pore pressure can be predicted and only a few readings are required one can use meters whith measurement time lags as large as the installation time lag Then instrushyments according to Case II will be economical One must however be careful when assuming stationary conditions as ground water flow may exist even under rather leYel water surfaces
14
sect 1 cl Special Considerations on Pore Pressure Meter Design
vhen studying available literature on pore pressure measure1nents one is surprised by the great scarcity of data on the accuracy and sensitivity of 1ncasurcmcnts This report contains some such data
The error of the pore pressure meter (J1 gcm) can be given as a numerical value in n1etres of water colun111 or in 1netric t111 This establishes a simple relation with the soil problem and the error can easily be calculated as a pershycentage of the depth of the meter point below ground level The sensitivity of the meter ie the smallest change in pore pressure that can be measured with certainty is related to the error and should preferably also be expressed in the same units
According to sect I b 1 the installation time lag seems to vary approximately as the square of the tube diameter Therefore the cross-sectional area (Lit in cm) of the tube near the meter point may be supposed to have an important influence on this lag
From Eq (11) sect 1 b 2 we can obtain the factors which influence the measurement time lag From the point of view of meter design ve have to consider only the volume factor apart from the filter The examples in sect 1 b 2 showed that for general design purposes it is sufficient to know the order of magnitude of these factors
The square root of lhc filter area can be represented by the nominal filter diametcr1
2 r0
(sect 1 b 2) This is the diameter of a sphere whose area is equal to the filter area
Normal pore pressure meters must combine simplicity in operation with long-time stability The use of electrical methods involving resistance cashypacitance inductance or frequency can be deemed not to be desirable since these methods arc not simple enough to permit untrained persons living near an installed pore pressure meter to be charged with taking readings In order to avoid great costs involved in sending qualified observers to far-off places the meter must therefore be simple The meters should not be touched during the measurements
To prevent clectrogalvanic currents and chemical action all parts near the n1eter point should be made of the same n1etal or of noncorroding material
sect 2 Early Hydraulic Meters of the Institute
sect 2 a Vlisby JIeter
In the beginning of 1048 the Institute wanted to measure pore water pressure in connection with a large-scale field test concerning accelerated consolidation of clay For this purpose the meter shown in Fig 2 vas designed and conshystructed
The principle of this meter is that pore water enters a chamber via a filter The chamber is extended to the soil surface by a pipe provided with a pressure
15
De-oer-oton ----~FEfc screw
Bourdon gouge
Steel pipe _______
De-oeroted water ------fsJ--1~
Aspholl cooling -------41
Bross tube ----------lJ
Porous stone -----------1
-ngtmiddot
r Soil surface
E
a
Insulating cover
Concrete well ring~
b
Fig 2 Pore pressure meter type Viisby a Longitudinal section b Meter installed
16
gauge at the top This meter indicates the pore pressure minus the pressure of the water column between the filter and the pressure gauge
The filter is a porous stone 38 mm in diameter mounted in a bronze fitting This fitting is extended upwards by means of a copper tube 8 1nm in inside diameter which ends in a top piece with a Bourdon gauge a glass pipe with a de-aeration screw and a reserve connection for a check gauge
These parts form a system the inner system that is filled with water Care is taken to permit gas bubbles to rise to the top where they can be observed and expelled by adding water The inner volume is made as small as possible to decrease the influence of thermal expansion of the water and to diminish the amount of bubbles formed when the pressure drops or the temperature rises The inner system is protected by an outer system The lowest part of the latter is a brass tube 50 cm in length extended upwards by means of a steel pipe with a compressible steel hose
Shortly after the first field use the external surfaces were coated with viscous asphalt This was done in order to prevent the soil which is settling during consolidation from adhering to the pipe since this would result in an extra load on the meter point and cause a subsequent pore water overpressure
The meters were manufactured in single lengths without couplings filled with de-aerated water and checked in the factory All joints were carefully sealed During transport the filter stones were sealed with rubber coatings
In order to avoid thermal influences the upper parts of the meters were after installation enclosed in wells about ls 1netres in depth below ground level and were insulated by wooden covers
Four meters were in use and all gave results deemed to be reasonable judging fron1 calculation of stresses fr01n determination of settlements due to overload and fron1 testing shear strengths The installation time lag was not specially studied
The instrument data were as follows (cf sect 1 c)
Range - 4 to + 10 metres of vater column Estimated error plusmn 10 cm of water column Estimated sensitivity 5 cm of water column Cross-sectional area of tube (111) 15a cm2
Nominal filter diameter (2ro) 3a cm Volume factor (El) 04 middot 10--1 cmg
sect 2 b Surte lleter
The Vlisby meter vas developed in several steps towards greater handiness The final meter of this type is shOvn in Fig 3 It was first used in connection with investigations made after the landslide at Surte1 and is therefore called the Surte meter
The site is described in Proc No 5 of the Institute 1
17
Tube Joint ------fj((j)tj
f
Wooden covers
)feel ---~---+ibull Asbestos cement pipe~ LL
[
A5pholt cooling----bull
Copper tube 4gt 2 mm----
$42 mm a b
Fig 3 Pore pressure meter type Surte a Longitudinal section b Meter installed
18
kgcm
Oa
04 L
L a 0 u
Q_ a
lt( - 04
-0~
3-020 -010 0 +010 +020 +030 cm
Volume change
~ u
~ -- _with water Immediately after filling
bull ~
x
- After 26 days V
deg
----X r---_ X
X
bullX-x- f- x- - -- -- ~x
Fig 4 Variation in volume with pressure in Surtc meter with 3 ni of tubing
The inner and the outer pipes of the Surtc 1ncter were assembled in the field from pieces of convenient lengths The meter was not surrounded by a flexible hose The top piece was simplified as compared with that of the Viisby rnetcr Besides the inner volume was increased
The characteristic data of the Surtc n1eter are almost the same as those of the Viisby meter In reality hmvevcr the measure1nent time lags of the Surtc meter arc probably greater owing to increased risk of gas bubble development in the system
Fig 4 shows the volmne changes corresponding to different pressure readings in a meter with 3 metres of tubing calibrated in the laboratory The dash-line curve shows the results of tests made immediately after filling with distilled water The volume factor 6J (sect 1 b 2) on the pressure side is small about 1 X 10⁻¹ cmrig On the vacuum side the volume change increases at a rate higher than the linear as the vacuum increases after a certain definite point
06 kgcm2) Below this point we must assume difficulties due to gas bubbles
19
The full-line cnrve shows the results of testing the same device after 20 days rest On the vacuum side the volume change tends to increase as the pressure decreases lrhich indicates that gases must have be0n present
The main part of the water volume was contained in the 3 metres of tubing If we had used longer tubing the presence of gases votdd have involved a considerable risk of blocking by large bubbles
On the pressure side ve also observe a si1nilar but smaller influence of bubbles
The Surte meter vas in the beginning extended one metre above ground level
As the meter was not protected against frost its upper parts were filled with oil in the winter Later on we found it desirable in this case too to enclose the upper parts in wells so as to decrease thermal influences
The 1neter was normaily pushed down by chain jacks llanunering was avoided lest the joints of the inner system should loosen and leak In spite of its considerable temperature sensitivity this meter proved to be a suitable tool in many cases However it has now been replaced by the meters described further on in this report
sect 2 c Experience with First Hydraulic Meters
The Viisby meter vas not read so systematically as to permit any special conclusions Because of its similarity to the extensively used Surte 1neter the experiences relating to this meter may be supposed to be applicable to both types of meters Figs 5 to 8 give some values observed with our Surte meter
Figs 5 a-e show typical examples of the pore pressure rneasurements made on a building site close to the site of the Surte landslide The soil consisted of elay with sand layers The elay had a permeability of about 10-s cmsec Open pipes had been installed in the sand layers and pore pressure meters of the Surte type were used in the clay
Fig 5 d shows the results obtained from an installation in a fairly thick elay layer The installation time lag seems to have been about six clays (cf also Figs 7 and 8 which refer to similar conditions) In Fig 5 a the installation time lags are smaller owing to a higher average permeability of the soil
During hot sunny days followed by cold nights the temperature influence was sometimes annoyingly great (plusmn 01 kgcm) In such eases the readings had to be taken frequently during 24 hours and diagrams representing pore pressure readings versus temperature had to be plotted
Fig G shows the pore pressure measurements in a elay fill for a road embankshyment Here two Surte meters had been installed at small depths The air temperature was measured at the same time as the pore pressure Ve see that the meter situated at a depth of 2s m was dependent on the temperature It
20
U-D
U
-D
U-D
U
-D
_-7
-1
0
-4
-2
-I
o~
~~
ro~
I
lr 9
~ bullbullbullbullbullbull
-1
-_o
_ltgt
+-a-+
- - 0
5 10
doy
s
o s
urt
-met
er
48
m
o --
-- 1
1lm
I
o
Ope
n p
ipe
8
6 m
o
sv
rte
-met
er
3~
mc10
Y o
__
_
_
64
m
o _
_ _
_
9amp
m
U-D
U
-D
----1
40
m
6coo
cd s
odcc
e -2
-1
15
0 f euro
1~foce
-r__
__-
1
--middot
-
bull
bullr
amp
-
+-d
-+Clo
yl
- o
Lo
I0
-4
L--------~
0
s 10
day
sSa
nd_
I
10
Clo
y
Clo
y
Clo
y
Clo
y
Clo
y
l_C
lqy_
Sm
d
0 D
-0
-I
+-6
-+
U
-D-1
_ ~ 0
S JO
day
~ I
~ middotmiddot
middot I-lt
---e
-
-1
D
AT
o
middotsur
1eH
-met
er
3s
m
o --
--4
~m
10
0
5 10
day
s x
Ope
n pi
pe
7o
m
D
o H
Sur
te-
met
er
4o
m
o _
_ _
_
7om
U-D
U
-D
x O
pen
pipe
6
0 m
CG
roun
d su
rfo
ce
-2
-I
0 D
Sand
bullS
and
D-01
middotmiddot i
middot
bulli
bull -1
+
++
+
++
i++
~+
bull
-2 ~
--~
---~
---~
0
10
15 d
ays
L
eq
en
d
U =
Po
re p
ress
ure
in
me
tric
tjm
~
on
filt
er
leve
lO
pen
pipe
5
1 m
_
_
_bull
6em
D
=D
ep
th
be
low
g
rou
nd
su
rfa
ce i
n
m
10
D
Fig
5
Por
e pr
essu
re m
easu
rem
ents
on
a bu
ildi
ng s
ite
at S
urte
(N
ovem
ber
to
Dec
embe
r 1
950)
1-
l
Coy
Q_
~n
d
Clo
y
D
10
10
U -0 0
- I
-2 middot-middot--d----+-~-~-~ _ L____pound~-middotmiddot_bull_-_bull-_bullJoL___~middotLbullbullcc_c_~---~---~
0 10 15 20 25 30 35 days a
c Jampgend ~---~---~---~---~---~---~ U Pore pressure in metric Vm1
D Depth below ground surfoce in m
Both melers m cloy
b Fig G Jfeasurernents with Surte meter in an embankment on National
11fain Road No G Finlosa-IlOgcu in southu)cstern S1Lmiddoteden (December 11)53 to Tanuary 1951)
a Pore pressure measurements b Air temperature measurements
_CJ 4 iJmiddot - - I - -_
I
Legend
u-o U Pore pressure in metric Vm D -- Depth below ground surface in m
bull 4
bull 2
bull 1
0
- 1
- 2
l Meiers lengthened 15 m upwards_ ---X--- Meler No I 0 Meter No2
bull ~ 1
Ground surfoce gtlt-- - t-~-X--_ _
--gtlt---4
0 5 10 15 20 25 30 35 40 45 days
Fig 7 Tests to denwnstrate the value of thermal insulation (two Surte meters in clay at EnkOpi11r1)
22
U -0
4
0 0 4 6 8 10 days
bull i ~
I bull bull Ha
u-o II
10
9
Legend
_~ bull
U _ Pore presvre in metric Vm1 4
D = Depth below ground surface in m
0 0 2 4 6 10 days
b Fig 8 Pore pressure measure11ients with four Surte meters in clay
at Lilla 1tliillOsa (9 to 29 December 1954)
a Two meters filled with water after installation b Two melers filled with water before installation and kept under an internal
oyerpressure of I kgcm~ during installation
seems that the meter situated at a depth of 3s m might also have been temperature-sensitive but this was delayed about two days
An experi1nent to demonstrate the value of thermal insulation is shown in Fig 7 Here the measurements were made in clay at a depth of 6 m Two Surtc meters had first been installed with the gauges in a shallow pit The measurements showed an installation time lag of about five days and then almost constant values during about 25 days After that both meters were extended upvtards Ls m without any other change The gauge was now situshyated above the ground surface Then the measurements began to vary in a similar way as those in Fig 6 middot This indicates that the thermal insulation of the meter is very important
Fig 8 shows the results relating to four Surte meters installed in clay (permeability 10-8 cmsec) about 40 km north of Stockholm All these meters
23
had their filters at a depth of about 5 m Two n1eters were installed in a normal way (Fig 8 a) while the two other meters were kept for special reasons at an internal overpressure of 1 kgcm2 during installation The installation time lag was about a week in both cases The curves see1n to be fairly smooth
The measurements indicate that closed hydraulic meters should and can successfully be insulated so as to protect them against temperature changes Insulation has therefore been the standard practice at the Institute during the past few years
sect 3 First Electro Pneumatic Meter of the Institute
If the ground water table (static height of pore pressure) lies below the pressure gauge then pressures below the atmospheric will arise in the inner system of a water-filled pore pressure meter Even at a difference in level of about 3 to 5 m troubles clue to gas bubbles in the water begin to be serious vhen using the meters described in sect 2 At a difference of 6 to 7 m the measureshyments arc practically impossible (cf Fig 4) 1
To enable measurements of very low ground water tables our first electro pneumatic meter was designed and constructed
sect 3 a Principles
The measuring system is shown in principle in Fig -9 The pore water passing through the filter stone exerts a direct pressure
on a membrane the lovier 1nembrane which is deflected upwards Above this there is an upper membrane which can be deflected downwards by compressed air Each membrane is provided-with an electrical contact
By means of the contacts attached to the two membranes it is possible to determine the air pressure required to deflect the upper membrane so much that its contact just touches the contact of the lower membrane The more the latter is deflected by the pore pressure the less the upper membrane needs to be deflected The air pressure is regulated and read on the soil smface
The electrical system consists of a dry cell a milliammeter and an electrical res1Sta11ce all connected in series in a circuit including the contacts on the membranes The circuit can be short-circuited for checking by means of a push-button switch
The measurcn1ents are made by slowly increasing the air pressure- above the upper membrane until the milliammctcr indicates that contact has only just been established in the pick-up This procedure can be repeated in order to ensure reliable measurements
One can of course increase the range a little by using measuring systems where waLer can be circulated to remove air bubbles We beliemiddote it to be difficult to avoid pressure disturbances when handling such systems in low permeability soils
l
24
Air pressure gouge
Dry cell
Resistance
Shari-circuit switch
~--- Air filter
Air pipe also serving as electrical conductor--------tt-il
Pressure chamber-----
Lower membrane ______
Filter stone _______
Fig 9 Principle of the first electro pneumatic meter
25
Bakelite
Insulated by-pass WC-L-4-- Rubber membranes
Hardened steel membranes
middot ifrac34U65mm
Fig 10 First electro pneumatic pick-up Longitudinal section
sect 3 h Design and Use
The electro pneumatic pick-up is shown in Fig 10 The 1nembranes consist of thin hardened steel plates resting on ring-shaped surfaces Thin rubber membmnes act as gaskets The total deflection of each membrane is 0ss mm
The contacts are made of platinum and are carefully tested Fig 11 shows one of several tests indicating the accuracy in determination of travel by means of these contacts VVe obtained an accuracy in 1neasurements of about plusmn 0001
26
_ mm-10
16 gt 140 ~
-- 12-u 0-C
IO I-
0 u 8
f Contact closed
-------- ---- ---- ----
L Contact broken
I I I I I
~
middot ~
I I
5 IO 15
Number of operations
Fig 11 Accuracy of contacts
1nm regardless of whether the contacts worked in air or in oil This is equal to about 02 of the delectiou range of the membranes and may be expected to be satisfactory in most cases
Originally the air was supplied by an ordinary hand-pump with a filter for drying and cleaning the air The air pressure is read on a Bourdon gauge The air is fed to the pressure chamber through copper tubing which also serves as an electrical conductor connecting the dry cell to the upper contact The pipe is electrically insulated by means of plates spaced Ls m apart The lower contact is connected to the protection pipe which serves as a return conductor leading to the dry cell
The details of the meter are seen in Fig 12 To deal with a special problem one meter was made with a wide range
extending from 0 to 95 metres of water column The calibration curve of this meter is shown in Fig 13 This meter was slightly temperature-sensitive because of the air volume enclosed between the two membranes This was deemed not to be serious as the pick-np would be situated at levels where the soil temperature is nearly constant
The instrument data are
Range 0 - 95 m of water column Error plusmn I m of water column (mainly due to the
pressure gauge) Sensitivity 20 cm of water column (mainly due to the
contact) Cross-sectional area of tube (A 1) 196 cm2
Nominal filter diameter (2 rol 3s cm Volume factor (6)) 04 middot 1Q-4 cm5g
The meter was used in an investigation at lio i Rana Norvay The operator made a number of measurements without troubles but had once to hammer the meter down with a few blows On account of this and maybe also owing to excess pore pressure the contacts were slightly damaged Therefore it
27
Fig 12 Details of the first electro pneumatic meter
a Hand pump with air filler b Top piece with Bourdon gauge c Contact checking device d Conductor with insulation e Pick-up with filter stone f Calibration diagram
28
U kgjcm1
10
9
8
7
6
5
4 ~ 0
- )r+17 C 3 0degctmiddot~~ 2
- - -- X ----
t-- x
I-- x
I-0
0 o 04 06 08 10 12 14
Air pressure
Fig 1J Calibration cune of the first electro pneumatic 1neter
became necessary to use a special protection pipe (Fig 14) with a filter stone This pipe was first driven into the soil Afterwards the meter with its pipe was inserted in the protection pipe until close contact was established between two conical surfaces This worked but was not convenient
The pressure pick-up was reliable during short-time tests but its calibration curve showed a tendency to change during long-time measurements This was found to be due to the fact that the air from the space between the membranes diffused through the rubber membranes
The first electro pneumatic meter was soon discarded as the Institute deshyveloped a new system of pore pressure measurements which is described in the follmving section
29
middotmiddot-tmiddotmiddot Conical disc
Rubber gasket
Conical seat
11----- Protection pipe
-4---- Ordinary meter
14---- Water
gasketRubber
Fig 14 First electro pneumatic meter Protection pipe
sect 4 SGI Pore Pressure Measuring System
sect 4 a Principles
In September 1950 it was conceived that a connection which could be used for pore pressure meters to join in situ the pipe with the filter to the 1neasuring element (situated as close to the filter as possible) would give several advanshytages
On the basis of such a connection between the filter pipe and the instrument the Institute has since developed a pore pressure measuring system-here called
30
the SGI system-which can be flexibly adapted to most field investigation requirements
The main advantages of this system are a) The filter tube can be installed without the instrument Therefore the
risk of damaging the instrument by dynamic forces or excess pore pressure at the meter point during installation will be eliminated
b) At any desired moment the measuring instrument (pick-up) can be calibrated or checked simply by disconnecting it from the fiiter and holding it in the water-filled tube at different levels
c) A defective instrument can be easily replaced This will ensure long life of each pipe installation
cl) Great accuracy can be obtained by first making a rough pore pressure determination and then replacing the simple wide-range instrument by a narrowshyrange precision meter
e) In non-saturated soils where gases might cause trouble in the filter a bulb of saturated soil can be achieved close to the filter by first connecting a hose containing water under slight overpressure to the filter after a while replacing this hose with a pore pressure meter
The system consists of parts which can be combined in different ways For instance we have the filter pipe with different filter points We have also several kinds of pick-ups eg oil-filled or electro pneumatic pick-ups for ordinary cases (described in what follows) and a special precision pick-up (sect 5)
The connection between the filter and the pick-up is stanclarclizccl and will be described first (sect 4 b) in order to facilitate understanding the details of the system
There are cases vhere the SGI system connection cannot be used eg in such embankments where the connection tube must be installed more or less horizontally Here we can use the pick-ups in the first place the oil-filled hydraulic pick-ups with the filter directly connected This is possible since the manufacturing costs of the parts which will remain in the soil are comparatively lmv
sect 4 h Instrument Connection
The SGI connection between the filter and pick-up is shown in Fig 15 It consists of hvo parts the nozzle which forms part of the filter pipe system and the lower part of the pick-up
The pick-up having a hole drilled to fit on the nozzle is sunk clown in the pipe It is guided onto the nozzle by conical surfaces until a ring-shaped rubber gasket in the pick-up rests tightly against a ring-shaped contact surface at the top of the nozzle The dead weight of the pick-up is about 14 kg and the contact area is about 01 cm2 so that the specific contact pressure is 14 kgcm2
This is sufficient for all normal needs especially as the cross-sectional area of the hole in the nozzle is only 001 cm2 Pore water flOv past the rubber gasket is ensured by a small pipe inset at the centre of the gasket
31
---Pick-up
~---N---- Contact surface
IL-------- Nozzle
n b
Fig 15 SGI middotinstrU1nent connection
a Before connecting b Connected
32
Pick-up or sealing cop
I Compressed air from bottle provided with pressure gauge
I ~ --Gloss tube
i~ --Water meniscus
Fig 16 Derice for checking middotvolume factor ancl tightness of connection
The tightness of this connection was tested in the laboratory For this purpose a test device was made see Fig 16 The air pressure was kept constant at 4 kgcm2 on a water meniscus in a glass tube This tube was connected to a nozzle coYerccl with a scaling cap which was similar in weight shape and dimensions to a pick-up The connection prov~d so tight that no leakage was observed even after the pressure had been applied for a period of six clays By replacing the sealing cap by a pick-up the volume factor of the latter can be determined
Five years practical experience vith the connection has shown that it is reliable Trouble has arisen in a few cases when dirt came into the pipe and when inexperienced personnel did not check the tightness On one occasion the pick-up was so cold that the water inside the connection froze and blocked the channel
Air bubbles can be entrapped in the connection The remedy is to fill the hole in the pick-up completely with water by means of a syringe VVhen inshyserting the pick-up in the filter pipe it is convenient to have the whole pipe filled with vater Then a check can be made at ground level to make sure that no air bubbles arc present If it is not possible to fill the pipe sufficiently the bottom hole of the pick-up can be covered with a piece of plastic tape after filling the hole The nozzle will penetrate the tape 1 and the connection will be free from air bubbles vhen using hydraulic pick-ups a proof of the tightness of the connection is that the interior pressure quickly rises a little just when the connection is made
33
9 60 mm
14---Sleel extension pipe
Tntt---- Groove for cement ond tow
Ultl--=~- Bross
l ---middotmiddot 940mm
I
Filfer bolt
Filter
Bross point
Fig 17 Filter pipe type SGI I
sect 4 c Filter Pipe
sect 4 c 1 Design
The filter pipe hitherto used in practice is shown in Fig 17 The maximum outer diameter (sect 1 c) is 6 cm This diameter permits the use
of inside couplings leaving sufficient passage for a pick-up of not too small
34
dimensions The filter is at the lower end It is made of sintered carborundum It has a slightly conical shape the diameter increasing from 5s cm at the bottom to 58 cm at the top The effective height is 4o cm which e01-responcls to a filter area of 72 cm2 and a nominal filter diameter (sect 1 b 2) of 4s cm
The filter is mounted on a brass bolt and protected by a brass point serving as a nut The movement of this point is confined by a ring-shaped surface Furthermore as the filter stone rests on a thick rubber gasket the stone is not subjected to any great forces during installation Therefore we have not had any trouble clue to damaged filters The upper encl of the bolt forms the nozzle described in sect 4 b These parts can be clisjoinecl from the rest of the pipe in order to facilitate cleaning of the pipe if needed
The lowest part of the pipe proper is double-walled and is made of brass The outer tube forms part of the extension pipe The inner tube has a slightly smaller inner diameter than the couplings and serves to guide the pick-up onto the nozzle The double-walled part is welded at the bottom encl to a fitting holding the filter bolt and at the upper end to a special coupling
Above this coupling there are extension pipes made of steel (05 C) with welded inside couplings These pipes are fairly long to recluee the number of joints thus decreasing the risk of soil leakage into the pipe through the joints The extension pipes have a wall thickness of 05 cm
Fig 18 shows that we have reclueecl the diameter in our latest design from 6 cm to 48 cm without any drawbacks In this way the installation time lag is reduced frmn about 8-12 days to 5-7 days in a clay having a permeashybility of 10-s emsee as the cross-sectional area has been reduced from 28lt cm2
to 182 em2 (sect 1 b 1) which has been ascertained by experience As can also be seen from Fig 18 we have now two different filter types
The normal filter is 10 cm long and has an area of 140 cm2 (nominal filter diameter 67 cm) The other is 50 cm long and is intended for measuring pore pressures in thin sand layers
sect 4 c Filter Pipe in Practice
Normally a hole about 20 em in diameter and 60 em in depth is first bored on the spot where an installation is to be made This hole is then filled with water The bottom encl of the filter pipe is inserted in the hole and is kept in water until the water in the hole has thoroughly penetrated the filter and has reached almost the same level in the tube and in the hole In this way all air entrapped in the filter and the nozzle is expelled upwards To prevent dirt from entering the interior all pipe joints are carefully sealed with pipe joint cement and tow in the grooves made specially for this purpose
In the measurements made by the Institute the pipe is normally pressed clown by means of jacks or preferably by a wineh mounted on a truck with power take-off In hard soil or at great depths we also nse hammering
35
---
r
rmiddot i -
i
bull I l Ii1-bull
i I 1 bull I _
I 4gt35mm
E e
a 0
Fig 18 Filter pipe type SGI II Fig 19 Sealing cap a Jiilter of normal length
b Lengthened filler for thin sand layers
36
After installation the pipe is filled entirely with water unless the pore pressure is supposed to be very low In the latter case water is only filled to a level corresponding to the assumed free pore water table
In low-permeability soils the pipe is left open about one day to permit t he ini tial great pore Yater overpressure to be reduced below an acceptable limit Then either the pick-up or the scaling cap shown in Pig 19 is connected to the nozzle This is done to prevent the natural pore pressure from being changed by the water pressure in t he pipe
I t is necessary to avoid freezing of the pick-up during winter days In non-saturated soils it is advisable to let rnter seep from the filter pipe
into the soil closest to the filter a sufficient time to form a bulb of satura ted soil around the fi lter point In this way one avoids troubles from gases entering the filter from t he outside
sect 4 d Oil-Filled Pick-Up
sect 4 d 1 Principles
The system with oil-filled pick-up is a further development of the early hydraulic meters described in sect 2 In principle the pore pressure in this system is also transmitted from the meter point Lhrough a fluid in a pipe to a Bourdon gauge situated at ground level The essential difference is that the pressure t ransmission system is entirely filled with silicon oil and forms a closed unit which is assembled in the workshop The lowest part of this unit is provided with an extremely flexible thin rubber diaphragm which separates the fluid in this system from the pore water but can transmit the pore pressure with a very small pressure loss By using the oil fill we are to a very great extent free from t roubles due to gas bubbles Ve can therefore radically decrease the diameter of the connecting pipe to a capillary size The tube can then easily be wound around a drum and can be handled like a rope
A further advantage of the oil fill is that the measuring system is frost-proof It also permits measurements of ground-water tables which are slightly deeper than in the case of the water fill owing to the smaller specific gravity and vapour pressure of the oil and to the absence of gas bubbles The freedom from gases gives the additional advantage that the fluid is almost incomshypressible at the pressures under considerat ion Consequently the measurement time lags are very small On the other hand we obtain time lags if the oil is too viscous since the resistance to flow in the capillary tube will then be high Thin silicon oil has a low viscosity even at low t emperatures and we have therefore eliminated this source of error
The specific gravity of the oil must be exactly known for det ermining the pore pressure which corresponds to a given gauge reading W e refer to Fig 8 and the following symbols
37
y = specific gravity of oil in kg cm3
uu = pressure indicated by gauge in metres of water column II = vertical distance in metres from gauge to half the height of the
filter u = pore water pressure in filter in metres of water column
We then have U = lJy + u0 bullbullbullbullbullbullbullbullbullbull bull bullbullbull (12)
sect 4 d f2 Design and Construction
The oil-filled pick-up is shown in Fig 20 The rubber membrane is very thin and has an approximately semispherical
shape It is provided with a rim at the circumference The lower part of the pick-up is extended by means of a thin piece of tube
When assembling the pick-up the lower part and the upper part can be pressed together and the tube of the lower part can be soldered to the upper part The position of this solder joint at a sufficient distance from the rubber membrane prevents the soldering heat from destroying the membrane
The connection between the element body and the Bourdon gauge is a copper capillary 3 mm in outer diameter and only ls mm in inner diameter It is welded to standard type pipe fittings The length of our capillary tube is normally 20 or 30 metres
First we tried plastic tubing which has been used in some countries We found however that a great amount of gas bubbles appeared in this tubing as soon as it was in contact with air Therefore we made some tests We cut polyethylene and polyvinylchloride tubing into one-metre lengths which were filled with water After closing the ends the test pieces were kept in the laboratory and weighed each day Already after one day air bubbles were observshyed in the polyvinylchloride tubes and after about ten days these tubes were empty Also the polyethylene tubing showed considerable although less permeashybility Similar tests with viscous oil showed no tendency of the oil to disappear These tests induced us to avoid plastic tubing in our pore pressure meter designs (Later tests with Saran tubing showed however that this material is satisfactory)
The Bourdon gauge is all-bronze Before assembling the system each part is first separately filled with
evacuat ed oil To put the diaphragm in a neutral position the pick-up is placed on a calibration nozzle (cf Fig 16) A syringe is used to remove 3 cm3
of oil from the upper chamber at the same time as air is let in through the nozzle until the oil level in the upper chamber again reaches its original position As the Bourdon gauge will only require about 02 cm3 of oil to move through the whole range we know that the diaphragm will never reach its ultimate positions provided that the system is tight
Fig 21 shows the assembled system Fig 22 shows the calibrated volume change of the instrument (cf Fig 4)
38
Copper capillary Soldered
I
Bourdon gouge
I
---Rim
~if-- Rubber membrane
Welded
Fig 20 Oil-filled picc-up Longitudinal section
The data of this instrument arc as follows Range - 10 to + 10 m of water column Error plusmn 10 cm of water column Sensitivity 5 cm of water column Volume factor (6) 2 middot 10-middot1 cm5g
A comparison middotwith the meters described in sect 2 shows that the accuracy and the sensitivity of this instrument are theoretically the same as those of the Viisby meter In practice hmvever the ncv instrument is much more reliable as disturbances due to gas bubbles are asoidcd almost entirely and calibration is possible under field conditions The measurement time lag is 1nuch smaller owing partly to a greater nominal filter diameter and partly to a smaller real volume factor
30
Fig 21 Oil-filled pick-up
U kgcm1
10
08
0amp
04
0
II
II
II
II
0 004 006 012 016 020 cm
Variatio n in vol ume
Fig 22 Oil-filled pick-up Variat ion in volume with pressure
40
Cover
Pore pressure meter
Fig 23 Insulating box
A point of special importance is the temperature sensitivity shown in sect 2 Liquid-filled closed systems are temperature-sensitive and special measures must be taken to counteract this A simple calculation shows the great importance of thermal influences Our Bourdon gauge has an inner volume of 19 000 mm3 and requires a volume change of 200 mm3 to indicate a pore pressure change of ten metres of water column Now the coefficient of thermal expansion of the oil is 00009 If the temperature changes 10deg C which at sun-
41
Ordinary Bourdon gauge
I Compensation volume for Bourdon gauge
Secondary bellowamp
Primary bellows
Capillary from pick-up -~------_
Compensation capillary closed of lower end ~-----tll-l
Drum for capillary
tubing
0
Fig 24 Temperature-compensating dnbullice for oil-filled pore ptessurc meter
rise can take few hours then the volume change in the manometer is 10 middot 00009 middot middot 19 000 = 170 mm3 bull Thus the volume change can extend almost through the whole range of the manorneter
The volume changes in the capillary tube are small in comparison vith those in the manometer and amount to only about 18 mm3 per metre of length per 10deg C of temperature change If the systen1 were filled with water vhich has a coefficient of thermal expansion of only 00001s the influence of the manometer
42
would be smaller but on the other hand the influence of the wider connecting tube which would then be required would be greater If the Bourdon gauge is enclosed in an insulating box placed in the soil see F ig 23 then the soil has an equalizing effect on the temperature Our experience has shown that the thermal influences are small in such installations provided the observer docs not open the cover when taking a reading The insulating box serves also as a protection against damage
However there are cases where it is impossible to insulate the gauge sufshyficiently Such a case is discussed in sect 4 g (Fig 35) Then the measuring system can be provided with a temperature-compensating device see Fig 24 The principle of this device is stated in what follows
A fluid is enclo3ed in a temperature-compensating system This system is arranged so that it is subjected to the same temperature changes as the measuring system When the compensating fluid changes in volume owing to temperature variations it deflects a primary bellows This bellows acts on a secondary bellows situated in the measuring system thus compensating the latter for volume changes caused by temperature This device which is in reality small and rugged has been tested a few months and has hitherto worked well
If the filter pipe has been installed for a sufficiently long time each reading can be taken in about half an hour after the pick-up has been connected
As regards the measuring costs it is to be noted that the most expensive part of most systems is the filter-pipe and not the pick-up However the quick response of the pick-up saves time and makes the meter therefore comparatively cheap in use
sect 4 e Electro Pneumatic Pick-Up
The electro pneumatic pick-up is used for the same purposes as the first electro pneumatic meter (sect 3) Thus it is primarily intended for low groundshywater levels
sect 4 e 1 Principles
The principles of this pick-up are the same as those of the meter described in sect 3 However the present pick-up is far ahead of the first meter which has been developed in several stages in order to prevent some noticed disturbances The disturbances were due to frictional forces at the periphery of the membranes to electrical short-circuits caused by moisture to insufficient electrical contacts to the air pressure arising between the membranes and to air diffusion through the rubber covers of the membranes All these disturbances have been almost completely eliminated in the latest design and the reliability has been conshysiderably increased
The membranes have been replaced by bronze bellows (Fig 25) They can be soldered to their fittings and can thus be made quite tight They are smaller in diameter than the membranes and the volume change corresponding to a given displacement has therefore been reduced
43
+-----Rubber hose
IH-J--deg~-- lnsulofed eedricol conductors
Fig 25 Electro pneumatic pick-up Longitudinal section
The measuring principle permits fairly high prec1s10n but the n1ain purpose is to ensure ruggedness Ve get an instrument accuracy of + 10 cm of water column and a sensitivity of 2 cm which is mainly determined by the Bourdon gauge
sect 4 e 12 Design and Construction
Fig 25 shows the pick-up A fitting at the lower end seals the nozzle A bellows is hard-soldered to the
top of this fitting The lower fitting is screwed in a brass cylinder A distance ring between these two parts ensures the exact position of the lower bellmvs in relation to the upper
44
U kgcm1
2o
1amp
11
08
04
0
V I
V
0 004
r7-
I
V
006 012 01amp 020 cnJ
Variation in volume
Fig 26 Electro pneumatic pick-up Variation in volume with pressure
Fig 27 Electro pneumatic meter Measitring outfit
45
I 20 ~ 15
~
10 ~
Sl
~ ~-
0 0 05 IO 1 20 2S kgcm1
Air pressure
Fig 28 Calibration curve of electro pncmnatic pick-1tp
The free ends of the bellows arc closed by end caps hard-soldercd to the bellows These caps arc also proYidcd with hard-soldered small pieces of platinum sheet which form the contact surfaces The upper contact surface is slightly curved and the Iover one is plane in order to make the contact practishycally independent of small lateral movements of the bellows The space beshytween the two contacts is 2s 1nm at zero pressure
The upper bellows is hard-soldered to the upper fitting which is electrically insulated from the cylinder by two rings (at present made of Lucite) This fitting extends into the upper bellows and forms a supporting rod A nut holds the fitting in a fixed position
One of the two electrical conductors coming from above is joined to the upper fitting (leading to the upper contact) while the other is connected to the nut (leading through the cylinder and the lower fitting to the lower contact) The top of the measuring insert is filled vith sealing compound The free space inside the cylinder is air-filled So far our experience indicates that no special moisture-absorbing agent which is often used is required here if the air contains little moisture when the syste1n is closed
VVith the bellows used the volume factor is 09 middot 10-4 c1niig as is seen fron1 the calibration diagram in Fig 26
Fig 27 shmvs the above ground equip1nent which is carried in a specially designed suitcase The air bottle contains five litres of air at a pressure of 150 kgc1112 bull This pressure is read on the small manometer which indicates how
46
much air is still available The larger manometer measures the air pressure after the air has passed the reducing valve (which is seen on the right) On the left of the larger manometer there is a milliammeter which indicates when the circuit is closed Further to the left there is a push button for checking the dry cells
Outside the suitcase we see the pick-up with its connecting hose and electrical conductors a calibration diagram the wrenches for connecting the hose the syringe for filling the pick-up hole with water and the plastic tape for occasional use (sect 4 b)
Fig 28 shows a calibration diagram of the latest meter
sect 4 f Recording Instruments
From Eq (10 a) (sect 1 b 2) we see that a correct evaluation of the pore pressure in the soil from instrument readings requires several readings taken at sufshyficiently small intervals of t ime to obtain the time derivative of the instrument readings It is useful to obtain the maxima and minima of the instrument readings because Eq (10) shows that no measurement time lag is present at these values From this point of view it is advisable to have written records
The oil-filled pick-up can easily be combined with a recording instrument For a special investigation the Institute wanted to have records covering at
least one year The recording instruments designed for this purpose are briefly described in what follows
sect 4 f 1 lnlc Recorder
The simplest way to construct a recording pore pressure meter is to use a standard pressure recorder and to connect its pressure gauge to the oil-filled pick-up In view of its small friction and simplicity an ink recorder is suitable in this case
A drawback of the ink recorder is that the minimum paper speed must be about 0s mm per hour to make the ink flow smoothly One years measurements will therefore require a diagram over 4 m in length which is fairly great The length can be reduced by reading the diagram at certain intervals and by redrawing it on a smaller time scale
The Institute has two recorders which are spring-driven and must be rewound once a month These instruments have been in use about a year and we have had very little trouble with them so far
sect 4 f 2 Optical Recorders
In order to enable long-time recording without obtaining too long diagrams and with a minimum of friction the Institute designed and construct ed meters for optical recording on photographic film
The original idea was very simple and is shown in Fig 29 A mirror is fastened on a standard Bourdon gauge Daylight enters through a tube with
47
Oayliqt
t ~--Glass
Spring motor
Mirror
Capillary to pick-up
II1
Rotating drum
with
photographic
r1m
III
film case Shutter for film case
Fig 29 Simple optical recorder
two pinholes 02 mm in diameter forming a spot of light that is reflected by the mirror on to a film on a rotating drum This drum makes in our case one turn per year and is driven by a spring Exposure tests showed that it is possible to obtain good records throughout the year even in very faint dayshylight This idea has not yet been realized because we were afraid that snow in the winter might interrupt the record
Therefore we made an optical recorder using artificial light (Fig 30)1 bull
The only difference from Fig 29 is the optical system The light source consists of two miniature electrical bulbs which arc fed with
current impulses of only 110 sec duration The bulbs are lit alternatively so that a flash is produced every second hour if both bulbs are intact Should one bulb be defective one flash would anyway be obtained every fourth hour The light from the bulbs is concentrated and focused on the photographic film after being reflected by the movable mirror
The electrical current is supplied from an accumulator and is primarily feel to an electrical clock wound up ten times an hour by the stroke of an electromagnet It is the current flowing through this electromagnet that is utilized for the flashes A disc fastened on the hour hand of the clock switches
Devised in co-operation middotwith lfr Vilerner Bergau Mechanical Department of the Institute 1
48
-----+--- Eleclricol clock
Atumulotor -=-
Check bulbs
Push
____kgtJ button switches __j
Rotating
drum
I
Fig 30 Artificial light system for optical recorder
on the bulbs alternatively during a time that is sufficiently long to enable one flash impulse to be fed through the bulb each time it is switched on In one year the effective time of current flow through a bulb is only one hour This ensures long life of bulbs and cmTent supply The accumulators should easily last a year
The bulbs can be checked by means of check bulbs During this the bulbs remain switched on a longer time than the duration of the ordinary flash and a larger spot will be marked on the diagram Once a month a man supervises the apparatus and winds up the spring motor He also reads the pore pressure value indicated by the Bourdon gauge At the same time he checks the bulbs and the accumulators Afterwards his readings can easily be correlated with known points on the records Six months experience with two recorders in the field has shown that they work satisfactorily
sect 4 g Experience with SGI System
Our practical experience with the SGI system mostly concerns the 6 cm filter pipe used together with the oil-filled pick-up This combination is normally sufficient for Swedish clays
49
1U
-0
U-0
1
UI
_
l5 t c
rYJ
3 -
e4
19
54
c O ~
8 lt(
L 6r
ound
sur
face
-
I0
0
I M
ore
than
10
m o
f w
col
ove
rpre
ssur
eE
f I
-I
2
0
5 IO
15
20
25
3
0
35
do
y
U-D
2
1
Gro
und
surfa
ce
31
3_
-0
--
--
-0
- -a
middot-t-middot
---0
-
Het
er f
roze
n
~r-
_10
-
1
No
I
24
2 -
19
3 1
954
__
J
-N
o 2
19
3 -
-30
3 1
954
9 -
2 5
10
15
20
25
30
35
40 d
oys
2
U-0
4
4
0
-1
0 10
15
20
25
30
35
day
s
I
gt-
_
_
N
oI
313
-2
24
19
54
No
2
134
-10
5
1954
7
~~
Omiddot _-
aJo
LG
roun
d 5u
rfo c
e
3U
-D
-I 0
10
15
20
25
30 d
ays
1 N
o1
1
15
-14
6
1954
1--
----
U-0
3
____
f--
--lt---
-~
I _
I t
I I
L G
roun
d su
rfac
e_
~
5
15
6
1954
-
I
~ro
un
~ s
urfa
ce
_ _
0 10
15
20
25
30
3
5 do
ys
-1 L-
---~
--~
-L
eg
en
d5
10
15
20
25
30 d
ays
U
= Po
re p
ress
ure
in m
etri
c tm
-o
-H
ydra
ulic
pic
k -
up
0
= D
epth
bel
ow g
roun
d su
rface
n m
x
Ele
ctro
-pn
eu
mo
fic
pic
k-u
p
a F
ilte
r pi
pe N
o
2 w
ith
outs
ide
coup
ling
s
b F
ilte
r pi
pe N
o 3
wit
h in
side
co
uplin
gs
1
105
m
belo
w g
roun
d su
rfac
e
1
180
m
belo
w g
roun
d su
rfac
e
2 1
20
m b
elow
gro
und
surf
ace
2
20
0 m
be
low
gro
und
surf
ace
3
15
0 m
bel
ow g
roun
d su
rfac
e
3 2
20
m
belo
w g
roun
d su
rfac
e
Fig
81
a-b
P
ore
pres
sure
mea
sure
men
ts i
n cl
ay a
t E
nkop
ing
u-o
t
w
EC
ro
xun
d su
rfoc
Lbull
I I
I I
~ L
ll31
3
03 1
9s4
-t
L----J
----~
------------------------
30
35
40
45
50
55
60
doy
s
U-
0 2
2
-t
30
35
40
45
5
0
55
60
doy
s
u-o
3 ~
Gr o
und
surf
ace
I I
~
4
4 -
125
19
54
J
I -
I
2------~
----
----
-----
---
21
s -
12
6
1954
0 I
I
-
t=
I
I o+
--
--1
-t -
----
---
---
---L
----
---
---L
--_
J0
5 10
15
20
25
3
0 d
ay
c
Fil
ler
pipe
No
5 w
ith
outs
ide
coup
ling
s
1 1
05
m
belo
w g
roun
d su
rfac
e
2 1
20
m b
elow
gro
und
sur
face
3
15
0 m
bel
ow g
roun
d s
urfa
ce
CH
U-0
1
0
0 25
30
35
doy
o
0 I I I i r
No2
31
3-n
bull
1954
N
o I
234
-10
5
1954
7
~
~
-j
L G
roun
d su
rfac
e
deg-o
middot -
ltgt
-~
bullU
~bullU
10
15
20
-~
1
1-
2U
-D
rN
o1
21
5 -
14b
19
54
-bull
L 6
roun
d su
rfac
e 10
15
20
25
30
35 d
oy
Le
ge
nd
U
= P
ore
pre
ssu
re m
met
ric
tm1
D
= D
eplh
bel
ow g
roun
d su
rfac
e in
m
-o
-H
ydra
ulic
pic
k-u
p
x E
lect
ro -
pneu
mat
ic p
rck-
up
d F
ilte
r pi
pe N
o
6 w
ith
insi
de c
oupl
ings
1
2O
0 m
be
low
gro
und
surf
ace
2
22
0 m
be
low
gro
und
sur
face
Fig
31
c-d
P
ore
pres
wre
mea
sure
men
ts i
n cl
ay a
t E
nco
ping
Fig 31 refers to pore pressure measurements at Enkoping1 near Stockholm Four SGI filter pipes and two Surte meters were installed at equal intervals along a circle about 13 m in diameter The results obtained with the Surte meters have already been discussed in sect 2 c (Fig 7)
The filter pipes were driven to increasing depths and measurements were made with two oil-filled pick-ups and one electro pneumatic pick-up which were shifted between the pipes to check possible individual errors in measurements The pick-ups were also now and then checked with reference to known water levels in the filter pipes The tops of the hydraulic meters were heat-insulated by means of the standard equipment shown in Fig 23
We observe that the curves are very smooth Fig 31 b 1 however shows a case where the water in the pick-up had frozen before it was inserted and the connection was therefore not completely tight ( checked afterwards simply by lifting and reconnecting the pick-up)
The different meters agreed within about 0 1 m of water column This was considered to be sufficient as none of the instruments were intended to be precision instruments The time required for an instrument to give a correct reading connection t ime lag was normally only about half an hour or so because we had filled water in the filter pipe to a level near the assumed ground water level When the pick-up was lowered it adapted itself to a pressure very near the pore pressure in the soil and thus required very little pore water to give correct measurements In order to let the pick-up reach the same temperature as the soil we also found it useful to keep the pick-up about ten minutes in the pipe before connecting it to the nozzle The results relating to the different pipes corresponded closely to the Surte meter measureshyments
Fig 32 shows the results obtained in an installation of oil-filled meters sunk to great depths under a river varying in water level The gauges were mounted in cases with wooden walls filled with saw-dust to a thickness of at least 02 m all around The bottoms of the cases were situated one meter above mean water level Fig 32 also shows measurements of the water level in the river and the wate1 and air temperatures The diagram resembles that in Fig 6 in shape but indicates influences of both air and water temperatures Some influence may also be due to the varying water level in the river It is obvious that temperature influences on hydraulic measurements cannot be avoided in such an installation unless use is made of a temperature-compensating device as discussed in sect 4 d 2 or an electro pneumatic pick-up (which has no temperature sensitivity)
Fig 33 which relates to a quay slope in the Port of Uddevalla (southwestern Sweden) shows pore pressure measurements which were also made with oilshyfilled meters These results indicate a fine consolidation curve of a clay layer covered with permeable fill 4 metres in thickness
1 The sile is described in Proc No 8 of the Institute
52
U-0 s~-------------------------------------------
below M W L 3 h-icc---j-0_O_o_o_gt+-o-0-Q-o--j-o---Ocz----r=~7-------------------j
I I middotCmiddotmiddotOmiddot Q Q2
bserved wa er leve m river in m
0 u gtlt- -- bullbull ___gtlt- ---x___ -middot middotgtlt x---
middotgtltmiddot gtltmiddotmiddotgtlt-middotgtltmiddotmiddotllmiddotmiddotc-----t~~~~~=-~--~--~---- Mean water level
-I~--~--~--~---~--~--~---~--5 ID 15 20 25 30 35 40 45 days
oc 25 --------~------r---~---------------r---
r-- Air temperature
~ 20 -0 ~
c E ~ 15
10 ~--~--~--~~--~--~--~---~--~ 5 10 15 20 25 30 35 40 45 days
Legend
U = Pore pressure in metric Vn with reference fo mean wafer level D - Depth below MWL in m
Fig 32 Pore pressure measurnmcnts with hydraulic pick-up below the bottom of GOta River for a vlanned tunnel and comparative measurements
of air and water temperature (June 20 to August 10 1954)
In the cases represented in Figs 31-33 the installation time lags were 8 to 12 clays Time lags half these values can be obtained with our latest filter pipe as already stated in sect 4 c 1 (Fig 18)
Our latest electro pneumatic pick-up has been tested for abont a year and seems to be reliable
In one case ve had to measure pore pressure in a soil containing much gases Immediately after installation of the filter pipes many gas bubbles escaped through the water filled open pipes VVhen gas ceased to escape we connected meters and were able to measure without trouble
t------t--+---cmiddotPmiddot6-4~---f---gtltdegt---+----nlf-_ 6
middot6
53
4
3
2
0
-1
0 Pipe No1 365 m below M W L 0 -u- No2 890m
__ X -u- No 3 1395m __
No4 1870m _
-~-Sea level-
X
0 10 15 20 30 35 days
0 2 3 U-0 0 ~~-~---~---
Permeable fill
u
le 5 --~ middoto 10
0 oi Clayc
c 1i 15
0
20
Legend
U Pore pressure in metric tm1
D = Depth below MWL in m
m
Fig 33 Pore pressure measurements in a quay dope at Uddevalla (November 9 to December 14 1955)
sect 5 Precision Pick-Up
The precision of the electro pneumatic pick-up can be considerably improved if we permit slightly greater measurement time lags With a few alterations of the pick-up as described in sect 4 cl this is possible
The principle is shown in Fig 34 Here the lower bellows is subjected only to the difference between the pore pressure on the inside and a certain static pressure on the outside and not to the whole pore pressure as described in sect 4 d The static pressure is produced by filling water to a desired level in the filter
54
Compressed air bottle Mercury manometer-
Distances
Electrical contact copy check ~l====~I
to be measured
Standard distance----~
Oil
Hg
Air
Fig 34 Principle of precision electro pneumatic meter
55
cm w col
zoo
VI
3 ~
1500
L
3 ~
C 0
O C 100u 0
u C
L
~ O
c 50 ~ VI 1l
L a
0 0 50 100 150 200 cm w col
Pressure difference acting on upper bellows ( os read off by mercury manometer)
~
o Increasing pore pressure x Decreasing pore preure
~ ~
I
~ ~
~
middot-lig 35 Calibration curve of precision picl-up
pipe This water is permitted to communicate with the air-filled space between the t wo bellows which is thus submitted to the same static pressure as the water The upper bellows is protected against overpressure from below by limiting the possible deflection
The two bellows are soldered to fittings separated by a perforated pipe A thin rubber hose is loosely fitted on the outside of this pipe T he space inside this hose is filled with air On the outside the water is free to enter through holes in the upper and lower parts of the protection tube
The fitting of the upper bellows is shaped to limit the deflection of the bellows and to fit in the connection hose The fitting is electrically insulated by means of two Lucite rings One of the electrical conductors leading from the contact-checking device is soldered to the fitting for the upper bellows
56
and the other to the extension of the perforated pipe which is electrically connected to the lower bellows
The contact-checking device is exactly the same as that described in sect 3 andsect 4 e
The bellows undergo a deflection of Oa2 mm in a pressure range of 2 m of water column As the accuracy of the contacts is about 0001 mm (sect 3 b) the sensitivity is about 6 mm of water column The volume factor is about 10 middot 10-4 cm5g that is of the same order although a little higher than for the instruments described in sect 4
We have successfully used a multiple mercury manometer for air pressure measurements It bas a range of 40 m of water column Its accuracy is 1 cm of water column In most cases it is sufficient to have a range of 10 m of water column which corresponds to only one U-bend The accuracy of the manometer is then higher than + 5 mm of water column Fig 35 shows a calibration curve of the precision pick-up
The accuracy in measurements is also dependent on the determination of the water level in the filter pipe and on the depth of the filter below ground level Both can be determined by means of a single sounding operation inside the filter pipe with an accuracy of a few millimetres
Another advantage of this type of meter is its independence of the tempershyature
The meter has only been ready a few months and our experience with it is therefore rather limited
sect 6 Conclusions
From the above we can draw the following general conclusions Before starting pore pressure measurements it is recommendable to estimate
the smallest accuracy and sensitivity in measurements that will be sufficient for the problem under consideration Further it is advisable to estimate the greatest probable change in pore pressure with the time and the permeability of the soil These data will permit the selection of a suitable measuring inshystrument having the appropriate accuracy sensitivity volume factor pipe diameter and equivalent filter diameter The cross-sectional area of the pipe is a measure of the installation time lag Eqs (10 a) (11 a) and (11 b) in sect 1 b 2 can be used to calculate the measurement time lags which are difficult to determine practically
It is always desirable to use quick-response measuring systems since errors due to great time lags arc least probable in these systems If we use such systems then no selection is normally necessary In clays this calls for closed measuring systems rather than for ordinary open pipes because-if the filters are greater than a certain definite size-it is easier to decrease the measurement time lags by reducing the volume factor of the instrument than by increasing the filter area
57
The simplest closed measuring syste1n is the liquid-filled system with a Bourdon gauge It requires no manipulation for reading and therefore permits persons living near the site to take readings By using oil instead of water in the system the risk for gas bubbles is practically eliminated Closed liquidshyfilled systems have the drawback of being considerably temperature-sensitive However this can be counteracted by using insulated boxes in close contact with the soil or by using temperature-compensating devices
For cases where the pore pressure is low in relation to the depth an electro pneumatic measuring syste111 can be used The type designed by the Institute has the advantage of being unaffected by temperature It is more intricate and more expensive than the liquid-filled system and requires certain manipushylations in measurements but they do not generally affect the pore pressure in the soil
The SGI system with an in-situ connection permits checking of the mcasure-1ncnts and prevents the 1nctcrs from being damaged during installation It also enables precision 1neasurements by exchanging a wide-range instrument for a narrow-range pressure-compensated instrument
For evaluation of measurements (transforming 1t 1 to u 8 sect 1 b 2) the instrushyment data and the soil permeability must be numerically knOvn Recording instruments arc considered to be especially useful for evaluations
Quick-acting instruments and sometimes recording instruments are economishycal since they save time and reduce the number of manual readings required to give reliable values
The instruments above should not be regarded as a final solution for all kinds of pore pressure measurements They contain however many considerations which contribute to a better understanding of such measurements
sect 7 Summary
lIeasurement of pore water pressure in connection with field investigations is first treated in principle It is shown that the accuracy and sensitivity in measurements together with the volume factor of the instrument and the equivalent filter cliametcrn determine the possibility of measuring variable pressures and govern the time lags
The development of pore wmiddotatcr pressure meters at the Institute is described This development resulted in a system of interchangeable parts (long filter short filter oil-filled pick-up electro pneumatic pick-up recording instruments and a precision instrument) Disturbances due to temperature changes and gas bubbles were eliminated Practical experiences are discussed
LIST OF PUBLICATIONS
FROM THE ROYAL SWEDISH GEOTECHNICAL
INSTITUTE
Proceedings
No 1 Soil Sampler with Metal Foils Device for Taking Undisturbed Samples of Very Great Length W Kjellman T Kallstenius and 0 Wager 1950
2 The Vane Borer An Apparatus for Determining the Shear Strength of Clay Soils Directly in the Ground Lyman Cadling and Sten Odenstad 1950
3 Device and Procedure for Loading Tests on Piles W Kjell1nan and Y Liljedahl 1951
4 The Landslide at Skottorp on the Lidan Rhmiddoter February 2 1946 Sten Odenstad 1951
5 The Landslide at Surte on the Gota River September 29 1950 Bernt Jakobson 1952
6 A New Geotechnical Classification System W Kjellman L Cad-ling and N Flodin 1958
7 Some Side-Intake Soil Samplers for Sand and Gravel Torsten Kallstenius 1953
8 Influence of Sampler Type and Testing Method on Sheur Strength of Clay Samples Bernt Jakobson 1954
9 Some Relations between Stress and Strain in Coarse-Grained Cohe-sionless Materials W Kjellman and B Jakobson 1955
10 Accurate Measurement of Settlements W Kjellman T Kallste-nius and Y Liljedahl 1955
11 Influence of Organic Matter on Differential Thermal Analysis of Clays Lennart Silfverberg 1955
12 Investigations of Soil Pressure Measuring by means of Cells Tars-ten Kallstenius and Werner Bergau 1956
13 Pore Water Pressure Measurement in Field Investigations Torsten Kallstenius and Alf Wallgren 1956
Meddelanden
No I Kortfattat kompendium i geoteknik 1946 1946
2 Redogorelse for Statens geotekniska instituts verksamhet under Aren 1944--1948 1949
a raquoBra borrat - biittre byggtraquo Meddelande utgivet till inst itutets deltagande i utstiillningen raquoBygg biittreraquo Nordisk Byggnadsdag V 1950
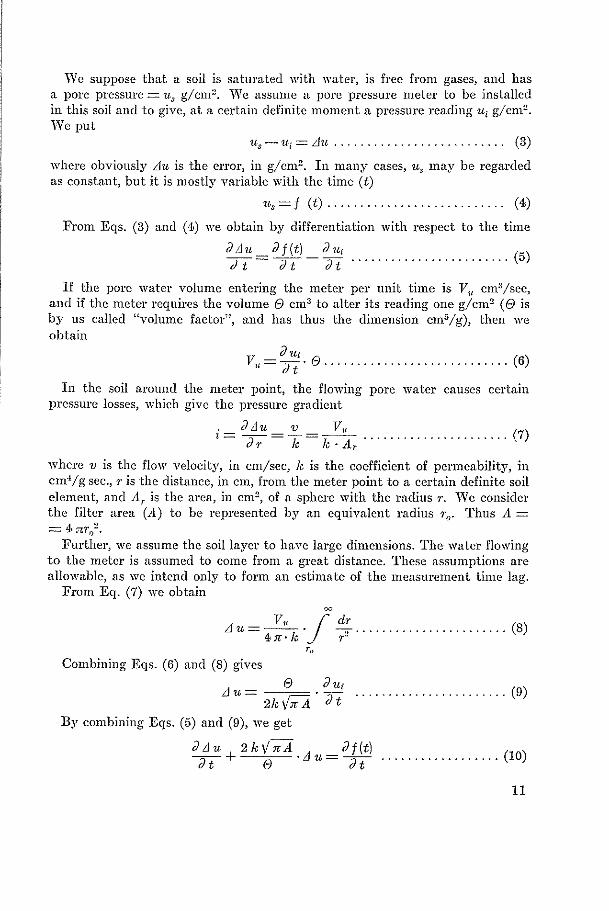

U-D
U
-D
U-D
U
-D
_-7
-1
0
-4
-2
-I
o~
~~
ro~
I
lr 9
~ bullbullbullbullbullbull
-1
-_o
_ltgt
+-a-+
- - 0
5 10
doy
s
o s
urt
-met
er
48
m
o --
-- 1
1lm
I
o
Ope
n p
ipe
8
6 m
o
sv
rte
-met
er
3~
mc10
Y o
__
_
_
64
m
o _
_ _
_
9amp
m
U-D
U
-D
----1
40
m
6coo
cd s
odcc
e -2
-1
15
0 f euro
1~foce
-r__
__-
1
--middot
-
bull
bullr
amp
-
+-d
-+Clo
yl
- o
Lo
I0
-4
L--------~
0
s 10
day
sSa
nd_
I
10
Clo
y
Clo
y
Clo
y
Clo
y
Clo
y
l_C
lqy_
Sm
d
0 D
-0
-I
+-6
-+
U
-D-1
_ ~ 0
S JO
day
~ I
~ middotmiddot
middot I-lt
---e
-
-1
D
AT
o
middotsur
1eH
-met
er
3s
m
o --
--4
~m
10
0
5 10
day
s x
Ope
n pi
pe
7o
m
D
o H
Sur
te-
met
er
4o
m
o _
_ _
_
7om
U-D
U
-D
x O
pen
pipe
6
0 m
CG
roun
d su
rfo
ce
-2
-I
0 D
Sand
bullS
and
D-01
middotmiddot i
middot
bulli
bull -1
+
++
+
++
i++
~+
bull
-2 ~
--~
---~
---~
0
10
15 d
ays
L
eq
en
d
U =
Po
re p
ress
ure
in
me
tric
tjm
~
on
filt
er
leve
lO
pen
pipe
5
1 m
_
_
_bull
6em
D
=D
ep
th
be
low
g
rou
nd
su
rfa
ce i
n
m
10
D
Fig
5
Por
e pr
essu
re m
easu
rem
ents
on
a bu
ildi
ng s
ite
at S
urte
(N
ovem
ber
to
Dec
embe
r 1
950)
1-
l
Coy
Q_
~n
d
Clo
y
D
10
10
U -0 0
- I
-2 middot-middot--d----+-~-~-~ _ L____pound~-middotmiddot_bull_-_bull-_bullJoL___~middotLbullbullcc_c_~---~---~
0 10 15 20 25 30 35 days a
c Jampgend ~---~---~---~---~---~---~ U Pore pressure in metric Vm1
D Depth below ground surfoce in m
Both melers m cloy
b Fig G Jfeasurernents with Surte meter in an embankment on National
11fain Road No G Finlosa-IlOgcu in southu)cstern S1Lmiddoteden (December 11)53 to Tanuary 1951)
a Pore pressure measurements b Air temperature measurements
_CJ 4 iJmiddot - - I - -_
I
Legend
u-o U Pore pressure in metric Vm D -- Depth below ground surface in m
bull 4
bull 2
bull 1
0
- 1
- 2
l Meiers lengthened 15 m upwards_ ---X--- Meler No I 0 Meter No2
bull ~ 1
Ground surfoce gtlt-- - t-~-X--_ _
--gtlt---4
0 5 10 15 20 25 30 35 40 45 days
Fig 7 Tests to denwnstrate the value of thermal insulation (two Surte meters in clay at EnkOpi11r1)
22
U -0
4
0 0 4 6 8 10 days
bull i ~
I bull bull Ha
u-o II
10
9
Legend
_~ bull
U _ Pore presvre in metric Vm1 4
D = Depth below ground surface in m
0 0 2 4 6 10 days
b Fig 8 Pore pressure measure11ients with four Surte meters in clay
at Lilla 1tliillOsa (9 to 29 December 1954)
a Two meters filled with water after installation b Two melers filled with water before installation and kept under an internal
oyerpressure of I kgcm~ during installation
seems that the meter situated at a depth of 3s m might also have been temperature-sensitive but this was delayed about two days
An experi1nent to demonstrate the value of thermal insulation is shown in Fig 7 Here the measurements were made in clay at a depth of 6 m Two Surtc meters had first been installed with the gauges in a shallow pit The measurements showed an installation time lag of about five days and then almost constant values during about 25 days After that both meters were extended upvtards Ls m without any other change The gauge was now situshyated above the ground surface Then the measurements began to vary in a similar way as those in Fig 6 middot This indicates that the thermal insulation of the meter is very important
Fig 8 shows the results relating to four Surte meters installed in clay (permeability 10-8 cmsec) about 40 km north of Stockholm All these meters
23
had their filters at a depth of about 5 m Two n1eters were installed in a normal way (Fig 8 a) while the two other meters were kept for special reasons at an internal overpressure of 1 kgcm2 during installation The installation time lag was about a week in both cases The curves see1n to be fairly smooth
The measurements indicate that closed hydraulic meters should and can successfully be insulated so as to protect them against temperature changes Insulation has therefore been the standard practice at the Institute during the past few years
sect 3 First Electro Pneumatic Meter of the Institute
If the ground water table (static height of pore pressure) lies below the pressure gauge then pressures below the atmospheric will arise in the inner system of a water-filled pore pressure meter Even at a difference in level of about 3 to 5 m troubles clue to gas bubbles in the water begin to be serious vhen using the meters described in sect 2 At a difference of 6 to 7 m the measureshyments arc practically impossible (cf Fig 4) 1
To enable measurements of very low ground water tables our first electro pneumatic meter was designed and constructed
sect 3 a Principles
The measuring system is shown in principle in Fig -9 The pore water passing through the filter stone exerts a direct pressure
on a membrane the lovier 1nembrane which is deflected upwards Above this there is an upper membrane which can be deflected downwards by compressed air Each membrane is provided-with an electrical contact
By means of the contacts attached to the two membranes it is possible to determine the air pressure required to deflect the upper membrane so much that its contact just touches the contact of the lower membrane The more the latter is deflected by the pore pressure the less the upper membrane needs to be deflected The air pressure is regulated and read on the soil smface
The electrical system consists of a dry cell a milliammeter and an electrical res1Sta11ce all connected in series in a circuit including the contacts on the membranes The circuit can be short-circuited for checking by means of a push-button switch
The measurcn1ents are made by slowly increasing the air pressure- above the upper membrane until the milliammctcr indicates that contact has only just been established in the pick-up This procedure can be repeated in order to ensure reliable measurements
One can of course increase the range a little by using measuring systems where waLer can be circulated to remove air bubbles We beliemiddote it to be difficult to avoid pressure disturbances when handling such systems in low permeability soils
l
24
Air pressure gouge
Dry cell
Resistance
Shari-circuit switch
~--- Air filter
Air pipe also serving as electrical conductor--------tt-il
Pressure chamber-----
Lower membrane ______
Filter stone _______
Fig 9 Principle of the first electro pneumatic meter
25
Bakelite
Insulated by-pass WC-L-4-- Rubber membranes
Hardened steel membranes
middot ifrac34U65mm
Fig 10 First electro pneumatic pick-up Longitudinal section
sect 3 h Design and Use
The electro pneumatic pick-up is shown in Fig 10 The 1nembranes consist of thin hardened steel plates resting on ring-shaped surfaces Thin rubber membmnes act as gaskets The total deflection of each membrane is 0ss mm
The contacts are made of platinum and are carefully tested Fig 11 shows one of several tests indicating the accuracy in determination of travel by means of these contacts VVe obtained an accuracy in 1neasurements of about plusmn 0001
26
_ mm-10
16 gt 140 ~
-- 12-u 0-C
IO I-
0 u 8
f Contact closed
-------- ---- ---- ----
L Contact broken
I I I I I
~
middot ~
I I
5 IO 15
Number of operations
Fig 11 Accuracy of contacts
1nm regardless of whether the contacts worked in air or in oil This is equal to about 02 of the delectiou range of the membranes and may be expected to be satisfactory in most cases
Originally the air was supplied by an ordinary hand-pump with a filter for drying and cleaning the air The air pressure is read on a Bourdon gauge The air is fed to the pressure chamber through copper tubing which also serves as an electrical conductor connecting the dry cell to the upper contact The pipe is electrically insulated by means of plates spaced Ls m apart The lower contact is connected to the protection pipe which serves as a return conductor leading to the dry cell
The details of the meter are seen in Fig 12 To deal with a special problem one meter was made with a wide range
extending from 0 to 95 metres of water column The calibration curve of this meter is shown in Fig 13 This meter was slightly temperature-sensitive because of the air volume enclosed between the two membranes This was deemed not to be serious as the pick-np would be situated at levels where the soil temperature is nearly constant
The instrument data are
Range 0 - 95 m of water column Error plusmn I m of water column (mainly due to the
pressure gauge) Sensitivity 20 cm of water column (mainly due to the
contact) Cross-sectional area of tube (A 1) 196 cm2
Nominal filter diameter (2 rol 3s cm Volume factor (6)) 04 middot 1Q-4 cm5g
The meter was used in an investigation at lio i Rana Norvay The operator made a number of measurements without troubles but had once to hammer the meter down with a few blows On account of this and maybe also owing to excess pore pressure the contacts were slightly damaged Therefore it
27
Fig 12 Details of the first electro pneumatic meter
a Hand pump with air filler b Top piece with Bourdon gauge c Contact checking device d Conductor with insulation e Pick-up with filter stone f Calibration diagram
28
U kgjcm1
10
9
8
7
6
5
4 ~ 0
- )r+17 C 3 0degctmiddot~~ 2
- - -- X ----
t-- x
I-- x
I-0
0 o 04 06 08 10 12 14
Air pressure
Fig 1J Calibration cune of the first electro pneumatic 1neter
became necessary to use a special protection pipe (Fig 14) with a filter stone This pipe was first driven into the soil Afterwards the meter with its pipe was inserted in the protection pipe until close contact was established between two conical surfaces This worked but was not convenient
The pressure pick-up was reliable during short-time tests but its calibration curve showed a tendency to change during long-time measurements This was found to be due to the fact that the air from the space between the membranes diffused through the rubber membranes
The first electro pneumatic meter was soon discarded as the Institute deshyveloped a new system of pore pressure measurements which is described in the follmving section
29
middotmiddot-tmiddotmiddot Conical disc
Rubber gasket
Conical seat
11----- Protection pipe
-4---- Ordinary meter
14---- Water
gasketRubber
Fig 14 First electro pneumatic meter Protection pipe
sect 4 SGI Pore Pressure Measuring System
sect 4 a Principles
In September 1950 it was conceived that a connection which could be used for pore pressure meters to join in situ the pipe with the filter to the 1neasuring element (situated as close to the filter as possible) would give several advanshytages
On the basis of such a connection between the filter pipe and the instrument the Institute has since developed a pore pressure measuring system-here called
30
the SGI system-which can be flexibly adapted to most field investigation requirements
The main advantages of this system are a) The filter tube can be installed without the instrument Therefore the
risk of damaging the instrument by dynamic forces or excess pore pressure at the meter point during installation will be eliminated
b) At any desired moment the measuring instrument (pick-up) can be calibrated or checked simply by disconnecting it from the fiiter and holding it in the water-filled tube at different levels
c) A defective instrument can be easily replaced This will ensure long life of each pipe installation
cl) Great accuracy can be obtained by first making a rough pore pressure determination and then replacing the simple wide-range instrument by a narrowshyrange precision meter
e) In non-saturated soils where gases might cause trouble in the filter a bulb of saturated soil can be achieved close to the filter by first connecting a hose containing water under slight overpressure to the filter after a while replacing this hose with a pore pressure meter
The system consists of parts which can be combined in different ways For instance we have the filter pipe with different filter points We have also several kinds of pick-ups eg oil-filled or electro pneumatic pick-ups for ordinary cases (described in what follows) and a special precision pick-up (sect 5)
The connection between the filter and the pick-up is stanclarclizccl and will be described first (sect 4 b) in order to facilitate understanding the details of the system
There are cases vhere the SGI system connection cannot be used eg in such embankments where the connection tube must be installed more or less horizontally Here we can use the pick-ups in the first place the oil-filled hydraulic pick-ups with the filter directly connected This is possible since the manufacturing costs of the parts which will remain in the soil are comparatively lmv
sect 4 h Instrument Connection
The SGI connection between the filter and pick-up is shown in Fig 15 It consists of hvo parts the nozzle which forms part of the filter pipe system and the lower part of the pick-up
The pick-up having a hole drilled to fit on the nozzle is sunk clown in the pipe It is guided onto the nozzle by conical surfaces until a ring-shaped rubber gasket in the pick-up rests tightly against a ring-shaped contact surface at the top of the nozzle The dead weight of the pick-up is about 14 kg and the contact area is about 01 cm2 so that the specific contact pressure is 14 kgcm2
This is sufficient for all normal needs especially as the cross-sectional area of the hole in the nozzle is only 001 cm2 Pore water flOv past the rubber gasket is ensured by a small pipe inset at the centre of the gasket
31
---Pick-up
~---N---- Contact surface
IL-------- Nozzle
n b
Fig 15 SGI middotinstrU1nent connection
a Before connecting b Connected
32
Pick-up or sealing cop
I Compressed air from bottle provided with pressure gauge
I ~ --Gloss tube
i~ --Water meniscus
Fig 16 Derice for checking middotvolume factor ancl tightness of connection
The tightness of this connection was tested in the laboratory For this purpose a test device was made see Fig 16 The air pressure was kept constant at 4 kgcm2 on a water meniscus in a glass tube This tube was connected to a nozzle coYerccl with a scaling cap which was similar in weight shape and dimensions to a pick-up The connection prov~d so tight that no leakage was observed even after the pressure had been applied for a period of six clays By replacing the sealing cap by a pick-up the volume factor of the latter can be determined
Five years practical experience vith the connection has shown that it is reliable Trouble has arisen in a few cases when dirt came into the pipe and when inexperienced personnel did not check the tightness On one occasion the pick-up was so cold that the water inside the connection froze and blocked the channel
Air bubbles can be entrapped in the connection The remedy is to fill the hole in the pick-up completely with water by means of a syringe VVhen inshyserting the pick-up in the filter pipe it is convenient to have the whole pipe filled with vater Then a check can be made at ground level to make sure that no air bubbles arc present If it is not possible to fill the pipe sufficiently the bottom hole of the pick-up can be covered with a piece of plastic tape after filling the hole The nozzle will penetrate the tape 1 and the connection will be free from air bubbles vhen using hydraulic pick-ups a proof of the tightness of the connection is that the interior pressure quickly rises a little just when the connection is made
33
9 60 mm
14---Sleel extension pipe
Tntt---- Groove for cement ond tow
Ultl--=~- Bross
l ---middotmiddot 940mm
I
Filfer bolt
Filter
Bross point
Fig 17 Filter pipe type SGI I
sect 4 c Filter Pipe
sect 4 c 1 Design
The filter pipe hitherto used in practice is shown in Fig 17 The maximum outer diameter (sect 1 c) is 6 cm This diameter permits the use
of inside couplings leaving sufficient passage for a pick-up of not too small
34
dimensions The filter is at the lower end It is made of sintered carborundum It has a slightly conical shape the diameter increasing from 5s cm at the bottom to 58 cm at the top The effective height is 4o cm which e01-responcls to a filter area of 72 cm2 and a nominal filter diameter (sect 1 b 2) of 4s cm
The filter is mounted on a brass bolt and protected by a brass point serving as a nut The movement of this point is confined by a ring-shaped surface Furthermore as the filter stone rests on a thick rubber gasket the stone is not subjected to any great forces during installation Therefore we have not had any trouble clue to damaged filters The upper encl of the bolt forms the nozzle described in sect 4 b These parts can be clisjoinecl from the rest of the pipe in order to facilitate cleaning of the pipe if needed
The lowest part of the pipe proper is double-walled and is made of brass The outer tube forms part of the extension pipe The inner tube has a slightly smaller inner diameter than the couplings and serves to guide the pick-up onto the nozzle The double-walled part is welded at the bottom encl to a fitting holding the filter bolt and at the upper end to a special coupling
Above this coupling there are extension pipes made of steel (05 C) with welded inside couplings These pipes are fairly long to recluee the number of joints thus decreasing the risk of soil leakage into the pipe through the joints The extension pipes have a wall thickness of 05 cm
Fig 18 shows that we have reclueecl the diameter in our latest design from 6 cm to 48 cm without any drawbacks In this way the installation time lag is reduced frmn about 8-12 days to 5-7 days in a clay having a permeashybility of 10-s emsee as the cross-sectional area has been reduced from 28lt cm2
to 182 em2 (sect 1 b 1) which has been ascertained by experience As can also be seen from Fig 18 we have now two different filter types
The normal filter is 10 cm long and has an area of 140 cm2 (nominal filter diameter 67 cm) The other is 50 cm long and is intended for measuring pore pressures in thin sand layers
sect 4 c Filter Pipe in Practice
Normally a hole about 20 em in diameter and 60 em in depth is first bored on the spot where an installation is to be made This hole is then filled with water The bottom encl of the filter pipe is inserted in the hole and is kept in water until the water in the hole has thoroughly penetrated the filter and has reached almost the same level in the tube and in the hole In this way all air entrapped in the filter and the nozzle is expelled upwards To prevent dirt from entering the interior all pipe joints are carefully sealed with pipe joint cement and tow in the grooves made specially for this purpose
In the measurements made by the Institute the pipe is normally pressed clown by means of jacks or preferably by a wineh mounted on a truck with power take-off In hard soil or at great depths we also nse hammering
35
---
r
rmiddot i -
i
bull I l Ii1-bull
i I 1 bull I _
I 4gt35mm
E e
a 0
Fig 18 Filter pipe type SGI II Fig 19 Sealing cap a Jiilter of normal length
b Lengthened filler for thin sand layers
36
After installation the pipe is filled entirely with water unless the pore pressure is supposed to be very low In the latter case water is only filled to a level corresponding to the assumed free pore water table
In low-permeability soils the pipe is left open about one day to permit t he ini tial great pore Yater overpressure to be reduced below an acceptable limit Then either the pick-up or the scaling cap shown in Pig 19 is connected to the nozzle This is done to prevent the natural pore pressure from being changed by the water pressure in t he pipe
I t is necessary to avoid freezing of the pick-up during winter days In non-saturated soils it is advisable to let rnter seep from the filter pipe
into the soil closest to the filter a sufficient time to form a bulb of satura ted soil around the fi lter point In this way one avoids troubles from gases entering the filter from t he outside
sect 4 d Oil-Filled Pick-Up
sect 4 d 1 Principles
The system with oil-filled pick-up is a further development of the early hydraulic meters described in sect 2 In principle the pore pressure in this system is also transmitted from the meter point Lhrough a fluid in a pipe to a Bourdon gauge situated at ground level The essential difference is that the pressure t ransmission system is entirely filled with silicon oil and forms a closed unit which is assembled in the workshop The lowest part of this unit is provided with an extremely flexible thin rubber diaphragm which separates the fluid in this system from the pore water but can transmit the pore pressure with a very small pressure loss By using the oil fill we are to a very great extent free from t roubles due to gas bubbles Ve can therefore radically decrease the diameter of the connecting pipe to a capillary size The tube can then easily be wound around a drum and can be handled like a rope
A further advantage of the oil fill is that the measuring system is frost-proof It also permits measurements of ground-water tables which are slightly deeper than in the case of the water fill owing to the smaller specific gravity and vapour pressure of the oil and to the absence of gas bubbles The freedom from gases gives the additional advantage that the fluid is almost incomshypressible at the pressures under considerat ion Consequently the measurement time lags are very small On the other hand we obtain time lags if the oil is too viscous since the resistance to flow in the capillary tube will then be high Thin silicon oil has a low viscosity even at low t emperatures and we have therefore eliminated this source of error
The specific gravity of the oil must be exactly known for det ermining the pore pressure which corresponds to a given gauge reading W e refer to Fig 8 and the following symbols
37
y = specific gravity of oil in kg cm3
uu = pressure indicated by gauge in metres of water column II = vertical distance in metres from gauge to half the height of the
filter u = pore water pressure in filter in metres of water column
We then have U = lJy + u0 bullbullbullbullbullbullbullbullbullbull bull bullbullbull (12)
sect 4 d f2 Design and Construction
The oil-filled pick-up is shown in Fig 20 The rubber membrane is very thin and has an approximately semispherical
shape It is provided with a rim at the circumference The lower part of the pick-up is extended by means of a thin piece of tube
When assembling the pick-up the lower part and the upper part can be pressed together and the tube of the lower part can be soldered to the upper part The position of this solder joint at a sufficient distance from the rubber membrane prevents the soldering heat from destroying the membrane
The connection between the element body and the Bourdon gauge is a copper capillary 3 mm in outer diameter and only ls mm in inner diameter It is welded to standard type pipe fittings The length of our capillary tube is normally 20 or 30 metres
First we tried plastic tubing which has been used in some countries We found however that a great amount of gas bubbles appeared in this tubing as soon as it was in contact with air Therefore we made some tests We cut polyethylene and polyvinylchloride tubing into one-metre lengths which were filled with water After closing the ends the test pieces were kept in the laboratory and weighed each day Already after one day air bubbles were observshyed in the polyvinylchloride tubes and after about ten days these tubes were empty Also the polyethylene tubing showed considerable although less permeashybility Similar tests with viscous oil showed no tendency of the oil to disappear These tests induced us to avoid plastic tubing in our pore pressure meter designs (Later tests with Saran tubing showed however that this material is satisfactory)
The Bourdon gauge is all-bronze Before assembling the system each part is first separately filled with
evacuat ed oil To put the diaphragm in a neutral position the pick-up is placed on a calibration nozzle (cf Fig 16) A syringe is used to remove 3 cm3
of oil from the upper chamber at the same time as air is let in through the nozzle until the oil level in the upper chamber again reaches its original position As the Bourdon gauge will only require about 02 cm3 of oil to move through the whole range we know that the diaphragm will never reach its ultimate positions provided that the system is tight
Fig 21 shows the assembled system Fig 22 shows the calibrated volume change of the instrument (cf Fig 4)
38
Copper capillary Soldered
I
Bourdon gouge
I
---Rim
~if-- Rubber membrane
Welded
Fig 20 Oil-filled picc-up Longitudinal section
The data of this instrument arc as follows Range - 10 to + 10 m of water column Error plusmn 10 cm of water column Sensitivity 5 cm of water column Volume factor (6) 2 middot 10-middot1 cm5g
A comparison middotwith the meters described in sect 2 shows that the accuracy and the sensitivity of this instrument are theoretically the same as those of the Viisby meter In practice hmvever the ncv instrument is much more reliable as disturbances due to gas bubbles are asoidcd almost entirely and calibration is possible under field conditions The measurement time lag is 1nuch smaller owing partly to a greater nominal filter diameter and partly to a smaller real volume factor
30
Fig 21 Oil-filled pick-up
U kgcm1
10
08
0amp
04
0
II
II
II
II
0 004 006 012 016 020 cm
Variatio n in vol ume
Fig 22 Oil-filled pick-up Variat ion in volume with pressure
40
Cover
Pore pressure meter
Fig 23 Insulating box
A point of special importance is the temperature sensitivity shown in sect 2 Liquid-filled closed systems are temperature-sensitive and special measures must be taken to counteract this A simple calculation shows the great importance of thermal influences Our Bourdon gauge has an inner volume of 19 000 mm3 and requires a volume change of 200 mm3 to indicate a pore pressure change of ten metres of water column Now the coefficient of thermal expansion of the oil is 00009 If the temperature changes 10deg C which at sun-
41
Ordinary Bourdon gauge
I Compensation volume for Bourdon gauge
Secondary bellowamp
Primary bellows
Capillary from pick-up -~------_
Compensation capillary closed of lower end ~-----tll-l
Drum for capillary
tubing
0
Fig 24 Temperature-compensating dnbullice for oil-filled pore ptessurc meter
rise can take few hours then the volume change in the manometer is 10 middot 00009 middot middot 19 000 = 170 mm3 bull Thus the volume change can extend almost through the whole range of the manorneter
The volume changes in the capillary tube are small in comparison vith those in the manometer and amount to only about 18 mm3 per metre of length per 10deg C of temperature change If the systen1 were filled with water vhich has a coefficient of thermal expansion of only 00001s the influence of the manometer
42
would be smaller but on the other hand the influence of the wider connecting tube which would then be required would be greater If the Bourdon gauge is enclosed in an insulating box placed in the soil see F ig 23 then the soil has an equalizing effect on the temperature Our experience has shown that the thermal influences are small in such installations provided the observer docs not open the cover when taking a reading The insulating box serves also as a protection against damage
However there are cases where it is impossible to insulate the gauge sufshyficiently Such a case is discussed in sect 4 g (Fig 35) Then the measuring system can be provided with a temperature-compensating device see Fig 24 The principle of this device is stated in what follows
A fluid is enclo3ed in a temperature-compensating system This system is arranged so that it is subjected to the same temperature changes as the measuring system When the compensating fluid changes in volume owing to temperature variations it deflects a primary bellows This bellows acts on a secondary bellows situated in the measuring system thus compensating the latter for volume changes caused by temperature This device which is in reality small and rugged has been tested a few months and has hitherto worked well
If the filter pipe has been installed for a sufficiently long time each reading can be taken in about half an hour after the pick-up has been connected
As regards the measuring costs it is to be noted that the most expensive part of most systems is the filter-pipe and not the pick-up However the quick response of the pick-up saves time and makes the meter therefore comparatively cheap in use
sect 4 e Electro Pneumatic Pick-Up
The electro pneumatic pick-up is used for the same purposes as the first electro pneumatic meter (sect 3) Thus it is primarily intended for low groundshywater levels
sect 4 e 1 Principles
The principles of this pick-up are the same as those of the meter described in sect 3 However the present pick-up is far ahead of the first meter which has been developed in several stages in order to prevent some noticed disturbances The disturbances were due to frictional forces at the periphery of the membranes to electrical short-circuits caused by moisture to insufficient electrical contacts to the air pressure arising between the membranes and to air diffusion through the rubber covers of the membranes All these disturbances have been almost completely eliminated in the latest design and the reliability has been conshysiderably increased
The membranes have been replaced by bronze bellows (Fig 25) They can be soldered to their fittings and can thus be made quite tight They are smaller in diameter than the membranes and the volume change corresponding to a given displacement has therefore been reduced
43
+-----Rubber hose
IH-J--deg~-- lnsulofed eedricol conductors
Fig 25 Electro pneumatic pick-up Longitudinal section
The measuring principle permits fairly high prec1s10n but the n1ain purpose is to ensure ruggedness Ve get an instrument accuracy of + 10 cm of water column and a sensitivity of 2 cm which is mainly determined by the Bourdon gauge
sect 4 e 12 Design and Construction
Fig 25 shows the pick-up A fitting at the lower end seals the nozzle A bellows is hard-soldered to the
top of this fitting The lower fitting is screwed in a brass cylinder A distance ring between these two parts ensures the exact position of the lower bellmvs in relation to the upper
44
U kgcm1
2o
1amp
11
08
04
0
V I
V
0 004
r7-
I
V
006 012 01amp 020 cnJ
Variation in volume
Fig 26 Electro pneumatic pick-up Variation in volume with pressure
Fig 27 Electro pneumatic meter Measitring outfit
45
I 20 ~ 15
~
10 ~
Sl
~ ~-
0 0 05 IO 1 20 2S kgcm1
Air pressure
Fig 28 Calibration curve of electro pncmnatic pick-1tp
The free ends of the bellows arc closed by end caps hard-soldercd to the bellows These caps arc also proYidcd with hard-soldered small pieces of platinum sheet which form the contact surfaces The upper contact surface is slightly curved and the Iover one is plane in order to make the contact practishycally independent of small lateral movements of the bellows The space beshytween the two contacts is 2s 1nm at zero pressure
The upper bellows is hard-soldered to the upper fitting which is electrically insulated from the cylinder by two rings (at present made of Lucite) This fitting extends into the upper bellows and forms a supporting rod A nut holds the fitting in a fixed position
One of the two electrical conductors coming from above is joined to the upper fitting (leading to the upper contact) while the other is connected to the nut (leading through the cylinder and the lower fitting to the lower contact) The top of the measuring insert is filled vith sealing compound The free space inside the cylinder is air-filled So far our experience indicates that no special moisture-absorbing agent which is often used is required here if the air contains little moisture when the syste1n is closed
VVith the bellows used the volume factor is 09 middot 10-4 c1niig as is seen fron1 the calibration diagram in Fig 26
Fig 27 shmvs the above ground equip1nent which is carried in a specially designed suitcase The air bottle contains five litres of air at a pressure of 150 kgc1112 bull This pressure is read on the small manometer which indicates how
46
much air is still available The larger manometer measures the air pressure after the air has passed the reducing valve (which is seen on the right) On the left of the larger manometer there is a milliammeter which indicates when the circuit is closed Further to the left there is a push button for checking the dry cells
Outside the suitcase we see the pick-up with its connecting hose and electrical conductors a calibration diagram the wrenches for connecting the hose the syringe for filling the pick-up hole with water and the plastic tape for occasional use (sect 4 b)
Fig 28 shows a calibration diagram of the latest meter
sect 4 f Recording Instruments
From Eq (10 a) (sect 1 b 2) we see that a correct evaluation of the pore pressure in the soil from instrument readings requires several readings taken at sufshyficiently small intervals of t ime to obtain the time derivative of the instrument readings It is useful to obtain the maxima and minima of the instrument readings because Eq (10) shows that no measurement time lag is present at these values From this point of view it is advisable to have written records
The oil-filled pick-up can easily be combined with a recording instrument For a special investigation the Institute wanted to have records covering at
least one year The recording instruments designed for this purpose are briefly described in what follows
sect 4 f 1 lnlc Recorder
The simplest way to construct a recording pore pressure meter is to use a standard pressure recorder and to connect its pressure gauge to the oil-filled pick-up In view of its small friction and simplicity an ink recorder is suitable in this case
A drawback of the ink recorder is that the minimum paper speed must be about 0s mm per hour to make the ink flow smoothly One years measurements will therefore require a diagram over 4 m in length which is fairly great The length can be reduced by reading the diagram at certain intervals and by redrawing it on a smaller time scale
The Institute has two recorders which are spring-driven and must be rewound once a month These instruments have been in use about a year and we have had very little trouble with them so far
sect 4 f 2 Optical Recorders
In order to enable long-time recording without obtaining too long diagrams and with a minimum of friction the Institute designed and construct ed meters for optical recording on photographic film
The original idea was very simple and is shown in Fig 29 A mirror is fastened on a standard Bourdon gauge Daylight enters through a tube with
47
Oayliqt
t ~--Glass
Spring motor
Mirror
Capillary to pick-up
II1
Rotating drum
with
photographic
r1m
III
film case Shutter for film case
Fig 29 Simple optical recorder
two pinholes 02 mm in diameter forming a spot of light that is reflected by the mirror on to a film on a rotating drum This drum makes in our case one turn per year and is driven by a spring Exposure tests showed that it is possible to obtain good records throughout the year even in very faint dayshylight This idea has not yet been realized because we were afraid that snow in the winter might interrupt the record
Therefore we made an optical recorder using artificial light (Fig 30)1 bull
The only difference from Fig 29 is the optical system The light source consists of two miniature electrical bulbs which arc fed with
current impulses of only 110 sec duration The bulbs are lit alternatively so that a flash is produced every second hour if both bulbs are intact Should one bulb be defective one flash would anyway be obtained every fourth hour The light from the bulbs is concentrated and focused on the photographic film after being reflected by the movable mirror
The electrical current is supplied from an accumulator and is primarily feel to an electrical clock wound up ten times an hour by the stroke of an electromagnet It is the current flowing through this electromagnet that is utilized for the flashes A disc fastened on the hour hand of the clock switches
Devised in co-operation middotwith lfr Vilerner Bergau Mechanical Department of the Institute 1
48
-----+--- Eleclricol clock
Atumulotor -=-
Check bulbs
Push
____kgtJ button switches __j
Rotating
drum
I
Fig 30 Artificial light system for optical recorder
on the bulbs alternatively during a time that is sufficiently long to enable one flash impulse to be fed through the bulb each time it is switched on In one year the effective time of current flow through a bulb is only one hour This ensures long life of bulbs and cmTent supply The accumulators should easily last a year
The bulbs can be checked by means of check bulbs During this the bulbs remain switched on a longer time than the duration of the ordinary flash and a larger spot will be marked on the diagram Once a month a man supervises the apparatus and winds up the spring motor He also reads the pore pressure value indicated by the Bourdon gauge At the same time he checks the bulbs and the accumulators Afterwards his readings can easily be correlated with known points on the records Six months experience with two recorders in the field has shown that they work satisfactorily
sect 4 g Experience with SGI System
Our practical experience with the SGI system mostly concerns the 6 cm filter pipe used together with the oil-filled pick-up This combination is normally sufficient for Swedish clays
49
1U
-0
U-0
1
UI
_
l5 t c
rYJ
3 -
e4
19
54
c O ~
8 lt(
L 6r
ound
sur
face
-
I0
0
I M
ore
than
10
m o
f w
col
ove
rpre
ssur
eE
f I
-I
2
0
5 IO
15
20
25
3
0
35
do
y
U-D
2
1
Gro
und
surfa
ce
31
3_
-0
--
--
-0
- -a
middot-t-middot
---0
-
Het
er f
roze
n
~r-
_10
-
1
No
I
24
2 -
19
3 1
954
__
J
-N
o 2
19
3 -
-30
3 1
954
9 -
2 5
10
15
20
25
30
35
40 d
oys
2
U-0
4
4
0
-1
0 10
15
20
25
30
35
day
s
I
gt-
_
_
N
oI
313
-2
24
19
54
No
2
134
-10
5
1954
7
~~
Omiddot _-
aJo
LG
roun
d 5u
rfo c
e
3U
-D
-I 0
10
15
20
25
30 d
ays
1 N
o1
1
15
-14
6
1954
1--
----
U-0
3
____
f--
--lt---
-~
I _
I t
I I
L G
roun
d su
rfac
e_
~
5
15
6
1954
-
I
~ro
un
~ s
urfa
ce
_ _
0 10
15
20
25
30
3
5 do
ys
-1 L-
---~
--~
-L
eg
en
d5
10
15
20
25
30 d
ays
U
= Po
re p
ress
ure
in m
etri
c tm
-o
-H
ydra
ulic
pic
k -
up
0
= D
epth
bel
ow g
roun
d su
rface
n m
x
Ele
ctro
-pn
eu
mo
fic
pic
k-u
p
a F
ilte
r pi
pe N
o
2 w
ith
outs
ide
coup
ling
s
b F
ilte
r pi
pe N
o 3
wit
h in
side
co
uplin
gs
1
105
m
belo
w g
roun
d su
rfac
e
1
180
m
belo
w g
roun
d su
rfac
e
2 1
20
m b
elow
gro
und
surf
ace
2
20
0 m
be
low
gro
und
surf
ace
3
15
0 m
bel
ow g
roun
d su
rfac
e
3 2
20
m
belo
w g
roun
d su
rfac
e
Fig
81
a-b
P
ore
pres
sure
mea
sure
men
ts i
n cl
ay a
t E
nkop
ing
u-o
t
w
EC
ro
xun
d su
rfoc
Lbull
I I
I I
~ L
ll31
3
03 1
9s4
-t
L----J
----~
------------------------
30
35
40
45
50
55
60
doy
s
U-
0 2
2
-t
30
35
40
45
5
0
55
60
doy
s
u-o
3 ~
Gr o
und
surf
ace
I I
~
4
4 -
125
19
54
J
I -
I
2------~
----
----
-----
---
21
s -
12
6
1954
0 I
I
-
t=
I
I o+
--
--1
-t -
----
---
---
---L
----
---
---L
--_
J0
5 10
15
20
25
3
0 d
ay
c
Fil
ler
pipe
No
5 w
ith
outs
ide
coup
ling
s
1 1
05
m
belo
w g
roun
d su
rfac
e
2 1
20
m b
elow
gro
und
sur
face
3
15
0 m
bel
ow g
roun
d s
urfa
ce
CH
U-0
1
0
0 25
30
35
doy
o
0 I I I i r
No2
31
3-n
bull
1954
N
o I
234
-10
5
1954
7
~
~
-j
L G
roun
d su
rfac
e
deg-o
middot -
ltgt
-~
bullU
~bullU
10
15
20
-~
1
1-
2U
-D
rN
o1
21
5 -
14b
19
54
-bull
L 6
roun
d su
rfac
e 10
15
20
25
30
35 d
oy
Le
ge
nd
U
= P
ore
pre
ssu
re m
met
ric
tm1
D
= D
eplh
bel
ow g
roun
d su
rfac
e in
m
-o
-H
ydra
ulic
pic
k-u
p
x E
lect
ro -
pneu
mat
ic p
rck-
up
d F
ilte
r pi
pe N
o
6 w
ith
insi
de c
oupl
ings
1
2O
0 m
be
low
gro
und
surf
ace
2
22
0 m
be
low
gro
und
sur
face
Fig
31
c-d
P
ore
pres
wre
mea
sure
men
ts i
n cl
ay a
t E
nco
ping
Fig 31 refers to pore pressure measurements at Enkoping1 near Stockholm Four SGI filter pipes and two Surte meters were installed at equal intervals along a circle about 13 m in diameter The results obtained with the Surte meters have already been discussed in sect 2 c (Fig 7)
The filter pipes were driven to increasing depths and measurements were made with two oil-filled pick-ups and one electro pneumatic pick-up which were shifted between the pipes to check possible individual errors in measurements The pick-ups were also now and then checked with reference to known water levels in the filter pipes The tops of the hydraulic meters were heat-insulated by means of the standard equipment shown in Fig 23
We observe that the curves are very smooth Fig 31 b 1 however shows a case where the water in the pick-up had frozen before it was inserted and the connection was therefore not completely tight ( checked afterwards simply by lifting and reconnecting the pick-up)
The different meters agreed within about 0 1 m of water column This was considered to be sufficient as none of the instruments were intended to be precision instruments The time required for an instrument to give a correct reading connection t ime lag was normally only about half an hour or so because we had filled water in the filter pipe to a level near the assumed ground water level When the pick-up was lowered it adapted itself to a pressure very near the pore pressure in the soil and thus required very little pore water to give correct measurements In order to let the pick-up reach the same temperature as the soil we also found it useful to keep the pick-up about ten minutes in the pipe before connecting it to the nozzle The results relating to the different pipes corresponded closely to the Surte meter measureshyments
Fig 32 shows the results obtained in an installation of oil-filled meters sunk to great depths under a river varying in water level The gauges were mounted in cases with wooden walls filled with saw-dust to a thickness of at least 02 m all around The bottoms of the cases were situated one meter above mean water level Fig 32 also shows measurements of the water level in the river and the wate1 and air temperatures The diagram resembles that in Fig 6 in shape but indicates influences of both air and water temperatures Some influence may also be due to the varying water level in the river It is obvious that temperature influences on hydraulic measurements cannot be avoided in such an installation unless use is made of a temperature-compensating device as discussed in sect 4 d 2 or an electro pneumatic pick-up (which has no temperature sensitivity)
Fig 33 which relates to a quay slope in the Port of Uddevalla (southwestern Sweden) shows pore pressure measurements which were also made with oilshyfilled meters These results indicate a fine consolidation curve of a clay layer covered with permeable fill 4 metres in thickness
1 The sile is described in Proc No 8 of the Institute
52
U-0 s~-------------------------------------------
below M W L 3 h-icc---j-0_O_o_o_gt+-o-0-Q-o--j-o---Ocz----r=~7-------------------j
I I middotCmiddotmiddotOmiddot Q Q2
bserved wa er leve m river in m
0 u gtlt- -- bullbull ___gtlt- ---x___ -middot middotgtlt x---
middotgtltmiddot gtltmiddotmiddotgtlt-middotgtltmiddotmiddotllmiddotmiddotc-----t~~~~~=-~--~--~---- Mean water level
-I~--~--~--~---~--~--~---~--5 ID 15 20 25 30 35 40 45 days
oc 25 --------~------r---~---------------r---
r-- Air temperature
~ 20 -0 ~
c E ~ 15
10 ~--~--~--~~--~--~--~---~--~ 5 10 15 20 25 30 35 40 45 days
Legend
U = Pore pressure in metric Vn with reference fo mean wafer level D - Depth below MWL in m
Fig 32 Pore pressure measurnmcnts with hydraulic pick-up below the bottom of GOta River for a vlanned tunnel and comparative measurements
of air and water temperature (June 20 to August 10 1954)
In the cases represented in Figs 31-33 the installation time lags were 8 to 12 clays Time lags half these values can be obtained with our latest filter pipe as already stated in sect 4 c 1 (Fig 18)
Our latest electro pneumatic pick-up has been tested for abont a year and seems to be reliable
In one case ve had to measure pore pressure in a soil containing much gases Immediately after installation of the filter pipes many gas bubbles escaped through the water filled open pipes VVhen gas ceased to escape we connected meters and were able to measure without trouble
t------t--+---cmiddotPmiddot6-4~---f---gtltdegt---+----nlf-_ 6
middot6
53
4
3
2
0
-1
0 Pipe No1 365 m below M W L 0 -u- No2 890m
__ X -u- No 3 1395m __
No4 1870m _
-~-Sea level-
X
0 10 15 20 30 35 days
0 2 3 U-0 0 ~~-~---~---
Permeable fill
u
le 5 --~ middoto 10
0 oi Clayc
c 1i 15
0
20
Legend
U Pore pressure in metric tm1
D = Depth below MWL in m
m
Fig 33 Pore pressure measurements in a quay dope at Uddevalla (November 9 to December 14 1955)
sect 5 Precision Pick-Up
The precision of the electro pneumatic pick-up can be considerably improved if we permit slightly greater measurement time lags With a few alterations of the pick-up as described in sect 4 cl this is possible
The principle is shown in Fig 34 Here the lower bellows is subjected only to the difference between the pore pressure on the inside and a certain static pressure on the outside and not to the whole pore pressure as described in sect 4 d The static pressure is produced by filling water to a desired level in the filter
54
Compressed air bottle Mercury manometer-
Distances
Electrical contact copy check ~l====~I
to be measured
Standard distance----~
Oil
Hg
Air
Fig 34 Principle of precision electro pneumatic meter
55
cm w col
zoo
VI
3 ~
1500
L
3 ~
C 0
O C 100u 0
u C
L
~ O
c 50 ~ VI 1l
L a
0 0 50 100 150 200 cm w col
Pressure difference acting on upper bellows ( os read off by mercury manometer)
~
o Increasing pore pressure x Decreasing pore preure
~ ~
I
~ ~
~
middot-lig 35 Calibration curve of precision picl-up
pipe This water is permitted to communicate with the air-filled space between the t wo bellows which is thus submitted to the same static pressure as the water The upper bellows is protected against overpressure from below by limiting the possible deflection
The two bellows are soldered to fittings separated by a perforated pipe A thin rubber hose is loosely fitted on the outside of this pipe T he space inside this hose is filled with air On the outside the water is free to enter through holes in the upper and lower parts of the protection tube
The fitting of the upper bellows is shaped to limit the deflection of the bellows and to fit in the connection hose The fitting is electrically insulated by means of two Lucite rings One of the electrical conductors leading from the contact-checking device is soldered to the fitting for the upper bellows
56
and the other to the extension of the perforated pipe which is electrically connected to the lower bellows
The contact-checking device is exactly the same as that described in sect 3 andsect 4 e
The bellows undergo a deflection of Oa2 mm in a pressure range of 2 m of water column As the accuracy of the contacts is about 0001 mm (sect 3 b) the sensitivity is about 6 mm of water column The volume factor is about 10 middot 10-4 cm5g that is of the same order although a little higher than for the instruments described in sect 4
We have successfully used a multiple mercury manometer for air pressure measurements It bas a range of 40 m of water column Its accuracy is 1 cm of water column In most cases it is sufficient to have a range of 10 m of water column which corresponds to only one U-bend The accuracy of the manometer is then higher than + 5 mm of water column Fig 35 shows a calibration curve of the precision pick-up
The accuracy in measurements is also dependent on the determination of the water level in the filter pipe and on the depth of the filter below ground level Both can be determined by means of a single sounding operation inside the filter pipe with an accuracy of a few millimetres
Another advantage of this type of meter is its independence of the tempershyature
The meter has only been ready a few months and our experience with it is therefore rather limited
sect 6 Conclusions
From the above we can draw the following general conclusions Before starting pore pressure measurements it is recommendable to estimate
the smallest accuracy and sensitivity in measurements that will be sufficient for the problem under consideration Further it is advisable to estimate the greatest probable change in pore pressure with the time and the permeability of the soil These data will permit the selection of a suitable measuring inshystrument having the appropriate accuracy sensitivity volume factor pipe diameter and equivalent filter diameter The cross-sectional area of the pipe is a measure of the installation time lag Eqs (10 a) (11 a) and (11 b) in sect 1 b 2 can be used to calculate the measurement time lags which are difficult to determine practically
It is always desirable to use quick-response measuring systems since errors due to great time lags arc least probable in these systems If we use such systems then no selection is normally necessary In clays this calls for closed measuring systems rather than for ordinary open pipes because-if the filters are greater than a certain definite size-it is easier to decrease the measurement time lags by reducing the volume factor of the instrument than by increasing the filter area
57
The simplest closed measuring syste1n is the liquid-filled system with a Bourdon gauge It requires no manipulation for reading and therefore permits persons living near the site to take readings By using oil instead of water in the system the risk for gas bubbles is practically eliminated Closed liquidshyfilled systems have the drawback of being considerably temperature-sensitive However this can be counteracted by using insulated boxes in close contact with the soil or by using temperature-compensating devices
For cases where the pore pressure is low in relation to the depth an electro pneumatic measuring syste111 can be used The type designed by the Institute has the advantage of being unaffected by temperature It is more intricate and more expensive than the liquid-filled system and requires certain manipushylations in measurements but they do not generally affect the pore pressure in the soil
The SGI system with an in-situ connection permits checking of the mcasure-1ncnts and prevents the 1nctcrs from being damaged during installation It also enables precision 1neasurements by exchanging a wide-range instrument for a narrow-range pressure-compensated instrument
For evaluation of measurements (transforming 1t 1 to u 8 sect 1 b 2) the instrushyment data and the soil permeability must be numerically knOvn Recording instruments arc considered to be especially useful for evaluations
Quick-acting instruments and sometimes recording instruments are economishycal since they save time and reduce the number of manual readings required to give reliable values
The instruments above should not be regarded as a final solution for all kinds of pore pressure measurements They contain however many considerations which contribute to a better understanding of such measurements
sect 7 Summary
lIeasurement of pore water pressure in connection with field investigations is first treated in principle It is shown that the accuracy and sensitivity in measurements together with the volume factor of the instrument and the equivalent filter cliametcrn determine the possibility of measuring variable pressures and govern the time lags
The development of pore wmiddotatcr pressure meters at the Institute is described This development resulted in a system of interchangeable parts (long filter short filter oil-filled pick-up electro pneumatic pick-up recording instruments and a precision instrument) Disturbances due to temperature changes and gas bubbles were eliminated Practical experiences are discussed
LIST OF PUBLICATIONS
FROM THE ROYAL SWEDISH GEOTECHNICAL
INSTITUTE
Proceedings
No 1 Soil Sampler with Metal Foils Device for Taking Undisturbed Samples of Very Great Length W Kjellman T Kallstenius and 0 Wager 1950
2 The Vane Borer An Apparatus for Determining the Shear Strength of Clay Soils Directly in the Ground Lyman Cadling and Sten Odenstad 1950
3 Device and Procedure for Loading Tests on Piles W Kjell1nan and Y Liljedahl 1951
4 The Landslide at Skottorp on the Lidan Rhmiddoter February 2 1946 Sten Odenstad 1951
5 The Landslide at Surte on the Gota River September 29 1950 Bernt Jakobson 1952
6 A New Geotechnical Classification System W Kjellman L Cad-ling and N Flodin 1958
7 Some Side-Intake Soil Samplers for Sand and Gravel Torsten Kallstenius 1953
8 Influence of Sampler Type and Testing Method on Sheur Strength of Clay Samples Bernt Jakobson 1954
9 Some Relations between Stress and Strain in Coarse-Grained Cohe-sionless Materials W Kjellman and B Jakobson 1955
10 Accurate Measurement of Settlements W Kjellman T Kallste-nius and Y Liljedahl 1955
11 Influence of Organic Matter on Differential Thermal Analysis of Clays Lennart Silfverberg 1955
12 Investigations of Soil Pressure Measuring by means of Cells Tars-ten Kallstenius and Werner Bergau 1956
13 Pore Water Pressure Measurement in Field Investigations Torsten Kallstenius and Alf Wallgren 1956
Meddelanden
No I Kortfattat kompendium i geoteknik 1946 1946
2 Redogorelse for Statens geotekniska instituts verksamhet under Aren 1944--1948 1949
a raquoBra borrat - biittre byggtraquo Meddelande utgivet till inst itutets deltagande i utstiillningen raquoBygg biittreraquo Nordisk Byggnadsdag V 1950
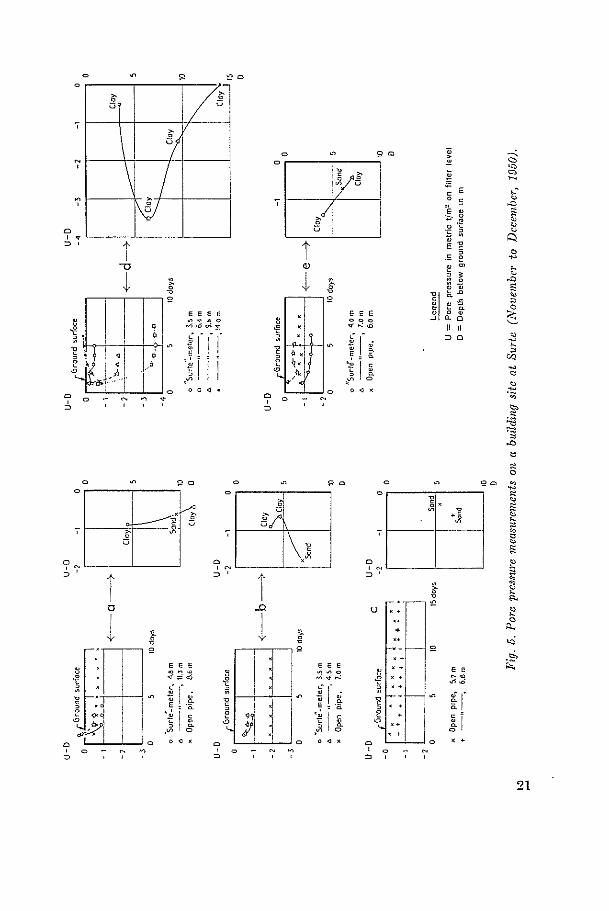
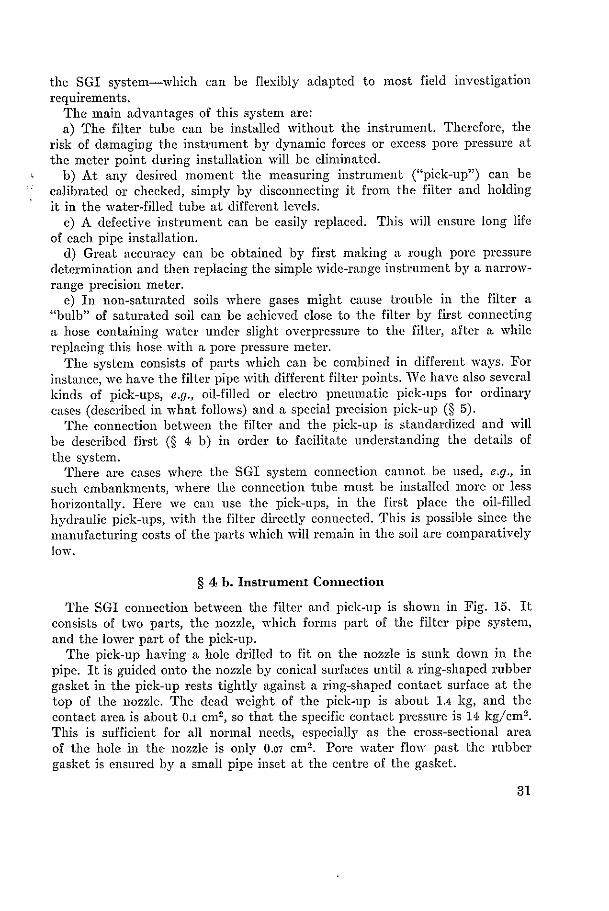

---
r
rmiddot i -
i
bull I l Ii1-bull
i I 1 bull I _
I 4gt35mm
E e
a 0
Fig 18 Filter pipe type SGI II Fig 19 Sealing cap a Jiilter of normal length
b Lengthened filler for thin sand layers
36
After installation the pipe is filled entirely with water unless the pore pressure is supposed to be very low In the latter case water is only filled to a level corresponding to the assumed free pore water table
In low-permeability soils the pipe is left open about one day to permit t he ini tial great pore Yater overpressure to be reduced below an acceptable limit Then either the pick-up or the scaling cap shown in Pig 19 is connected to the nozzle This is done to prevent the natural pore pressure from being changed by the water pressure in t he pipe
I t is necessary to avoid freezing of the pick-up during winter days In non-saturated soils it is advisable to let rnter seep from the filter pipe
into the soil closest to the filter a sufficient time to form a bulb of satura ted soil around the fi lter point In this way one avoids troubles from gases entering the filter from t he outside
sect 4 d Oil-Filled Pick-Up
sect 4 d 1 Principles
The system with oil-filled pick-up is a further development of the early hydraulic meters described in sect 2 In principle the pore pressure in this system is also transmitted from the meter point Lhrough a fluid in a pipe to a Bourdon gauge situated at ground level The essential difference is that the pressure t ransmission system is entirely filled with silicon oil and forms a closed unit which is assembled in the workshop The lowest part of this unit is provided with an extremely flexible thin rubber diaphragm which separates the fluid in this system from the pore water but can transmit the pore pressure with a very small pressure loss By using the oil fill we are to a very great extent free from t roubles due to gas bubbles Ve can therefore radically decrease the diameter of the connecting pipe to a capillary size The tube can then easily be wound around a drum and can be handled like a rope
A further advantage of the oil fill is that the measuring system is frost-proof It also permits measurements of ground-water tables which are slightly deeper than in the case of the water fill owing to the smaller specific gravity and vapour pressure of the oil and to the absence of gas bubbles The freedom from gases gives the additional advantage that the fluid is almost incomshypressible at the pressures under considerat ion Consequently the measurement time lags are very small On the other hand we obtain time lags if the oil is too viscous since the resistance to flow in the capillary tube will then be high Thin silicon oil has a low viscosity even at low t emperatures and we have therefore eliminated this source of error
The specific gravity of the oil must be exactly known for det ermining the pore pressure which corresponds to a given gauge reading W e refer to Fig 8 and the following symbols
37
y = specific gravity of oil in kg cm3
uu = pressure indicated by gauge in metres of water column II = vertical distance in metres from gauge to half the height of the
filter u = pore water pressure in filter in metres of water column
We then have U = lJy + u0 bullbullbullbullbullbullbullbullbullbull bull bullbullbull (12)
sect 4 d f2 Design and Construction
The oil-filled pick-up is shown in Fig 20 The rubber membrane is very thin and has an approximately semispherical
shape It is provided with a rim at the circumference The lower part of the pick-up is extended by means of a thin piece of tube
When assembling the pick-up the lower part and the upper part can be pressed together and the tube of the lower part can be soldered to the upper part The position of this solder joint at a sufficient distance from the rubber membrane prevents the soldering heat from destroying the membrane
The connection between the element body and the Bourdon gauge is a copper capillary 3 mm in outer diameter and only ls mm in inner diameter It is welded to standard type pipe fittings The length of our capillary tube is normally 20 or 30 metres
First we tried plastic tubing which has been used in some countries We found however that a great amount of gas bubbles appeared in this tubing as soon as it was in contact with air Therefore we made some tests We cut polyethylene and polyvinylchloride tubing into one-metre lengths which were filled with water After closing the ends the test pieces were kept in the laboratory and weighed each day Already after one day air bubbles were observshyed in the polyvinylchloride tubes and after about ten days these tubes were empty Also the polyethylene tubing showed considerable although less permeashybility Similar tests with viscous oil showed no tendency of the oil to disappear These tests induced us to avoid plastic tubing in our pore pressure meter designs (Later tests with Saran tubing showed however that this material is satisfactory)
The Bourdon gauge is all-bronze Before assembling the system each part is first separately filled with
evacuat ed oil To put the diaphragm in a neutral position the pick-up is placed on a calibration nozzle (cf Fig 16) A syringe is used to remove 3 cm3
of oil from the upper chamber at the same time as air is let in through the nozzle until the oil level in the upper chamber again reaches its original position As the Bourdon gauge will only require about 02 cm3 of oil to move through the whole range we know that the diaphragm will never reach its ultimate positions provided that the system is tight
Fig 21 shows the assembled system Fig 22 shows the calibrated volume change of the instrument (cf Fig 4)
38
Copper capillary Soldered
I
Bourdon gouge
I
---Rim
~if-- Rubber membrane
Welded
Fig 20 Oil-filled picc-up Longitudinal section
The data of this instrument arc as follows Range - 10 to + 10 m of water column Error plusmn 10 cm of water column Sensitivity 5 cm of water column Volume factor (6) 2 middot 10-middot1 cm5g
A comparison middotwith the meters described in sect 2 shows that the accuracy and the sensitivity of this instrument are theoretically the same as those of the Viisby meter In practice hmvever the ncv instrument is much more reliable as disturbances due to gas bubbles are asoidcd almost entirely and calibration is possible under field conditions The measurement time lag is 1nuch smaller owing partly to a greater nominal filter diameter and partly to a smaller real volume factor
30
Fig 21 Oil-filled pick-up
U kgcm1
10
08
0amp
04
0
II
II
II
II
0 004 006 012 016 020 cm
Variatio n in vol ume
Fig 22 Oil-filled pick-up Variat ion in volume with pressure
40
Cover
Pore pressure meter
Fig 23 Insulating box
A point of special importance is the temperature sensitivity shown in sect 2 Liquid-filled closed systems are temperature-sensitive and special measures must be taken to counteract this A simple calculation shows the great importance of thermal influences Our Bourdon gauge has an inner volume of 19 000 mm3 and requires a volume change of 200 mm3 to indicate a pore pressure change of ten metres of water column Now the coefficient of thermal expansion of the oil is 00009 If the temperature changes 10deg C which at sun-
41
Ordinary Bourdon gauge
I Compensation volume for Bourdon gauge
Secondary bellowamp
Primary bellows
Capillary from pick-up -~------_
Compensation capillary closed of lower end ~-----tll-l
Drum for capillary
tubing
0
Fig 24 Temperature-compensating dnbullice for oil-filled pore ptessurc meter
rise can take few hours then the volume change in the manometer is 10 middot 00009 middot middot 19 000 = 170 mm3 bull Thus the volume change can extend almost through the whole range of the manorneter
The volume changes in the capillary tube are small in comparison vith those in the manometer and amount to only about 18 mm3 per metre of length per 10deg C of temperature change If the systen1 were filled with water vhich has a coefficient of thermal expansion of only 00001s the influence of the manometer
42
would be smaller but on the other hand the influence of the wider connecting tube which would then be required would be greater If the Bourdon gauge is enclosed in an insulating box placed in the soil see F ig 23 then the soil has an equalizing effect on the temperature Our experience has shown that the thermal influences are small in such installations provided the observer docs not open the cover when taking a reading The insulating box serves also as a protection against damage
However there are cases where it is impossible to insulate the gauge sufshyficiently Such a case is discussed in sect 4 g (Fig 35) Then the measuring system can be provided with a temperature-compensating device see Fig 24 The principle of this device is stated in what follows
A fluid is enclo3ed in a temperature-compensating system This system is arranged so that it is subjected to the same temperature changes as the measuring system When the compensating fluid changes in volume owing to temperature variations it deflects a primary bellows This bellows acts on a secondary bellows situated in the measuring system thus compensating the latter for volume changes caused by temperature This device which is in reality small and rugged has been tested a few months and has hitherto worked well
If the filter pipe has been installed for a sufficiently long time each reading can be taken in about half an hour after the pick-up has been connected
As regards the measuring costs it is to be noted that the most expensive part of most systems is the filter-pipe and not the pick-up However the quick response of the pick-up saves time and makes the meter therefore comparatively cheap in use
sect 4 e Electro Pneumatic Pick-Up
The electro pneumatic pick-up is used for the same purposes as the first electro pneumatic meter (sect 3) Thus it is primarily intended for low groundshywater levels
sect 4 e 1 Principles
The principles of this pick-up are the same as those of the meter described in sect 3 However the present pick-up is far ahead of the first meter which has been developed in several stages in order to prevent some noticed disturbances The disturbances were due to frictional forces at the periphery of the membranes to electrical short-circuits caused by moisture to insufficient electrical contacts to the air pressure arising between the membranes and to air diffusion through the rubber covers of the membranes All these disturbances have been almost completely eliminated in the latest design and the reliability has been conshysiderably increased
The membranes have been replaced by bronze bellows (Fig 25) They can be soldered to their fittings and can thus be made quite tight They are smaller in diameter than the membranes and the volume change corresponding to a given displacement has therefore been reduced
43
+-----Rubber hose
IH-J--deg~-- lnsulofed eedricol conductors
Fig 25 Electro pneumatic pick-up Longitudinal section
The measuring principle permits fairly high prec1s10n but the n1ain purpose is to ensure ruggedness Ve get an instrument accuracy of + 10 cm of water column and a sensitivity of 2 cm which is mainly determined by the Bourdon gauge
sect 4 e 12 Design and Construction
Fig 25 shows the pick-up A fitting at the lower end seals the nozzle A bellows is hard-soldered to the
top of this fitting The lower fitting is screwed in a brass cylinder A distance ring between these two parts ensures the exact position of the lower bellmvs in relation to the upper
44
U kgcm1
2o
1amp
11
08
04
0
V I
V
0 004
r7-
I
V
006 012 01amp 020 cnJ
Variation in volume
Fig 26 Electro pneumatic pick-up Variation in volume with pressure
Fig 27 Electro pneumatic meter Measitring outfit
45
I 20 ~ 15
~
10 ~
Sl
~ ~-
0 0 05 IO 1 20 2S kgcm1
Air pressure
Fig 28 Calibration curve of electro pncmnatic pick-1tp
The free ends of the bellows arc closed by end caps hard-soldercd to the bellows These caps arc also proYidcd with hard-soldered small pieces of platinum sheet which form the contact surfaces The upper contact surface is slightly curved and the Iover one is plane in order to make the contact practishycally independent of small lateral movements of the bellows The space beshytween the two contacts is 2s 1nm at zero pressure
The upper bellows is hard-soldered to the upper fitting which is electrically insulated from the cylinder by two rings (at present made of Lucite) This fitting extends into the upper bellows and forms a supporting rod A nut holds the fitting in a fixed position
One of the two electrical conductors coming from above is joined to the upper fitting (leading to the upper contact) while the other is connected to the nut (leading through the cylinder and the lower fitting to the lower contact) The top of the measuring insert is filled vith sealing compound The free space inside the cylinder is air-filled So far our experience indicates that no special moisture-absorbing agent which is often used is required here if the air contains little moisture when the syste1n is closed
VVith the bellows used the volume factor is 09 middot 10-4 c1niig as is seen fron1 the calibration diagram in Fig 26
Fig 27 shmvs the above ground equip1nent which is carried in a specially designed suitcase The air bottle contains five litres of air at a pressure of 150 kgc1112 bull This pressure is read on the small manometer which indicates how
46
much air is still available The larger manometer measures the air pressure after the air has passed the reducing valve (which is seen on the right) On the left of the larger manometer there is a milliammeter which indicates when the circuit is closed Further to the left there is a push button for checking the dry cells
Outside the suitcase we see the pick-up with its connecting hose and electrical conductors a calibration diagram the wrenches for connecting the hose the syringe for filling the pick-up hole with water and the plastic tape for occasional use (sect 4 b)
Fig 28 shows a calibration diagram of the latest meter
sect 4 f Recording Instruments
From Eq (10 a) (sect 1 b 2) we see that a correct evaluation of the pore pressure in the soil from instrument readings requires several readings taken at sufshyficiently small intervals of t ime to obtain the time derivative of the instrument readings It is useful to obtain the maxima and minima of the instrument readings because Eq (10) shows that no measurement time lag is present at these values From this point of view it is advisable to have written records
The oil-filled pick-up can easily be combined with a recording instrument For a special investigation the Institute wanted to have records covering at
least one year The recording instruments designed for this purpose are briefly described in what follows
sect 4 f 1 lnlc Recorder
The simplest way to construct a recording pore pressure meter is to use a standard pressure recorder and to connect its pressure gauge to the oil-filled pick-up In view of its small friction and simplicity an ink recorder is suitable in this case
A drawback of the ink recorder is that the minimum paper speed must be about 0s mm per hour to make the ink flow smoothly One years measurements will therefore require a diagram over 4 m in length which is fairly great The length can be reduced by reading the diagram at certain intervals and by redrawing it on a smaller time scale
The Institute has two recorders which are spring-driven and must be rewound once a month These instruments have been in use about a year and we have had very little trouble with them so far
sect 4 f 2 Optical Recorders
In order to enable long-time recording without obtaining too long diagrams and with a minimum of friction the Institute designed and construct ed meters for optical recording on photographic film
The original idea was very simple and is shown in Fig 29 A mirror is fastened on a standard Bourdon gauge Daylight enters through a tube with
47
Oayliqt
t ~--Glass
Spring motor
Mirror
Capillary to pick-up
II1
Rotating drum
with
photographic
r1m
III
film case Shutter for film case
Fig 29 Simple optical recorder
two pinholes 02 mm in diameter forming a spot of light that is reflected by the mirror on to a film on a rotating drum This drum makes in our case one turn per year and is driven by a spring Exposure tests showed that it is possible to obtain good records throughout the year even in very faint dayshylight This idea has not yet been realized because we were afraid that snow in the winter might interrupt the record
Therefore we made an optical recorder using artificial light (Fig 30)1 bull
The only difference from Fig 29 is the optical system The light source consists of two miniature electrical bulbs which arc fed with
current impulses of only 110 sec duration The bulbs are lit alternatively so that a flash is produced every second hour if both bulbs are intact Should one bulb be defective one flash would anyway be obtained every fourth hour The light from the bulbs is concentrated and focused on the photographic film after being reflected by the movable mirror
The electrical current is supplied from an accumulator and is primarily feel to an electrical clock wound up ten times an hour by the stroke of an electromagnet It is the current flowing through this electromagnet that is utilized for the flashes A disc fastened on the hour hand of the clock switches
Devised in co-operation middotwith lfr Vilerner Bergau Mechanical Department of the Institute 1
48
-----+--- Eleclricol clock
Atumulotor -=-
Check bulbs
Push
____kgtJ button switches __j
Rotating
drum
I
Fig 30 Artificial light system for optical recorder
on the bulbs alternatively during a time that is sufficiently long to enable one flash impulse to be fed through the bulb each time it is switched on In one year the effective time of current flow through a bulb is only one hour This ensures long life of bulbs and cmTent supply The accumulators should easily last a year
The bulbs can be checked by means of check bulbs During this the bulbs remain switched on a longer time than the duration of the ordinary flash and a larger spot will be marked on the diagram Once a month a man supervises the apparatus and winds up the spring motor He also reads the pore pressure value indicated by the Bourdon gauge At the same time he checks the bulbs and the accumulators Afterwards his readings can easily be correlated with known points on the records Six months experience with two recorders in the field has shown that they work satisfactorily
sect 4 g Experience with SGI System
Our practical experience with the SGI system mostly concerns the 6 cm filter pipe used together with the oil-filled pick-up This combination is normally sufficient for Swedish clays
49
1U
-0
U-0
1
UI
_
l5 t c
rYJ
3 -
e4
19
54
c O ~
8 lt(
L 6r
ound
sur
face
-
I0
0
I M
ore
than
10
m o
f w
col
ove
rpre
ssur
eE
f I
-I
2
0
5 IO
15
20
25
3
0
35
do
y
U-D
2
1
Gro
und
surfa
ce
31
3_
-0
--
--
-0
- -a
middot-t-middot
---0
-
Het
er f
roze
n
~r-
_10
-
1
No
I
24
2 -
19
3 1
954
__
J
-N
o 2
19
3 -
-30
3 1
954
9 -
2 5
10
15
20
25
30
35
40 d
oys
2
U-0
4
4
0
-1
0 10
15
20
25
30
35
day
s
I
gt-
_
_
N
oI
313
-2
24
19
54
No
2
134
-10
5
1954
7
~~
Omiddot _-
aJo
LG
roun
d 5u
rfo c
e
3U
-D
-I 0
10
15
20
25
30 d
ays
1 N
o1
1
15
-14
6
1954
1--
----
U-0
3
____
f--
--lt---
-~
I _
I t
I I
L G
roun
d su
rfac
e_
~
5
15
6
1954
-
I
~ro
un
~ s
urfa
ce
_ _
0 10
15
20
25
30
3
5 do
ys
-1 L-
---~
--~
-L
eg
en
d5
10
15
20
25
30 d
ays
U
= Po
re p
ress
ure
in m
etri
c tm
-o
-H
ydra
ulic
pic
k -
up
0
= D
epth
bel
ow g
roun
d su
rface
n m
x
Ele
ctro
-pn
eu
mo
fic
pic
k-u
p
a F
ilte
r pi
pe N
o
2 w
ith
outs
ide
coup
ling
s
b F
ilte
r pi
pe N
o 3
wit
h in
side
co
uplin
gs
1
105
m
belo
w g
roun
d su
rfac
e
1
180
m
belo
w g
roun
d su
rfac
e
2 1
20
m b
elow
gro
und
surf
ace
2
20
0 m
be
low
gro
und
surf
ace
3
15
0 m
bel
ow g
roun
d su
rfac
e
3 2
20
m
belo
w g
roun
d su
rfac
e
Fig
81
a-b
P
ore
pres
sure
mea
sure
men
ts i
n cl
ay a
t E
nkop
ing
u-o
t
w
EC
ro
xun
d su
rfoc
Lbull
I I
I I
~ L
ll31
3
03 1
9s4
-t
L----J
----~
------------------------
30
35
40
45
50
55
60
doy
s
U-
0 2
2
-t
30
35
40
45
5
0
55
60
doy
s
u-o
3 ~
Gr o
und
surf
ace
I I
~
4
4 -
125
19
54
J
I -
I
2------~
----
----
-----
---
21
s -
12
6
1954
0 I
I
-
t=
I
I o+
--
--1
-t -
----
---
---
---L
----
---
---L
--_
J0
5 10
15
20
25
3
0 d
ay
c
Fil
ler
pipe
No
5 w
ith
outs
ide
coup
ling
s
1 1
05
m
belo
w g
roun
d su
rfac
e
2 1
20
m b
elow
gro
und
sur
face
3
15
0 m
bel
ow g
roun
d s
urfa
ce
CH
U-0
1
0
0 25
30
35
doy
o
0 I I I i r
No2
31
3-n
bull
1954
N
o I
234
-10
5
1954
7
~
~
-j
L G
roun
d su
rfac
e
deg-o
middot -
ltgt
-~
bullU
~bullU
10
15
20
-~
1
1-
2U
-D
rN
o1
21
5 -
14b
19
54
-bull
L 6
roun
d su
rfac
e 10
15
20
25
30
35 d
oy
Le
ge
nd
U
= P
ore
pre
ssu
re m
met
ric
tm1
D
= D
eplh
bel
ow g
roun
d su
rfac
e in
m
-o
-H
ydra
ulic
pic
k-u
p
x E
lect
ro -
pneu
mat
ic p
rck-
up
d F
ilte
r pi
pe N
o
6 w
ith
insi
de c
oupl
ings
1
2O
0 m
be
low
gro
und
surf
ace
2
22
0 m
be
low
gro
und
sur
face
Fig
31
c-d
P
ore
pres
wre
mea
sure
men
ts i
n cl
ay a
t E
nco
ping
Fig 31 refers to pore pressure measurements at Enkoping1 near Stockholm Four SGI filter pipes and two Surte meters were installed at equal intervals along a circle about 13 m in diameter The results obtained with the Surte meters have already been discussed in sect 2 c (Fig 7)
The filter pipes were driven to increasing depths and measurements were made with two oil-filled pick-ups and one electro pneumatic pick-up which were shifted between the pipes to check possible individual errors in measurements The pick-ups were also now and then checked with reference to known water levels in the filter pipes The tops of the hydraulic meters were heat-insulated by means of the standard equipment shown in Fig 23
We observe that the curves are very smooth Fig 31 b 1 however shows a case where the water in the pick-up had frozen before it was inserted and the connection was therefore not completely tight ( checked afterwards simply by lifting and reconnecting the pick-up)
The different meters agreed within about 0 1 m of water column This was considered to be sufficient as none of the instruments were intended to be precision instruments The time required for an instrument to give a correct reading connection t ime lag was normally only about half an hour or so because we had filled water in the filter pipe to a level near the assumed ground water level When the pick-up was lowered it adapted itself to a pressure very near the pore pressure in the soil and thus required very little pore water to give correct measurements In order to let the pick-up reach the same temperature as the soil we also found it useful to keep the pick-up about ten minutes in the pipe before connecting it to the nozzle The results relating to the different pipes corresponded closely to the Surte meter measureshyments
Fig 32 shows the results obtained in an installation of oil-filled meters sunk to great depths under a river varying in water level The gauges were mounted in cases with wooden walls filled with saw-dust to a thickness of at least 02 m all around The bottoms of the cases were situated one meter above mean water level Fig 32 also shows measurements of the water level in the river and the wate1 and air temperatures The diagram resembles that in Fig 6 in shape but indicates influences of both air and water temperatures Some influence may also be due to the varying water level in the river It is obvious that temperature influences on hydraulic measurements cannot be avoided in such an installation unless use is made of a temperature-compensating device as discussed in sect 4 d 2 or an electro pneumatic pick-up (which has no temperature sensitivity)
Fig 33 which relates to a quay slope in the Port of Uddevalla (southwestern Sweden) shows pore pressure measurements which were also made with oilshyfilled meters These results indicate a fine consolidation curve of a clay layer covered with permeable fill 4 metres in thickness
1 The sile is described in Proc No 8 of the Institute
52
U-0 s~-------------------------------------------
below M W L 3 h-icc---j-0_O_o_o_gt+-o-0-Q-o--j-o---Ocz----r=~7-------------------j
I I middotCmiddotmiddotOmiddot Q Q2
bserved wa er leve m river in m
0 u gtlt- -- bullbull ___gtlt- ---x___ -middot middotgtlt x---
middotgtltmiddot gtltmiddotmiddotgtlt-middotgtltmiddotmiddotllmiddotmiddotc-----t~~~~~=-~--~--~---- Mean water level
-I~--~--~--~---~--~--~---~--5 ID 15 20 25 30 35 40 45 days
oc 25 --------~------r---~---------------r---
r-- Air temperature
~ 20 -0 ~
c E ~ 15
10 ~--~--~--~~--~--~--~---~--~ 5 10 15 20 25 30 35 40 45 days
Legend
U = Pore pressure in metric Vn with reference fo mean wafer level D - Depth below MWL in m
Fig 32 Pore pressure measurnmcnts with hydraulic pick-up below the bottom of GOta River for a vlanned tunnel and comparative measurements
of air and water temperature (June 20 to August 10 1954)
In the cases represented in Figs 31-33 the installation time lags were 8 to 12 clays Time lags half these values can be obtained with our latest filter pipe as already stated in sect 4 c 1 (Fig 18)
Our latest electro pneumatic pick-up has been tested for abont a year and seems to be reliable
In one case ve had to measure pore pressure in a soil containing much gases Immediately after installation of the filter pipes many gas bubbles escaped through the water filled open pipes VVhen gas ceased to escape we connected meters and were able to measure without trouble
t------t--+---cmiddotPmiddot6-4~---f---gtltdegt---+----nlf-_ 6
middot6
53
4
3
2
0
-1
0 Pipe No1 365 m below M W L 0 -u- No2 890m
__ X -u- No 3 1395m __
No4 1870m _
-~-Sea level-
X
0 10 15 20 30 35 days
0 2 3 U-0 0 ~~-~---~---
Permeable fill
u
le 5 --~ middoto 10
0 oi Clayc
c 1i 15
0
20
Legend
U Pore pressure in metric tm1
D = Depth below MWL in m
m
Fig 33 Pore pressure measurements in a quay dope at Uddevalla (November 9 to December 14 1955)
sect 5 Precision Pick-Up
The precision of the electro pneumatic pick-up can be considerably improved if we permit slightly greater measurement time lags With a few alterations of the pick-up as described in sect 4 cl this is possible
The principle is shown in Fig 34 Here the lower bellows is subjected only to the difference between the pore pressure on the inside and a certain static pressure on the outside and not to the whole pore pressure as described in sect 4 d The static pressure is produced by filling water to a desired level in the filter
54
Compressed air bottle Mercury manometer-
Distances
Electrical contact copy check ~l====~I
to be measured
Standard distance----~
Oil
Hg
Air
Fig 34 Principle of precision electro pneumatic meter
55
cm w col
zoo
VI
3 ~
1500
L
3 ~
C 0
O C 100u 0
u C
L
~ O
c 50 ~ VI 1l
L a
0 0 50 100 150 200 cm w col
Pressure difference acting on upper bellows ( os read off by mercury manometer)
~
o Increasing pore pressure x Decreasing pore preure
~ ~
I
~ ~
~
middot-lig 35 Calibration curve of precision picl-up
pipe This water is permitted to communicate with the air-filled space between the t wo bellows which is thus submitted to the same static pressure as the water The upper bellows is protected against overpressure from below by limiting the possible deflection
The two bellows are soldered to fittings separated by a perforated pipe A thin rubber hose is loosely fitted on the outside of this pipe T he space inside this hose is filled with air On the outside the water is free to enter through holes in the upper and lower parts of the protection tube
The fitting of the upper bellows is shaped to limit the deflection of the bellows and to fit in the connection hose The fitting is electrically insulated by means of two Lucite rings One of the electrical conductors leading from the contact-checking device is soldered to the fitting for the upper bellows
56
and the other to the extension of the perforated pipe which is electrically connected to the lower bellows
The contact-checking device is exactly the same as that described in sect 3 andsect 4 e
The bellows undergo a deflection of Oa2 mm in a pressure range of 2 m of water column As the accuracy of the contacts is about 0001 mm (sect 3 b) the sensitivity is about 6 mm of water column The volume factor is about 10 middot 10-4 cm5g that is of the same order although a little higher than for the instruments described in sect 4
We have successfully used a multiple mercury manometer for air pressure measurements It bas a range of 40 m of water column Its accuracy is 1 cm of water column In most cases it is sufficient to have a range of 10 m of water column which corresponds to only one U-bend The accuracy of the manometer is then higher than + 5 mm of water column Fig 35 shows a calibration curve of the precision pick-up
The accuracy in measurements is also dependent on the determination of the water level in the filter pipe and on the depth of the filter below ground level Both can be determined by means of a single sounding operation inside the filter pipe with an accuracy of a few millimetres
Another advantage of this type of meter is its independence of the tempershyature
The meter has only been ready a few months and our experience with it is therefore rather limited
sect 6 Conclusions
From the above we can draw the following general conclusions Before starting pore pressure measurements it is recommendable to estimate
the smallest accuracy and sensitivity in measurements that will be sufficient for the problem under consideration Further it is advisable to estimate the greatest probable change in pore pressure with the time and the permeability of the soil These data will permit the selection of a suitable measuring inshystrument having the appropriate accuracy sensitivity volume factor pipe diameter and equivalent filter diameter The cross-sectional area of the pipe is a measure of the installation time lag Eqs (10 a) (11 a) and (11 b) in sect 1 b 2 can be used to calculate the measurement time lags which are difficult to determine practically
It is always desirable to use quick-response measuring systems since errors due to great time lags arc least probable in these systems If we use such systems then no selection is normally necessary In clays this calls for closed measuring systems rather than for ordinary open pipes because-if the filters are greater than a certain definite size-it is easier to decrease the measurement time lags by reducing the volume factor of the instrument than by increasing the filter area
57
The simplest closed measuring syste1n is the liquid-filled system with a Bourdon gauge It requires no manipulation for reading and therefore permits persons living near the site to take readings By using oil instead of water in the system the risk for gas bubbles is practically eliminated Closed liquidshyfilled systems have the drawback of being considerably temperature-sensitive However this can be counteracted by using insulated boxes in close contact with the soil or by using temperature-compensating devices
For cases where the pore pressure is low in relation to the depth an electro pneumatic measuring syste111 can be used The type designed by the Institute has the advantage of being unaffected by temperature It is more intricate and more expensive than the liquid-filled system and requires certain manipushylations in measurements but they do not generally affect the pore pressure in the soil
The SGI system with an in-situ connection permits checking of the mcasure-1ncnts and prevents the 1nctcrs from being damaged during installation It also enables precision 1neasurements by exchanging a wide-range instrument for a narrow-range pressure-compensated instrument
For evaluation of measurements (transforming 1t 1 to u 8 sect 1 b 2) the instrushyment data and the soil permeability must be numerically knOvn Recording instruments arc considered to be especially useful for evaluations
Quick-acting instruments and sometimes recording instruments are economishycal since they save time and reduce the number of manual readings required to give reliable values
The instruments above should not be regarded as a final solution for all kinds of pore pressure measurements They contain however many considerations which contribute to a better understanding of such measurements
sect 7 Summary
lIeasurement of pore water pressure in connection with field investigations is first treated in principle It is shown that the accuracy and sensitivity in measurements together with the volume factor of the instrument and the equivalent filter cliametcrn determine the possibility of measuring variable pressures and govern the time lags
The development of pore wmiddotatcr pressure meters at the Institute is described This development resulted in a system of interchangeable parts (long filter short filter oil-filled pick-up electro pneumatic pick-up recording instruments and a precision instrument) Disturbances due to temperature changes and gas bubbles were eliminated Practical experiences are discussed
LIST OF PUBLICATIONS
FROM THE ROYAL SWEDISH GEOTECHNICAL
INSTITUTE
Proceedings
No 1 Soil Sampler with Metal Foils Device for Taking Undisturbed Samples of Very Great Length W Kjellman T Kallstenius and 0 Wager 1950
2 The Vane Borer An Apparatus for Determining the Shear Strength of Clay Soils Directly in the Ground Lyman Cadling and Sten Odenstad 1950
3 Device and Procedure for Loading Tests on Piles W Kjell1nan and Y Liljedahl 1951
4 The Landslide at Skottorp on the Lidan Rhmiddoter February 2 1946 Sten Odenstad 1951
5 The Landslide at Surte on the Gota River September 29 1950 Bernt Jakobson 1952
6 A New Geotechnical Classification System W Kjellman L Cad-ling and N Flodin 1958
7 Some Side-Intake Soil Samplers for Sand and Gravel Torsten Kallstenius 1953
8 Influence of Sampler Type and Testing Method on Sheur Strength of Clay Samples Bernt Jakobson 1954
9 Some Relations between Stress and Strain in Coarse-Grained Cohe-sionless Materials W Kjellman and B Jakobson 1955
10 Accurate Measurement of Settlements W Kjellman T Kallste-nius and Y Liljedahl 1955
11 Influence of Organic Matter on Differential Thermal Analysis of Clays Lennart Silfverberg 1955
12 Investigations of Soil Pressure Measuring by means of Cells Tars-ten Kallstenius and Werner Bergau 1956
13 Pore Water Pressure Measurement in Field Investigations Torsten Kallstenius and Alf Wallgren 1956
Meddelanden
No I Kortfattat kompendium i geoteknik 1946 1946
2 Redogorelse for Statens geotekniska instituts verksamhet under Aren 1944--1948 1949
a raquoBra borrat - biittre byggtraquo Meddelande utgivet till inst itutets deltagande i utstiillningen raquoBygg biittreraquo Nordisk Byggnadsdag V 1950
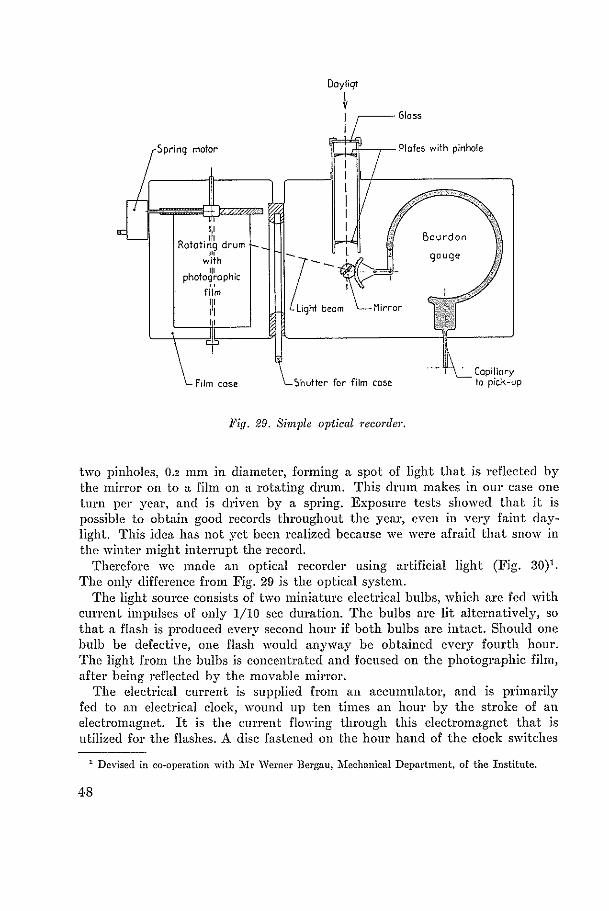
u-o
t
w
EC
ro
xun
d su
rfoc
Lbull
I I
I I
~ L
ll31
3
03 1
9s4
-t
L----J
----~
------------------------
30
35
40
45
50
55
60
doy
s
U-
0 2
2
-t
30
35
40
45
5
0
55
60
doy
s
u-o
3 ~
Gr o
und
surf
ace
I I
~
4
4 -
125
19
54
J
I -
I
2------~
----
----
-----
---
21
s -
12
6
1954
0 I
I
-
t=
I
I o+
--
--1
-t -
----
---
---
---L
----
---
---L
--_
J0
5 10
15
20
25
3
0 d
ay
c
Fil
ler
pipe
No
5 w
ith
outs
ide
coup
ling
s
1 1
05
m
belo
w g
roun
d su
rfac
e
2 1
20
m b
elow
gro
und
sur
face
3
15
0 m
bel
ow g
roun
d s
urfa
ce
CH
U-0
1
0
0 25
30
35
doy
o
0 I I I i r
No2
31
3-n
bull
1954
N
o I
234
-10
5
1954
7
~
~
-j
L G
roun
d su
rfac
e
deg-o
middot -
ltgt
-~
bullU
~bullU
10
15
20
-~
1
1-
2U
-D
rN
o1
21
5 -
14b
19
54
-bull
L 6
roun
d su
rfac
e 10
15
20
25
30
35 d
oy
Le
ge
nd
U
= P
ore
pre
ssu
re m
met
ric
tm1
D
= D
eplh
bel
ow g
roun
d su
rfac
e in
m
-o
-H
ydra
ulic
pic
k-u
p
x E
lect
ro -
pneu
mat
ic p
rck-
up
d F
ilte
r pi
pe N
o
6 w
ith
insi
de c
oupl
ings
1
2O
0 m
be
low
gro
und
surf
ace
2
22
0 m
be
low
gro
und
sur
face
Fig
31
c-d
P
ore
pres
wre
mea
sure
men
ts i
n cl
ay a
t E
nco
ping
Fig 31 refers to pore pressure measurements at Enkoping1 near Stockholm Four SGI filter pipes and two Surte meters were installed at equal intervals along a circle about 13 m in diameter The results obtained with the Surte meters have already been discussed in sect 2 c (Fig 7)
The filter pipes were driven to increasing depths and measurements were made with two oil-filled pick-ups and one electro pneumatic pick-up which were shifted between the pipes to check possible individual errors in measurements The pick-ups were also now and then checked with reference to known water levels in the filter pipes The tops of the hydraulic meters were heat-insulated by means of the standard equipment shown in Fig 23
We observe that the curves are very smooth Fig 31 b 1 however shows a case where the water in the pick-up had frozen before it was inserted and the connection was therefore not completely tight ( checked afterwards simply by lifting and reconnecting the pick-up)
The different meters agreed within about 0 1 m of water column This was considered to be sufficient as none of the instruments were intended to be precision instruments The time required for an instrument to give a correct reading connection t ime lag was normally only about half an hour or so because we had filled water in the filter pipe to a level near the assumed ground water level When the pick-up was lowered it adapted itself to a pressure very near the pore pressure in the soil and thus required very little pore water to give correct measurements In order to let the pick-up reach the same temperature as the soil we also found it useful to keep the pick-up about ten minutes in the pipe before connecting it to the nozzle The results relating to the different pipes corresponded closely to the Surte meter measureshyments
Fig 32 shows the results obtained in an installation of oil-filled meters sunk to great depths under a river varying in water level The gauges were mounted in cases with wooden walls filled with saw-dust to a thickness of at least 02 m all around The bottoms of the cases were situated one meter above mean water level Fig 32 also shows measurements of the water level in the river and the wate1 and air temperatures The diagram resembles that in Fig 6 in shape but indicates influences of both air and water temperatures Some influence may also be due to the varying water level in the river It is obvious that temperature influences on hydraulic measurements cannot be avoided in such an installation unless use is made of a temperature-compensating device as discussed in sect 4 d 2 or an electro pneumatic pick-up (which has no temperature sensitivity)
Fig 33 which relates to a quay slope in the Port of Uddevalla (southwestern Sweden) shows pore pressure measurements which were also made with oilshyfilled meters These results indicate a fine consolidation curve of a clay layer covered with permeable fill 4 metres in thickness
1 The sile is described in Proc No 8 of the Institute
52
U-0 s~-------------------------------------------
below M W L 3 h-icc---j-0_O_o_o_gt+-o-0-Q-o--j-o---Ocz----r=~7-------------------j
I I middotCmiddotmiddotOmiddot Q Q2
bserved wa er leve m river in m
0 u gtlt- -- bullbull ___gtlt- ---x___ -middot middotgtlt x---
middotgtltmiddot gtltmiddotmiddotgtlt-middotgtltmiddotmiddotllmiddotmiddotc-----t~~~~~=-~--~--~---- Mean water level
-I~--~--~--~---~--~--~---~--5 ID 15 20 25 30 35 40 45 days
oc 25 --------~------r---~---------------r---
r-- Air temperature
~ 20 -0 ~
c E ~ 15
10 ~--~--~--~~--~--~--~---~--~ 5 10 15 20 25 30 35 40 45 days
Legend
U = Pore pressure in metric Vn with reference fo mean wafer level D - Depth below MWL in m
Fig 32 Pore pressure measurnmcnts with hydraulic pick-up below the bottom of GOta River for a vlanned tunnel and comparative measurements
of air and water temperature (June 20 to August 10 1954)
In the cases represented in Figs 31-33 the installation time lags were 8 to 12 clays Time lags half these values can be obtained with our latest filter pipe as already stated in sect 4 c 1 (Fig 18)
Our latest electro pneumatic pick-up has been tested for abont a year and seems to be reliable
In one case ve had to measure pore pressure in a soil containing much gases Immediately after installation of the filter pipes many gas bubbles escaped through the water filled open pipes VVhen gas ceased to escape we connected meters and were able to measure without trouble
t------t--+---cmiddotPmiddot6-4~---f---gtltdegt---+----nlf-_ 6
middot6
53
4
3
2
0
-1
0 Pipe No1 365 m below M W L 0 -u- No2 890m
__ X -u- No 3 1395m __
No4 1870m _
-~-Sea level-
X
0 10 15 20 30 35 days
0 2 3 U-0 0 ~~-~---~---
Permeable fill
u
le 5 --~ middoto 10
0 oi Clayc
c 1i 15
0
20
Legend
U Pore pressure in metric tm1
D = Depth below MWL in m
m
Fig 33 Pore pressure measurements in a quay dope at Uddevalla (November 9 to December 14 1955)
sect 5 Precision Pick-Up
The precision of the electro pneumatic pick-up can be considerably improved if we permit slightly greater measurement time lags With a few alterations of the pick-up as described in sect 4 cl this is possible
The principle is shown in Fig 34 Here the lower bellows is subjected only to the difference between the pore pressure on the inside and a certain static pressure on the outside and not to the whole pore pressure as described in sect 4 d The static pressure is produced by filling water to a desired level in the filter
54
Compressed air bottle Mercury manometer-
Distances
Electrical contact copy check ~l====~I
to be measured
Standard distance----~
Oil
Hg
Air
Fig 34 Principle of precision electro pneumatic meter
55
cm w col
zoo
VI
3 ~
1500
L
3 ~
C 0
O C 100u 0
u C
L
~ O
c 50 ~ VI 1l
L a
0 0 50 100 150 200 cm w col
Pressure difference acting on upper bellows ( os read off by mercury manometer)
~
o Increasing pore pressure x Decreasing pore preure
~ ~
I
~ ~
~
middot-lig 35 Calibration curve of precision picl-up
pipe This water is permitted to communicate with the air-filled space between the t wo bellows which is thus submitted to the same static pressure as the water The upper bellows is protected against overpressure from below by limiting the possible deflection
The two bellows are soldered to fittings separated by a perforated pipe A thin rubber hose is loosely fitted on the outside of this pipe T he space inside this hose is filled with air On the outside the water is free to enter through holes in the upper and lower parts of the protection tube
The fitting of the upper bellows is shaped to limit the deflection of the bellows and to fit in the connection hose The fitting is electrically insulated by means of two Lucite rings One of the electrical conductors leading from the contact-checking device is soldered to the fitting for the upper bellows
56
and the other to the extension of the perforated pipe which is electrically connected to the lower bellows
The contact-checking device is exactly the same as that described in sect 3 andsect 4 e
The bellows undergo a deflection of Oa2 mm in a pressure range of 2 m of water column As the accuracy of the contacts is about 0001 mm (sect 3 b) the sensitivity is about 6 mm of water column The volume factor is about 10 middot 10-4 cm5g that is of the same order although a little higher than for the instruments described in sect 4
We have successfully used a multiple mercury manometer for air pressure measurements It bas a range of 40 m of water column Its accuracy is 1 cm of water column In most cases it is sufficient to have a range of 10 m of water column which corresponds to only one U-bend The accuracy of the manometer is then higher than + 5 mm of water column Fig 35 shows a calibration curve of the precision pick-up
The accuracy in measurements is also dependent on the determination of the water level in the filter pipe and on the depth of the filter below ground level Both can be determined by means of a single sounding operation inside the filter pipe with an accuracy of a few millimetres
Another advantage of this type of meter is its independence of the tempershyature
The meter has only been ready a few months and our experience with it is therefore rather limited
sect 6 Conclusions
From the above we can draw the following general conclusions Before starting pore pressure measurements it is recommendable to estimate
the smallest accuracy and sensitivity in measurements that will be sufficient for the problem under consideration Further it is advisable to estimate the greatest probable change in pore pressure with the time and the permeability of the soil These data will permit the selection of a suitable measuring inshystrument having the appropriate accuracy sensitivity volume factor pipe diameter and equivalent filter diameter The cross-sectional area of the pipe is a measure of the installation time lag Eqs (10 a) (11 a) and (11 b) in sect 1 b 2 can be used to calculate the measurement time lags which are difficult to determine practically
It is always desirable to use quick-response measuring systems since errors due to great time lags arc least probable in these systems If we use such systems then no selection is normally necessary In clays this calls for closed measuring systems rather than for ordinary open pipes because-if the filters are greater than a certain definite size-it is easier to decrease the measurement time lags by reducing the volume factor of the instrument than by increasing the filter area
57
The simplest closed measuring syste1n is the liquid-filled system with a Bourdon gauge It requires no manipulation for reading and therefore permits persons living near the site to take readings By using oil instead of water in the system the risk for gas bubbles is practically eliminated Closed liquidshyfilled systems have the drawback of being considerably temperature-sensitive However this can be counteracted by using insulated boxes in close contact with the soil or by using temperature-compensating devices
For cases where the pore pressure is low in relation to the depth an electro pneumatic measuring syste111 can be used The type designed by the Institute has the advantage of being unaffected by temperature It is more intricate and more expensive than the liquid-filled system and requires certain manipushylations in measurements but they do not generally affect the pore pressure in the soil
The SGI system with an in-situ connection permits checking of the mcasure-1ncnts and prevents the 1nctcrs from being damaged during installation It also enables precision 1neasurements by exchanging a wide-range instrument for a narrow-range pressure-compensated instrument
For evaluation of measurements (transforming 1t 1 to u 8 sect 1 b 2) the instrushyment data and the soil permeability must be numerically knOvn Recording instruments arc considered to be especially useful for evaluations
Quick-acting instruments and sometimes recording instruments are economishycal since they save time and reduce the number of manual readings required to give reliable values
The instruments above should not be regarded as a final solution for all kinds of pore pressure measurements They contain however many considerations which contribute to a better understanding of such measurements
sect 7 Summary
lIeasurement of pore water pressure in connection with field investigations is first treated in principle It is shown that the accuracy and sensitivity in measurements together with the volume factor of the instrument and the equivalent filter cliametcrn determine the possibility of measuring variable pressures and govern the time lags
The development of pore wmiddotatcr pressure meters at the Institute is described This development resulted in a system of interchangeable parts (long filter short filter oil-filled pick-up electro pneumatic pick-up recording instruments and a precision instrument) Disturbances due to temperature changes and gas bubbles were eliminated Practical experiences are discussed
LIST OF PUBLICATIONS
FROM THE ROYAL SWEDISH GEOTECHNICAL
INSTITUTE
Proceedings
No 1 Soil Sampler with Metal Foils Device for Taking Undisturbed Samples of Very Great Length W Kjellman T Kallstenius and 0 Wager 1950
2 The Vane Borer An Apparatus for Determining the Shear Strength of Clay Soils Directly in the Ground Lyman Cadling and Sten Odenstad 1950
3 Device and Procedure for Loading Tests on Piles W Kjell1nan and Y Liljedahl 1951
4 The Landslide at Skottorp on the Lidan Rhmiddoter February 2 1946 Sten Odenstad 1951
5 The Landslide at Surte on the Gota River September 29 1950 Bernt Jakobson 1952
6 A New Geotechnical Classification System W Kjellman L Cad-ling and N Flodin 1958
7 Some Side-Intake Soil Samplers for Sand and Gravel Torsten Kallstenius 1953
8 Influence of Sampler Type and Testing Method on Sheur Strength of Clay Samples Bernt Jakobson 1954
9 Some Relations between Stress and Strain in Coarse-Grained Cohe-sionless Materials W Kjellman and B Jakobson 1955
10 Accurate Measurement of Settlements W Kjellman T Kallste-nius and Y Liljedahl 1955
11 Influence of Organic Matter on Differential Thermal Analysis of Clays Lennart Silfverberg 1955
12 Investigations of Soil Pressure Measuring by means of Cells Tars-ten Kallstenius and Werner Bergau 1956
13 Pore Water Pressure Measurement in Field Investigations Torsten Kallstenius and Alf Wallgren 1956
Meddelanden
No I Kortfattat kompendium i geoteknik 1946 1946
2 Redogorelse for Statens geotekniska instituts verksamhet under Aren 1944--1948 1949
a raquoBra borrat - biittre byggtraquo Meddelande utgivet till inst itutets deltagande i utstiillningen raquoBygg biittreraquo Nordisk Byggnadsdag V 1950
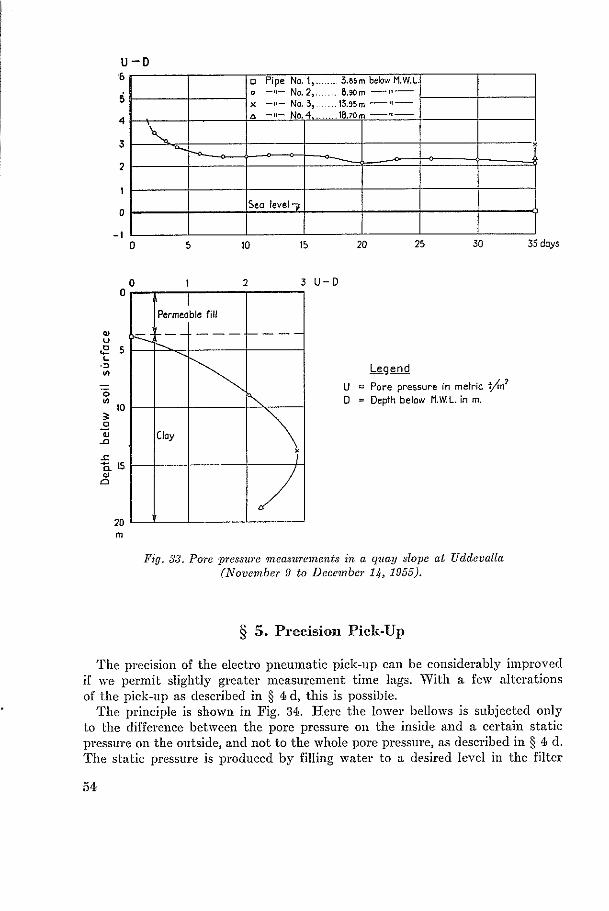
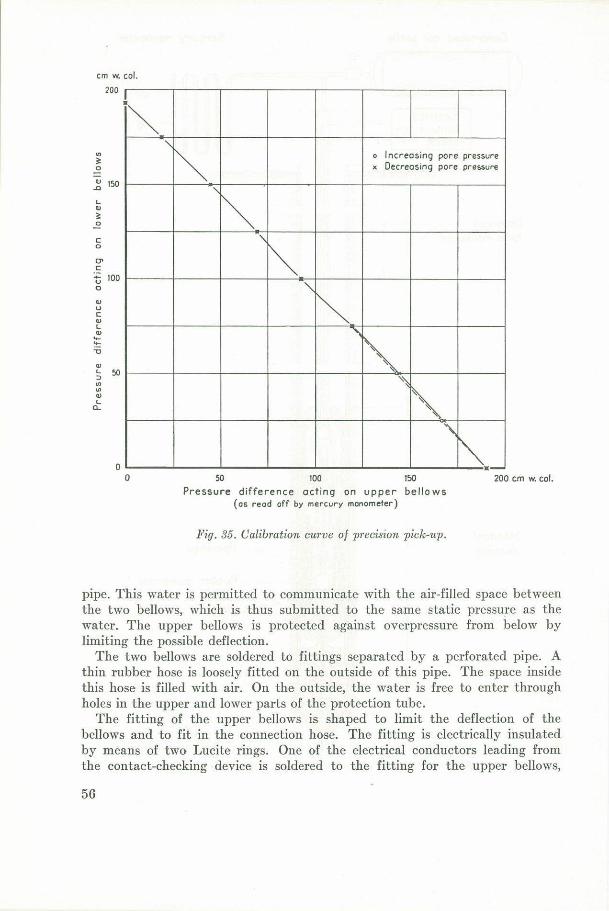