pore network modeling of fibrous gas diffusion layers for
TRANSCRIPT

Pore Network Modeling of Fibrous Gas Diffusion Layers for Polymer
Electrolyte Membrane Fuel Cells
Jeff T. Gostick, Marios A. Ioannidis, Michael W. Fowler*, Mark D. Pritzker
Department of Chemical Engineering
University of Waterloo, Waterloo, Ontario, Canada N2L 3G1
* Corresponding Author: [email protected]
Keywords: polymer electrolyte membrane, fuel cell, gas diffusion layer, pore
network modeling, mass transfer, permeability, diffusivity, capillary pressure.
The final publication is available at Elsevier via http://dx.doi.org/10.1016/j.jpowsour.2007.04.059 © 2017. This manuscript version is made available under the CC-BY-NC-ND 4.0 license http://creativecommons.org/licenses/by-nc-nd/4.0/
2
Abstract
A pore network model of the gas diffusion layer (GDL) in a polymer electrolyte
membrane fuel cell is developed and validated. The model idealizes the GDL as
a regular cubic network of pore bodies and pore throats following respective size
distributions. Geometric parameters of the pore network model are calibrated
with respect to porosimetry and gas permeability measurements for two common
GDL materials and the model is subsequently used to compute the pore-scale
distribution of water and gas under drainage conditions using an invasion
percolation algorithm. From this information, the relative permeability of water
and gas and the effective gas diffusivity are computed as functions of water
saturation using resistor-network theory. Comparison of the model predictions
with those obtained from constitutive relationships commonly used in current
PEMFC models indicates that the latter may significantly overestimate the gas
phase transport properties. Alternative relationships are suggested that better
match the pore network model results. The pore network model is also used to
calculate the limiting current in a PEMFC under operating conditions for which
transport through the GDL dominates mass transfer resistance. The results
suggest that a dry GDL does not limit the performance of a PEMFC, but it may
become a significant source of concentration polarization as the GDL becomes
increasingly saturated with water.

3
1. Introduction
Polymer electrolyte membrane fuel cells (PEMFCs) are a promising energy
conversion technology. However, there are still several technological difficulties
that must be overcome before they can be commercialized. One of the main
challenges is to achieve effective water management inside the cell, since the
presence of water can be both detrimental and beneficial to PEMFC performance
and durability. A highly humidified environment is preferred in the cell to maintain
membrane hydration and conductivity. Excess humidity, however, results in
condensation and blockage of pores in the electrode backing or gas diffusion
layer (GDL). These effects are complicated by the fact that water is a product of
the oxygen reduction reaction in the cathode compartment. At high current
densities, the increased rate of water production can lead to liquid water
formation and flooding of the GDL. An additional difficulty is that the
environmental conditions inside the cell, such as temperature, pressure and gas
compositions, can vary widely over the active area of a cell [1,2]. As a result,
ideal humidity conditions may exist in one location while liquid water may form
elsewhere. Clearly, understanding of the formation, behavior and movement of
liquid water inside the porous components of the PEMFC is of great importance.
A large number of multiphase flow models have recently appeared in the
literature that attempt to address the problem of liquid water behavior in the
cathode and its impact on mass transfer in a PEMFC [3-10]. The models
presented to date are exclusively based on continuum descriptions of flow and

4
transport, which require knowledge of constitutive relationships. These include
the dependences on water saturation of the relative permeability, effective
diffusivity and air-water capillary pressure. At present, GDL-specific
experimental data on gas or liquid phase relative permeability are scarce, the
effective diffusivity has been estimated only from numerical models [11] and only
recently have air-water capillary pressure data been made available [12]. As a
result, many of the necessary relationships and parameters incorporated in
elaborate multiphase transport models remain uncertain and application of these
models to different GDL materials is questionable.
An alternative approach to modeling multiphase transport processes in GDL
materials is pore network modeling. This approach has a long history in the
study of porous media of geologic origin (soil and rock) [13-16]. The basis of this
approach is a mapping of a complex pore space continuum onto a regular or
irregular lattice of sites and bonds. To derive a geometrical model it is usually
assumed that the pore space can be conceptually partitioned into a collection of
pore bodies communicating through local constrictions termed pore throats.
Model pore networks are thus constructed by assigning pore and throat sizes to
the lattice sites and bonds, respectively. Simplifying assumptions regarding the
shape of pores and throats are invariably made to facilitate the computation of
capillary and transport characteristics of the pore network elements [17]. Pore
network models are ideally suited for the simulation of low-capillary number
(quasi-static) immiscible displacement using percolation concepts [13]. A main

5
advantage of pore network models is that they account explicitly for pore-level
physics and pore space geometry/topology. Prediction of various macroscopic
transport and capillary properties of porous media is relatively straightforward if
the geometric, topological and correlation properties of the porous microstructure
are properly specified. The task of extracting this information is, however, non-
trivial, typically requiring extensive characterization of 3D volume data [18].
The present work outlines the development of a pore network model to study
multiphase transport in GDLs. This is the first attempt to deploy pore network
modeling for the study of the gas diffusion layer of a PEMFC, although
Thompson [19] has applied a pore network modeling approach to conventional
paper. Numerous modifications are made to the traditional pore network
modeling framework in order to account for the unique geometric aspects of
fibrous GDLs. In the absence of 3D volume data for the GDL materials studied,
the network parameters are obtained by calibration to experimental gas
permeability and drainage capillary pressure data. The model is then used to
simulate multiphase transport scenarios of interest to PEMFC operation, such as
the diffusion of gas through a partially water-filled GDL and the convective flow of
gas and water under conditions of partial water saturation. Results are
presented for two typical GDL materials for which the necessary experimental
information is available. Finally, calculations of limiting current densities are
performed by placing typical fuel cell boundary conditions on the network model

6
and calculating the mass transfer flux through partially saturated GDLs to the
catalyst layer.

7
2. Model Development
2.1. Materials to be Modeled
In this work, the porous networks of two different types of carbon paper are
modeled. Fig. 1 shows micrographs of SGL Sigracet® 10BA and Toray 090.
Toray 090 has a mostly 2D structure with linear fibers arranged in layers in the
plane of the paper. SGL 10BA has a more 3D structure with intertwined, curved
fibers. Physical properties of each material are listed in Table 1.
2.2. Pore Network Construction
One of the distinguishing features of GDLs is that they possess a very high
porosity, which can range from 0.75 to above 0.90, meaning that GDLs are
predominantly void space. Moreover, there is little constriction between pores,
creating a highly open structure. Fig. 2 shows a cross-sectional slice obtained
from a simple solid model of a GDL. With such small solid phase fraction, it is
difficult to define distinct pore bodies or to identify pore throats. This situation is
quite different from the one encountered in rocks and soils, for which pore bodies
and pore throats can be intuitively delineated in images of the pore space.
2.2.1. Pore and Throat Size Distributions
The pore network model developed here for GDLs is based on the one described
by Ioannidis and Chatzis [17] and Chang and Ioannidis [20]. The pores are

8
modeled as nodes on a regular cubic lattice, interconnected with throats. The
pores are idealized as cubic bodies and the throats are treated as ducts of
square cross-section. This arrangement is shown in Fig. 3 with the relevant
dimensions labeled. The use of square pores is convenient in order to achieve
sufficiently high porosities and to qualitatively describe the presence of corners
and crevices in the pore space. The pore network is constructed by assigning
pore body sizes from a truncated Weibull cumulative distribution:
minmaxi,p b ln b 1
1 (1)
where bp,i is the radius of the ith pore, is a random number between 0 and 1,
max (< 1) scales the random number and truncates the upper end of the
distribution to prevent excessively large pores from being generated, bmin is the
minimum pore radius and and are adjustable parameters that control the
location/spread and shape of the distribution. A Weibull distribution is used since
it is highly versatile and mathematically simple [17], containing only two
adjustable parameters. These features are advantageous when pore size
distribution is adjusted to calibrate the model as described in Section 3.1.
Once pore sizes are assigned, throat sizes are assigned by assuming that the
size of each throat is equal to the size of the smallest of the two adjacent pores.
This throat assignment scheme is chosen because it allows for minimum
constriction between pore bodies, creating a highly open structure characteristic

9
of GDLs. Fig. 4a shows the construction of the lattice with pores and throats
identified. Fig. 4b shows only the void and solid space of the same lattice. The
open nature of the pore space obtained by this method of throat size assignment
is apparent.
The length of each throat is calculated as the difference between the lattice
constant LC and the size of the two connecting pores. The lattice constant is the
spacing between pore centers and is adjusted to match the porosity of the
network model to the known porosity of the material. This is discussed further in
Section 3.2. Consequences of this size assignment scheme are that throats and
pores have similar size and their volume cannot be neglected in the calculation of
the total lattice volume. In fact, a throat is actually an extension of the pore body
to which it is attached and the lattice is basically an assembly of pores connected
directly to pores.
It should be clear that the aforementioned description is by no means an attempt
to reproduce the actual geometry of GDL pore space. What is sought instead is
to endow the pore network model with sufficient flexibility to reproduce
experimental measurements of capillary pressure and gas permeability (in-plane
and through-plane). Obviously, a better way to construct the pore network would
be to extract its geometric and topological properties from experimental 3D
volume data of the GDL materials.

10
2.2.2. Spatial Correlation of Pores Sizes
One of the key features included in the model is spatial correlation of pore sizes.
A highly porous material such as a GDL contains regions of extended continuous
void space with no solid to mark distinct boundaries between pore bodies. In
terms of the pore network model, these regions are analogous to multiple
neighboring pores of similar size. Imposing spatial correlation of pore sizes in
the model results in pores of similar size being placed next to each other in the
lattice. These pores are invaded by the non-wetting phase at similar capillary
pressures and offer similar resistance to fluid flow, therefore acting as a single,
large pore. The effect of introducing spatial correlation of pores into the model is
to increase the permeability of the network by more than 20% and bring it more
in line with measured values. Experience has shown that without spatial
correlation, it is very difficult to match both the experimental permeability and the
capillary pressure curves, since both are dependent on pore size distribution (see
further discussion in Section 3).
Spatial correlation also partially accounts for the observed directional anisotropy
in the permeability tensor [21]. When pores are correlated in certain directions,
the permeability along these directions is increased. It was found that correlating
pores in the direction of fiber alignment helped to create the observed anisotropy
trends. For instance, since the fibers of Toray 090 are aligned in the x-y plane,
correlation of neighboring pores in this plane, but not in the through-plane (z-
direction), produces the correct trend. This is summarized with the notation [x,

11
y, z] = [1, 1, 0] where is the correlation distance. The fibers in SGL 10BA are
also predominantly aligned in the x-y plane, but have additional directional
alignment in the x-direction. The use of correlation distances [x, y, z] = [2, 1, 0]
partially reproduces the observed anisotropy. Fig. 5a shows a structure obtained
using a field of random, uncorrelated numbers, whereas Fig. 5b and Fig. 5c show
the structures obtained when the correlations [1, 1, 0] and [2, 1, 0], respectively,
are imposed.
Anisotropy can also be created in the model by constricting throat sizes along
specific directions. In addition to the imposition of spatial correlation, a small
amount of throat constriction was necessary to completely match the
experimentally observed anisotropy in permeability. Throats were uniformly
constricted according to the expression:
i,pij,t bb (2)
where bt,ij is the size of the throat connecting pores i and j, bp,i is the size of pore i
with bp,i < bp,j and is the throat constriction factor. The throat constriction factor
is direction dependent and described with the notation [x, y, z]. In general it
was necessary to constrict throats slightly (5-10%) in the direction perpendicular
to the axis of fiber alignment. For Toray 090 throats were constricted in the
through-plane z-direction according to [x, y, z] = [1, 1, 0.9]. In SGL 10BA, the
fibers are aligned in the x-y plane with some additional alignment in the x-
direction. Accordingly, throat constriction factors [x, y, z] = [1, 0.95, 0.95] were

12
used. Constricting throats in this way is consistent with the structure of GDLs
since flow in the cross-fiber direction is more obstructed.
2.3. Capillary Pressure
All pore throats and pore bodies in this model are assumed to be of square
cross-section. The capillary pressure, PC, required for a non-wetting fluid to
penetrate a throat of square cross-section is estimated by the Young-Laplace
equation:
tC b
cosP1
2 (3)
where is the surface tension, is the contact angle and bt is the radius of the
largest circle that can be inscribed in the square capillary. Contact angles in
GDL materials are not easily determined. The contact angle on simple carbon is
highly variable [22]. In a previous study [12], an experimental procedure was
described for estimating the microscopic contact angle of mercury on GDL fibers
by measuring the macroscopic contact angle of a sessile drop on the GDL
surface and correcting for the porosity and roughness of the surface. It was
estimated that the microscopic mercury contact angle could be as low as 110.
In the present work, an angle of 115 was used. We measured macroscopic
contact angles of water on the two GDLs of this study and adopted the same
procedure to estimate their corresponding microscopic contact angles. Table 2
lists the values so obtained. We note that GDL materials containing carbon and

13
Teflon are expected to have non-uniform wettability, although no data are
presently available to quantify this expectation. The pore network detailed here
can be modified to accommodate non-uniform contact angles.
2.4. Late Pore Filling
In reality, pore geometry is more complex than any simple geometric shape,
albeit angular, can describe. Unresolved length scales due to the presence of
cracks, corners, crevices and interstitial regions at fiber-fiber contact points
amount to pore space from which the wetting phase is displaced at capillary
pressures higher than corresponding to first entry of the non-wetting phase into
any pore in the network. To account for the gradual drainage of the wetting
phase from such small scale features, we employ the following expression [20]:
*
CCC
*C*
wpwp PP,P
Pss
(4)
where is the filling exponent, swp is the wetting phase saturation of a given pore
at capillary pressure PC, and *wps is the wetting phase saturation of the same pore
at the capillary pressure, *CP , corresponding to first entry (breakthrough) of the
non-wetting phase. The parameters and *wps are adjustable. Late pore filling
enables smaller scale features to affect the capillary pressure behavior of the
network without explicitly including them as individual pores. This treatment was

14
found to be necessary to correctly model the experimental capillary pressure
curves.
2.5. Drainage Simulation
The process considered by the present model is the drainage of a wetting phase
by slow (quasi-static) invasion of a non-wetting phase. In terms of fuel cell
operation, this simulation corresponds to the flow of liquid water (the non-wetting
phase) from the catalyst layer through the GDL to the flow channel, via a path of
the largest accessible pores. The algorithm for simulating drainage in the
network is as follows. First, an initial, low capillary pressure is selected. The
network is then scanned and all pore throats that could be penetrated at that
given capillary pressure are marked as ‘open’, along with the pore bodies to
which they are connected. Next, all distinct clusters of contiguous open throats
and pores are found and labeled. Finally, all clusters that are connected to the
injection face are identified and are counted as invaded by the invading fluid. All
pores and throats not connected to the injection face are returned to a ‘closed’
state. In this way, the invading front of the non-wetting phase only reaches pores
that are both topologically accessible from the injection face (i.e. through other
invaded pores) and penetrable at the given capillary pressure. The algorithm
proceeds by increasing the capillary pressure in small increments and repeating
the procedure until all pores and throats are open or filled with the invading fluid.
The volume of non-wetting phase within pores that are invaded at each capillary
pressure step is calculated and a capillary pressure curve is generated. In the

15
present simulations, the injection of the non-wetting phase is always in the
through-plane (z) direction. In terms of a GDL, the injection face is on one side
of the paper and the exit face is the other side.
2.6. Transport Processes in the Network
2.6.1. Convection
Determination of the flow rate and pressure drop across the pore network
requires solution of the following mass conservation equation over each pore:
n
jijiji PPgq
1
0 (5)
where i denotes the current pore, j denotes the neighboring pore, n is the number
of neighbors, qi is the net flow through pore i, gij is the hydraulic conductivity for
flow between pore i and the neighboring pore j, while Pi and Pj are the pressures
in each pore. The hydraulic conductivity, gh, of the pores and throats depend on
their size and length and is determined from the following expression for square
ducts [23]:
L
b.gh 2
282 4
(6)
where 2b is the size of the conduit opening, is the fluid viscosity and L is the
conduit length. L is equal to b for pore bodies and calculated for pore throats as
discussed in Section 2.2. The total hydraulic conductivity for flow between two

16
adjacent bodies is taken as the net conductivity for flow through half of pore i, the
connecting throat and half of pore j. The hydraulic conductivity, gh, for each
section is calculated using Eq.(6) and the net conductivity for the pore-throat-
pore assembly, as shown in Fig. 3, is found from linear resistor theory for
resistors in series:
pj,ht,hpi,hij,h gggg
1111
(7)
Eq.(5) is set up for each pore in the network to yield a system of linear equations
that can be solved in conjunction with the prescribed boundary pressures on
each side of the network to give the total flow (Q) across the network [17]. Once
Q is known, the permeability of the network can be found from Darcy’s law:
outin PPl
KAQ
(8)
where K is the absolute permeability, Pin and Pout are arbitrarily chosen inlet and
outlet boundary pressures. For flow in the Z direction, A = X∙Y∙LC2 is the area of
pore network normal to the direction of flow and l = Z∙LC is the length of the pore
network in the direction of flow. X, Y and Z are the dimensions of the network in
number of pores and LC is the lattice constant, discussed in more detail in
Section 3.2.

17
2.6.2. Diffusion
The diffusivity of the network is found in the same manner as for fluid flow. Fick’s
law for binary diffusion of A through stagnant B is:
dl
xdcD
dl
dx
x
cD
dl
dx
x
cDN B
ABB
B
ABA
A
ABA
ln
1
(9)
where DAB is the binary diffusion coefficient, c is the mole concentration, xA is the
mole fraction of species A, xB is the mole fraction of species B (xB = 1 – xA), and l
is the length of the domain. Using Eq.(9), the species conservation equation at
each network node is then written:
n
ji,Bj,Bij,di xlnxlngn
1
0 (10)
where ni is the mass transfer rate through pore i, xB,j is the concentration in the
neighboring pore j, and xB,i is the concentration in pore i. gd is analogous to the
hydraulic conductivity and is calculated for a given conduit as:
L
bcDg AB
d
22 (11)
where DAB is the diffusion coefficient and 2b is the width of the conduit. The
conductivity for diffusion through each half pore and throat is calculated using
Eq.(11) and the net conductivity for the entire conduit is found from:
pj,dt,dpi,dij,d gggg
1111
(12)

18
Upon solution of the system of species conservation equations, the effective
diffusivity of the network is found using Fick’s law:
outBinBeff
A xxl
AcDN ,, lnln
(13)
where Deff is the effective diffusivity of the network. xB,in and xB,out are the inlet
and outlet mole fractions of the stagnant species B.
2.6.3. Multiphase Transport
In order to study conditions relevant to PEMFC operation, it is necessary to
model the transport of gas and liquid as a function of water saturation in the GDL.
This can be done by calculating the water and gas effective permeability and the
gas diffusivity after the network has been partially invaded by the non-wetting
phase (water), over a range of saturations. The general approach is to modify
the conductivity of individual pores and throats as they become invaded by the
non-wetting fluid and to recalculate the overall transport through the network.
Since a certain amount of wetting phase is always present within pores and
throats invaded by the non-wetting phase, due to late pore filling effects, careful
attention must be paid to this modification, particularly in view of the fact that the
precise geometry and connectivity of the remaining wetting phase is unknown.
Two limiting cases are considered:

19
Case 1 – Once a pore is penetrated with the invading fluid (water), the residual
wetting phase is no longer conductive. This case represents the most
pessimistic scenario for gas transport since it leads to a highly obstructed and
disconnected network with increasing invading fluid saturation.
Case 2 – The residual wetting phase within pores and throats invaded by the
non-wetting phase maintains a connection with neighboring pores and offers
limited conductivity to mass transfer through films and corners, which is modeled
by assuming that the area for mass transport varies directly with the volume
fraction of the conducting phase in a given pore. This case represents the most
optimistic scenario for gas transport since it neglects the tortuosity of the pore
space containing the residual wetting phase.
In general, for both cases the expressions for hydraulic and diffusive conductivity
(Eqs.(6) and (11)) become:
mpi
i,h sL
b.g 2
282 4
(14)
and:
npi
id sL
bcDg
2
,
2
(15)
where sp is the volume fraction of conducting phase in pore i. The exponents m
and n control the behavior of the pore saturation correction and depend on the
conducting phase and case of interest. For Case 1, m = 2 and n = 1 for the non-

20
wetting phase, while m and n are both equal to infinity for the wetting phase. The
latter situation sets the conductivity to 0 for all pores that are invaded (swp < 1).
For Case 2, m = 2 and n = 1 for both phases.

21
3. Model Calibration
3.1. Pore and Throat Size Distribution
The first step in the calibration of a pore network model is to identify the pore size
distribution that enables the model to match experimentally determined drainage
capillary pressure data. The computed drainage capillary pressure curves for
SGL 10BA and Toray 090 were compared to previously reported MIP data [12]
for the displacement of air by mercury. Fig. 6 shows a comparison of the
experimental data and the model curves obtained, while Fig. 7 shows histograms
of pore size and throat size distributions used to generate these curves. The
parameters for the Weibull distribution (Eq.(1)) obtained by fitting are listed in
Fluid Surface Tension Contact Angle1
SGL 10BA Toray 090
Mercury 0.480 Nm-1 115 115
Water 0.072 Nm-1 100 98
Octane 0.022 Nm-1 0 0

22
Table 3. The mean number averaged pore diameters for Toray 090 and SGL
10BA obtained from these fit distributions are 19 m and 33 m, respectively.
These values agree well with the results of Tomadakis and Robertson [24], who
calculated pore size distributions and mean pore sizes for solid models of various
fiber arrangements and porosities. They also agree with similar data obtained
recently by Schulz et al. [25] for simulated Toray 090 and SGL 10BA materials.
The fit in the high capillary pressure region obtained for the SGL 10BA sample
was ignored since the pore space in this region represents sub-pore scale
roughness of the PTFE coating and binder materials (visible in Fig. 1b,ii). The
computed capillary pressure curves both rise more sharply than the experimental
ones due to the use of a rather narrow pore size distribution, which is necessary
to match the high porosity (see Section 3.2).
To further assess the validity of the capillary pressure curves generated by the
model, simulations were run with octane as the wetting fluid and air as the
invading fluid. This corresponds to experiments performed using the method of
standard porosimetry [12]. The advantage of considering this system is that
octane is a highly wetting fluid and its contact angle can be confidently taken
equal to 0. It should be noted that the Weibull distribution parameters listed in
Fluid Surface Tension Contact Angle1
SGL 10BA Toray 090
Mercury 0.480 Nm-1 115 115
Water 0.072 Nm-1 100 98
Octane 0.022 Nm-1 0 0

23
24
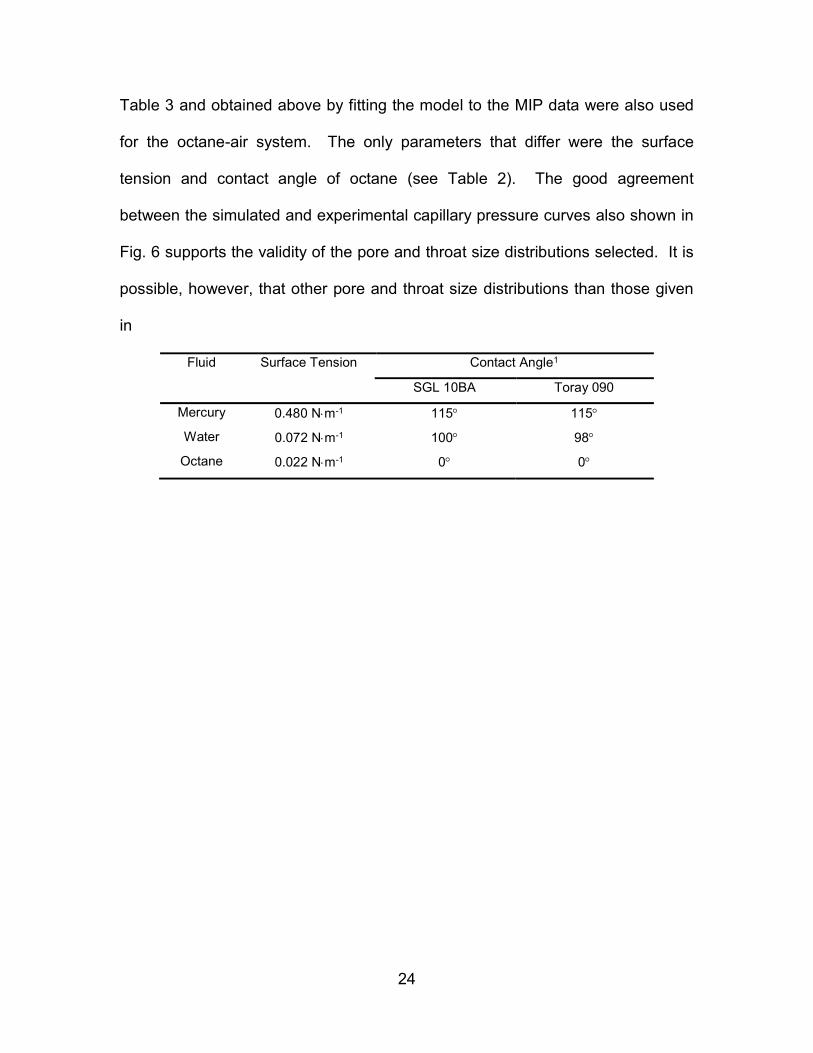
Table 3 and obtained above by fitting the model to the MIP data were also used
for the octane-air system. The only parameters that differ were the surface
tension and contact angle of octane (see Table 2). The good agreement
between the simulated and experimental capillary pressure curves also shown in
Fig. 6 supports the validity of the pore and throat size distributions selected. It is
possible, however, that other pore and throat size distributions than those given
in
Fluid Surface Tension Contact Angle1
SGL 10BA Toray 090
Mercury 0.480 Nm-1 115 115
Water 0.072 Nm-1 100 98
Octane 0.022 Nm-1 0 0

25
Table 3 could also lead to a match between the computed and measured
capillary pressure curves. It is necessary to compare model predictions to other
experimental results, such as absolute permeability and porosity, to improve
confidence in the characterization of the two GDL materials in terms of the
distributions given in
Fluid Surface Tension Contact Angle1
SGL 10BA Toray 090
Mercury 0.480 Nm-1 115 115
Water 0.072 Nm-1 100 98
Octane 0.022 Nm-1 0 0

26
Table 3.
3.2. Lattice Constant
The lattice constant is the distance between pore centers in the cubic lattice. For
a given set of pore sizes, adjusting the lattice constant controls the porosity of the
network. For instance, if the lattice constant is large, then a significant amount of
distance will exist between pores, thereby increasing the solid fraction and
reducing the porosity. In the present work, the lattice constant was determined in
the following manner. First, a pore size distribution was selected. Then an initial
guess was made for the lattice constant and corresponding throat volumes (i.e.
lengths) determined. This also allowed the porosity () of the network for a fixed
total void volume to be calculated from:
ZYXL
VV
C
tP
3
(16)
where Vp is the total pore volume of the network, Vt is the total throat volume, X, Y
and Z are the dimensions of the network expressed in terms of the number of
pores and LC is the lattice constant. The value of LC was adjusted until the
calculated porosity matched the experimental value for the material. Finally, it
was verified that LC was larger than the largest pore in the network to ensure that
no pores overlapped. If this criterion was not met, then the pore size distribution
was adjusted and the process repeated.

27
Preventing the overlap of pores is necessary to avoid several inconsistencies in
the network geometry, such as pore volumes being counted twice, throat lengths
being negative and the center-to-center distance between pores being larger
than LC. Also, if pores were allowed to overlap, it would be trivial to match
porosity, since any pore size distribution would suffice. Allowing such flexibility in
the pore size distribution would also enable a near-perfect matching of the
capillary pressure curve since an arbitrarily broad distribution could be used. On
the contrary, requiring that no pores overlap tightly constrains the range of pore
size distributions that can be used. For instance, if the pore size distribution is
very wide, the network contains many small pores. Since the lattice constant is
on the order of the largest pore, these small pores are surrounded by a
substantial amount of solid, making it impossible to have a sufficiently high
porosity. In the present work, it was necessary to use a pore size distribution
that gave a slightly steeper capillary pressure curve than the experimental data
(Fig. 6) in order to match the porosity. The ability to match the porosity, while still
achieving a good agreement of the capillary pressure curves, is a strong indicator
of the appropriateness of the pore size distributions for such high porosity
materials.
The value of LC obtained also indicates the appropriateness of the model
geometry since LC has units of length and represents the spacing between pore
centers. The lattice constant for Toray 090 has a value of 25.2 m and indicates
that 11 pores on average span the thickness of the material. SGL 10BA has a

28
lattice constant of 40.5 m, corresponding to 10 pores across its thickness.
These values are consistent with information on their structures obtained from
SEM images of GDL cross-sections [12].
3.3. Absolute Permeability
The final aspect of the model calibration is to compare the permeability of the
network with measured permeability values. Comparing the model results to
permeability data allows for verification of pore information that is not reflected in
the capillary pressure curve, such as pore lengths and connectivity. It has been
experimentally observed [21] that the in-plane permeability is higher than the
through-plane permeability, a result that has been verified numerically [26] and
analytically [27]. As discussed in Section 2.2.2, spatial correlation of pore sizes
is included in the network in combination with slight throat constrictions in order
to reproduce the observed anisotropy in the model. Measurements on Toray 090
indicate that the in-plane permeability is about 1.5 – 2 times higher than that in
the through-plane direction (Table 1). As discussed in Section 2.2.2, spatial
correlation distances of [x, y, z] = [1, 1, 0] and throat constriction factors of [x,
y, z] = [1, 1, 0.9] have been used in order to fully match the permeability data.
This procedure reproduces the anisotropy and gives good agreement between
experimental data and model results, as can be seen in
Toray 090 SGL 10BA
Network Size Parameters
LC 25.2 m 40.5 m

29
Pore Size Distribution Parameters
5.25 9
3 3.5
bmin 5 m 9 m
max 0.95 0.9
Late Pore Filling Parameters
s* 0.20 0.20
1.00 1.00
Throat Constriction Factors
x, y, z] [1, 1, 0.9] [1, 0.95, 0.95]
Pore Correlation Distances
x, y, z] [1, 1, 0] [2, 1, 0]
Table 4. The anisotropy of SGL 10BA was somewhat more complicated due to
the alignment of fibers, which caused the permeability to differ from one in-plane
direction to the other. To capture this, correlation distances of [x, y, z] = [2, 1,
0] are used along with throat constriction factors of [x, y, z] = [1, 0.95, 0.95].

30
4. Model Validation
4.1. Effective Diffusivity
Determination of the effective diffusivity of the network provides a useful means
of independently verifying the chosen network geometry. Although experimental
data for diffusion through GDLs are not yet available, limited numerical results
have been presented by Tomadakis and Sotirichos [28] for fibrous materials with
various arrangements of fiber alignment that correspond to GDL materials. The
effective diffusivities predicted by the present model are compared with those of
Tomadakis and Sotirichos [28] in
Toray 090 SGL 10BA
Network Size Parameters
LC 25.2 m 40.5 m
Pore Size Distribution Parameters
5.25 9
3 3.5
bmin 5 m 9 m
max 0.95 0.9
Late Pore Filling Parameters
s* 0.20 0.20
1.00 1.00
Throat Constriction Factors
x, y, z] [1, 1, 0.9] [1, 0.95, 0.95]
Pore Correlation Distances
x, y, z] [1, 1, 0] [2, 1, 0]
Table 4. The agreement is reasonable considering that no efforts were made to
fit the model to those values.

31
4.2. Liquid Water Injection
Recent experiments have been performed by Benziger et al. [29] to measure the
breakthrough pressure of liquid water in GDLs. In these experiments, the static
pressure of a column of liquid water above a GDL is increased until liquid
penetrates the sample. The pressure required for water breakthrough on various
samples has been reported, including a sample of Toray 120 with no PTFE
treatment. This material is thicker than the Toray 090 considered here, but
otherwise similar in structure. An experimental value of 3300 Pa was found,
which compares with a value of 2483 Pa predicted by the present model. These
values are within 25% of each other, which is reasonable considering that the
materials are not necessarily identical. The reasonable agreement between the
model and data suggest that the contact angle used for water on Toray 090 is
reasonably correct. Similar data are not available for SGL 10BA.

32
5. Results and Discussion
5.1. Relative Permeability
In the presence of two or more phases, the permeability of each phase P is
reduced since the number of available pathways is reduced by the presence of
the other phase(s). This effect is expressed in terms of relative permeability Kr,P
defined as the ratio of the effective phase permeability Keff,P(sP) in the presence
of another phase to the absolute permeability, or single phase, permeability K,
i.e.,
PP,rPP,eff sKK)s(K (17)
where sP is the volume fraction of phase P in the network. Kr,P depends on the
magnitude of saturation and history of saturation change (drainage or imbibition)
and varies between 0 and 1. In studies employing continuum models the
functional form of Kr,P has been assumed to be:
apP,r sK
(18)
where a is typically taken as 3 in the fuel cell modeling literature [30]. Equation
(18) is one of several empirical models of relative permeability and, to the best of
our knowledge its applicability to two-phase flow in fuel cell materials lacks
experimental support.
33
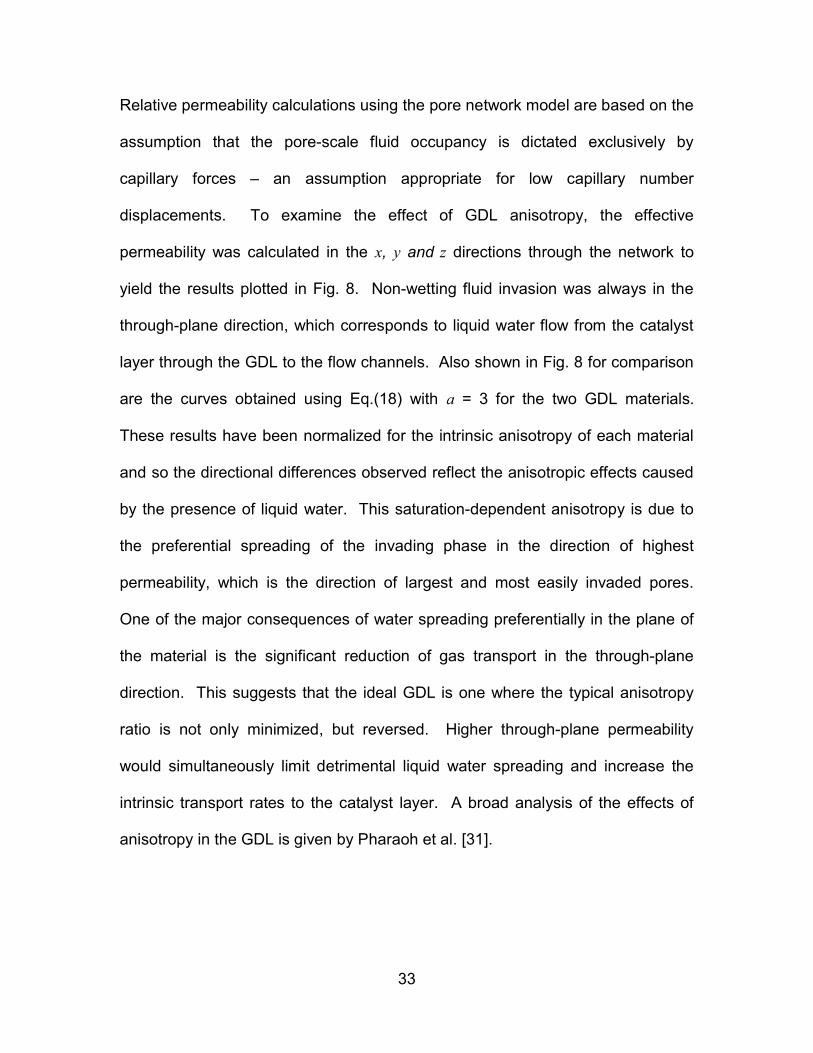
Relative permeability calculations using the pore network model are based on the
assumption that the pore-scale fluid occupancy is dictated exclusively by
capillary forces – an assumption appropriate for low capillary number
displacements. To examine the effect of GDL anisotropy, the effective
permeability was calculated in the x, y and z directions through the network to
yield the results plotted in Fig. 8. Non-wetting fluid invasion was always in the
through-plane direction, which corresponds to liquid water flow from the catalyst
layer through the GDL to the flow channels. Also shown in Fig. 8 for comparison
are the curves obtained using Eq.(18) with a = 3 for the two GDL materials.
These results have been normalized for the intrinsic anisotropy of each material
and so the directional differences observed reflect the anisotropic effects caused
by the presence of liquid water. This saturation-dependent anisotropy is due to
the preferential spreading of the invading phase in the direction of highest
permeability, which is the direction of largest and most easily invaded pores.
One of the major consequences of water spreading preferentially in the plane of
the material is the significant reduction of gas transport in the through-plane
direction. This suggests that the ideal GDL is one where the typical anisotropy
ratio is not only minimized, but reversed. Higher through-plane permeability
would simultaneously limit detrimental liquid water spreading and increase the
intrinsic transport rates to the catalyst layer. A broad analysis of the effects of
anisotropy in the GDL is given by Pharaoh et al. [31].

34
An important feature of these results is the non-zero liquid water saturation
required for liquid water to break through the GDL. For Toray 090, the
simulations show that liquid water saturations of 20% are necessary before a
continuous liquid path spans the full thickness of the GDL. For SGL 10BA, the
necessary liquid saturation is 10%. Below this critical liquid saturation, the liquid
water permeability through the GDL is zero. This behavior is not described by
the general form of the relative permeability function in Eq.(18) which predicts
finite water permeability at vanishing water saturations. Nonetheless, the results
obtained using Eq.(18) (i.e. the dashed line) are in rough agreement with pore
network calculations of water relative permeability in the through-plane direction.
Predictions of the relative gas phase permeabilities are also shown in Fig. 8. The
gas phase permeability was calculated for both cases discussed in Section 2.6.3.
In Case 1, the residual gas in an invaded pore offers no conductivity and gas
flows entirely through the network of connected gas-filled pores. In Case 2, gas
is allowed to flow through the non-filled portion of invaded pores. Both of these
cases are somewhat unrealistic, for Case 1 prevents any flow through the space
occupied by gas within water-invaded pores whereas Case 2 allocates to this
space the hydraulic conductance of a straight conduit of reduced size. These
cases, therefore, provide lower and upper bounds of gas permeability,
respectively. The Case 1 results show that no gas conductivity exists above a
critical water saturation of 65% for Toray 090 and 70% for SGL 10BA. A
significant amount of gas still exists in the network at this critical saturation, but it
35
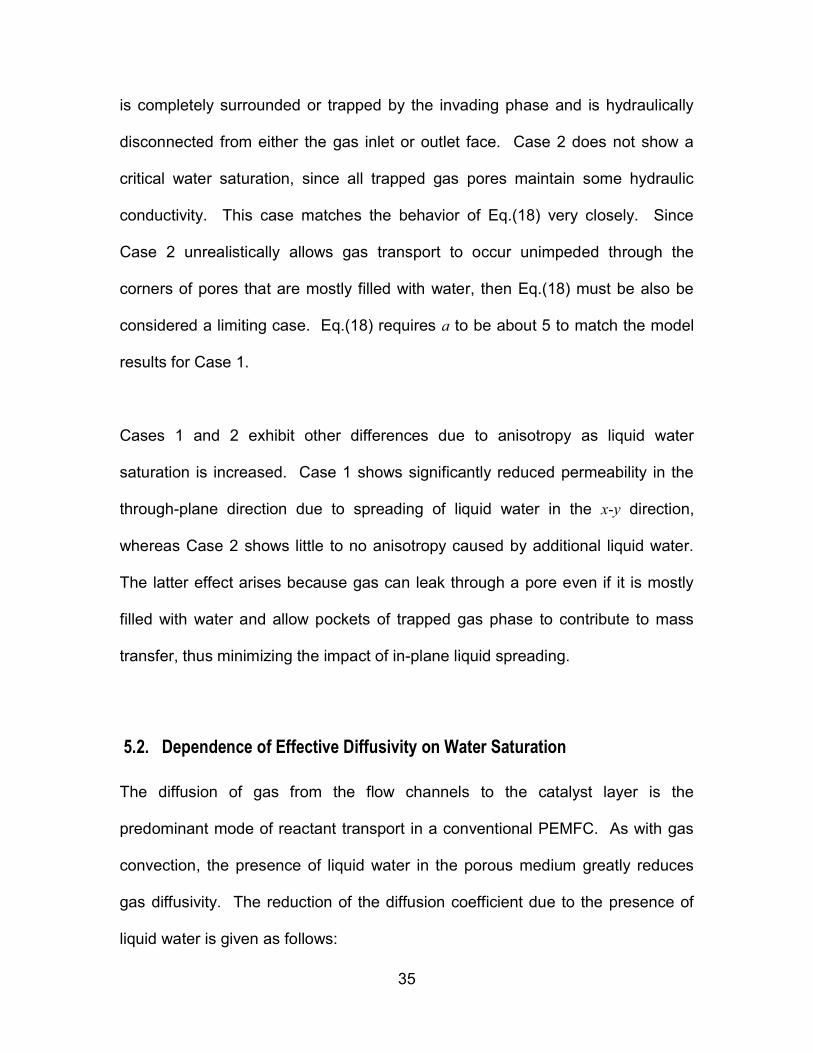
is completely surrounded or trapped by the invading phase and is hydraulically
disconnected from either the gas inlet or outlet face. Case 2 does not show a
critical water saturation, since all trapped gas pores maintain some hydraulic
conductivity. This case matches the behavior of Eq.(18) very closely. Since
Case 2 unrealistically allows gas transport to occur unimpeded through the
corners of pores that are mostly filled with water, then Eq.(18) must be also be
considered a limiting case. Eq.(18) requires a to be about 5 to match the model
results for Case 1.
Cases 1 and 2 exhibit other differences due to anisotropy as liquid water
saturation is increased. Case 1 shows significantly reduced permeability in the
through-plane direction due to spreading of liquid water in the x-y direction,
whereas Case 2 shows little to no anisotropy caused by additional liquid water.
The latter effect arises because gas can leak through a pore even if it is mostly
filled with water and allow pockets of trapped gas phase to contribute to mass
transfer, thus minimizing the impact of in-plane liquid spreading.
5.2. Dependence of Effective Diffusivity on Water Saturation
The diffusion of gas from the flow channels to the catalyst layer is the
predominant mode of reactant transport in a conventional PEMFC. As with gas
convection, the presence of liquid water in the porous medium greatly reduces
gas diffusivity. The reduction of the diffusion coefficient due to the presence of
liquid water is given as follows:

36
fsDDsD wrPABweff , (19)
where weff s,D is the effective diffusion coefficient, DAB is the bulk diffusion
coefficient, DrP(sw) is the relative diffusivity and f() accounts for the reduction of
diffusivity due to porosity and tortuosity. In fuel cell modeling literature, the
Bruggeman approach is almost invariably adopted, leading to f() = 1.5, although
other estimates are available (see [32] and references therein), including one
specifically for fibrous media [26]. Eq.(19) is analogous to Eq.(17). The function
DrP(sw), which is here called relative effective diffusivity due to its analogy to the
relative permeability, has not been as widely studied, particularly for GDL
materials. Nam and Kaviany [11] have performed a numerical study using a
rudimentary network model. The pore network studied by these authors lacked a
pore size distribution and could not be tailored to specific GDL materials. More
importantly, in the model of Nam and Kaviany [11] water saturation was
established with no regard for the physics of immiscible displacement. They
suggested that the relative effective diffusivity decreases with the square of water
saturation:
aPPrP ssD
(20)
where a = 2. Values of a = 1.5 are also commonly used [3] based on the
assumption that the Bruggeman correlation for the effect of porosity also applies
to the effect of liquid water saturation.
37
The present model was used to calculate relative effective diffusivity in a GDL
using invasion percolation concepts that more realistically simulate the
configuration of water expected in an operating fuel cell. Specifically, liquid water
was injected into the network in the through-plane direction to simulate liquid
water flowing from the catalyst layer to the gas channels. The present model
also includes pore and throat size distributions that adequately reproduce both
the absolute permeability and effective diffusivity through a dry network. The
results are shown in Fig. 9 along with those using Eq.(20) with a = 2.
The difference between Case 1 and Case 2 is much more dramatic for gas
diffusivity than for gas permeability. This is due to the fact that diffusional
conductivity is proportional to the area available for transport, while hydraulic
conductivity is proportional to the square of the area. Since the area for transport
through a pore is assumed to be proportional to the volume fraction of a pore that
is filled with gas, the diffusional conductivity is much less hindered by the partial
filling of pores. The large discrepancy between these two limiting cases
underscores the need for experimental data concerning these transport
processes. An argument against Case 2 is that not only does it fail to display a
critical water saturation (above which effective gas diffusivity is zero), but it
predicts significant diffusivity at near full-water saturation (DrG(sw = 0.9) = 0.1),
which appears unrealistic. Case 1 shows a significant decrease in diffusivity as
water invades the network. Compared to Eq.(20), diffusivities predicted by Case
1 can be several times lower. An exponent of a = 5 would be necessary in

38
Eq.(20) to approximate the behavior of the network model in this case. Clearly,
current models could be significantly overestimating the transport rates through
partially saturated GDLs.
Also shown in Fig. 9 are the liquid phase diffusivities. These values are not of
direct interest to PEMFC performance calculations since liquid phase diffusion of
reactants through the GDL is not significant. However, an area of research that
is becoming increasingly active is the transport of ionic contaminants (e.g. Fe(II)),
in the liquid phase. Thus, the presented results provide an estimate of
diffusivities to be used in modeling contaminant transport in PEMFCs.
5.3. Limiting Current
An effort was also made to use the present network model to predict the limiting
current in an operating PEMFC assuming that the GDL is the sole source of
mass transfer resistance. This was undertaken in order to determine if and when
mass transfer resistance in the cathode GDL becomes a significant portion of the
overall mass transfer resistance [33]. By estimating the maximum rate of oxygen
mass transfer that can be expected through a partially saturated GDL the limiting
current was calculated and compared with typically observed values in operating
cells.
The modeled domain is shown in Fig.10. The size of the domain is equivalent to
1 mm × 1 mm × , where is the GDL thickness (Table 1). This corresponds to

39
a domain size of 40 × 40 × 12 pores for Toray 090 and 26 × 26 × 10 pores for
SGL 10BA. On the channel side of the domain, half of the inlet face is blocked to
simulate the effect of 1 mm lands and channels. The conditions in the flow
channel are taken as fully humidified air at 80C and 10 kPa gauge. The catalyst
layer is treated as a reactive interface where the oxygen concentration is zero
(i.e. limiting current conditions). Since the cell is fully humidified there is no water
vapor diffusion and all water generated by the electrochemical reaction is in the
liquid state. As a result, the mass flux through the GDL is considered to be
molecular diffusion of O2 through a stagnant film of N2 and H2O. This allows the
multicomponent diffusion problem to be reduced to a binary diffusion problem,
provided that the diffusion coefficient is calculated with appropriate consideration
for the composition of the stagnant gas mixture [34]. Once the mass flux through
the GDL is known, the current density is found from Faraday’s Law.
The predicted limiting currents for both GDLs and both wetting phase
conductivity cases are given in Fig.11. The limiting currents through dry Toray
090 and dry SGL 10BA are very similar to each other. Although Toray 090 is
25% thinner than SGL 10B, it is less porous and has a lower intrinsic effective
diffusivity. These two factors offset each other and neither GDL is clearly better
in terms of mass transfer performance under dry conditions. As water is added
to the GDLs, however, the performance of the two materials diverges; the limiting
current for SGL 10BA drops more quickly. This can be attributed to the
increased spreading of liquid water in the x-y plane of this material.

40
The overall behavior for both materials shows a dramatic decrease in limiting
current as the GDL fills with water. At low water saturations (<10%), the
predicted limiting current through the GDL is higher than in a typical fuel cell,
which can be between 1 and 2 A/cm2. This indicates that at relatively dry
conditions, the GDL is not the main source of concentration polarization, and
performance is limited by other factors (i.e. the catalyst layer or electrolyte
phase). When the GDL becomes wet, however, there is a significant reduction in
the limiting current due to mass transfer resistance in the GDL. Case 1 predicts
that at water saturations above 25% the maximum current density is less than 1
A/cm2, indicating that mass transfer resistance through the GDL could be a
dominant factor limiting PEMFC performance. The limiting currents for Case 2
do not drop as sharply in the presence of water and 75% saturation must be
reached before it reaches 1 A/cm2.
At present, insufficient experimental evidence is available to fully understand the
configuration and connectivity of the residual gas phase in GDL pores invaded by
water. Some experimental evidence concerning the amount of liquid water in the
GDL of an operating fuel cell does exist, however. Kramer et al. [35] used
neutron imaging to measure the water content in the cathode GDL during fuel
cell operation and found saturations between 25% and 35% at limiting currents
between 0.6 and 1.0 A/cm2, which corresponds very closely with the results of
Case 1. Other neutron imaging studies suggest a limiting current above 1 A/cm2

41
at somewhat higher water saturation (30% - 60%) [36,37], which lies between
Case 1 and Case 2. Obviously, more conclusive evidence is needed to verify the
present model, but the reasonable agreement with these experimental results
does lend support to the applicability of the network modeling approach.

42
6. Conclusions
A pore network model was developed to help understand the multiphase flow
properties of GDL materials and estimate their multiphase flow and transport
properties. A detailed description of the model was provided, with particular
emphasis on integrating into the model both qualitative and quantitative aspects
of the microstructure of high-porosity fibrous GDLs. The model was calibrated to
two commonly used GDL materials by adjusting the model parameters to match
available experimental results, specifically the absolute permeability tensor and
drainage capillary pressure curves. Material-specific relative gas and liquid
permeabilities and diffusivities were computed as functions of water saturation
under conditions of quasi-static drainage of air by water and transport rates
through the pore network were determined. Uncertainty regarding the
configuration of the residual wetting phase (gas) in water-invaded pores of the
material made it necessary to consider two limiting cases for gas transport: Case
1 in which residual gas phase is not conductive, and Case 2 in which the
conductivity of the pore space occupied by gas in water-invaded pores is optimal.
The results of these simulations were compared with commonly used models of
relative permeability and diffusivity. It was found that these models tended to
agree with Case 2, which likely overestimates mass transfer in the gas phase.
Alternative forms of these common models were proposed that match the pore
network modeling results of Case 1. This study further highlights an urgent need
for experimental measurement of the effects of water saturation on water relative
permeability and gas diffusivity.

43
Limiting current calculations were performed by implementing PEMFC boundary
conditions and physical parameters on the network model. The limiting current
was estimated at various water saturation levels for a GDL section in which one-
half was open to the gas channel and the other half was covered by a land. A
dry GDL can support limiting currents of nearly 4 A/cm2, much more than is
typically observed in operating fuel cells. When liquid water is present in the
GDL, however, the predicted limiting current decreases rapidly to values typically
observed in operating PEMFCs, indicating that mass transfer through the GDL
may indeed be rate limiting at high current densities when the GDL is saturated
with water.

44
7. Acknowledgements
The authors wish to thank the Natural Science and Engineering Research
Council of Canada (NSERC) for financial support during the course of this study.

45
8. Nomenclature
Symbol Description Units
A Area of lattice normal to flow direction m2
a Exponent in Eq.(18) and Eq.(20)
Throat constriction factor
b Conduit size (radius) m
Spatial correlation distance
c Concentration molm-3
Random number in Weibull distribution
D Diffusion coefficient m2s-1
df Fiber diameter m
GDL thickness m
Porosity
gh Hydraulic conductivity m3Pa-1s-1
Surface tension Nm-1
gd Diffusive conductivity m3s-1
Filling exponent
K Permeability m2
Parameter in Weibull distribution
L Length of conduit m
LC Lattice constant m
46
Lt Throat length m
l Length of pore network domain m
Parameter in Weibull distribution
Viscosity Pas
N Diffusion rate through network mols-1
n Diffusion rate through a pore conduit mols-1
PC Capillary pressure Pa
Q Flow rate through network m3s-1
q Flow rate through a pore conduit m3s-1
Contact angle radians
s Saturation
V Volume m3
X Lattice size in x-direction (in-plane) No. of Pores
Y Lattice size in y-direction (in-plane) No. of Pores
Z Lattice size in z-direction (through-plane) No. of Pores
Subscripts
B Species B
b Bulk
CH Gas channel
CL Catalyst layer
eff Effective
in Inlet
nwp Non-wetting phase

47
max Maximum
out Outlet
P Phase
p Pore
r Relative
Conducting phase
t Throat
T Total
w Water
wp Wetting phase
x x direction (through-plane)
y y direction (in-plane)
z z direction (in-plane)
Superscripts
* Value at pore breakthrough pressure
m Exponent used in Eq.(14)
n Exponent used in Eq.(15)

48
9. References
1. M. M. Mench, Q. L. Dong, and C. Y. Wang, In situ water distribution
measurements in a polymer electrolyte fuel cell, J Power Sources 124
(2003) 90-98.
2. Q. Dong, J. Kull, and M. M. Mench, Real-time water distribution in a
polymer electrolyte fuel cell, J Power Sources 139 (2005) 106-114.
3. U. Pasaogullari and C. Y. Wang, Two-phase modeling and flooding
prediction of polymer electrolyte fuel cells, J Electrochem Soc 152 (2005)
A380-A390.
4. A. A. Shah, G. S. Kim, W. Gervais, A. Young, K. Promislow, J. Li, and S.
Ye, The effects of water and microstructure on the performance of
polymer electrolyte fuel cells, J Power Sources 160 (2006) 1251-1268.
5. T. Berning and N. Djilali, A 3D, multiphase multicomponent model of the
cathode and anode of a PEM fuel cell, J Electrochem Soc 150 (2003)
A1589-A1598.
6. G. Lin, W. He, and T. V. Nguyen, Modeling liquid water effects in the gas
diffusion and catalyst layers of the cathode of a PEM fuel cell, J
Electrochem Soc 151 (2004) A1999-A2006.
7. A. Z. Weber, R. M. Darling, and J. Newman, Modeling two-phase
behaviour in PEFCs, J Electrochem Soc 151 (2004) A1715-A1727.

49
8. N. P. Siegel, M. W. Ellis, D. J. Nelson, and M. R. Von Spakovsky, A two-
dimensional computational model of a PEMFC with liquid water transport,
J Power Sources 128 (2004) 173-184.
9. L. You and H. Liu, A two-phase flow and transport model for PEM fuel
cells, J Power Sources 155 (2006) 219-230.
10. M. Acosta, C. Merten, G. Eigenberger, H. Class, R. Helmig, B. Thoben,
and H. Muller-Steinhagen, Modeling non-isothermal two-phase
multicomponent flow in the cathode of PEM fuel cells, J Power Sources
159 (2006) 1123-1141.
11. J. H. Nam and M. Kaviany, Effective diffusivity and water-saturation
distribution in single- and two-layer PEMFC diffusion medium, Int J Heat
Mass Trans 46 (2003) 4595-4611.
12. J. T. Gostick, M. W. Fowler, M. A. Ioannidis, M. D. Pritzker, Y. M.
Volfkovich, and A. Sakars, Capillary pressure and hydrophilic porosity in
gas diffusion layers for polymer electrolyte fuel cells, J Power Sources 156
(2006) 375-387.
13. F. A. L. Dullien, Porous Media: Fluid Transport and Pore Structure,
Academic Press, New York, 1992.
14. M. Sahimi, Flow and Transport in Porous Media and Fractured Rock,
VCH, Weinheim, 1995.
15. M. A. Celia, P. C. Reeves, and L. A. Ferrand, Recent adances in pore
scale models for multiphase flow in porous media, Reviews of Geophysics
33 (1995) 1049-1057.

50
16. M. J. Blunt, M. D. Jackson, M. Piri, and P. H. Valvatne, Detailed physics,
predictive capabilities and macroscopic consequences for pore-network
models of multiphase flow, Adv Water Res 25 (2002) 1069-1089.
17. M. A. Ioannidis and I. Chatzis, Network modelling of pore structure and
transport properties of porous media, Chem Eng Sci 48 (1993) 951-972.
18. Z. Liang, M. A. Ioannidis, and I. Chatzis, Geometric and topological
analysis of three-dimensional porous media: Pore space partitioning
based on morphological skeletonization, J Coll Interface Sci 221 (2000)
13-24.
19. K. E. Thompson, Pore-scale modeling of fluid transport in disordered
fibrous materials, AICHE J 48 (2002) 1369-1389.
20. D. Chang and M. A. Ioannidis, Magnetization evolution in network models
of porous rock under conditions of drainage and imbibition, J Coll Interface
Sci 253 (2002) 159-170.
21. J. T. Gostick, M. W. Fowler, M. D. Pritzker, M. A. Ioannidis, and L. M.
Behra, In-Plane and through-plane gas permeability of carbon fiber
electrode backing layers, J Power Sources 162 (2006) 228-238.
22. A. Yan, X. Xiao, I. Kulaots, B. W. Sheldon, and R. H. Hurt, Controlling
water contact angle on carbon surfaces from 5o to 167o, Carbon 44 (2006)
3116-3120.
23. R. Berker, "Integration des equation du mouvement d'un fluide visqueux
incompressible," Encyclopedia of Physics, VIII, S. Flugge, ed., (Springer-
Verlag, Berlin, 1963), 1-384.

51
24. M. M. Tomadakis and T. J. Robertson, Pore size distribution, survival
probability, and relaxation time in random and ordered arrays of fibers, J
Chem Phys 119 (2003) 1741-1749.
25. V. P. Schulz, J. Becker, A. Wiegmann, P. P. Mukherjee, and C. Y. Wang,
Modeling of two-phase behavior in the gas diffusion media of PEFCs via
full morphology approach, J Electrochem Soc 154 (2007) B419-B426.
26. M. M. Tomadakis and T. J. Robertson, Viscous permeability of random
fiber structures: Comparison of electrical and diffusional estimates with
experimental and analytical results, J Composite Materials 39 (2005) 163-
188.
27. G. W. Jackson and D. F. James, Permeability of fibrous porous media,
Can J Chem Eng 64 (1986) 364-374.
28. M. M. Tomadakis and S. V. Sotirchos, Transport properties of random
arrays of freely overlapping cylinders with various orientation distributions,
J Chem Phys 98 (1993) 616-626.
29. J. Benziger, J. Nehlsen, D. Blackwell, T. Brennan, and J. Itescu, Water
flow in the gas diffusion layer of PEM fuel cells, J Membrane Sci 261
(2005) 98-106.
30. C. Y. Wang, Z. H. Wang, and Y. Pan, Two-phase transport in proton
exchange membrane fuel cells, ASME HTD 364 (1999) 351-357.
31. J. G. Pharoah, K. Karan, and W. Sun, On effective transport coefficients in
PEM fuel cell electrodes: Anisotropy of the porous transport layers, J
Power Sources 161 (2006) 214-224.

52
32. J. van Brakel and P. M. Heertjes, Analysis of diffusion in macroporous
media in terms of a porosity, a tortuosity and a constrictivity factor, Int J
Heat Mass Trans 17 (1974) 1093-1103.
33. J. St-Pierre, B. Wetton, G. S. Kim, and K. Promislow, Limiting current
operation of proton exchange membrane fuel cells, J Electrochem Soc
154 (2007) B186-B193.
34. C. R. Wilke, Diffusional properties of multicomponent gases, Chem Eng
Prog 46 (1950) 95-104.
35. D. Kramer, J. Zhang, R. Shimoi, E. Lehmann, A. Wokaun, K. Shinohara,
and G. G. Scherer, In situ diagnostic of two-phase flow phenomena in
polymer electrolyte fuel cells by neutron imaging: Part A. Experimental,
data treatment, and quantification, Electrochim Acta 50 (2005) 2603-2614.
36. A. Turhan, K. Heller, J. S. Brenizer, and M. M. Mench, Quantification of
liquid water accumulation and distribution in a polymer electrolyte fuel cell
using neutron imaging, J Power Sources In Press, Corrected Proof.
37. J. Zhang, D. Kramer, R. Shimoi, Y. Ono, E. Lehmann, A. Wokaun, K.
Shinohara, and G. G. Scherer, In situ diagnostic of two-phase flow
phenomena in polymer electrolyte fuel cells by neutron imaging: Part B.
Material variations, Electrochim Acta 51 (2006) 2715-2727.

53
10. Figures
(i)
(ii)
(a) (b)
Fig. 1. SEM micrographs of GDL materials modeled in present study. (a) Toray
090, (b) SGL Sigracet 10BA. (i) 100x and (ii) 1000x magnification. The fiber
alignment in the SGL10BA sample is apparent in (b)(i).

54
(a) (b)
Fig. 2. Slices of a simulated GDL solid model. (a) In-plane view, (b) through-
plane view. Both views show 10 m thick sections. The model was generated
by placing fibers with a random location and in-plane rotation, then applying an
out-of-plane rotation with angles normally distributed around 0 with a standard
deviation = 1.

55
xi,CH
y
Lc
bt bp,2
Lt
Pore Body Pore Throat Solid
bp,1
Fig. 3. Schematic of 2 neighboring pore bodies and connecting throat. Throat
size (bt) is proportional to the size of the smaller of the two connecting pores (bt =
bp). Throat length (Lt) is equal to the difference between the pore body sizes
(bp) and the center-to-center distance between pores (LC).
56
(a) (b)
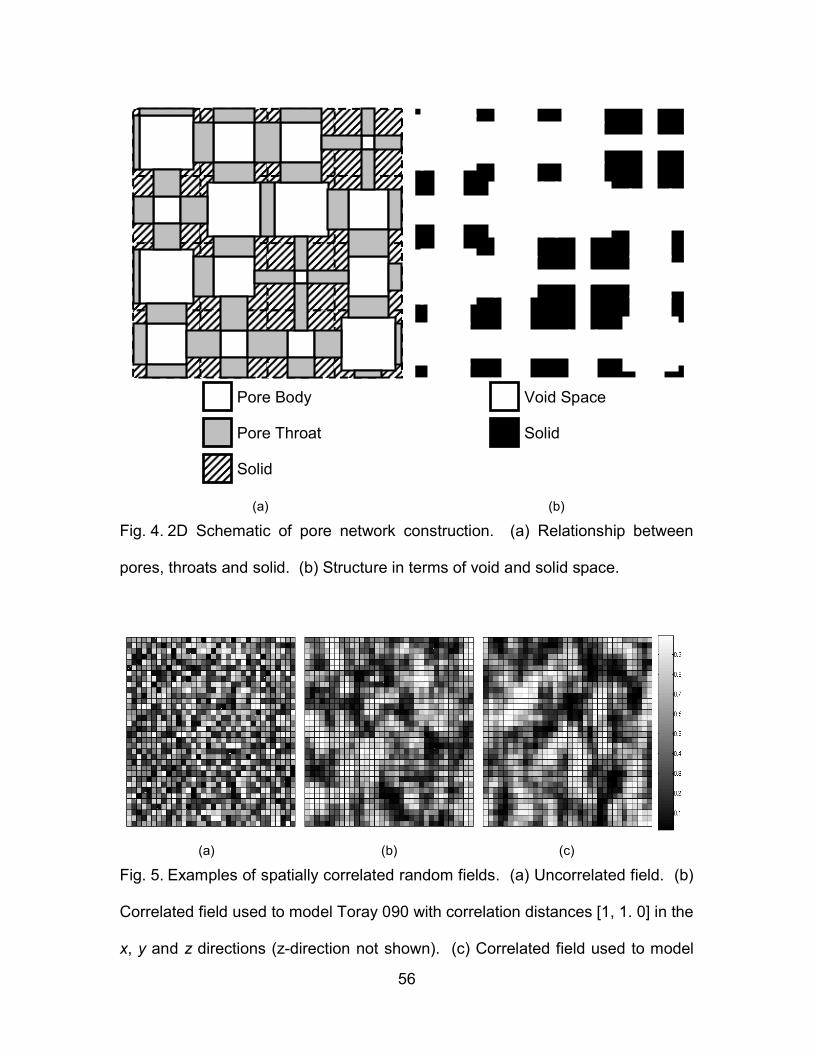
Fig. 4. 2D Schematic of pore network construction. (a) Relationship between
pores, throats and solid. (b) Structure in terms of void and solid space.
(a) (b) (c)
Fig. 5. Examples of spatially correlated random fields. (a) Uncorrelated field. (b)
Correlated field used to model Toray 090 with correlation distances [1, 1. 0] in the
x, y and z directions (z-direction not shown). (c) Correlated field used to model
Pore Body
Pore Throat
Solid
Void Space
Solid

57
SGL 10BA with correlation distances [2, 1, 0] in the x, y and z directions. (z-
direction not shown).
10210110010-110-210-3
0.0
0.2
0.4
0.6
0.8
1.0
No
n-W
etti
ng
Ph
as
e F
ille
d P
oro
sity
MSP - Octane
MIP
PNM - Octane
PNM - Mercury
(a)
10210110010-110-210-3
0.0
0.2
0.4
0.6
0.8
1.0
MSP - Octane
MIP
PNM - Octane
PNM - Mercury
(b)
Gas-Liquid Capillary Pressure [Bar]
Fig. 6. Comparison of computed capillary pressure curves with experimental
porosimetry data. (a) Toray 090 and (b) SGL 10BA. The high pressure feature
in the SGL10BA (b) sample is attributable to the surface roughness visible in Fig.
1(b)(ii).

58
Fig. 7. Pore size, throat size and throat length histograms. (left) Toray 090 and
(right) SGL10BA.

59
0
0.2
0.4
0.6
0.8
1
0.00 0.25 0.50 0.75 1.00
Water Saturation
KrWater,x
KrWater,y
KrWater,z
KrAir,x (Case 1)
KrAir,y (Case 1)
KrAir,z (Case 1)
KrAir,x (Case 2)
KrAir,y (Case 2)
KrAir,z (Case 2)
a = 3
(b)
0
0.2
0.4
0.6
0.8
1
0.00 0.25 0.50 0.75 1.00
Water Saturation
Rel
ati
ve
Per
mea
bil
ity
(a)
Fig. 8. Relative gas and liquid permeability as a function of water saturation in the
network. (a) Toray 090 and (b) SGL 10BA. Both cases are shown for the gas
relative permeability. Also shown is the result using Eq.(18) with exponent a = 3.
Fig. 9. Relative effective diffusivity as a function of water saturation in the
network. (a) Toray 090 and (b) SGL 10BA. Both cases are shown for the
0
0.2
0.4
0.6
0.8
1
0.00 0.25 0.50 0.75 1.00
Water Saturation
DrWater,x
DrWater,y
DrWater,z
DrAir,x (Case 1)
DrAir,y (Case 1)
DrAir,z (Case 1)
DrAir,x (Case 2)
DrAir,y (Case 2)
DrAir,z (Case 2)
a = 2
(b)
0
0.2
0.4
0.6
0.8
1
0.00 0.25 0.50 0.75 1.00
Water Saturation
Re
lati
ve E
ffec
tive
Dif
fus
ivit
y
(a)

60
relative effective diffusivity of the air phase. Also shown is the result using
Eq.(20) with exponent a = 2.
Catalyst Layer
Gas Diffusion Layer
Channel Land
Z
X Y
Gas Channel
xi,CH
xi,CL
0.5
mm
0
.5 mm
1 mm
Fig.10. Schematic diagram of modeled domain. xi,CH is the concentration
of species i in the flow channel, xi,CL is the concentration of species i at the
catalyst layer.

61
0.0
0.5
1.0
1.5
2.0
2.5
3.0
3.5
4.0
4.5
0.00 0.25 0.50 0.75 1.00
Water Saturation
Lim
itin
g C
urr
en
t D
en
sit
y [
A/c
m2 ]
Toray 090 (Case 1)
Toray 090 (Case 2)
SGL 10BA (Case 1)
SGL 10BA (Case 2)
Fig.11. Predicted limiting current densities as a function of GDL water
saturation based on mass transfer through the cathode GDL

62
11. Tables
Table 1. Physical Properties of GDL materials
Property SGL 10BA Toray 090
Thickness () 390 m 290 m
Total Porosity () 0.88-0.90 0.78-0.80
Fiber Diameter (df) 9 m 9 m
Permeability (Kx) 57 × 10-12 m2 15 × 10-12 m2
Permeability (Ky) 45 × 10-12 m2 15 × 10-12 m2
Permeability (Kz) 37 × 10-12 m2 9.0 × 10⁻¹² m2
Table 2. Fluid properties
Fluid Surface Tension Contact Angle1
SGL 10BA Toray 090
Mercury 0.480 Nm-1 115 115
Water 0.072 Nm-1 100 98
Octane 0.022 Nm-1 0 0

63
Table 3. Model parameters used for each material
Toray 090 SGL 10BA
Network Size Parameters
LC 25.2 m 40.5 m
Pore Size Distribution Parameters
5.25 9
3 3.5
bmin 5 m 9 m
max 0.95 0.9
Late Pore Filling Parameters
s* 0.20 0.20
1.00 1.00
Throat Constriction Factors
x, y, z] [1, 1, 0.9] [1, 0.95, 0.95]
Pore Correlation Distances
x, y, z] [1, 1, 0] [2, 1, 0]
Table 4. Transport results for each modeled material
Toray 090 SGL 10BA
Permeability (x 1012 m2) Experimental [21] Model Experiment [21] Model
Kx 15 14 57 54
Ky 15 14 45 48
Kz 9.0 9.5 37 39
Effective Diffusivity Numerical [28] Model Numerical [28] Model
De,x 0.67 0.54 0.78 0.64
De,y 0.67 0.54 0.75 0.61
De,z 0.62 0.46 0.75 0.58