population structure of side blotched … can be used to understand the balance between gene flow...
TRANSCRIPT

POPULATION STRUCTURE OF SIDE BLOTCHED LIZARDS (UTA STANSBURIANA) DISPLAYING ADAPTIVE DORSAL COLORATION
A thesis submitted to the faculty of San Francisco State University
In partial fulfillment of The Requirements for
The Degree
Master of Science In
Biology: Ecology and Systematic Biology
by
Steven James Micheletti
San Francisco, California
August 2011

Copyright by
Steven James Micheletti 2011

CERTIFICATION OF APPROVAL
I certify that I have read Population structure of side blotched lizards (Uta
stansburiana) displaying adaptive dorsal coloration by Steven Micheletti, and that
in my opinion this work meets the criteria for approving a thesis submitted in
partial fulfillment of the requirements for the degree: Master of Science in
Biology: Ecology and Systematic Biology at San Francisco State University.
________________________________________ Eric Routman Professor of Biology ________________________________________ Greg S. Spicer Professor of Biology ________________________________________
Vance Vredenburg Associate Professor of Biology

POPULATION STRUCTURE OF SIDE BLOTCHED LIZARDS (UTA STANSBURIANA) DISPLAYING ADAPTIVE DORSAL COLORATION
Steven James Micheletti
San Francisco, California
2011
We investigated adaptive dorsal coloration of Uta stansburiana (Side
Blotched Lizard) living on the Cima Lava Field in San Bernardino County,
California. We take an experimental approach to ensure that substrate matching
is not a plastic trait in this species. We then test a candidate gene, melanocortin-
1 receptor (Mc1r), to see if it is correlated with dorsal color differences between
light and dark individuals. We also use mitochondrial loci (ND4 and cytb) in
combination with Mc1r to investigate the population structure of this system by
means of phylogenetic and population genetic analyses. Results suggest that
substrate matching is not a plastic trait in this species; however variation in Mc1r
is not associated with observed color differences. We also find an extraordinarily
high amount of genetic variability in our sample, suggesting a very large
population size. Pairwise mismatch analysis and Tajima’s D tests are consistent
with a recent population expansion. Furthermore, we find genetic differentiation
among sub localities, suggesting that abiotic barriers are inhibiting gene flow.
I certify that the Abstract is a correct representation of the content of this thesis. ___________________________________________ ________________ Chair, Thesis Committee Date
PREFACE AND/OR ACKNOWLDGEMENTS
I appreciate the help given to me by friends, family, and colleagues. I would like
to thank my superb advisor, Dr. Eric Routman, for providing tremendous support
and making my graduate studies a gratifying experience. Dr. Vance Vredenburg
and Dr. Greg Spicer have my gratitude for their suggestions and encouragement.
Many thanks go to Dr. Frank Cipriano at the Genomics/Transcriptomics Analysis
Core for his accommodations and services. Thank you to the National Park
Services for granting permission to conduct research on the Cima Lava Field.
Finally, I thank my family for their ongoing support. This research was funded by
an Instructionally Related Research Award (IRA), a Sigma Xi Grant-in-Aid, and a
Center for Computing for Life Sciences (CCLS) Grant.
v

TABLE OF CONTENTS
List of Tables ................................................................................................... vi
List of Figures ..................................................................................................viii
List of Appendices ........................................................................................... ix Introduction .......................................................................................................1 Methods............................................................................................................3
Sampling ................................................................................................3
Tests for Phenotypic Plasticity ...............................................................5
DNA Extraction, Amplification and Sequencing .....................................6
Phylogenetic Analysis ............................................................................7
Population Genetic Analysis ..................................................................8
Results.............................................................................................................10
Adaptive Phenotypic Variation ..............................................................10
Phylogenetic Analysis ...........................................................................11
Population Genetic Analysis .................................................................11
Discussion .......................................................................................................15
Physiological Plasticity ..........................................................................15
Genetic Basis of Color ..........................................................................17
Molecular Diversity................................................................................18
Conclusion .......................................................................................................21 References ......................................................................................................22
vi

LIST OF TABLES
Table Page 1. Munsell Geological Rock-Color Chart Color Calls ......................................28
2. Molecular Diversity Summary Statistics ......................................................32
3. Mismatch and Neutrality Tests....................................................................33
4. Subsample Molecular Diversity...................................................................33
5. Subsample Mismatch and Neutrality Tests.................................................34
6. Population Genetic Differentiation ..............................................................34
vii

LIST OF FIGURES
Figure Page 1. Dorsal Color Variation in Uta. stansburiana ...................................................35
2. Study Location ...............................................................................................36
3. Cima Lava Field.............................................................................................37
4. Phenotypic Plasticity of Captive Lizards ........................................................38
5. Mc1r haplotype Neighbor Joining Tree ..........................................................39
6. mtDNA Haplotype MrBayes Tree...................................................................40
ix

LIST OF APPENDICES
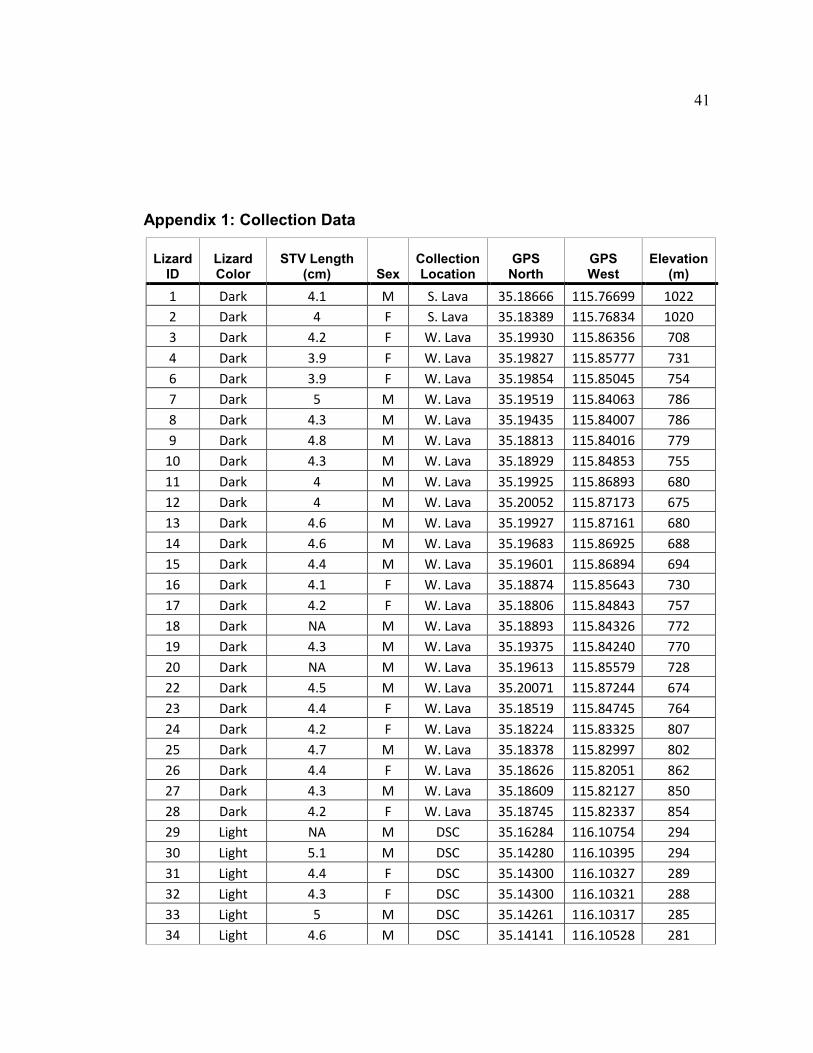
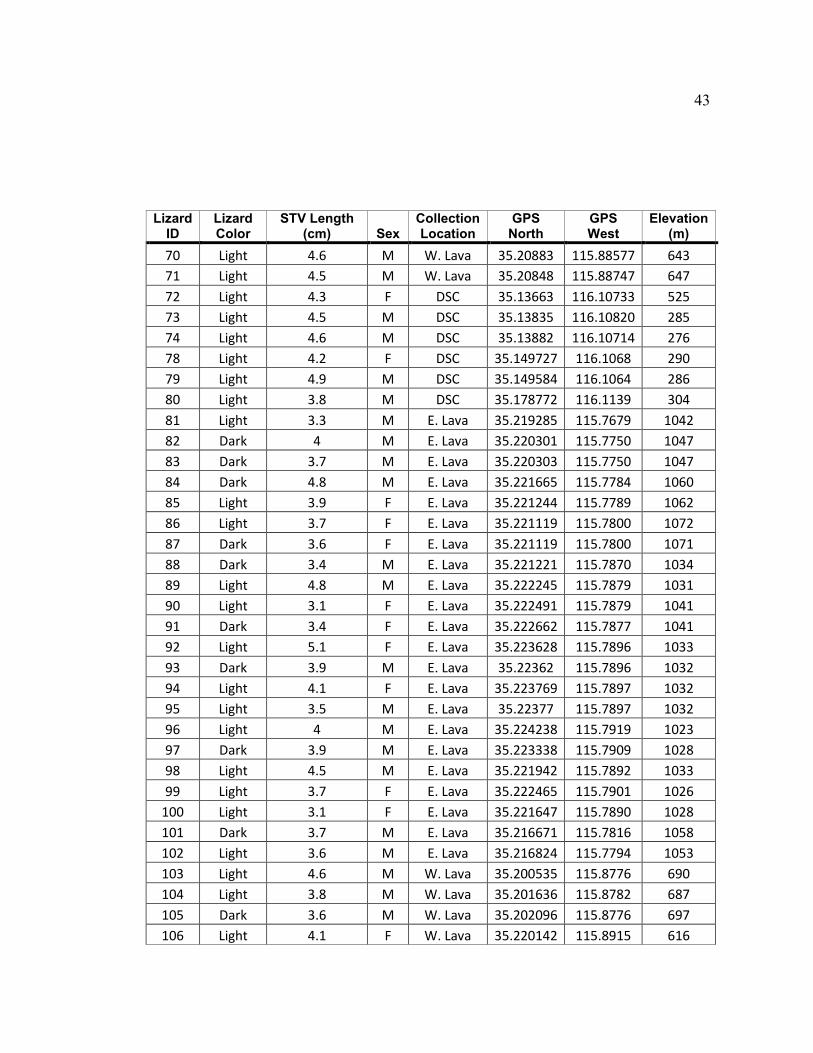
Appendix Page 1. Collection Data ............................................................................................41
2. Polymerase Chain Reaction Recipes ..........................................................45
3. Polymerase Chain Reaction Protocols.........................................................46
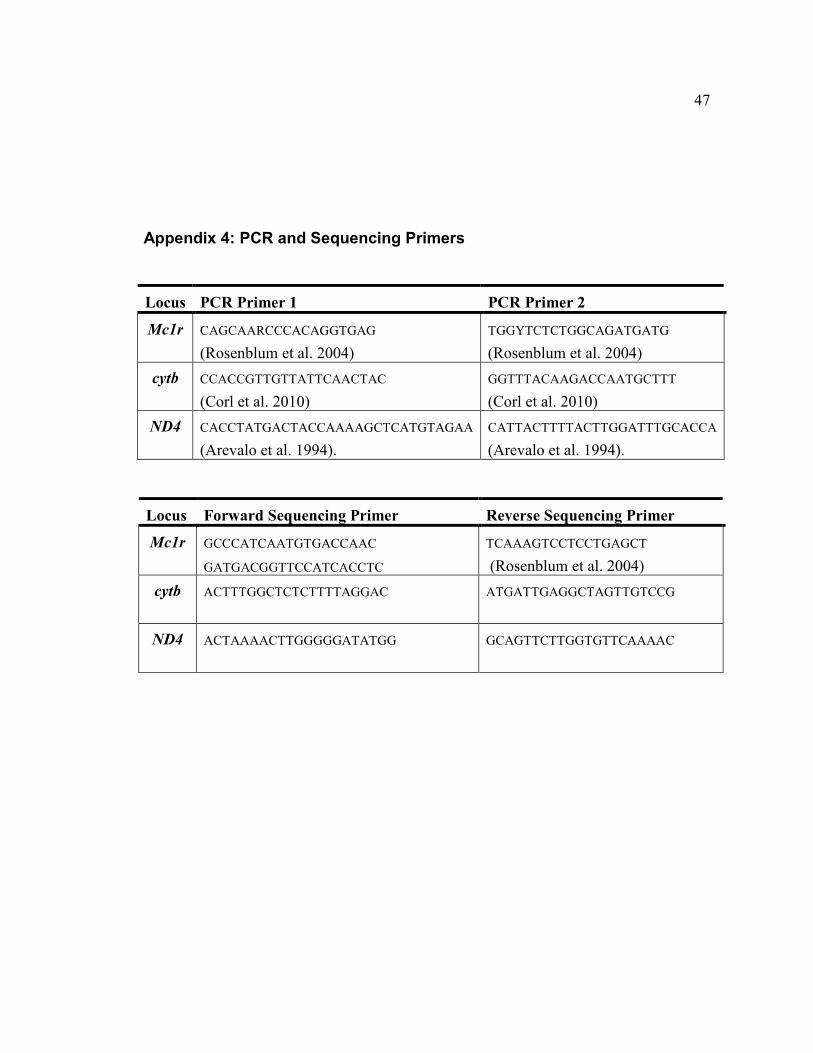
4. PCR and Sequencing Primers .....................................................................47
x
1
1. Introduction
Recently there has been increased focus on the genetic basis of color
variation in animals because of the potential for color to be influenced by natural
selection for background matching, thermoregulation, and sexual selection (e.g.
Rosenblum et al. 2004; Uy et al. 2009; Hubbard et al. 2010). Reptile coloration
has long been studied as an example of adaptive evolution (Cott 1940; Norris
and Lowe 1964). However, the color of reptiles can sometimes vary due to social
signaling, stress, or active camouflaging (Stuart-Fox 2008). When color variation
exists among populations or individuals that is not due to individual responses to
external stimuli, it presents the opportunity to evaluate the genetic basis of
phenotypic diversity (Cott 1940; Norris and Lowe 1964). For example,
Rosenblum (2005) showed that a light/dark polymorphism in three species of
lizards was not due to individual plasticity and had a heritable component.
Dorsal color varies among individuals of side-blotched lizards (Uta
stansburiana) that reside in the Cima Volcanic Field in San Bernardino County,
California (Figure 1). This volcanic field, located in the Mojave National Preserve,
consists of dark basalt rocks surrounded by lighter granite sands. In U.
stansburiana, the derived "melanic" phenotype is darker than the ancestral type
and is found in individuals that occupy the darker basalt substrate. If the
phenotypic variation in this population has an additive genetic basis, this species
2
can be used to understand the balance between gene flow and adaptive
evolution in reptiles. Diurnal reptiles, especially those residing in the desert,
experience intense selection for substrate matching (Luke 1989), as dorsal
crypsis allows individuals to avoid being detected by highly visual predators
(Norris 1965; Kettlewell 1973). Furthermore, studies have demonstrated that
darker animals can heat faster and obtain higher body temperatures than lighter
animals (Pearson 1977; Forsman 1995). Light coloration may therefore serve to
also slow or limit heat gain (Benson 1933). Depending on the strength of natural
selection and rates of migration, gene flow may obstruct local adaptation by
homogenizing populations subject to different selection pressures (Lenormand
2002, Storfer et al. 1999). Alternatively, strong disruptive selection may
overwhelm even substantial gene flow and lead to population differentiation
(Turrelli et al 2001).
Similar systems have been investigated in the Carrizozo Lava Flow in
New Mexico (Rosenblum et al. 2007). Several species of desert lizards show a
light/dark polymorphism in which dorsal color matches the habitat type on which
they reside (Rosenblum 2006). This suggests that natural selection is strong
enough to produce a consistent pattern among species despite the fact that the
species differ in population structure, historical demography, and ecology. Unlike
the Carrizozo Lava Flow, the Cima Lava Field consists of lava outcrops that vary
3
in size and are separated by a mixture of basalt rock and granite sand. Adjacent
to these lava outcrops is a massive soda lake that is thought to act as
uninhabitable barrier. This allows for investigation of the effect of the barrier on
gene flow, and to compare relatedness between light morphs from the area
immediately surrounding the lava flow to light morphs from across the soda lake
at the Desert Studies Center.
We investigated this system by first testing whether captive U.
stansburiana can physiologically substrate match. We examined gene flow and
demography by comparing mtDNA sequence among color morphs and
geographic localities. Finally, we conducted a preliminary examination of the
genetic basis of the color polymorphism by sequencing a candidate locus,
Melanocortin 1 receptor (Mc1r), that is known to affect color pattern in other
species of vertebrates (Rosenblum 2004, Hoekstra et al. 2006).
2. Methods
2.1 Sampling
U. stansburiana tail tips (N =121) were collected in San Bernardino
County, California. Samples were collected from two main geographic sites; The
Cima Volcanic Field and adjacent habitats (N=106), and the Desert Studies
Center (N=15) (Appendix 1; Figures 2 and 3). The Cima Volcanic Field was
4
selected as the main study site due to a large variation in habitat over a small
distance. Located in the Mojave National Preserve, the volcanic field includes 52
volcanic cinder cone vents, and extensive basaltic lava flows that cover more
than 150 square kilometers of the Mojave Desert (Dohrenwend 1986). This
volcanic field ranges from 650 to 1,200 meters in elevation with volcanic cones
that range in size from 25 to 155 meters (Dohrenwend 1986). This area consists
mostly of dark cinder and basalt rocks that have been aged to be around 7.6
millon years old; however, the estimated last date of eruption is a much recent
10,000 years ago (Wells et al. 1985). This recent eruption has created novel dark
volcanic substrates that are surrounded by lighter granite rocks and sand. The
Desert Studies Center is approximately 23 kilometers west of the Volcanic Field
and lacks volcanic rock. The Desert Studies Center site is separated from the
Cima Volcanic Field by a massive soda lake consisting of alkaline evaporites,
sodium carbonate, and sodium bicarbonate (Ore and Warren 1971). This
predominantly dry lake is uninhabitable and potentially acts as a barrier between
sites.
Lizards were captured using slip-knot nooses and 0.5 cm of tail tip was
removed and preserved in 95% ethanol for DNA analysis. We measured the
most prominent dorsal color of each lizard with a Munsell Color Geological Rock-
Color Chart (Munsell, North Brunswick, NJ). The Geological Color Chart was

5
selected to measure dorsal color since lizards rely on substrate (rock) matching
for predator avoidance (Luke 1989). Therefore, the Geological Color Chart was
used to measure the color of both the lizard’s dorsum and the substrate on which
they were found. The chart consists of a variety of color chips that classify
different colors using three color dimensions: hue, value (lightness), and chroma
(color purity). Dorsal temperature was measured with an infrared thermometer,
and lizards were photographed against the substrate on which they were first
discovered as well as against the Geological Color Chart. Colors were
determined at the time of capture and reconfirmed later based on photographs.
Lizards were separated into two categories based on their relative color: Light
(N=59) and Dark (N=62).
2.2 Tests for Phenotypic Plasticity
6 individuals were collected and maintained in captivity to test whether
dorsal color is a plastic trait in these populations (IACUC protocol #A10-002).
This sample consisted of 3 light, and 3 dark individuals. Lizards were reared in
separate 10-gallon glass aquaria. Aquaria were supplied with white sand, a
granite rock for basking, and a granite rock refuge. This substrate best matched
an extreme light habitat, like that of the granite sands in the Mojave National
Preserve. Lizards were fed crickets ad libitum with a 12 hour light/dark schedule.
6
Heat lamps were used during the day to maintain a temperature of 25-31˚ C.
Dorsal colors were recorded using the Munsell Color Geological Rock-Color
Chart every week for 52 weeks to measure any color change. Since color is
thought to be affected by temperature in most lizard species (Norris, 1965) we
accessed the amount of color change based on body temperature. Each
collected lizard was measured at four temperature intervals: inactive (16.5-17.5˚
C), room (20 - 21 ˚ C), warm (25.5 - 28.5˚ C), and basking (30.5 - 32˚ C).
2.3 DNA Extraction, Amplification and Sequencing
DNA was extracted using a DNEASY extraction kit (QIAGEN Inc.
Valencia, CA) on .5cm tail tissue. Following extraction, the template DNA was
amplified using Polymerase Chain Reaction (PCR) for two mitochondrial loci;
NADH dehydrogenase subunit 4 (ND4) and cytochrome-B (cytb), and one
nuclear locus; Melanocortin 1 receptor (Mc1r) (Appendix 2 and 3). Mitochondrial
markers were selected for investigation due to their high sensitivity to population
subdivision. In addition, their effective haploidy and lack of recombination (Brown
et al. 1979) means that mitochondrial DNA sequence data can be used
phylogenetically to estimate relationships among alleles without having to deal
with heterozygosity and linkage phase. Mc1r was selected since it is a G-protein
coupled receptor which is a key switch in a signal transduction pathway in

7
melanin-producing cells (Barsh 1996). Mc1r has been studied in natural
populations and has been implicated in intraspecific color variation in birds,
mammals, and just recently reptiles (Rosenblum et al. 2004; Nachman et al.
2003; Takeuchi et al. 1996). Mc1r polymorphisms have been found to be strongly
associated with color differences in some desert squamates (Rosenblum et al.
2004) making it a candidate gene to investigate in U. stansburiana color morphs.
Successfully amplified PCR product was purified using Exonuclease I
(EXO), and Thermosensitive Alkaline Phosphatase (FastAP) (Fisher Scientific,
Houston, TX). Purified product was sequenced in both directions using Elim
Biopharm’s DNA sequencing services which use ABI 3730xl Sequencers
(Applied Biosystems, Carlsbad, CA). Sequencing primers (Appendix 4) were
designed using initial sequence data. Individuals with poor sequence quality, a
high occurrence of heterozygosity, or unique sequences were re-sequenced.
2.3 Phylogenetic Analysis
Sequence data were edited and aligned using the computer program
Sequencher 3.1.1 (Gene Codes Corporation, Ann Arbor, MI). Sequences were
confirmed to be U. stansburiana product by using the BlastN program at the
NCBI website (http://blast.ncbi.nlm.nih.gov/Blast.cgi). Mitochondrial haplotypes
were identified using MacClade 4.08a (Maddison and Maddison 2010). For the

8
autosomal Mc1r, double peaks present in sequence from both directions were
scored as heterozygous. Haplotype phases were inferred using the program
PHASE 2.1.1 (Stephens et al. 2001).
Haplotype trees for both mitochondrial and nuclear sequence were
created using MrBayes 3.1.2 (Ronquist and Huelsenbeck, 2005). The
substitution model GTR + Γ was used for all datasets. Each run was set for 20
million generations, with sampling at every 1000 generations. Nodes with a
posterior probability > 0.90 were considered well supported (Wilcox et al. 2002).
2.4 Population Genetic Analysis
Population genetic analyses were performed using Arlequin 3.5
(Schneider et al. 2000). For these analyses we defined three different groups of
populations. First, analyses were run with all collected samples defined as one
entire population (N=121). We defined another group consisting of two
populations based on collection site: Cima Lava Field and adjacent habitats
(N=106) or Desert Studies Center (N=15). These two localities are separated by
the uninhabitable soda lake which potentially splits the population into two. Our
last group consisted of two populations based on whether an individual’s dorsum
was light (N= 59), or dark (N=62). Since color is thought to be an adaptive trait
for predator avoidance local selection has the potential to subdivide a population

9
for loci affecting the trait being selected and loci in linkage disequilibrium with the
selected gene.
For each defined group, we used pairwise mismatch distribution to test for
recent population size expansion (Rogers and Harpending 1992). Statistical
significance was tested using (Harpending 1994) raggedness index (r) and sum
of squared deviation test (Rogers and Harpending 1992). We estimated per locus
diversity as haplotype number and haplotype diversity (h, Nei 1987) for all
populations and putative subpopulations. Nucleotide diversity was estimated with
Watterson’s θ (θ, Watterson 1975) and Nei’s θ (π, Tajima 1983, Watterson
1975). We calculated Tajima’s D (Tajima 1989) to test for departures from neutral
expectations.
An analysis of molecular variance (AMOVA; Excoffier et al. 1992) was
conducted using the different color and locality groups. ΦST from AMOVA were
estimated by computing distance matrices based on pairwise differences with
1000 permutations to determine statistical significance. Finally Jost’s D value (Dj,
Jost 2008) was calculated using the program Genodive 2.0B20 (Meirmans and
Van Tienderen 2004) as an estimator of the degree of differentiation between
populations. Jost’s D ranges from 0 to 1, and is better than ΦST at indicating
population differentiation when haplotype diversity in the sample is high (Jost
2008).

10
3. Results
3.1 Adaptive Phenotypic Variation
Lizard color data is displayed in Table 1. Of 121 sampled individuals, 93%
matched the color class of the substrate on which they were collected. To ensure
that this association was not due to coincidence, a Fisher’s exact two-tailed test
was performed (Fisher 1922) revealing a p-value < 0.0001. This suggests a
significant correlation between habitat type and dorsal color. Based on the
Munsell Geological Color Chart, dark males are associated with a primary dorsal
color of dark olive black and dark females are associated with an olive gray color;
light males are associated with dark yellowish brown whereas light females are
associated with light olive gray. In both light and dark lizards, the primary dorsal
colors in males are darker than females, suggesting a primary dorsal color sexual
dimorphism. Of the 6 captive lizards housed on light substrate, all lived 15 weeks
or longer. These lizards showed little to no variation in dorsal color with some
exceptions (Figure 4). The first exception was individual 66, which surprisingly
darkened in dorsal color after 21 weeks of being captive on a light substrate.
Another exception was individual 50 which showed a significant amount of dorsal
lightening after shedding, yet darkened again weeks later. The last exception
was individual 17, which lightened after shedding yet died five weeks later,
making it uncertain whether the color change was permanent or not. Overall,

11
there is no trend towards a color change to match substrate, suggesting cryptic
coloration is not due to plasticity.
3.2 Phylogenetic Analysis
Sequencing of mitochondrial genes produced 1086 basepairs of cytb, and
754 basepairs of ND4 giving a total of 1840 basepairs. 71 polymorphic sites
were identified in cytb creating 65 haplotypes, and 56 polymorphic sites were
identified in ND4 resulting in 46 Haplotypes. Combining the two genes resulted in
a total of 81 haplotypes. We sequenced 701 basepairs of the autosomal gene
Mc1r with 42 polymorphic sites and 66 haplotypes were estimated using the
haplotypes considered most likely by PHASE. Haplotype phylogenies for Mc1r
and the combined mtDNA data are shown in Figure 5 and Figure 6. There is no
phylogenetic clustering of color variants and very little substructuring based on
locality, although a few statistically supported clades correspond to groups of
individuals collected from the same region.
3.3 Population Genetic Analysis
3.3.1 Overall Molecular Diversity
Data for the entire sample of 121 individuals show a substantial amount of
molecular variation as shown in Table 2 and Table 3. Cytb shows the most

12
variation out of all of the loci. Haplotype diversity is extremely high (h=.979) with
65 haplotypes. Sequence diversity is also high (π=.007, θ= 0.016). The pairwise
mismatch analysis of cytb shows a unimodal distribution (r=.011, p=.630; SSD
tests agreed with r in every case and will not be reported) and Tajima’s D is
significantly negative (D = -1.869, p=.009). ND4 also shows similarly high
molecular diversity (h= 0.948, π= 0.006, θ= 0.014) as well as unimodal
distribution of pairwise mismatches (r= 0.025, p= 0.110) and a negative Tajima’s
D (D=-1.831, p=0.007).
The combined mitochondrial dataset (ND4 and cytb) shows diversity
statistics that are consistent with the individual mitochondrial genes (h=0.988,
π=.006, θ=0.015) as well as a unimodal distribution of pairwise mismatches
(r=0.004, p=0.81) and significantly negative Tajima’s D (D= -1.944, p=.006).
As expected, the autosomal gene Mc1r shows less variation than
mitochondrial loci yet is still very diverse for a nuclear protein coding locus.
Haplotype diversity is extraordinarily high (h=.926) with 66 haplotypes in 121
individuals. Sequence diversity is also high (π= 0.004, θ= 0.010). Tests for
mismatch distribution show a unimodal distribution (r= 0.021, p=.719) and
Tajima’s D deviates from neutrality (D= -1.699, p=.012). All these values are
consistent with those from the mitochondrial loci.
13
However, because of the high Mc1r diversity, PHASE could not assign
haplotype identities to all genotypes with high probabilities, and it is possible that
the diversity values were inflated because of misassigned haplotypes. In order to
be conservative, we reanalyzed the data by examining all possible haplotype
designations for each individual with multiple possible genotypes and
preferentially choosing the genotype that minimized the overall diversity of the
sample. This was done by picking a genotype that involved one of the two most
common haplotypes (with frequencies of 0.24 and 0.20, after all genotypes were
assigned) even if PHASE estimated higher probabilities for genotypes with rare
haplotypes. If none of the possible genotypes contained one of these common
haplotypes, genotypes were chosen if they contained a haplotype that was
homozygous in a different individual. Two individuals were dropped from the
analysis because they could not be assigned genotypes under these criteria.
Arlequin analysis shows that this reassignment of haplotypes did not significantly
alter the diversity of the Mc1r sample. There were 71 unique sequences in the
125 individuals (h=0.898) and nucleotide diversity values were similar to the
PHASE predicted data set (π= 0.004, θ= 0.010). Pairwise mismatch and
Tajima’s D values were also similar (r= 0.018, p=0.809; D=-1.755, p=0.011).
This suggests that the high diversity values for this locus are not due to PHASE
artifacts.

14
3.3.2 Population structure and local diversity
If selection for background matching has resulted in reproductive isolation
between light and dark lizards, or if geographic barriers have isolated regions of
our study area, population structure statistics may reveal differences among
these groups even if there is no phylogenetic signal separating them. Given that
mitochondrial genes do not undergo recombination and that analysis of the
separate mitochondrial genes shows they have similar values for all diversity and
population structure statistics, we will only describe the statistics for the
combined mtDNA, rather than those for cytb and ND4 separately.
Table 4 and Table 5 show molecular diversity, mismatch distributions, and
Tajima’s D test for each defined subsample. When comparing putative
subpopulations separated by the soda lake, the lava (and adjacent habitats)
population shows molecular diversity that is similar to the Desert Studies Center
population. Tajima’s D is significantly negative for the Lava population and
negative but not significant for the Desert Studies Center population, although
the smaller sample size (N=15) at the Desert Studies Center may be the reason
for the lack of statistical significance. Each comparison also shows a unimodal
pairwise mismatch distribution. Population structure statistics for mitochondrial
loci (Table 6) for this comparison suggest strong population subdivision (ΦST=
0.125, p= 0; Dj=.964, p= 0.001). Mc1r does show a weak and statistically
15
significant ΦST (ΦST =0.019, p= 0.011), however Jost’s D is not statistically
significantly different from 0 (Dj = 0.083, p= 0.166). Molecular diversity, mismatch
distributions and Tajima's D statistics are compatible with the overall values,
which suggests that population subdivision is not responsible for any of the high
diversity values for the overall analysis.
When comparing dark and light lizards, population structure analysis of
mtDNA indicates weak but statistically significant substructure in mitochondrial
loci, but only when the Desert Studies Center individuals are included (ΦST
=0.017, p= 0.016). When the Desert Studies Center animals are removed from
the analysis, no significant ΦST or Jost’s D values are found. Although ΦST and
Jost’s D values show low levels of differentiation for Mc1r; the p-values are just
marginally insignificant (ΦST =0.006, p=0.068; Dj=0.079, p=.066).
4. Discussion
4.1 Physiological Plasticity
Results suggest that phenotypic plasticity cannot explain the dramatic
color variation among lizards residing on different substrates. When housed on
light substrates, dark lizards did not significantly change color. Rosenblum (2005)
similarly found that Holbrookia maculata (Common Lesser Eared Lizard) and
Sceloporus undulatus (Eastern Fence Lizard) vary in color based on substrate

16
habitat, but show no physiological color change over time when reared on an
intermediate colored substrate. We were unable to hatch eggs in captivity;
however other studies suggest that captive reared hatchlings of other lizard
species in similar systems develop to match maternal coloration, not substrate
color (Rosenblum 2005; Norris 1965). Because environmentally induced
variation cannot explain patterns of dorsal coloration in U. stansburiana it is
appropriate to consider the role of natural selection for local substrate matching
in shaping observed phenotypic variation.
Tests for phenotypic plasticity due to temperature suggest that U.
stansburiana do experience plasticity due to temperature; however the darkening
response triggered by experimental stimulation varied in intensity for different
color morphs. When body temperature was changed from cold to hot we
detected negligible color change in darker lava flow lizards but extensive
plasticity in lighter lizards. These results are compatible with other studies (Lowe
and Norris 1956; Sherbrooke et al. 1994). Studies in diverse taxa have
demonstrated that darker animals heat up faster and can reach higher body
temperatures than non-melanic conspecifics (Pearson 1977; Forsman 1995).
Rates of warming can be important if lizards are more vulnerable to predation
early in the day before they can reach a hot enough temperature to be active
enough to escape. It may then be advantageous for lizards to be darker during

17
colder periods of the day to facilitate heat gain and allow optimal body
temperatures to be reached more quickly (Norris 1965; Watt 1968). Becoming
lighter may reduce heat loads during extremely hot conditions (Benson 1933).
The trend that darker lizards have reduced capacity for color change could
indicate a trade-off between increased melanin production for substrate matching
and decreased ability to aggregate and disperse melanin granules in response to
short-term stimuli.
4.2 Genetic Basis of Color
Mc1r did not show any correlation to color based on phylogenetic and
population genetic analyses. Rosenblum et al. (2004) found that one amino acid
substitution in Mc1r is highly associated with lighter color variants of Little Striped
Whiptail, Aspidocelis inornata and Hokestra et al. (2006) found the same to be
true in pocket mice, Chaetodipus intermedius. However, many other species
showing color variation also show no correlation between color and Mc1r
(Cheviron 2006). Most polymorphic sites in our Mc1r sequences are synonymous
base changes, and the non-synonymous base changes (only 5 throughout the
sample) are found in too few individuals to correlate with color variation.
Population genetic analysis of Mc1r from light and dark lizards found only
on the Cima Lava Field and adjacent habitats (without the Desert Studies Center
18
animals) shows a marginally insignificant low level of differentiation for ΦST and
Jost’s D. Mitochondrial genes show no such tendency (Table 6). Because
mitochondrial DNA should show more population subdivision than a neutral
autosomal locus, these results suggest that there may be some genetic
differentiation between colors because of selection operating on genes linked to
Mc1r.
Overall Mc1r does not appear to explain the color polymorphism in U.
stansburiana. There are many other candidate genes correlated with melanin
pigmentation in various taxa that can be investigated in this system. For
example, solute carrier family 45 member 2 (SLC45A2) is correlated with
plumage color in chickens and Japanese quails (Gunnarsson 2007) and
sodium/potassium/calcium exchanger 5 (SLC24A2) has shown to affect
pigmentation in both zebrafish and humans (Lamason et al. 2005). Investigation
of other pigmentation genes in reptiles may identify other key genes that show a
correlation between color types.
4.3 Molecular Diversity
Both mitochondrial DNA and autosomal DNA show an extraordinary
amount of diversity in our sample. Haplotype diversity (h) and diversity estimates
for π and θ are higher in our limited lava field area than seen in other globally
19
sampled data sets in other taxa. For example, our nuclear π estimate for the
overall sample was close to 0.004, nearly an order of magnitude higher than that
observed in humans (π = 0.00075, The International SNP Map Working Group
2001). Diversity is higher even when comparing U. stansburiana to other taxa
that show adaptive color variation on lava flows. For instance dark variants of
pocket mice, Chaetodipus intermedius, on lava fields in Arizona and New Mexico
have a π of about .002 for Mc1r (Nachmen et al. 2003). θ estimates for combined
populations of beach mice are around .005 for Mc1r (Steiner et al. 2009),
whereas our Mc1r θ estimates are double that (θ= .010). Our diversity estimates
are comparable to values found in marine fish samples taken over a global scale.
For instance, the Pelagic Wahoo, Acanthocybium solandri, collected from
multiple oceans around the world, has h=0.918, π= .006 and θ =.006 for cytb
(Theisen et al. 2008) whereas we found a similar h= 0.979, π=.007 and θ =.016
for cytb in an area easily small enough to walk across in a day. The Squirrelfish,
Holocentrus ascensionis also showed similar levels of diversity (h=.976 and π=
.006) in cytb on a global scale (Bowen et al. 2006). The fact that genetic variation
in world wide populations of mobile marine fish is similar to genetic variation of
our lizards on a single lava field indicates extraordinary variation.
This variation was unlikely due to any sequencing error or artifacts. On top
of obtaining sequence in both directions, we resequenced individuals if sequence

20
data did not have distinct peaks or showed suspicious base changes. Once all
the data were acquired we found no unexpected stop codons, and very few non-
synonymous base changes. Furthermore, heterozygote base calling was
conservative; a position was deemed heterozygous only if the sequence data
showed clear double peaks in both directions.
There are a number of mechanisms that could account for the high levels
of current genetic variability. One mechanism directly implied by our data is
population expansion. Both Tajima’s D values and pairwise mismatch
distributions show consistent results in the total sample for both mitochondrial
and autosomal DNA. A significantly negative Tajima’s D means that there is an
excess of low frequency polymorphisms (rare variation), consistent with
population growth or positive selection. The fact that both a mitochondrial and an
autosomal gene show similar patterns suggest that population growth is more
likely than selection.
Other studies have identified range expansion in a variety of taxa on
different extinct lava fields, with a longer period of time since the last volcanic
activities (Vandergast et al. 2004, Gübitz et al. 2005). Rosenblum (2007)
identified a similar level of diversity in S. undulatus on the Carrizozo lava flow in
New Mexico. This suggests that U. stansburiana on the Cima Lava field, which is

21
thought to have last erupted 10,000 years ago, may be undergoing expansion in
this novel habitat.
5. Conclusion
Investigation of this system shows a clear distribution of lighter animals on
granite and associated rocks and darker animals on dark, basalt rock. Our tests
and related studies suggest that this variation in color is not due to phenotypic
plasticity. Although the candidate locus Mc1r is highly variable in our samples, it
does not correlate with the observed color differences. Still this variability, along
with the extreme variability seen in our mitochondrial DNA, suggests that this
species may be undergoing population expansion and may have a large
population size in the Cima Lava Field.
Future studies should investigate similar lava field systems of U.
stansburiana to determine if this diversity is consistent in other locations. The
Pisgah Volcano, also in San Bernardino County, is a younger volcano with a
population of U. stansburiana that varies in color (Luke 1989). A comparison of
these two sites could show how volcanic age is correlated with genetic variation.
Other populations of U. stansburiana that do not inhabit lava fields should be
investigated as well to ensure this variation is not common in this species. Finally
other candidate color genes should be sequenced to see if they correlate with
22
different dorsal color variants. This work contributes to our knowledge of adaptive
traits on novel habitats, and will hopefully lead to future studies identifying the
underlying mechanisms of the color polymorphism associated with habitats with
dramatically contrasting substrate colors.
6. References
Arevalo, E., S. K. Davis, and J. W. Sites. 1994. Mitochondrial DNA sequence
divergence and phylogenetic relationships among eight chromosome races of the Sceloporus grammicus complex (Phrynosomatidae) in central Mexico. Syst. Biol. 43:387–418.
Barsh, G. S. 1996. The genetics of pigmentation: from fancy genes to complex traits.
Trends Genet. 12:299–305. Benson, S. B. 1933. Concealing coloration among some desert rodents of the
southwestern United States. University of California Publications in Zoology 40:1–20.
Bowen, B. W., A. L. Bass, A. Muss, J. L. Carlin, and D. R. Robertson. 2006
Phylogeography of two Atlantic squirrelfishes (Family Holocentridae): exploring links between pelagic larval duration and population connectivity. Mar Biol 149:899–913.
Cheviron, Z. A. 2006. Sequence variation in the coding region of the melanocortin-1
receptor gene (Mc1r) is not associated with plumage variation in the blue-crowned manakin (Lepidothrix coronata). Proc. R. Soc. B 273:1613–1618.
Corl, A., A. R. Davis, S. R. Kuchta, T. Comendant, and B. Sinervo. 2010. Alternative
mating strategies and the evolution of sexual size dimorphism in the side-blotched lizard, Uta stansburiana: a population-level comparative analysis. Evolution 64:79–96.
Cott, H. B. 1940. Adaptive coloration in animals. Methuen and Co., London.

23
Cushman, S. A., K. S. McKelvey, J. Hayden, and M. K. Schwartz. 2006. Gene Flow in Complex Landscapes: Testing Multiple Hypotheses with Causal Modeling. American Naturalist 168:486–499.
Dohrenwend, J. C., S. G. Wells, and B. D. Turrin. 1986. Degradation of Quaternary
cinder cones in the Cima volcanic field, Mojave Desert, California. Geological Society of America Bulletin 97: 421–427.
Estoup, A., I. J. Wilson, C. Sullivan, J. M. Cornuet, and C. Moritz. 2001. Inferring
population history from microsatellite and enzyme data in serially introduced cane toads, Bufo marinus. Genetics 159:1671–1687.
Excoffier L., Smouse P.E., and J.M Quattro.1992. Analysis of molecular variance
inferred from metric distances among DNA haplotypes: application to human mitochondrial DNA restriction data. Genetics 131:479–491.
Fisher, R. A. 1922. On the interpretation of χ
2 from contingency tables, and the
calculation of P". Journal of the Royal Statistical Society 85:87–94. Forsman, A. 1995. Heating rates and body temperature variation in melanistic and
zigzag Vipera berus: does colour make a difference? Annales Zoologici Fennici 32:365–374.
Fu, Y.X. 1997. Statistical tests of neutrality of mutations against population growth,
hitchhiking, and background selection. Genetics 147:915–925. Gaggiotti, O. E., S. P. Brooks, W. Amos, and J. Harwood. 2004. Combining
demographic, environmental and genetic data to test hypotheses about colonization events in metapopulations. Mol. Ecol. 13:811–825.
Groombridge, J., C. Jones, M. Bruford, and R. Nichols. 2000. ‘Ghost’ alleles of the
Mauritius kestrel. Nature 403:616. Gübitz, T., R.S. Thorpe, and A. Malhotra. 2005. The dynamics of genetic and
morphological variation on volcanic islands. Proc. R. Soc. B 272:751–757. Gunnarsson, U., A. R. Hellstrom, M. Tixier-Boichard, F. Minvielle, B. Bed'hom, S. Ito,
P. Jensen, A. Rattink, A. Vereijken, and L. Andersson. 2007. Mutations in SLC45A2 cause plumage color variation in chicken and Japanese quail. Genetics 175:867-877.

24
Hadly, E. A., U. Ramakrishnan, Y. L. Chan, M. van Tuinen, K. O’Keefe, P. A. Spaeth, and C. J. Conroy. 2004. Genetic response to climatic change: insights from ancient DNA and phylochronology. PLoS Biol. 2:1600–1609.
Harpending, R. C. 1994. Signature of ancient population growth in a low-resolution mitochondrial DNA mismatch distribution. Hum Biol 66:591–600. Hoekstra, H. E., Hirschmann, R. J., Bundey, R. A., Insel, P. A,. Crossland, J. P.
2006. A Single Amino Acid Mutation Contributes to Adaptive Beach Mouse Color Pattern. Science: 313:5783
Hubbard J.K., J.A.C. Uy, M.E. Hauber, H. E. Hoekstra, R. J. Saffran. 2010
Vertebrate pigmentation: from underlying genes to adaptive function. Trends in Genetics. 26, 231–239.
Huelsenbeck, J. P., and R. Ronquist. 2005. Bayesian analysis of molecular evolution
using MrBayes. Pages 183-232 in Statistical Methods in Molecular Evolution (R. Nielsen, ed.). Springer-Verlag.
International SNP Map Working Group. 2001. A map of human genome sequence
variation containing 1.42 million single nucleotide polymorphisms. Nature 409:928–933.
Jost, L. 2008. GST and its relatives do not measure differentiation. Molecular Ecology
17:4015-4026. Kettlewell, B. 1973. The evolution of melanism: the study of a recurring necessity.
Clarendon Press, Oxford, U.K. Lamason, R. L., M. A. Mohideen, J. R. Mest, A. C. Wong, H. L. Norton, M. C. Aros,
M. J. Jurynec, X. Mao, V. R. Humphreville, J. E. Humbert, S. Sinha, J. L. Moore, P. Jagadeeswaran, W. Zhao, G. Ning, I. Makalowska, P. M. McKeigue, D. O'donnell, R. Kittles, E. J. Parra, N. J. Mangini, D. J. Grunwald, M. D. Shriver, V. A. Canfield, and K. C. Cheng. 2005. SLC24A5, a putative cation exchanger, affects pigmentation in zebrafish and humans. Science 310:1782–1786.
Lenormand, T. 2002. Gene flow and the limits to natural selection. Trends in Ecology
& Evolution 17:183–189. Luke, C. A. 1989. Color as a phenotypically plastic character in the side-blotched
lizard, Uta stansburiana. PhD diss. University of California, Berkeley.

25
Meirmans, P. G., and P. H. Van Tienderen: 2004. GENOTYPE and GENODIVE: two
programs for the analysis of genetic diversity of asexual organisms, Molecular Ecology Notes 4:792-794.
Nachman, M. W., H. E. Hoekstra, and S. L. D’Agostino. 2003. The genetic basis of
adaptive melanism in pocket mice. Proc. Natl. Acad. Sci. USA 100:5268–5273.
Nei, M. 1987. Molecular Evolutionary Genetics. Columbia University Press, New
York, NY, USA. Norris, K. S. 1965. Color adaptation in desert reptiles and its thermal relationships.
Pages 162–226 in W.W. Milstead, ed. Lizard ecology: a symposium. University of Missouri Press, Columbia.
Norris, K. S., and C. H. Lowe. 1964. An analysis of background color-matching in
amphibians and reptiles. Ecology 45:565–580. Ore, T.H, and C. N. Warren. 1971. Late Pleistocene-Early Holocene Geomorphic
History of Lake Mojave, California. Geological Society of America Bulletin 82:2553–2562.
Pearson, O. O. 1977. The effect of substrate and of skin color on thermoregulation of
a lizard. Comparative Biochemistry and Physiology 58:353–358. Rogers, A. R., and H. Harpending. 1992. Population growth makes waves in the
distribution of pairwise genetic differences. Mol. Biol. Evol. 9:552-569. Rosenblum, E. B. 2005. The role of phenotypic plasticity in color variation of
Tularosa Basin lizards. Copeia 2005:586–596. Rosenblum, E. B. 2006. Convergent Evolution and Divergent Selection: Lizards at
the White Sands Ecotone. The American Naturalist 167: 1–15. Rosenblum, E. B., H. E. Hoekstra, and M.W. Nachman. 2004. Adaptive reptile color
variation and the evolution of the Mc1r gene. Evolution 58:1794–1808. Rosenblum, E. B., M. Hickerson, C. Moritz. 2007. A multilocus perspective on
colonization accompanied by selection and gene flow. Evolution 12: 2971–2985.
26
Schneider, S., D. Roessli, and L. Excoffier. 2000. Arlequin: a software for population genetics data analysis. Ver. 2.000. Genetics and Biometry Lab., Dept. of Anthropology, Univ. of Geneva.
Sherbrooke, W. C., A. M. D. L. Castrucci, and M. E. Hadley. 1994. Temperature
effects on in vitro skin darkening in the Mountain Spiny Lizard, Sceloporus jarrovii: a thermoregulatory adaptation? Physiol. Zool. 67:659–672.
Steiner C. C, H. Römpler, L. M. Boettger, T. Schöneberg, and H. E. Hoekstra. 2009.
The genetic basis of phenotypic convergence in beach mice: similar pigment patterns but different genes. Molecular Biology and Evolution 26:35–45.
Stephens, M., Smith, N., and Donnelly, P. 2001. A new statistical method for
haplotype reconstruction from population data. American Journal of Human Genetics, 68:978–989.
Storfer, A., J. Cross, V. Rush, and J. Caruso. 1999. Adaptive coloration and gene
flow as a constraint to local adaptation in the streamside salamander, Ambystoma barbouri. Evolution 53:889–898.
Stuart-Fox, D., & A. Moussalli. 2008. Selection for social signalling drives the
evolution of chameleon color change. Public Library of Science Biology. Tajima, F. 1983. Evolutionary relationship of DNA sequences in finite populations.
Genetics 105: 437–460. Tajima, F. 1989. The effect of change in population size on DNA polymorphism.
Genetics 123:597–601. Takeuchi, S., H. Suzuki, S. Hirose, Y. Masafumi, C. Sato, H. Yamamoto, and S.
Takahashi. 1996. Molecular cloning and sequence analysis of the chick melanocortin 1-receptor gene. Biochim. Biophys. Acta 1306:122–126.
Tamura, K. and M. Nei. 1993. Estimation of the number of nucleotide substitutions in
the control region of mitochondrial DNA in humans and chimpanzees. Mol Biol Evol 10:512–526.
Theisen, T. C., B. W. Bowen, W. Lanier, and J. D. Baldwin. 2008. High connectivity
on a global scale in the pelagic wahoo, Acanthacybrium solandri (tuna family Scombridae). Molecular Ecology 17:4233–4247.

27
Turrelli, M., N. H. Barton, and J. A. Coyne. 2001. Theory and speciation. Trends in Ecology & Evolution 16:330–343.
Uy, J.A.C.,R.G. Moyle, C. E. Filardi and Z. A. Cheviron. 2009. Difference in plumage
color used in species recognition between incipient species is linked to a single amino acid substitution in the Melanocortin-1 Receptor. Am. Nat. 174:244–254.
Vandergast, A. G., R. G. Gillespie, and G. K. Roderick. 2004. Influence of volcanic
activity on the population genetic structure of Hawaiian Tetragnatha spiders: fragmentation, rapid population growth and the potential for accelerated evolution. Molecular Ecology 13:1729–1743.
Watt, W. B. 1968. Adaptive significance of pigment polymorphisms in Colias
butterflies. I. Variation of melanin pigment in relation to thermoregulation. Evolution 22:437–458.
Watterson, G. A. 1975. On the number of segregating sites in genetical models
without recombination. Theor. Popul. Biol. 7: 256–276. Wells, S. G., J. C. Dohrenwend, L. D. McFadden, B. D. Turrin, and K. D. Mahrer.
1985. Late Cenozoic landscape evolution on lava flow surfaces of the Cima volcanic field, Mojave Desert, California. Geological Society of America Bulletin 96:1518–1529.
Wilcox, T. P., Zwickl, D. J., Heath, T. A., and D. M. Hillis. 2002. Phylogenetic
relationships of the dwarf boas and a comparison of Bayesian and bootstrap measures of phylogenetic support. Molecular Phylogenetics and Evolution 25:361-371.

28
Table 1: Munsell Geological Rock-Color Chart Color Calls.
Lizard and substrate colors as determined by the Munsell Rock Chart. Olive
black (OB) and olive gray (OG) are associated with dark lizards whereas dark
yellowish brown (DYB) and light olive gray (LOG) are associated with light
lizards. In some cases the primary dorsal colors fit in between two colors and
were assigned two colors. In terms of substrates, brownish gray (BG) is
associated with dark basalt rock, whereas medium gray (MG) is associated with
lighter granite rocks. Yellowish brown (YB) is associated with soil and tree bark
and is also considered light. A lizard is considered to be found matching its
substrate if both lizard color class and its substrate color class are the same.
Lizards that did not match their substrate are shown in bold. Exceptions to this
rule are lizards that had a secondary color that allowed them to match
substrates. This generally occurred in lizards that were dark, yet had light spots.
Lizard ID
Lizard Color Class
Substrate Color Class
Lizard Color
Substrate Color
1 Dark Dark OB BG
2 Dark Dark OG BG
3 Dark Dark OG BG
4 Dark Dark OG BG
6 Dark Dark OG BG
7 Dark Dark OB BG
8 Dark Dark OB BG
9 Dark Dark OB BG
10 Dark Dark OB BG
11 Dark Dark OB BG
12 Dark Dark OB BG
13 Dark Light OB - DYB MG
14 Dark Light OB MG

29
Lizard ID
Lizard Color Class
Substrate Color Class
Lizard Color
Substrate Color
15 Dark Dark OB BG
16 Dark Dark OG BG
17 Dark Dark OG BG
18 Dark Dark OB BG
19 Dark Dark OB BG
20 Dark Dark OB BG
22 Dark Dark OB BG
23 Dark Light OG -DYB MG
24 Dark Dark OG BG
25 Dark Dark OB BG
26 Dark Dark OG BG
27 Dark Dark OB BG
28 Dark Dark OG BG
29 Light Light DYB MG
30 Light Light DYB MG
31 Light Light LOG MG
32 Light Light LOG MG
33 Light Light DYB MG
34 Light Light DYB MG
35 Light Light LOG MG
36 Light Light LOG MG
37 Light Light DYB MG
38 Light Light LOG MG
39 Light Light LOG YB
40 Dark Dark OG BG
41 Dark Dark OG BG
42 Dark Dark OB BG
43 Dark Dark OB BG
44 Dark Dark OB- OG BG
45 Dark Dark OB BG
46 Light Light DYB - OG MG
47 Light Light DYB MG
48 Dark Dark OB BG
49 Dark Dark OB - OG BG

30
Lizard ID
Lizard Color Class
Substrate Color Class
Lizard Color
Substrate Color
50 Dark Dark OG BG
51 Dark Dark OG BG
52 Dark Dark OG - DYB BG
53 Dark Dark OG BG
54 Dark Dark OG - DYB BG
55 Dark Dark OB - OG BG
56 Dark Dark OB BG
57 Dark Dark OB - OG BG
59 Light Dark LOG - OG BG
60 Dark Dark OB BG
61 Dark Light OB - OG MG
62 Dark Dark OG - DYB BG
63 Dark Light OB MG
64 Dark Light OB MG
65 Light Light DYB - OG MG
66 Light Light LOG MG
67 Light Light LOG MG
68 Light Light LOG MG
69 Dark Light OG MG
70 Light Light DYB MG
71 Light Light DYB MG
72 Light Light LOG MG
73 Light Light DYB MG
74 Light Light DYB MG
78 Light Light LOG MG
79 Light Light DYB YB
80 Light Light DYB MG
81 Light Light DYB - OG YB
82 Dark Light OB - DYB MG
83 Dark Light OB - DYB MG
84 Dark Light OB - DYB MG
85 Light Light LOG MG
86 Light Light LOG MG
87 Dark Light OG - LOG MG

31
Lizard ID
Lizard Color Class
Substrate Color Class
Lizard Color
Substrate Color
88 Dark Dark OB BG
89 Light Light DYB MG
90 Light Light LOG MG
91 Dark Light OG MG
92 Light Light LOG - OG MG
93 Dark Light OB MG
94 Light Light LOG MG
95 Light Light DYB MG
96 Light Light DYB MG
97 Dark Light OB - DYB MG
98 Light Light DYB MG
99 Light Dark LOG YB
100 Light Light LOG - OG MG
101 Dark Light OB MG
102 Light Light DYB MG
103 Light Light DYB MG
104 Light Light DYB - OG MG
105 Dark Light OB - DYB MG
106 Light Light LOG MG
107 Dark Light OB - OG MG
108 Light Light LOG - OG MG
109 Light Light DYB MG
110 Light Light LOG MG
111 Light Light DYB MG
112 Light Light DYB - OG MG
113 Light Light LOG MG
114 Light Light DYB YB
115 Light Light LOG - OG MG
116 Dark Dark OB YB
117 Light Light LOG MG
118 Light Light DYB MG
119 Light Light LOG MG
120 Light Light DYB MG
121 Light Light DYB MG

32
Lizard ID
Lizard Color Class
Substrate Color Class
Lizard Color
Substrate Color
122 Dark Light OG - LOG MG
123 Light Light LOG - OG MG
124 Light Light LOG - OG MG
125 Light Light LOG MG
126 Light Light LOG MG
Table 2: Molecular Diversity Summary Statistics Summary statistics for the two mitochondrial loci and their combined data as well
as Mc1r using most probable haplotypes (PHASE) and most common haplotypes
(see text). Included is the number of base pairs sequenced (bp), number of
variable sites, haplotypes, nucleotide diversity (π) , haplotype diversity (h) and
Watterson’s θ (θ).
Locus bp N Variable
Sites Number of Haplotypes h π θ
cytb 1086 121 71 65 0.979 0.007 0.016
ND4 754 121 56 46 0.948 0.006 0.014
Combined mtDNA 1840 121 128 81 0.988 0.006 0.015
Mc1r (PHASE) 701 121 42 66 0.926 0.004 0.010
Mc1r (common) 701 121 42 71 0.898 0.004 0.010

33
Table 3: Mismatch and Neutrality Tests
Tajima’s D (D) and raggedness index (r) with P-values for each locus. Significant
P-values are indicated with an asterisk.
Locus D P r P
cytb -1.869 0.009* 0.011 0.630
ND4 -1.831 0.007* 0.025 0.110
Combined mtDNA -1.944 0.006* 0.004 0.810
Mc1r (PHASE) -1.699 0.012* 0.021 0.719 Mc1r (common) -1.755 0.011* 0.018 0.811
Table 4: Subsample Molecular Diversity
Molecular diversity values for each subsample for mtDNA and Mc1r. Number of
Individuals (N), number of variable sites, number of haplotypes, haplotype
diversity (h), nucleotide diversity (π), and Watterson’s θ (θ) are included for each
subsample.
mtDNA
Population N Variable
Sites Number of Haplotypes h π θ
DSC 15 32 15 0.985 0.004 0.006
Lava 106 116 67 0.985 0.006 0.014
Light 59 100 47 0.991 0.006 0.014
Light (No DSC) 44 81 33 0.985 0.006 0.012
Dark 62 100 48 0.987 0.006 0.014
Mc1r
Population N Variable
Sites Number of Haplotypes h π θ
DSC 30 18 17 0.952 0.005 0.006
Lava 212 39 54 0.919 0.004 0.009
Light 118 33 42 0.920 0.004 0.009
Light (No DSC) 88 30 32 0.904 0.004 0.008
Dark 124 31 44 0.921 0.004 0.008

34
Table 5: Subsample Mismatch and Neutrality Tests Tajima’s D (D) and raggedness index (r) with P-values for each subsample.
Significant values are indicated with an asterisk
mtDNA
Population D P r P
DSC -1.392 0.079 0.017 0.830
Lava -1.854 0.008* 0.004 0.800
Light -1.942 0.004* 0.003 0.950
Light (No DSC) -1.694 0.024* 0.005 0.920
Dark -1.862 0.009* 0.009 0.340
Mc1r
Population D P r P
DSC -0.897 0.196 0.024 0.653
Lava -0.168 0.012* 0.030 0.738
Light -1.615 0.026* 0.019 0.820
Light (No DSC) -1.672 0.018* 0.017 0.870
Dark -1.526 0.030* 0.022 0.690
Table 6: Population Genetic Differentiation
FST, ΦST, and Jost’s D (Dj) for each comparison with P-values. Significant values
are indicated with an asterisk.
mtDNA
Comparison FST P ΦST P Dj P
Light vs. Dark -0.001 0.577 0.017 0.016* -0.045 0.561
Light vs. Dark (No DSC) -0.002 0.792 -0.001 0.460 -0.168 0.756
Lava vs. DSC 0.014 0.012* 0.125 0.000* 0.964 0.001*
Mc1r
Comparison FST P ΦST P Dj P
Light vs. Dark 0.008 0.015* 0.006 0.068 0.079 0.066
Light vs. Dark (No DSC) 0.010 0.022* 0.006 0.095 0.076 0.089
Lava vs. DSC 0.020 0.017* 0.019 0.011* 0.079 0.166

35
Figure 1: Dorsal Color Variation in Uta. stansburiana
Male and female U. stansburiana collected from lava (bottom picture) and granite
sands (top picture).

36
Figure 2: Study Location
Satellite imagery of the Desert Studies Center (DSC), the Cinder Lava Field
(Lava) and the soda lake separating the two. Dark squares indicate collection
sites of dark individuals and light circles indicate collection sites of light
individuals.

37
Figure 3: Cima Lava Field
Satellite imagery of Cima Lava Field shown with relative collection sites: West
Lava, Middle Lava, and South Lava. Dark squares indicate collection sites of
dark individuals and light circles indicate collection sites of light individuals.

38
Figure 4: Phenotypic Plasticity of Captive Lizards.
Comparison of lizards that were captive for at least 15 weeks. Colors are based
on the Munsell Geological Rock-Color Chart: light olive gray (LOG), dark yellow
brown (DYB), olive gray (OG), and olive black (OB). Light called lizards have
open symbols; dark lizards have filled in symbols. Males are indicated with
triangles; females are indicated with circles.

39
Figure 5: Mc1r Haplotype Neighbor Joining Tree
Mc1r haplotype neighbor joining tree with the 66 identified haplotypes.
Haplotypes are associated with light, dark/light, or dark. Bayesian posterior
probabilities greater than 90 are displayed on branches.

40
Figure 6: mtDNA Haplotype MrBayes Tree
MrBayes tree for combined mtDNA haplotypes. Posterior probabilities greater
than 90 are displayed on branches. Statistically supported clades that
correspond to sublocalities are listed. Haplotypes are associated with light,
dark/light, or dark.
41
Appendix 1: Collection Data
Lizard ID
Lizard Color
STV Length (cm) Sex
Collection Location
GPS North
GPS West
Elevation (m)
1 Dark 4.1 M S. Lava 35.18666 115.76699 1022
2 Dark 4 F S. Lava 35.18389 115.76834 1020
3 Dark 4.2 F W. Lava 35.19930 115.86356 708
4 Dark 3.9 F W. Lava 35.19827 115.85777 731
6 Dark 3.9 F W. Lava 35.19854 115.85045 754
7 Dark 5 M W. Lava 35.19519 115.84063 786
8 Dark 4.3 M W. Lava 35.19435 115.84007 786
9 Dark 4.8 M W. Lava 35.18813 115.84016 779
10 Dark 4.3 M W. Lava 35.18929 115.84853 755
11 Dark 4 M W. Lava 35.19925 115.86893 680
12 Dark 4 M W. Lava 35.20052 115.87173 675
13 Dark 4.6 M W. Lava 35.19927 115.87161 680
14 Dark 4.6 M W. Lava 35.19683 115.86925 688
15 Dark 4.4 M W. Lava 35.19601 115.86894 694
16 Dark 4.1 F W. Lava 35.18874 115.85643 730
17 Dark 4.2 F W. Lava 35.18806 115.84843 757
18 Dark NA M W. Lava 35.18893 115.84326 772
19 Dark 4.3 M W. Lava 35.19375 115.84240 770
20 Dark NA M W. Lava 35.19613 115.85579 728
22 Dark 4.5 M W. Lava 35.20071 115.87244 674
23 Dark 4.4 F W. Lava 35.18519 115.84745 764
24 Dark 4.2 F W. Lava 35.18224 115.83325 807
25 Dark 4.7 M W. Lava 35.18378 115.82997 802
26 Dark 4.4 F W. Lava 35.18626 115.82051 862
27 Dark 4.3 M W. Lava 35.18609 115.82127 850
28 Dark 4.2 F W. Lava 35.18745 115.82337 854
29 Light NA M DSC 35.16284 116.10754 294
30 Light 5.1 M DSC 35.14280 116.10395 294
31 Light 4.4 F DSC 35.14300 116.10327 289
32 Light 4.3 F DSC 35.14300 116.10321 288
33 Light 5 M DSC 35.14261 116.10317 285
34 Light 4.6 M DSC 35.14141 116.10528 281

42
Lizard ID
Lizard Color
STV Length (cm) Sex
Collection Location
GPS North
GPS West
Elevation (m)
35 Light 2.3 F DSC 35.13995 116.10594 286
36 Light 4.5 F DSC 35.14013 116.10629 271
37 Light 5.3 M DSC 35.14007 116.10670 283
38 Light NA F W. Lava 35.22117 115.89020 600
39 Light 4.4 F W. Lava 35.22117 115.89020 600
40 Dark 4.7 F S. Lava 35.17071 115.82032 852
41 Dark 4.4 F S. Lava 35.17103 115.81965 848
42 Dark 4.6 M S. Lava 35.17377 115.81586 864
43 Dark 4.5 M S. Lava 35.17334 115.81672 857
44 Dark NA M S. Lava 35.17303 115.81738 853
45 Dark 4.8 M S. Lava 35.16899 115.82136 845
46 Light NA M W. Lava 35.21750 115.89040 609
47 Light 4.4 M W. Lava 35.21753 115.89039 613
48 Dark 4.6 M S. Lava 35.18483 115.76699 1019
49 Dark 4.6 M S. Lava 35.18523 115.76686 1019
50 Dark 4.4 F E. Lava 35.21288 115.75351 1072
51 Dark 4.5 F E. Lava 35.21624 115.75189 1094
52 Dark NA F E. Lava 35.21620 115.75225 1093
53 Dark 4.6 F E. Lava 35.21541 115.75241 1082
54 Dark NA F E. Lava 35.21485 115.75280 1084
55 Dark 5 M E. Lava 35.21479 115.75283 1085
56 Dark 4.9 M E. Lava 35.21412 115.75315 1080
57 Dark 4.5 M E. Lava 35.22199 115.73843 1146
59 Light 4.3 F W. Lava 35.20112 115.87302 671
60 Dark 4.5 M W. Lava 35.21031 115.87733 647
61 Dark NA M W. Lava 35.20933 115.87958 633
62 Dark 4.2 F W. Lava 35.21029 115.88094 630
63 Dark 4.3 M W. Lava 35.24901 115.88827 612
64 Dark 4.5 M W. Lava 35.24919 115.88850 614
65 Light NA M W. Lava 35.24899 115.88928 620
66 Light 4.8 F W. Lava 35.24888 115.88941 625
67 Light 4.5 F W. Lava 35.24845 115.88960 616
68 Light 4.6 F W. Lava 35.24679 115.88895 612
69 Dark 4.4 F W. Lava 35.20832 115.88481 639
43
Lizard ID
Lizard Color
STV Length (cm) Sex
Collection Location
GPS North
GPS West
Elevation (m)
70 Light 4.6 M W. Lava 35.20883 115.88577 643
71 Light 4.5 M W. Lava 35.20848 115.88747 647
72 Light 4.3 F DSC 35.13663 116.10733 525
73 Light 4.5 M DSC 35.13835 116.10820 285
74 Light 4.6 M DSC 35.13882 116.10714 276
78 Light 4.2 F DSC 35.149727 116.1068 290
79 Light 4.9 M DSC 35.149584 116.1064 286
80 Light 3.8 M DSC 35.178772 116.1139 304
81 Light 3.3 M E. Lava 35.219285 115.7679 1042
82 Dark 4 M E. Lava 35.220301 115.7750 1047
83 Dark 3.7 M E. Lava 35.220303 115.7750 1047
84 Dark 4.8 M E. Lava 35.221665 115.7784 1060
85 Light 3.9 F E. Lava 35.221244 115.7789 1062
86 Light 3.7 F E. Lava 35.221119 115.7800 1072
87 Dark 3.6 F E. Lava 35.221119 115.7800 1071
88 Dark 3.4 M E. Lava 35.221221 115.7870 1034
89 Light 4.8 M E. Lava 35.222245 115.7879 1031
90 Light 3.1 F E. Lava 35.222491 115.7879 1041
91 Dark 3.4 F E. Lava 35.222662 115.7877 1041
92 Light 5.1 F E. Lava 35.223628 115.7896 1033
93 Dark 3.9 M E. Lava 35.22362 115.7896 1032
94 Light 4.1 F E. Lava 35.223769 115.7897 1032
95 Light 3.5 M E. Lava 35.22377 115.7897 1032
96 Light 4 M E. Lava 35.224238 115.7919 1023
97 Dark 3.9 M E. Lava 35.223338 115.7909 1028
98 Light 4.5 M E. Lava 35.221942 115.7892 1033
99 Light 3.7 F E. Lava 35.222465 115.7901 1026
100 Light 3.1 F E. Lava 35.221647 115.7890 1028
101 Dark 3.7 M E. Lava 35.216671 115.7816 1058
102 Light 3.6 M E. Lava 35.216824 115.7794 1053
103 Light 4.6 M W. Lava 35.200535 115.8776 690
104 Light 3.8 M W. Lava 35.201636 115.8782 687
105 Dark 3.6 M W. Lava 35.202096 115.8776 697
106 Light 4.1 F W. Lava 35.220142 115.8915 616

44
Lizard ID
Lizard Color
STV Length (cm) Sex
Collection Location
GPS North
GPS West
Elevation (m)
107 Dark 4.2 M W. Lava 35.220524 115.8919 619
108 Light 3 F W. Lava 35.220527 115.8919 618
109 Light 3.6 M W. Lava 35.220534 115.8919 618
110 Light 3.7 F W. Lava 35.219962 115.8912 604
111 Light 4.1 M W. Lava 35.219068 115.8903 607
112 Light NA N/A W. Lava 35.218487 115.8895 610
113 Light 3.6 F W. Lava 35.217918 115.8881 615
114 Light 3.9 M W. Lava 35.217917 115.8881 615
115 Light 3.5 F W. Lava 35.217852 115.8880 616
116 Dark 4.4 M W. Lava 35.217852 115.8880 616
117 Light 3.5 F W. Lava 35.217584 115.8874 615
118 Light 4.8 M W. Lava 35.210237 115.8854 640
119 Light 3.9 F W. Lava 35.208477 115.8872 654
120 Light 4.3 M W. Lava 35.209206 115.8871 651
121 Light NA M W. Lava 35.20564 115.8859 652

45
Appendix 2: Polymerase Chain Reaction Recipes
Mc1r
Stock Reagents Amount (Per RXN) Final
concentration
Water 15 µl -
Dream Taq Buffer 10X (20 mM MgCl2) 2.5 µl 1X, 2 mM
Primer 1 (10 µM) 1.6 µl 0.64 µM
Primer 2 (10 µM) 1.6 µl 0.64 µM
dNTPs (10 mM) 2.6 µl 1.04 mM
Fermentas Dream Taq Polymerase (5 U/µl) 0.2 µl 1 U
Template DNA (50 ng/µl) 1.5 µl 3 ng/µl
Total 25 µl
cytb
Stock Reagents Amount (Per RXN) Final
concentration
Water 11.6 µl -
Amplitaq 10 X Buffer II 2 µl 1X
Primer 1 (10 µM) 1 µl 0.5 µM
Primer 2 (10 µM) 1 µl 0.5 µM
dNTPs (10 mM) 0.6 µl 0.3 mM
MgCl2 (25 mM) 2.4 µl 3 mM
Fermentas Dream Taq Polymerase (5 U/µl) 0.2 µl 1 U
Template DNA (50 ng/µl) 1.2 µl 3 ng/µl
Total 20 µl
ND4
Stock Reagents Amount (Per RXN) Final
concentration
Water 12.5 µl -
Dream Taq Buffer 10X (20 mM MgCl2) 2.1 µl 1.05X, 2.1 mM
Primer 1 (10 µM) 1 µl 0.5 µM
Primer 2 (10 µM) 1 µl 0.5 µM
dNTPs (10 mM) 2 µl 1 mM
Fermentas Dream Taq Polymerase (5 U/µl) 0.15 µl .75 U
Template DNA (50 ng/µl) 1.25 µl 3 ng/µl
Total 20 µl

46
Appendix 3: Polymerase Chain Reaction Protocols
Mc1r
Step Temperature ˚C Time Number of Cycles
Initial Denaturation 94˚ 4 min 1
Denaturation 94˚ 30 sec
Annealing 67˚ 35 sec
Extension 72˚ 50 sec
25
Final Extension 72˚ 7 min 1
Refrigeration 10˚ ∞
cytb
Step Temperature ˚C Time Number of Cycles
Initial Denaturation 94˚ 4 min 1
Denaturation 94˚ 30 sec
Annealing 50˚ 35 sec
Extension 72˚ 50 sec
25
Final Extension 72˚ 7 min 1
Refrigeration 10˚ ∞
ND4
Step Temperature ˚C Time Number of Cycles
Initial Denaturation 94˚ 4 min 1
Denaturation 94˚ 30 sec
Annealing 55˚ 35 sec
Extension 72˚ 50 sec
25
Final Extension 72˚ 7 min 1
Refrigeration 10˚ ∞
47
Appendix 4: PCR and Sequencing Primers
Locus PCR Primer 1 PCR Primer 2
Mc1r CAGCAARCCCACAGGTGAG
(Rosenblum et al. 2004)
TGGYTCTCTGGCAGATGATG
(Rosenblum et al. 2004)
cytb CCACCGTTGTTATTCAACTAC
(Corl et al. 2010)
GGTTTACAAGACCAATGCTTT
(Corl et al. 2010)
D4 CACCTATGACTACCAAAAGCTCATGTAGAA
(Arevalo et al. 1994).
CATTACTTTTACTTGGATTTGCACCA
(Arevalo et al. 1994).
Locus Forward Sequencing Primer Reverse Sequencing Primer
Mc1r GCCCATCAATGTGACCAAC
GATGACGGTTCCATCACCTC
TCAAAGTCCTCCTGAGCT
(Rosenblum et al. 2004)
cytb ACTTTGGCTCTCTTTTAGGAC
ATGATTGAGGCTAGTTGTCCG
D4 ACTAAAACTTGGGGGATATGG GCAGTTCTTGGTGTTCAAAAC