population size and growth rate - .:: directorate...
TRANSCRIPT

PROVISIONAL POPULATION TOTALS 9
POPULATION SIZE AND GROWTH RATE
2

10
The hungry world cannot be fed until and unless the growth of its resources and the growth of its population come into balance. Each man and woman and each nation - must make decisions of conscience and policy in the face of this great problem
“
”Lyndon B. Jonson

POPULATION SIZE AND GROWTH RATE
PROVISIONAL POPULATION TOTALS 11
POPULATION SIZE AND GROWTH RATE
2
2.1 POPULATION SIZE Population enumeration is an essential pre requirement for policy formulation and its
implementation. Provisional population is arrived at by adding the population as reported
by each enumerator in the enumerator abstract for the block assigned to her/him. The final
population is released after the scanning of census schedules, data capture by using ICR
technology and once the processing is completed.
The country has witnessed a population growth from 1028.7 million in 2001 to 1210.2 million
in 2011. From 2001 to 2011 the increase in rural population is 90.5 million while for the urban
population it is 91.0 million. In 2011, Uttar Pradesh has recorded the highest rural population
at 155,111,022 while the lowest rural population is seen in Lakshadweep at 14,121. The urban
population figures indicate that Maharashtra has the maximum urban population at 50,827,531
while the minimum is seen in Lakshadweep at 50,308.
The data for Madhya Pradesh shows an increase in total population from 60.3 million in 2001
to 72.6 million in 2011; where the increase in rural population stands at 8.2 million which is
more than double the increase recorded for the urban population which is 4.1 million. In rural
areas of the state, the male population is 27,142,409 while the female population is recorded
as 25,395,490. The urban population of the state can be segregated into male population of
10,470,511 and female population of 9,589,155.
This chapter shows the population figures reported from the rural and urban areas of the state
and analyses the trends of growth rate in the rural-urban classification. This chapter mainly
focuses on the rural-urban distribution of district and tahsil level data recorded for the state
apart from the comparison of the state in relation to national data, neighbouring states and the
Empowered Action Group (EAG) states.
2.1.1 India and Madhya Pradesh
As per the provisional population totals 2011, India has recorded a total population of 1,210.2
million which comprises of a rural population of 833.1 million (68.84% of the total population)
and an urban population of 377.1 million (31.16% of the total population). In case of Madhya
Pradesh, out of the total state population of 72.6 million the rural population stands at 52.5
million (72.31% of the total population) while urban population is 20.1 million (27.69% of the
total population).
At the national level, in terms of proportion of urban population there has been an upward
trend from 27.81 percent in Census 2001 to 31.16 percent in Census 2011. A similar trend
is observed in Madhya Pradesh with an increase from 26.53 percent to 27.69 percent from
Census 2001 to 2011. The proportion of rural population has declined from 72.19 percent in
2001 to 68.84 percent in 2011 for the country while Madhya Pradesh observed a lower decline
in rural population from 73.47 percent to 72.31 percent across the two Census rounds of 2001
and 2011 respectively as shown in Statement 2.1.

12
Statement 2.1 Percentage population of India and Madhya Pradesh : 2001-11
Population of India Population of Madhya Pradesh
2001 (in million)
2011 (in million)
Difference Percentage 2001 (in million)
2011 (in million)
Difference Percentage
2001 2011 2001 2011
Total 1,028.7 1,210.2 +181.5 100.0 100.0 60.3 72.6 +12.3 100.0 100.0
Rural 742.6 833.1 + 90.5 72.19 68.84 44.3 52.5 + 8.2 73.47 72.31
Urban 286.1 377.1 + 91.0 27.81 31.16 16.0 20.1 + 4.1 26.53 27.69
Statements 2.2, 2.3 and 2.4 give a snapshot of the rural-urban segregation in the top and
bottom five States/UTs in terms of total population, male population and female population
figures respectively.
In terms of total population size at the national level, Uttar Pradesh (199,581,477) is seen in first
position while Lakshadweep (64,429) is ranked the lowest. In the context of rural population,
the top five States/UTs include Uttar Pradesh (155,111,022), Bihar (92,075,028), West Bengal
(62,213,676), Maharashtra (61,545,441) and Andhra Pradesh (56,311,788). The bottom five
States/UTs are Lakshadweep (14,121) followed by Chandigarh (29,004), Daman & Diu (60,331),
Dadra & Nagar Haveli (183,024) and Andaman & Nicobar Islands (244,411).
From the perspective of urban population, Maharashtra (50,827,531) secured the highest rank
followed by Uttar Pradesh (44,470,455), Tamil Nadu (34,949,729), West Bengal (29,134,060)
and Andhra Pradesh (28,353,745). The States/UTs reporting the lowest urban population
figures are Lakshadweep (50,308) followed by Andaman & Nicobar Islands (135,533), Sikkim
(151,726), Dadra & Nagar Haveli (159,829) and Daman & Diu (182,580) as shown in Statement
2.2.
Statement 2.2 Top and bottom five States/UTs by total population (rural and urban) : 2011
India/State/ Union Territory #
Total population
India/State/ Union Territory #
Rural population
India/State/ Union Territory #
Urban population
Top five States/UTs
India 1,210,193,422 India 833,087,662 India 377,105,760
Uttar Pradesh 199,581,477 Uttar Pradesh 155,111,022 Maharashtra 50,827,531
Maharashtra 112,372,972 Bihar 92,075,028 Uttar Pradesh 44,470,455
Bihar 103,804,637 West Bengal 62,213,676 Tamil Nadu 34,949,729
West Bengal 91,347,736 Maharashtra 61,545,441 West Bengal 29,134,060
Andhra Pradesh 84,665,533 Andhra Pradesh 56,311,788 Andhra Pradesh 28,353,745
Bottom five States/UTs
Lakshadweep # 64,429 Lakshadweep # 14,121 Lakshadweep # 50,308
Daman & Diu # 242,911 Chandigarh # 29,004 A & N Islands # 135,533
Dadra & Nagar Haveli # 342,853 Daman & Diu # 60,331 Sikkim 151,726
A & N Islands # 379,944 Dadra & Nagar Haveli # 183,024 Dadra & Nagar Haveli # 159,829
Sikkim 607,688 A & N Islands # 244,411 Daman & Diu # 182,580
Figures for male population at the national level reveal that Uttar Pradesh (104,596,415)
has reported the maximum numbers and Lakshadweep (33,106) the minimum. From the
perspective of ranking of male population in the rural areas, Uttar Pradesh (81,044,655) and
Bihar (47,983,851) are in top two position whereas Lakshadweep (7,228) and Chandigarh
(17,155) have recorded the lowest figures. For the male population residing in the urban areas,

POPULATION SIZE AND GROWTH RATE
PROVISIONAL POPULATION TOTALS 13
the States/UTs where the highest figures have been observed are Maharashtra (26,767,817)
and Uttar Pradesh (23,551,760) and on the other hand Lakshadweep (25,878) and Andaman &
Nicobar Islands (71,683) reported the least male population as shown in Statement 2.3.
Statement 2.3 Top and bottom five States/UTs by males (rural and urban) : 2011
India/State/ Union Territory #
Total males India/State/ Union Territory #
Rural males India/State/ Union Territory #
Urban males
Top five States/UTs
India 623,724,248 India 427,917,052 India 195,807,196
Uttar Pradesh 104,596,415 Uttar Pradesh 81,044,655 Maharashtra 26,767,817
Maharashtra 58,361,397 Bihar 47,983,851 Uttar Pradesh 23,551,760
Bihar 54,185,347 West Bengal 31,904,144 Tamil Nadu 17,495,170
West Bengal 46,927,389 Maharashtra 31,593,580 West Bengal 15,023,245
Andhra Pradesh 42,509,881 Andhra Pradesh 28,219,760 Andhra Pradesh 14,290,121
Bottom five States/UTs
Lakshadweep # 33,106 Lakshadweep # 7,228 Lakshadweep # 25,878
Daman & Diu # 150,100 Chandigarh # 17,155 A & N Islands # 71,683
Dadra & Nagar Haveli # 193,178 Daman & Diu # 32,317 Sikkim 79,539
A & N Islands # 202,330 Dadra & Nagar Haveli # 98,250 Dadra & Nagar Haveli # 94,928
Sikkim 321,661 A & N Islands # 130,647 Daman & Diu # 117,783
In the context of female population in the country, the total figures reveal that Uttar Pradesh
houses the maximum female population of 94,985,062 and Lakshadweep the least of 31,323.
The States/UTs which have reported the maximum female population in the rural areas
are Uttar Pradesh (74,066,367) and Bihar (44,091,177) while the minimum is reported in
Lakshadweep (6,893) and Chandigarh (11,849). For the female population residing in urban
India, the top ranking states in terms of absolute figures include Maharashtra (24,059,714)
and Uttar Pradesh (20,918,695) while Lakshadweep (24,430) and Andaman & Nicobar Islands
(63,850) have recorded the lowest numbers as shown in Statement 2.4.
Statement 2.4Top and bottom five States/UTs by females (rural and urban) : 2011
India/State/ Union Territory #
Total females India/State/ Union Territory #
Rural females India/State/ Union Territory #
Urban females
Top five States/UTs
India 586,469,174 India 405,170,610 India 181,298,564
Uttar Pradesh 94,985,062 Uttar Pradesh 74,066,367 Maharashtra 24,059,714
Maharashtra 54,011,575 Bihar 44,091,177 Uttar Pradesh 20,918,695
Bihar 49,619,290 West Bengal 30,309,532 Tamil Nadu 17,454,559
West Bengal 44,420,347 Maharashtra 29,951,861 West Bengal 14,110,815
Andhra Pradesh 42,155,652 Andhra Pradesh 28,092,028 Andhra Pradesh 14,063,624
Bottom five States/UTs
Lakshadweep # 31,323 Lakshadweep # 6,893 Lakshadweep # 24,430
Daman & Diu # 92,811 Chandigarh # 11,849 A & N Islands # 63,850
Dadra & Nagar Haveli # 149,675 Daman & Diu # 28,014 Daman & Diu # 64,797
A & N Islands # 177,614 Dadra & Nagar Haveli # 84,774 Dadra & Nagar Haveli # 64,901
Sikkim 286,027 A & N Islands # 113,764 Sikkim 72,187

14
2.1.2 Decennial population of Madhya Pradesh
The decennial population trend for the state can be studied from Statement 2.5 and Figure 2.1.
There has been an increase from 12,679,214 persons in 1901 to 72,597,565 persons in 2011;
accounting for a growth of nearly 472.5 percent in eleven decades. The rural areas recorded
a population growth from 11,349,769 in 1901 to 52,537,899 in 2011; while the urban areas
witnessed a growth from 1,329,445 in 1901 to 20,059,666 in 2011. The population growth rate
in the urban areas is much higher than that observed in the rural areas.
Since the population size for males and females was unavailable for the rural areas in 1901,
hence the population pattern for both these categories can be studied from 1911 to 2011. The
male population in rural India has grown from 6,629,383 in 1911 to 27,142,409 in 2011 and in
urban India the male population witnessed an increase from 616,021 in 1911 to 10,470,511 in
2011. For female population in rural areas, there has been an increase from 6,447,709 in 1911
to 25,395,490 in 2011 while the increase in urban areas is from 556,269 in 1911 to 9,589,155
in 2011.
Statement 2.5 Decennial population of Madhya Pradesh : 1901 to 2011
NA-Not Available *The State figures of Males and Females are estimated for the year 1901 because sex wise distribution is not available in respect of many districts for the year.
0
10
20
30
40
50
60
70
80
1901
1911
1921
1931
1941
1951
1961
1971
1981
1991
2001
2011
Popu
lati
on in
mill
ions
Census year
Rural Urban
Census year
Persons Males Females
Total Rural Urban Total Rural Urban Total Rural Urban
1901 12,679,214 11,349,769 1,329,445 *6,429,374 NA 688,794 *6,249,840 NA 640,651
1911 14,249,382 13,077,092 1,172,290 7,245,404 6,629,383 616,021 7,003,978 6,447,709 556,269
1921 13,906,774 12,629,753 1,277,021 7,133,621 6,448,197 685,424 6,773,153 6,181,556 591,597
1931 15,326,879 13,761,011 1,565,868 7,871,541 7,030,498 841,043 7,455,338 6,730,513 724,825
1941 17,175,722 15,117,310 2,058,412 8,825,634 7,724,281 1,101,353 8,350,088 7,393,029 957,059
1951 18,614,931 15,846,018 2,768,913 9,571,722 8,115,679 1,456,043 9,043,209 7,730,339 1,312,870
1961 23,217,910 19,353,390 3,864,520 12,020,106 9,942,126 2,077,980 11,197,804 9,411,264 1,786,540
1971 30,016,625 24,439,750 5,576,875 15,630,250 12,638,140 2,992,110 14,386,375 11,801,610 2,584,765
1981 38,168,507 29,640,220 8,528,287 19,866,607 15,325,292 4,541,315 18,301,900 14,314,928 3,986,972
1991 48,566,242 36,292,098 12,274,144 25,394,673 18,890,291 6,504,382 23,171,569 17,401,807 5,769,762
2001 60,348,023 44,380,878 15,967,145 31,443,652 23,031,093 8,412,559 28,904,371 21,349,785 7,554,586
2011 72,597,565 52,537,899 20,059,666 37,612,920 27,142,409 10,470,511 34,984,645 25,395,490 9,589,155
Fig. 2.1 : Rural and urban population in state

POPULATION SIZE AND GROWTH RATE
PROVISIONAL POPULATION TOTALS 15
2.2 MADHYA PRADESH AND EAG STATESEmpowered Action Group (EAG) was set up to facilitate the preparation of area specific
programmes in eight states, namely, Bihar, Jharkhand, Madhya Pradesh, Chhattisgarh, Orissa,
Rajasthan, Uttar Pradesh and Uttarakhand which have lagged behind in containing population
growth to manageable levels. EAG states constitute 45.9 percent share in total population of
the country.
In the context of total, rural and urban population as reported in 2011 provisional figures,
Uttar Pradesh secured the highest rank and Uttarakhand the lowest among the EAG States.
Madhya Pradesh is seen at third position in rural by recording population of 52,537,899 while
in urban, the state ranks second by reporting a population of 20,059,666 as shown in Statement
2.6 and Figure 2.2.
Statement 2.6Rural and urban total population in EAG states : 2011
EAG States Total EAG States Rural EAG States Urban
India 1,210,193,422 India 833,087,662 India 377,105,760
Uttar Pradesh 199,581,477 Uttar Pradesh 155,111,022 Uttar Pradesh 44,470,455
Bihar 103,804,637 Bihar 92,075,028 Madhya Pradesh 20,059,666
Madhya Pradesh 72,597,565 Madhya Pradesh 52,537,899 Rajasthan 17,080,776
Rajasthan 68,621,012 Rajasthan 51,540,236 Bihar 11,729,609
Orissa 41,947,358 Orissa 34,951,234 Jharkhand 7,929,292
Jharkhand 32,966,238 Jharkhand 25,036,946 Orissa 6,996,124
Chhattisgarh 25,540,196 Chhattisgarh 19,603,658 Chhattisgarh 5,936,538
Uttarakhand 10,116,752 Uttarakhand 7,025,583 Uttarakhand 3,091,169
Fig. 2.2 Rural and urban total population in EAG states
0
20
40
60
80
100
120
140
160
180
Utt
ar P
rade
sh
Biha
r
Mad
hya
Prad
esh
Raja
stha
n
Ori
ssa
Jhar
khan
d
Chha
ttis
garh
Utt
arak
hand
popu
lati
on in
mill
ions
EAG States
Rural Urban
In both rural and urban areas, Uttar Pradesh has reported the highest male population figures
while Uttarakhand has recorded the lowest. Madhya Pradesh has attained the third position
in terms of rural and urban area figures; with a male population of 27,142,409 in the the rural
areas and 10,470,511 in the urban areas as shown in Statement 2.7 and Figure 2.3.

16
Statement 2.7 Rural and urban males population in EAG states : 2011
Fig. 2.3 Rural and urban male population in EAG states
0
20
40
60
80
100
Utt
ar P
rade
sh
Biha
r
Mad
hya
Prad
esh
Raja
stha
n
Ori
ssa
Jhar
khan
d
Chha
ttis
garh
Utt
arak
hand
Popu
lati
oni i
n m
illio
ns
EAG States
Rural Urban
EAG States Total EAG States Rural EAG States UrbanIndia 623,724,248 India 427,917,052 India 195,807,196
Uttar Pradesh 104,596,415 Uttar Pradesh 81,044,655 Uttar Pradesh 23,551,760
Bihar 54,185,347 Bihar 47,983,851 Bihar 6,201,496
Madhya Pradesh 37,612,920 Madhya Pradesh 27,142,409 Madhya Pradesh 10,470,511
Rajasthan 35,620,086 Rajasthan 26,680,882 Rajasthan 8,939,204
Orissa 21,201,678 Orissa 17,584,859 Orissa 3,616,819
Jharkhand 16,931,688 Jharkhand 12,775,468 Jharkhand 4,156,220
Chhattisgarh 12,827,915 Chhattisgarh 9,792,514 Chhattisgarh 3,035,401
Uttarakhand 5,154,178 Uttarakhand 3,512,456 Uttarakhand 1,641,722
A similar trend is observed in regard to the female population across the rural and urban areas where Uttar Pradesh is seen in first position and Uttarakhand has reported the lowest figures. Madhya Pradesh has secured the third position in the rural and urban areas; with a female population of 25,395,490 in the rural areas and 9,589,155 in urban areas as shown in
Statement 2.8 and Figure 2.4.Statement 2.8Rural and urban females population in EAG states : 2011
EAG States Total females EAG States Rural females EAG States Urban females
India 586,469,174 India 405,170,610 India 181,298,564
Uttar Pradesh 94,985,062 Uttar Pradesh 74,066,367 Uttar Pradesh 20,918,695
Bihar 49,619,290 Bihar 44,091,177 Bihar 5,528,113
Madhya Pradesh 34,984,645 Madhya Pradesh 25,395,490 Madhya Pradesh 9,589,155
Rajasthan 33,000,926 Rajasthan 24,859,354 Rajasthan 8,141,572
Orissa 20,745,680 Orissa 17,366,375 Orissa 3,379,305
Jharkhand 16,034,550 Jharkhand 12,261,478 Jharkhand 3,773,072
Chhattisgarh 12,712,281 Chhattisgarh 9,811,144 Chhattisgarh 2,901,137
Uttarakhand 4,962,574 Uttarakhand 3,513,127 Uttarakhand 1,449,447
POPULATION SIZE AND GROWTH RATE
PROVISIONAL POPULATION TOTALS 17
Fig. 2.4 Rural and urban female population in EAG states
0
10
20
30
40
50
60
70
80
Utt
ar P
rade
sh
Biha
r
Mad
hya
Prad
esh
Raja
stha
n
Ori
ssa
Jhar
khan
d
Chha
ttis
garh
Utt
arak
hand
Popu
lati
on in
mill
ions
EAG States
Rural Urban
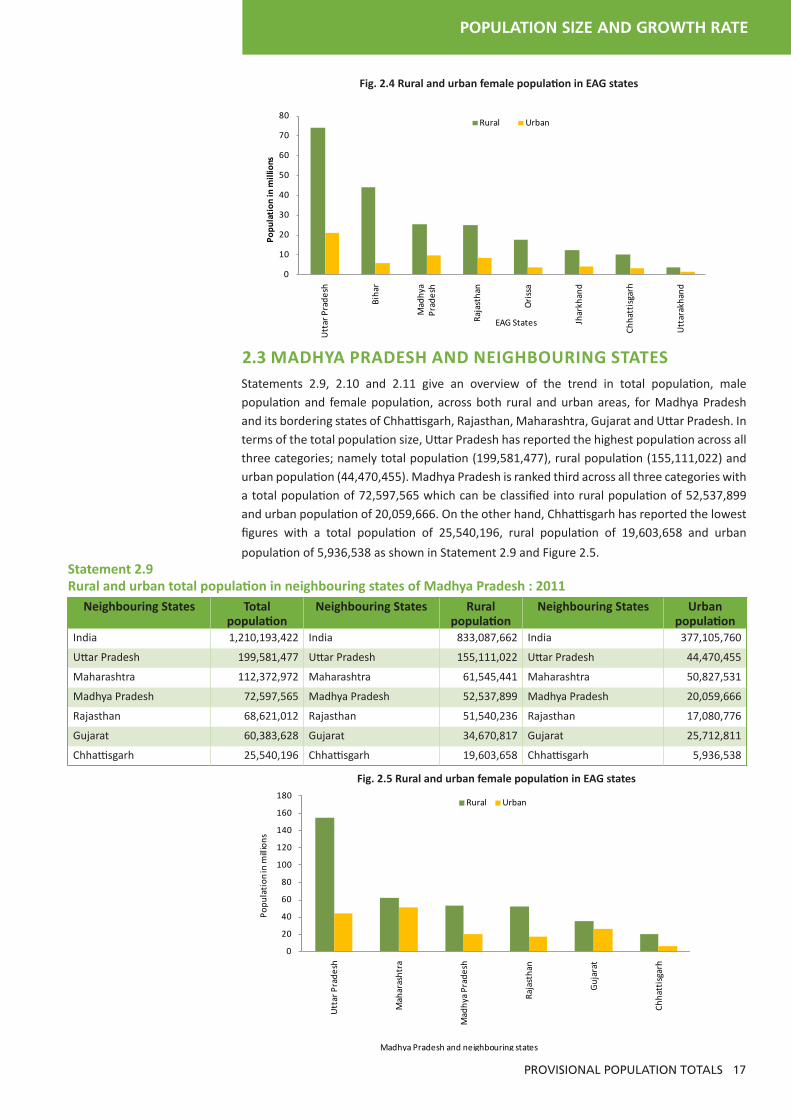
2.3 MADHYA PRADESH AND NEIGHBOURING STATESStatements 2.9, 2.10 and 2.11 give an overview of the trend in total population, male population and female population, across both rural and urban areas, for Madhya Pradesh and its bordering states of Chhattisgarh, Rajasthan, Maharashtra, Gujarat and Uttar Pradesh. In terms of the total population size, Uttar Pradesh has reported the highest population across all three categories; namely total population (199,581,477), rural population (155,111,022) and urban population (44,470,455). Madhya Pradesh is ranked third across all three categories with a total population of 72,597,565 which can be classified into rural population of 52,537,899 and urban population of 20,059,666. On the other hand, Chhattisgarh has reported the lowest figures with a total population of 25,540,196, rural population of 19,603,658 and urban
population of 5,936,538 as shown in Statement 2.9 and Figure 2.5.Statement 2.9 Rural and urban total population in neighbouring states of Madhya Pradesh : 2011
Neighbouring States Total population
Neighbouring States Rural population
Neighbouring States Urban population
India 1,210,193,422 India 833,087,662 India 377,105,760
Uttar Pradesh 199,581,477 Uttar Pradesh 155,111,022 Uttar Pradesh 44,470,455
Maharashtra 112,372,972 Maharashtra 61,545,441 Maharashtra 50,827,531
Madhya Pradesh 72,597,565 Madhya Pradesh 52,537,899 Madhya Pradesh 20,059,666
Rajasthan 68,621,012 Rajasthan 51,540,236 Rajasthan 17,080,776
Gujarat 60,383,628 Gujarat 34,670,817 Gujarat 25,712,811
Chhattisgarh 25,540,196 Chhattisgarh 19,603,658 Chhattisgarh 5,936,538
Fig. 2.5 Rural and urban female population in EAG states
0
20
40
60
80
100
120
140
160
180
Utt
ar P
rade
sh
Mah
aras
htra
Mad
hya
Prad
esh
Raja
stha
n
Guj
arat
Chha
ttis
garh
Popu
lati
on in
mill
ions
Madhya Pradesh and neighbouring states
Rural Urban

18
In terms of male and female population figures, a similar pattern has been observed for rural
and urban areas. In the context of male population, Uttar Pradesh has reported the highest
figures across all the categories; namely total male population (104,596,415), rural male
population (81,044,655) and urban male population (23,551,760). The lowest figures have been
recorded in Chhattisgarh where the total male population is 12,827,915, rural male population
is 9,792,514 and urban male population is pegged at 3,035,401. Madhya Pradesh is in the third
position with a total male population of 37,612,920, rural male population of 27,142,409 and
an urban male population of 10,470,511 as shown in Statement 2.10 and Figure 2.6.Statement 2.10Rural and urban males population in neighbouring states of Madhya Pradesh : 2011
Fig. 2.6 Rural and urban male population in neighbouring states
0
10
20
30
40
50
60
70
80
90
Utt
ar P
rade
sh
Mah
aras
htra
Mad
hya
Prad
esh
Raja
stha
n
Guj
arat
Chha
ttis
garh
Popu
lait
on in
mill
ions
Madhya Pradesh and neighbouring states
Rural Urban
Neighbouring States Total Neighbouring States Rural Neighbouring States Urban
India 623,724,248 India 427,917,052 India 195,807,196
Uttar Pradesh 104,596,415 Uttar Pradesh 81,044,655 Uttar Pradesh 23,551,760
Maharashtra 58,361,397 Maharashtra 31,593,580 Maharashtra 26,767,817
Madhya Pradesh 37,612,920 Madhya Pradesh 27,142,409 Madhya Pradesh 10,470,511
Rajasthan 35,620,086 Rajasthan 26,680,882 Rajasthan 8,939,204
Gujarat 31,482,282 Gujarat 17,802,975 Gujarat 13,679,307
Chhattisgarh 12,827,915 Chhattisgarh 9,792,514 Chhattisgarh 3,035,401
Similarly from the female population figures it is evident that Uttar Pradesh has attained the
highest position with a total female population of 94,985,062, rural female population of
74,066,367 and urban female population pegged at 20,918,695. The state which has recorded
the lowest population is Chhattisgarh with total female population of 12,712,281, rural female
population size of 9,811,144 and urban female population of 2,901,137. Madhya Pradesh
continues to retain the third position with total female population of 34,984,645, rural female
population of 25,395,490 and urban female population of 9,589,155 as shown in Statement
2.11 and Figure 2.7

POPULATION SIZE AND GROWTH RATE
PROVISIONAL POPULATION TOTALS 19
Statement 2.11 Rural and urban females population in neighbouring states of Madhya Pradesh : 2011
Neighbouring States Total Neighbouring States Rural Neighbouring States Urban
India 586,469,174 India 405,170,610 India 181,298,564
Uttar Pradesh 94,985,062 Uttar Pradesh 74,066,367 Uttar Pradesh 20,918,695
Maharashtra 54,011,575 Maharashtra 29,951,861 Maharashtra 24,059,714
Madhya Pradesh 34,984,645 Madhya Pradesh 25,395,490 Madhya Pradesh 9,589,155
Rajasthan 33,000,926 Rajasthan 24,859,354 Rajasthan 8,141,572
Gujarat 28,901,346 Gujarat 16,867,842 Gujarat 12,033,504
Chhattisgarh 12,712,281 Chhattisgarh 9,811,144 Chhattisgarh 2,901,137
0
10
20
30
40
50
60
70
80
Utt
ar P
rade
sh
Mah
aras
htra
Mad
hya
Prad
esh
Raja
stha
n
Guj
arat
Chha
ttis
garh
Popu
lati
on in
mill
ions
Rural Urban
Madhya Pradesh and neighbouring states
Fig. 2.7 Rural and urban female population in neighbouring states
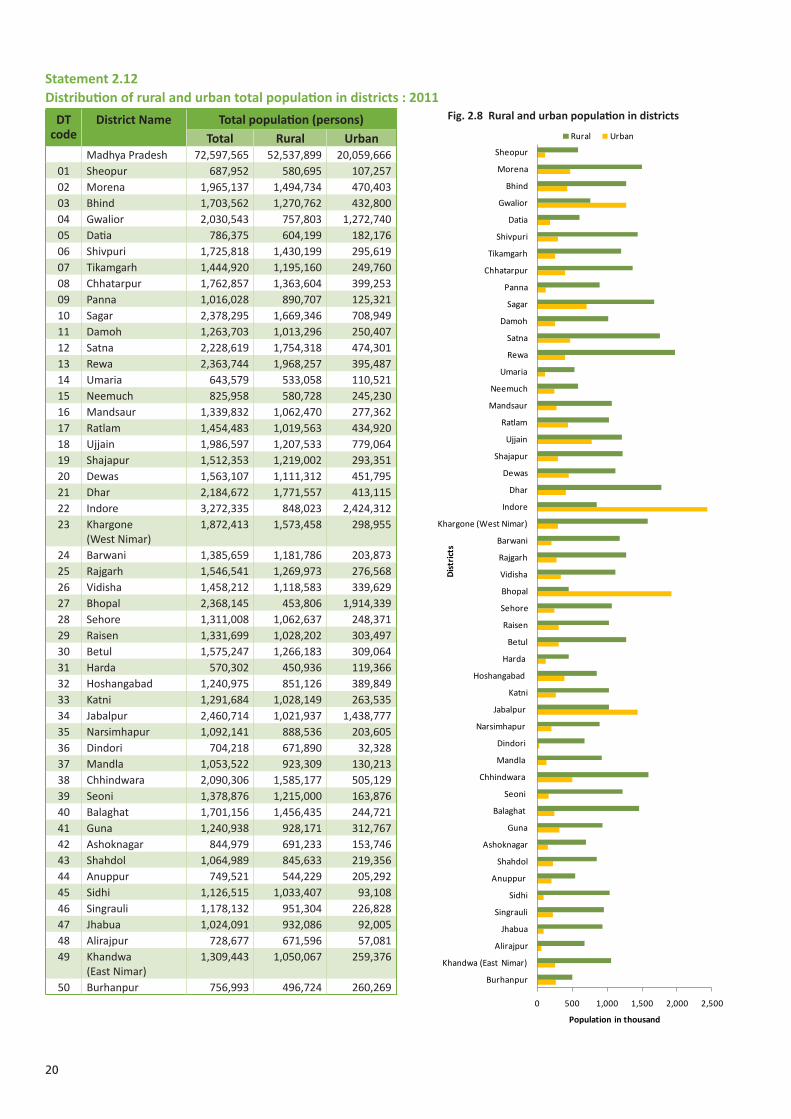
2.4 POPULATION IN DISTRICTS OF MADHYA PRADESHIn terms of total population, the districts which have reported the highest population as shown
in Statement 2.12 and Figure 2.8 are Indore (3,272,335), Jabalpur (2,460,714) and Bhopal
(2,368,145). On the other hand, the bottom three districts include Harda (570,302) followed
by Umaria (643,579) and Sheopur (687,952).
For rural Madhya Pradesh, the three districts which have reported the maximum rural
population are Rewa (1,968,257), Dhar (1,771,557) and Satna (1,754,318). The districts where
the minimum rural population has been observed are Harda (450,936), Bhopal (453,806) and
Burhanpur (496,724).
In the state the highest urban population figures have been recorded from Indore (2,424,312),
Bhopal (1,914,339) and Jabalpur (1,438,777). The lowest figures are seen in Dindori (32,328),
Alirajpur (57,081) and Jhabua (92,005).
20
Statement 2.12Distribution of rural and urban total population in districts : 2011
DT code
District Name Total population (persons)Total Rural Urban
Madhya Pradesh 72,597,565 52,537,899 20,059,666 01 Sheopur 687,952 580,695 107,257 02 Morena 1,965,137 1,494,734 470,403 03 Bhind 1,703,562 1,270,762 432,800 04 Gwalior 2,030,543 757,803 1,272,740 05 Datia 786,375 604,199 182,176 06 Shivpuri 1,725,818 1,430,199 295,619 07 Tikamgarh 1,444,920 1,195,160 249,760 08 Chhatarpur 1,762,857 1,363,604 399,253 09 Panna 1,016,028 890,707 125,321 10 Sagar 2,378,295 1,669,346 708,949 11 Damoh 1,263,703 1,013,296 250,407 12 Satna 2,228,619 1,754,318 474,301 13 Rewa 2,363,744 1,968,257 395,487 14 Umaria 643,579 533,058 110,521 15 Neemuch 825,958 580,728 245,230 16 Mandsaur 1,339,832 1,062,470 277,362 17 Ratlam 1,454,483 1,019,563 434,920 18 Ujjain 1,986,597 1,207,533 779,064 19 Shajapur 1,512,353 1,219,002 293,351 20 Dewas 1,563,107 1,111,312 451,795 21 Dhar 2,184,672 1,771,557 413,115 22 Indore 3,272,335 848,023 2,424,312 23 Khargone
(West Nimar) 1,872,413 1,573,458 298,955
24 Barwani 1,385,659 1,181,786 203,873 25 Rajgarh 1,546,541 1,269,973 276,568 26 Vidisha 1,458,212 1,118,583 339,629 27 Bhopal 2,368,145 453,806 1,914,339 28 Sehore 1,311,008 1,062,637 248,371 29 Raisen 1,331,699 1,028,202 303,497 30 Betul 1,575,247 1,266,183 309,064 31 Harda 570,302 450,936 119,366 32 Hoshangabad 1,240,975 851,126 389,849 33 Katni 1,291,684 1,028,149 263,535 34 Jabalpur 2,460,714 1,021,937 1,438,777 35 Narsimhapur 1,092,141 888,536 203,605 36 Dindori 704,218 671,890 32,328 37 Mandla 1,053,522 923,309 130,213 38 Chhindwara 2,090,306 1,585,177 505,129 39 Seoni 1,378,876 1,215,000 163,876 40 Balaghat 1,701,156 1,456,435 244,721 41 Guna 1,240,938 928,171 312,767 42 Ashoknagar 844,979 691,233 153,746 43 Shahdol 1,064,989 845,633 219,356 44 Anuppur 749,521 544,229 205,292 45 Sidhi 1,126,515 1,033,407 93,108 46 Singrauli 1,178,132 951,304 226,828 47 Jhabua 1,024,091 932,086 92,005 48 Alirajpur 728,677 671,596 57,081 49 Khandwa
(East Nimar) 1,309,443 1,050,067 259,376
50 Burhanpur 756,993 496,724 260,269 0 500 1,000 1,500 2,000 2,500
Burhanpur
Khandwa (East Nimar)
Alirajpur
Jhabua
Singrauli
Sidhi
Anuppur
Shahdol
Ashoknagar
Guna
Balaghat
Seoni
Chhindwara
Mandla
Dindori
Narsimhapur
Jabalpur
Katni
Hoshangabad
Harda
Betul
Raisen
Sehore
Bhopal
Vidisha
Rajgarh
Barwani
Khargone (West Nimar)
Indore
Dhar
Dewas
Shajapur
Ujjain
Ratlam
Mandsaur
Neemuch
Umaria
Rewa
Satna
Damoh
Sagar
Panna
Chhatarpur
Tikamgarh
Shivpuri
Datia
Gwalior
Bhind
Morena
Sheopur
Population in thousand
Dis
tric
ts
Rural Urban
Fig. 2.8 Rural and urban population in districts
With regard to the total male population, the ranking among the districts of the state as shown
in Statement 2.13 and Figure 2.9 reveals that the highest male population is reported from the
districts of Indore (1,700,483), Jabalpur (1,278,448) and Sagar (1,254,251). The lowest male
population are seen in Umaria (329,527), Dindori (351,344) and Sheopur (361,685). In terms
of rural male population figures the districts which have recorded the maximum numbers are
Rewa (1,017,147), Dhar (896,057) and Morena (815,177); whereas the bottom three districts
are Harda (233,616), Bhopal (237,717) and Burhanpur (254,470). In the context of urban male
population, the highest figures are seen in Indore (1,263,924), Bhopal (1,001,661) and Jabalpur
(751,890). The districts which have reported lowest urban male population include Dindori
(16,528), Alirajpur (29,009) and Jhabua (47,504).
In the context of total female population, across the 50 districts of the state, the maximum
female population size has been recorded in Indore (1,571,852) followed by Jabalpur
(1,182,266) and Rewa (1,138,826) whereas the minimum is seen in Harda (275,094), Umaria
(314,052) and Sheopur (326,267). For rural Madhya Pradesh, the top ranking districts with
highest female population are Rewa (951,110), Dhar (875,500) and Satna (846,938) while the
bottom three include Harda (217,320), Burhanpur (242,254) and Umaria (261,086). In terms of
urban female population, the maximum figures have been reported from Indore (1,160,388),
Bhopal (912,678) and Jabalpur (686,887). The districts which recorded the lowest urban
female population include Dindori (15,800), Alirajpur (28,072) and Sidhi (44,448) as shown in
Statement 2.14 and Figure 2.10.
Statement 2.15 outlines the population size in terms of gender and rural-urban classification
for the 50 districts across the years 2001 and 2011 respectively. In 2011, Rewa has recorded the
highest male population at 1,017,147 and female population at 951,110 whereas the lowest
has been reported from Harda with a male population of 233,616 and a female population
which stands at 217,320. Similarly, in 2001 Rewa registered the maximum male (845,993) and
female (806,750) population while Bhopal reported the minimum male (191,367) and female
(169,425) population figures. As per 2011 figures for the urban areas, Indore has recorded
the highest male population of 1,263,924 and female population which stands at 1,160,388
while Dindori has registered the lowest male population of 16,528 and female population of
15,800. The 2001 urban population figures indicated that Indore recorded the maximum male
(909,728) and female (820,635) population and again Dindori was seen in the last position with
the minimum male (13,814) and female (13,056) population figures.
Statement 2.16 presents the percentage of urban population to the total population for
the districts of the state. The ranking of the districts across all three categories namely total
persons, males and females shows a similar trend where Bhopal (80.8%) is seen in first position
followed by Indore (74.1%) and Gwalior (62.7%). The districts which have recorded the lowest
percentage figures across all three categories include Dindori (4.6%), Alirajpur (7.8%) and Sidhi
(8.3%).
In terms of absolute urban population size, district wise analysis indicates that Indore is seen
in the top position with an urban population of 2,424,312 followed by Bhopal with 1,914,339
persons and Jabalpur with 1,438,777 persons. Districts of the state where the lowest urban
population has been recorded include Dindori with an urban population of 32,328 persons
followed by Alirajpur reporting 57,081 persons and Jhabua with 92,005 persons.

POPULATION SIZE AND GROWTH RATE
PROVISIONAL POPULATION TOTALS 21
With regard to the total male population, the ranking among the districts of the state as shown
in Statement 2.13 and Figure 2.9 reveals that the highest male population is reported from the
districts of Indore (1,700,483), Jabalpur (1,278,448) and Sagar (1,254,251). The lowest male
population are seen in Umaria (329,527), Dindori (351,344) and Sheopur (361,685). In terms
of rural male population figures the districts which have recorded the maximum numbers are
Rewa (1,017,147), Dhar (896,057) and Morena (815,177); whereas the bottom three districts
are Harda (233,616), Bhopal (237,717) and Burhanpur (254,470). In the context of urban male
population, the highest figures are seen in Indore (1,263,924), Bhopal (1,001,661) and Jabalpur
(751,890). The districts which have reported lowest urban male population include Dindori
(16,528), Alirajpur (29,009) and Jhabua (47,504).
In the context of total female population, across the 50 districts of the state, the maximum
female population size has been recorded in Indore (1,571,852) followed by Jabalpur
(1,182,266) and Rewa (1,138,826) whereas the minimum is seen in Harda (275,094), Umaria
(314,052) and Sheopur (326,267). For rural Madhya Pradesh, the top ranking districts with
highest female population are Rewa (951,110), Dhar (875,500) and Satna (846,938) while the
bottom three include Harda (217,320), Burhanpur (242,254) and Umaria (261,086). In terms of
urban female population, the maximum figures have been reported from Indore (1,160,388),
Bhopal (912,678) and Jabalpur (686,887). The districts which recorded the lowest urban
female population include Dindori (15,800), Alirajpur (28,072) and Sidhi (44,448) as shown in
Statement 2.14 and Figure 2.10.
Statement 2.15 outlines the population size in terms of gender and rural-urban classification
for the 50 districts across the years 2001 and 2011 respectively. In 2011, Rewa has recorded the
highest male population at 1,017,147 and female population at 951,110 whereas the lowest
has been reported from Harda with a male population of 233,616 and a female population
which stands at 217,320. Similarly, in 2001 Rewa registered the maximum male (845,993) and
female (806,750) population while Bhopal reported the minimum male (191,367) and female
(169,425) population figures. As per 2011 figures for the urban areas, Indore has recorded
the highest male population of 1,263,924 and female population which stands at 1,160,388
while Dindori has registered the lowest male population of 16,528 and female population of
15,800. The 2001 urban population figures indicated that Indore recorded the maximum male
(909,728) and female (820,635) population and again Dindori was seen in the last position with
the minimum male (13,814) and female (13,056) population figures.
Statement 2.16 presents the percentage of urban population to the total population for
the districts of the state. The ranking of the districts across all three categories namely total
persons, males and females shows a similar trend where Bhopal (80.8%) is seen in first position
followed by Indore (74.1%) and Gwalior (62.7%). The districts which have recorded the lowest
percentage figures across all three categories include Dindori (4.6%), Alirajpur (7.8%) and Sidhi
(8.3%).
In terms of absolute urban population size, district wise analysis indicates that Indore is seen
in the top position with an urban population of 2,424,312 followed by Bhopal with 1,914,339
persons and Jabalpur with 1,438,777 persons. Districts of the state where the lowest urban
population has been recorded include Dindori with an urban population of 32,328 persons
followed by Alirajpur reporting 57,081 persons and Jhabua with 92,005 persons.

22
Statement 2.13 Distribution of rural and urban males population in districts : 2011
DT code
District Name MalesTotal Rural Urban
Madhya Pradesh 37,612,920 27,142,409 10,470,511 01 Sheopur 361,685 305,268 56,417 02 Morena 1,068,364 815,177 253,187 03 Bhind 926,940 694,793 232,147 04 Gwalior 1,090,647 409,778 680,869 05 Datia 419,432 323,136 96,296 06 Shivpuri 919,405 762,988 156,417 07 Tikamgarh 759,891 629,148 130,743 08 Chhatarpur 935,906 725,049 210,857 09 Panna 532,866 466,931 65,935 10 Sagar 1,254,251 882,272 371,979 11 Damoh 660,478 529,316 131,162 12 Satna 1,156,734 907,380 249,354 13 Rewa 1,224,918 1,017,147 207,771 14 Umaria 329,527 271,972 57,555 15 Neemuch 421,640 294,487 127,153 16 Mandsaur 681,439 539,880 141,559 17 Ratlam 737,365 515,685 221,680 18 Ujjain 1,016,432 616,168 400,264 19 Shajapur 779,900 628,763 151,137 20 Dewas 805,212 571,248 233,964 21 Dhar 1,114,267 896,057 218,210 22 Indore 1,700,483 436,559 1,263,924 23 Khargone
(West Nimar) 953,617 799,788 153,829
24 Barwani 699,578 595,241 104,337 25 Rajgarh 791,038 649,066 141,972 26 Vidisha 768,799 591,277 177,522 27 Bhopal 1,239,378 237,717 1,001,661 28 Sehore 683,703 554,528 129,175 29 Raisen 701,114 540,599 160,515 30 Betul 799,721 640,809 158,912 31 Harda 295,208 233,616 61,592 32 Hoshangabad 648,970 445,388 203,582 33 Katni 663,064 526,100 136,964 34 Jabalpur 1,278,448 526,558 751,890 35 Narsimhapur 569,618 463,386 106,232 36 Dindori 351,344 334,816 16,528 37 Mandla 525,495 459,392 66,103 38 Chhindwara 1,063,302 805,319 257,983 39 Seoni 694,916 611,435 83,481 40 Balaghat 841,794 719,358 122,436 41 Guna 649,591 486,071 163,520 42 Ashoknagar 444,651 364,078 80,573 43 Shahdol 541,208 427,688 113,520 44 Anuppur 379,496 272,451 107,045 45 Sidhi 577,091 528,431 48,660 46 Singrauli 614,885 494,152 120,733 47 Jhabua 514,830 467,326 47,504 48 Alirajpur 362,748 333,739 29,009 49 Khandwa
(East Nimar) 673,491 540,408 133,083
50 Burhanpur 388,040 254,470 133,570
0 500 1,000 1,500
Burhanpur
Khandwa (East Nimar)
Alirajpur
Jhabua
Singrauli
Sidhi
Anuppur
Shahdol
Ashoknagar
Guna
Balaghat
Seoni
Chhindwara
Mandla
Dindori
Narsimhapur
Jabalpur
Katni
Hoshangabad
Harda
Betul
Raisen
Sehore
Bhopal
Vidisha
Rajgarh
Barwani
Khargone (West Nimar)
Indore
Dhar
Dewas
Shajapur
Ujjain
Ratlam
Mandsaur
Neemuch
Umaria
Rewa
Satna
Damoh
Sagar
Panna
Chhatarpur
Tikamgarh
Shivpuri
Datia
Gwalior
Bhind
Morena
Sheopur
Population in thousand
Dis
tric
ts
Rural Urban
Fig. 2.9 Rural and urban male population in districts

POPULATION SIZE AND GROWTH RATE
PROVISIONAL POPULATION TOTALS 23
Statement 2.14 Distribution of rural and urban females population in districts : 2011
DT code
District Name FemalesTotal Rural Urban
Madhya Pradesh 34,984,645 25,395,490 9,589,155 01 Sheopur 326,267 275,427 50,840 02 Morena 896,773 679,557 217,216 03 Bhind 776,622 575,969 200,653 04 Gwalior 939,896 348,025 591,871 05 Datia 366,943 281,063 85,880 06 Shivpuri 806,413 667,211 139,202 07 Tikamgarh 685,029 566,012 119,017 08 Chhatarpur 826,951 638,555 188,396 09 Panna 483,162 423,776 59,386 10 Sagar 1,124,044 787,074 336,970 11 Damoh 603,225 483,980 119,245 12 Satna 1,071,885 846,938 224,947 13 Rewa 1,138,826 951,110 187,716 14 Umaria 314,052 261,086 52,966 15 Neemuch 404,318 286,241 118,077 16 Mandsaur 658,393 522,590 135,803 17 Ratlam 717,118 503,878 213,240 18 Ujjain 970,165 591,365 378,800 19 Shajapur 732,453 590,239 142,214 20 Dewas 757,895 540,064 217,831 21 Dhar 1,070,405 875,500 194,905 22 Indore 1,571,852 411,464 1,160,388 23 Khargone
(West Nimar) 918,796 773,670 145,126
24 Barwani 686,081 586,545 99,536 25 Rajgarh 755,503 620,907 134,596 26 Vidisha 689,413 527,306 162,107 27 Bhopal 1,128,767 216,089 912,678 28 Sehore 627,305 508,109 119,196 29 Raisen 630,585 487,603 142,982 30 Betul 775,526 625,374 150,152 31 Harda 275,094 217,320 57,774 32 Hoshangabad 592,005 405,738 186,267 33 Katni 628,620 502,049 126,571 34 Jabalpur 1,182,266 495,379 686,887 35 Narsimhapur 522,523 425,150 97,373 36 Dindori 352,874 337,074 15,800 37 Mandla 528,027 463,917 64,110 38 Chhindwara 1,027,004 779,858 247,146 39 Seoni 683,960 603,565 80,395 40 Balaghat 859,362 737,077 122,285 41 Guna 591,347 442,100 149,247 42 Ashoknagar 400,328 327,155 73,173 43 Shahdol 523,781 417,945 105,836 44 Anuppur 370,025 271,778 98,247 45 Sidhi 549,424 504,976 44,448 46 Singrauli 563,247 457,152 106,095 47 Jhabua 509,261 464,760 44,501 48 Alirajpur 365,929 337,857 28,072 49 Khandwa
(East Nimar) 635,952 509,659 126,293
50 Burhanpur 368,953 242,254 126,699
0 400 800 1,200
Burhanpur
Khandwa (East Nimar)
Alirajpur
Jhabua
Singrauli
Sidhi
Anuppur
Shahdol
Ashoknagar
Guna
Balaghat
Seoni
Chhindwara
Mandla
Dindori
Narsimhapur
Jabalpur
Katni
Hoshangabad
Harda
Betul
Raisen
Sehore
Bhopal
Vidisha
Rajgarh
Barwani
Khargone (West Nimar)
Indore
Dhar
Dewas
Shajapur
Ujjain
Ratlam
Mandsaur
Neemuch
Umaria
Rewa
Satna
Damoh
Sagar
Panna
Chhatarpur
Tikamgarh
Shivpuri
Datia
Gwalior
Bhind
Morena
Sheopur
Population in thousand
Dis
tric
ts
Rural Urban
Fig. 2.10 Rural and urban female population in districts

24
Statement 2.15 District-wise rural and urban population by sex : 2001 and 2011
DT code
District Name Rural Urban Rural Urban2011 2011 2001 2001
Males Females Males Females Males Females Males FemalesMadhya Pradesh 27,142,409 25,395,490 10,470,511 9,589,155 23,031,093 21,349,785 8,412,559 7,554,586
01 Sheopur 305,268 27,5427 56,417 50,840 248,103 222,821 47,194 41,377
02 Morena 815,177 679,557 253,187 217,216 687,664 561,745 186,425 156,880
03 Bhind 694,793 575,969 232,147 200,653 596,980 492,646 183,922 155,011
04 Gwalior 409,778 348,025 680,869 591,871 354,064 295,037 529,253 453,755
05 Datia 323,136 281,063 96,296 85,880 284,335 242,275 73,562 63,987
06 Shivpuri 762,988 667,211 156,417 139,202 628,654 537,704 127,871 111,802
07 Tikamgarh 629,148 566,012 130,743 119,017 525,864 464,401 112,049 100,684
08 Chhatarpur 725,049 638,555 210,857 188,396 615,842 534,586 173,091 151,204
09 Panna 466,931 423,776 65,935 59,386 393,209 355,165 57,340 50,844
10 Sagar 882,272 787,074 371,979 336,970 761,243 669,837 311,962 278,945
11 Damoh 529,316 483,980 131,162 119,245 462,648 416,950 107,581 96,770
12 Satna 907,380 846,938 249,354 224,947 766,510 718,041 204,886 180,667
13 Rewa 1,017,147 951,110 207,771 187,716 845,993 806,750 170,694 149,869
14 Umaria 271,972 261,086 57,555 52,966 221,749 211,081 43,379 39,754
15 Neemuch 294,487 286,241 127,153 118,077 267,006 256,094 105,413 97,557
16 Mandsaur 539,880 522,590 141,559 135,803 491,421 471,599 113,698 107,006
17 Ratlam 515,685 503,878 221,680 213,240 431,230 415,729 189,632 178,802
18 Ujjain 616,168 591,365 400,264 378,800 538,586 509,609 344,285 318,502
19 Shajapur 628,763 590,239 151,137 142,214 545,254 506,201 124,598 114,632
20 Dewas 571,248 540,064 233,964 217,831 491,053 458,823 186,813 171,534
21 Dhar 896,057 875,500 218,210 194,905 736,710 715,435 153,706 134,478
22 Indore 436,559 411,464 1,263,924 1,160,388 379,624 355,840 909,728 820,635
23 Khargone (West Nimar) 799,788 773,670 153,829 145,126 659,892 629,286 122,197 113,262
24 Barwani 595,241 586,545 104,337 99,536 469,674 458,717 81,450 76,525
25 Rajgarh 649,066 620,907 141,972 134,596 535,615 501,148 113,491 103,831
26 Vidisha 591,277 527,306 177,522 162,107 509,861 444,629 137,977 122,390
27 Bhopal 237,717 216,089 1,001,661 912,678 191,367 169,425 781,282 701,436
28 Sehore 554,528 508,109 129,175 119,196 463,139 422,033 101,998 91,742
29 Raisen 540,599 487,603 160,515 142,982 487,410 430,944 110,837 95,963
30 Betul 640,809 625,374 158,912 150,152 574,704 561,352 135,252 123,867
31 Harda 233,616 217,320 61,592 57,774 194,117 179,132 53,109 48,058
32 Hoshangabad 445,388 405,738 203,582 186,267 395,290 354,581 176,484 157,910
33 Katni 526,100 502,049 136,964 126,571 430,308 408,598 118,060 107,201
34 Jabalpur 526,558 495,379 751,890 686,887 479,621 444,242 647,683 579,657
35 Narsimhapur 463,386 425,150 106,232 97,373 421,247 383,289 80,398 72,712
36 Dindori 334,816 337,074 16,528 15,800 277,902 275,958 13,814 13,056
37 Mandla 459,392 463,917 66,103 64,110 400,731 401,591 47,225 44,689
38 Chhindwara 805,319 779,858 257,983 247,146 712,421 684,659 234,916 217,287
39 Seoni 611,435 603,565 83,481 80,395 526,328 519,593 62,422 58,265
40 Balaghat 719,358 737,077 122,436 122,285 642,285 661,711 98,464 95,508
41 Guna 486,071 442,100 163,520 149,247 391,391 347,516 125,997 112,923
42 Ashoknagar 364,078 327,155 80,573 73,173 305,644 267,403 60,988 54,905
43 Shahdol 427,688 417,945 113,520 105,836 357,776 347,570 107,008 95,794
44 Anuppur 272,451 271,778 107,045 98,247 237,313 234,490 102,891 92,461
45 Sidhi 528,431 504,976 48,660 44,448 432,040 410,239 37,157 31,547
46 Singrauli 494,152 457,152 120,733 106,095 374,659 353,183 103,974 88,353
47 Jhabua 467,326 464,760 47,504 44,501 356,403 351,270 39,738 36,875
48 Alirajpur 333,739 337,857 29,009 28,072 282,849 283,008 23,063 21,355
49 Khandwa (East Nimar) 540,408 509,659 133,083 126,293 446,171 415,677 112,179 104,224
50 Burhanpur 254,470 242,254 133,570 126,699 201,193 190,172 125,423 118,095

POPULATION SIZE AND GROWTH RATE
PROVISIONAL POPULATION TOTALS 25
GUNA ASHOKNAGAR
SAGARRAJGARH
RAISEN
CHHATARPUR
DAMOH
JABALPUR
PANNA
MORENA
SHEOPUR
BHIND
GWALIORDATIA
SHIVPURI
SATNA
REWA
SIDHISINGRAULI
KATNI
UMARIASHAHDOL
ANUPPUR
MANDLA
DINDORI
BALAGHAT
HOSHANGABAD
NARSIMHAPUR
SEONICHHINDWARA
VIDISHA
BETUL
HARDAALIRAJPUR
JHABUA
DHAR
(WEST NIMAR)(EAST NIMAR)
INDOREDEWAS
UJJAINRATLAM
NEEMUCH
MANDSAUR
SHAJAPUR
SEHORE
TIKAMGARH
BARWANI
BURHANPUR
BHOPAL
KHARGONEKHANDWA
1585177
1669346
1430199
12661831456435
923309
1363604
1573458
928171
1028202
1771557 851126
1215000
8907071754318
1111312
1013296
580695
1118583
1050067
1968257
951304
1062637671890
1207533
1269973
1219002
845633
888536
691233
1494734
1062470
533058
580728
757803
1181786
1195160
5442291019563 1021937
1028149
1270762
1033407
848023932086
671596
496724
450936
604199
453806
40 0 12040 80
KILOMETRES
MADHYA PRADESH
RA
J
A
S
T
H
A
NU T
TA
R
P RA
DE
SH
GU
JA
RA
T
M
AH
A RA
SH T
R A
CH
HA
TT
IS
GA
RH
INDIA
D
D
D
BOUNDARIES : - STATE..............................
DISTRICT.........................
DIVISION.........................
RURAL POPULATION 2011
RURAL POPULATION
1300001 AND ABOVE
1000001 - 1300000
700001 - 1000000
700000 AND BELOW
GUNAASHOKNAGAR
SAGARRAJGARH
RAISEN
CHHATARPUR
DAMOH
JABALPUR
PANNA
MORENA
SHEOPUR
BHIND
GWALIOR
DATIA
SHIVPURI
SATNAREWA
SIDHI SINGRAULI
KATNI
UMARIASHAHDOL
ANUPPUR
MANDLA
DINDORI
BALAGHAT
HOSHANGABAD
NARSIMHAPUR
SEONICHHINDWARA
VIDISHA
BETUL
HARDAALIRAJPUR
JHABUA
DHAR
(WEST NIMAR)(EAST NIMAR)
INDORE
DEWAS
UJJAINRATLAM
NEEMUCH
MANDSAUR
SHAJAPUR
SEHORE
TIKAMGARH
BARWANI
BURHANPUR
BHOPAL
KHARGONEKHANDWA
505129
708949
295619
309064244721
399253
298955
413115
303497
163876
474301
130213
250407
259376
451795
339629
312767
395487
125321
389849
32328248371
107257
779064
276568
293351
226828
470403
93108
277362
203873
249760
219356
434920
203605
153746
263535
110521
432800
245230
92005
2052921438777
57081
1272740
260269
2424312
119366
182176
1914339
40 0 12040 80
KILOMETRES
MADHYA PRADESH
RA
J
A
S
T
H
A
NU T
TA
R
P RA
DE
SH
GU
JA
RA
T
M
AH
A RA
SH T
R A
CH
HA
TT
IS
GA
RH
INDIA
BOUNDARIES : - STATE..............................
DISTRICT.........................
DIVISION.........................
URBAN POPULATION 2011
URBAN POPULATION
500001 AND ABOVE
300001 - 500000
100001 - 300000
100000 AND BELOW

26
Statement 2.16 Percentage of total urban population to total population in the districts : 2011
DT code District Name Total urban population Percentage to total populationPersons Males Females Persons Males Females
Madhya Pradesh 20,059,666 10,470,511 9,589,155 27.6 27.8 27.4
01 Sheopur 107,257 56,417 50,840 15.6 15.6 15.6
02 Morena 470,403 253,187 217,216 23.9 23.7 24.2
03 Bhind 432,800 232,147 200,653 25.4 25.0 25.8
04 Gwalior 1,272,740 680,869 591,871 62.7 62.4 63.0
05 Datia 182,176 96,296 85,880 23.2 23.0 23.4
06 Shivpuri 295,619 156,417 139,202 17.1 17.0 17.3
07 Tikamgarh 249,760 130,743 119,017 17.3 17.2 17.4
08 Chhatarpur 399,253 210,857 188,396 22.6 22.5 22.8
09 Panna 125,321 65,935 59,386 12.3 12.4 12.3
10 Sagar 708,949 371,979 336,970 29.8 29.7 30.0
11 Damoh 250,407 131,162 119,245 19.8 19.9 19.8
12 Satna 474,301 249,354 224,947 21.3 21.6 21.0
13 Rewa 395,487 207,771 187,716 16.7 17.0 16.5
14 Umaria 110,521 57,555 52,966 17.2 17.5 16.9
15 Neemuch 245,230 127,153 118,077 29.7 30.2 29.2
16 Mandsaur 277,362 141,559 135,803 20.7 20.8 20.6
17 Ratlam 434,920 221,680 213,240 29.9 30.1 29.7
18 Ujjain 779,064 400,264 378,800 39.2 39.4 39.0
19 Shajapur 293,351 151,137 142,214 19.4 19.4 19.4
20 Dewas 451,795 233,964 217,831 28.9 29.1 28.7
21 Dhar 413,115 218,210 194,905 18.9 19.6 18.2
22 Indore 2,424,312 1,263,924 1,160,388 74.1 74.3 73.8
23 Khargone (West Nimar) 298,955 153,829 145,126 16.0 16.1 15.8
24 Barwani 203,873 104,337 99,536 14.7 14.9 14.5
25 Rajgarh 276,568 141,972 134,596 17.9 17.9 17.8
26 Vidisha 339,629 177,522 162,107 23.3 23.1 23.5
27 Bhopal 1,914,339 1,001,661 912,678 80.8 80.8 80.9
28 Sehore 248,371 129,175 119,196 18.9 18.9 19.0
29 Raisen 303,497 160,515 142,982 22.8 22.9 22.7
30 Betul 309,064 158,912 150,152 19.6 19.9 19.4
31 Harda 119,366 61,592 57,774 20.9 20.9 21.0
32 Hoshangabad 389,849 203,582 186,267 31.4 31.4 31.5
33 Katni 263,535 136,964 126,571 20.4 20.7 20.1
34 Jabalpur 1,438,777 751,890 686,887 58.5 58.8 58.1
35 Narsimhapur 203,605 106,232 97,373 18.6 18.6 18.6
36 Dindori 32,328 16,528 15,800 4.6 4.7 4.5
37 Mandla 130,213 66,103 64,110 12.4 12.6 12.1
38 Chhindwara 505,129 257,983 247,146 24.2 24.3 24.1
39 Seoni 163,876 83,481 80,395 11.9 12.0 11.8
40 Balaghat 244,721 122,436 122,285 14.4 14.5 14.2
41 Guna 312,767 163,520 149,247 25.2 25.2 25.2
42 Ashoknagar 153,746 80,573 73,173 18.2 18.1 18.3
43 Shahdol 219,356 113,520 105,836 20.6 21.0 20.2
44 Anuppur 205,292 107,045 98,247 27.4 28.2 26.6
45 Sidhi 93,108 48,660 44,448 8.3 8.4 8.1
46 Singrauli 226,828 120,733 106,095 19.3 19.6 18.8
47 Jhabua 92,005 47,504 44,501 9.0 9.2 8.7
48 Alirajpur 57,081 29,009 28,072 7.8 8.0 7.7
49 Khandwa (East Nimar) 259,376 133,083 126,293 19.8 19.8 19.9
50 Burhanpur 260,269 133,570 126,699 34.4 34.4 34.3

POPULATION SIZE AND GROWTH RATE
PROVISIONAL POPULATION TOTALS 27
For Madhya Pradesh, the absolute decadal growth (2011-2001) of rural population in terms of
males stands at 4,111,316 and for female population it is 4,045,705. The maximum growth in
male population is seen in Rewa (171,154) followed by Dhar (159,347) and Satna (140,870);
whereas the minimum growth in ascending order is seen in Neemuch (27,481), Anuppur
(35,138) and Datia (38,801). The highest growth in female population is seen in Dhar (160,065)
followed by Khargone (144,384) and Rewa (144,360) and on the other hand the lowest figures
is observed in Neemuch (30,147), Anuppur (37,288) and Harda (38,188).
In the context of absolute decadal growth of urban population, the state reports a growth
of 2,057,952 for the male population and for female population the growth is pegged at
2,034,569; the figures indicate that the growth in the rural areas is almost twice that calculated
for the urban areas. The highest growth in male population is seen in Indore (354,196), Bhopal
(220,379) and Gwalior (151,616) whereas the lowest figures are reported from Dindori (2,714),
Anuppur (4,154) and Alirajpur (5,946). From the perspective of growth in female population,
the maximum growth is observed in Indore (339,753), Bhopal (211,242) and Gwalior (138,116)
while Dindori (2,744), Anuppur (5,786) and Alirajpur (6,717) have reported the lowest growth
as shown in Statement 2.17.
Madhya Pradesh houses a rural population of 52,537,899 persons which is 72.4 percent of
the state population and an urban population of 20,059,666 persons which accounts for 27.6
percent of the total population. District-wise analysis of rural population reveals that the
highest percentage of rural population is seen in Dindori (95.4%), Alirajpur (92.2%) and Sidhi
(91.7%) whereas Bhopal (19.2%), Indore (25.9%) and Gwalior (37.3%) account for the lowest
rural population which is evident from Statement 2.18.

28
Statement 2.17 District-wise absolute growth of rural and urban population by sex : 2011-2001
DT code
District Name Growth of rural population (2011-2001) Growth of urban population (2011-2001)Males Females Males Females
Madhya Pradesh 4,111,316 4,045,705 2,057,952 2,034,569
01 Sheopur 57,165 52,606 9,223 9,463
02 Morena 127,513 117,812 66,762 60,336
03 Bhind 97,813 83,323 48,225 45,642
04 Gwalior 55,714 52,988 151,616 138,116
05 Datia 38,801 38,788 22,734 21,893
06 Shivpuri 134,334 129,507 28,546 27,400
07 Tikamgarh 103,284 101,611 18,694 18,33308 Chhatarpur 109,207 103,969 37,766 37,192
09 Panna 73,722 68,611 8,595 8,542
10 Sagar 121,029 117,237 60,017 58,025
11 Damoh 66,668 67,030 23,581 22,475
12 Satna 140,870 128,897 44,468 44,280
13 Rewa 171,154 144,360 37,077 37,847
14 Umaria 50,223 50,005 14,176 13,212
15 Neemuch 27,481 30,147 21,740 20,520
16 Mandsaur 48,459 50,991 27,861 28,797
17 Ratlam 84,455 88,149 32,048 34,438
18 Ujjain 77,582 81,756 55,979 60,298
19 Shajapur 83,509 84,038 26,539 27,582
20 Dewas 80,195 81,241 47,151 46,297
21 Dhar 159,347 160,065 64,504 60,427
22 Indore 56,935 55,624 354,196 339,753
23 Khargone (West Nimar) 139,896 144,384 31,632 31,864
24 Barwani 125,567 127,828 22,887 23,011
25 Rajgarh 113,451 119,759 28,481 30,765
26 Vidisha 81,416 82,677 39,545 39,717
27 Bhopal 46,350 46,664 220,379 211,242
28 Sehore 91,389 86,076 27,177 27,454
29 Raisen 53,189 56,659 49,678 47,019
30 Betul 66,105 64,022 23,660 26,285
31 Harda 39,499 38,188 8,483 9,716
32 Hoshangabad 50,098 51,157 27,098 28,357
33 Katni 95,792 93,451 18,904 19,370
34 Jabalpur 46,937 51,137 104,207 107,230
35 Narsimhapur 42,139 41,861 25,834 24,661
36 Dindori 56,914 61,116 2,714 2,744
37 Mandla 58,661 62,326 18,878 19,421
38 Chhindwara 92,898 95,199 23,067 29,859
39 Seoni 85,107 83,972 21,059 22,130
40 Balaghat 77,073 75,366 23,972 26,777
41 Guna 94,680 94,584 37,523 36,324
42 Ashoknagar 58,434 59,752 19,585 18,268
43 Shahdol 69,912 70,375 6,512 10,042
44 Anuppur 35,138 37,288 4,154 5,786
45 Sidhi 96,391 94,737 11,503 12,901
46 Singrauli 119,493 103,969 16,759 17,742
47 Jhabua 110,923 113,490 7,766 7,626
48 Alirajpur 50,890 54,849 5,946 6,717
49 Khandwa (East Nimar) 94,237 93,982 20,904 22,06950 Burhanpur 53,277 52,082 8,147 8,604

POPULATION SIZE AND GROWTH RATE
PROVISIONAL POPULATION TOTALS 29
Statement 2.18District-wise distribution of rural and urban population and percentage to total population in the district : 2011
DT code
District Name Rural Urban Percentage of rural population
Percentage of urban population
Madhya Pradesh 52,537,899 20,059,666 72.4 27.6
01 Sheopur 580,695 107,257 84.4 15.6
02 Morena 1,494,734 470,403 76.1 23.9
03 Bhind 1,270,762 432,800 74.6 25.4
04 Gwalior 757,803 1,272,740 37.3 62.7
05 Datia 604,199 182,176 76.8 23.2
06 Shivpuri 1,430,199 295,619 82.9 17.1
07 Tikamgarh 1,195,160 249,760 82.7 17.308 Chhatarpur 1,363,604 399,253 77.4 22.6
09 Panna 890,707 125,321 87.7 12.3
10 Sagar 1,669,346 708,949 70.2 29.8
11 Damoh 1,013,296 250,407 80.2 19.8
12 Satna 1,754,318 474,301 78.7 21.3
13 Rewa 1,968,257 395,487 83.3 16.7
14 Umaria 533,058 110,521 82.8 17.2
15 Neemuch 580,728 245,230 70.3 29.7
16 Mandsaur 1,062,470 277,362 79.3 20.7
17 Ratlam 1,019,563 434,920 70.1 29.9
18 Ujjain 1,207,533 779,064 60.8 39.2
19 Shajapur 1,219,002 293,351 80.6 19.4
20 Dewas 1,111,312 451,795 71.1 28.9
21 Dhar 1,771,557 413,115 81.1 18.9
22 Indore 848,023 2,424,312 25.9 74.1
23 Khargone (West Nimar) 1,573,458 298,955 84.0 16.024 Barwani 1,181,786 203,873 85.3 14.7
25 Rajgarh 1,269,973 276,568 82.1 17.9
26 Vidisha 1,118,583 339,629 76.7 23.3
27 Bhopal 453,806 1,914,339 19.2 80.8
28 Sehore 1,062,637 248,371 81.1 18.9
29 Raisen 1,028,202 303,497 77.2 22.8
30 Betul 1,266,183 309,064 80.4 19.6
31 Harda 450,936 119,366 79.1 20.9
32 Hoshangabad 851,126 389,849 68.6 31.4
33 Katni 1,028,149 263,535 79.6 20.4
34 Jabalpur 1,021,937 1,438,777 41.5 58.5
35 Narsimhapur 888,536 203,605 81.4 18.6
36 Dindori 671,890 32,328 95.4 4.6
37 Mandla 923,309 130,213 87.6 12.4
38 Chhindwara 1,585,177 505,129 75.8 24.2
39 Seoni 1,215,000 163,876 88.1 11.9
40 Balaghat 1,456,435 244,721 85.6 14.4
41 Guna 928,171 312,767 74.8 25.2
42 Ashoknagar 691,233 153,746 81.8 18.2
43 Shahdol 845,633 219,356 79.4 20.6
44 Anuppur 544,229 205,292 72.6 27.4
45 Sidhi 1,033,407 93,108 91.7 8.3
46 Singrauli 951,304 226,828 80.7 19.3
47 Jhabua 932,086 92,005 91.0 9.0
48 Alirajpur 671,596 57,081 92.2 7.8
49 Khandwa (East Nimar) 1,050,067 259,376 80.2 19.850 Burhanpur 496,724 260,269 65.6 34.4

30
2.4.1 Top and bottom five districts by rural and urban population in absolute numbers
The top five districts, in terms of rural population, are Rewa (1,968,257), Dhar (1,771,557),
Satna (1,754,318), Sagar (1,669,346) and Chhindwara (1,585,177). The bottom five districts
in ascending order are Harda (450,936) followed by Bhopal (453,806), Burhanpur (496,724),
Umaria (533,058) and Anuppur (544,229) as shown in Statement 2.19.
Statement 2.19Top and bottom five districts by rural population : 2011
Top five districts
District Persons Males FemalesRewa 1,968,257 1,017,147 951,110
Dhar 1,771,557 896,057 875,500
Satna 1,754,318 907,380 846,938
Sagar 1,669,346 882,272 787,074
Chhindwara 1,585,177 805,319 779,858
Bottom five districts
District Persons Males FemalesHarda 450,936 233,616 217,320
Bhopal 453,806 237,717 216,089
Burhanpur 496,724 254,470 242,254
Umaria 533,058 271,972 261,086
Anuppur 544,229 272,451 271,778
Top five districts by urban population size are Indore (2,424,312), Bhopal (1,914,339), Jabalpur
(1,438,777), Gwalior (1,272,740) and Ujjain (779,064). Dindori district has recorded the lowest
urban population at 32,328 followed by Alirajpur (57,081), Jhabua (92,005), Sidhi (93,108) and
Sheopur (107,257) as shown in Statement 2.20.
Statement 2.20Top and bottom five districts by urban population : 2011
Top five districts
District Persons Males FemalesIndore 2,424,312 1,263,924 1,160,388
Bhopal 1,914,339 1,001,661 912,678
Jabalpur 1,438,777 751,890 686,887
Gwalior 1,272,740 680,869 591,871
Ujjain 779,064 400,264 378,800
Bottom five districts
District Persons Males FemalesDindori 32,328 16,528 15,800
Alirajpur 57,081 29,009 28,072
Jhabua 92,005 47,504 44,501
Sidhi 93,108 48,660 44,448
Sheopur 107,257 56,417 50,840
2.4.2 Top and bottom five districts by percentage of rural and urban population
Districts where the highest proportion of rural population has been recorded are Dindori
(95.4%), Alirajpur (92.2%) and Sidhi (91.7%) whereas in Bhopal (19.2%), Indore (25.9%) and
Gwalior (37.3%) the lowest rural proportion have been reported as shown in Statement 2.21.
Statement 2.21 Top and bottom five districts by percentage of rural population : 2011
Top five districts
District Division PercentDindori Shahdol 95.4
Alirajpur Indore 92.2
Sidhi Rewa 91.7
Jhabua Indore 91.0
Seoni Jabalpur 88.1
Bottom five districts
District Division PercentBhopal Bhopal 19.2
Indore Indore 25.9
Gwalior Gwalior 37.3
Jabalpur Jabalpur 41.5
Ujjain Ujjain 60.8
Maximum percentage of urban population is observed in Bhopal (80.8%), Indore (74.1%) and
Gwalior (62.7%); while Dindori (4.6%), Alirajpur (7.8%) and Sidhi (8.3%) have reported the
lowest percentages as shown in Statement 2.22.

POPULATION SIZE AND GROWTH RATE
PROVISIONAL POPULATION TOTALS 31
Statement 2.22 Top and bottom five districts by percentage of urban population : 2011
Top five districts
District Division PercentBhopal Bhopal 80.8
Indore Indore 74.1
Gwalior Gwalior 62.7
Jabalpur Jabalpur 58.5
Ujjain Ujjain 39.2
Bottom five districts
District Division PercentDindori Shahdol 4.6
Alirajpur Indore 7.8
Sidhi Rewa 8.3
Jhabua Indore 9.0
Seoni Jabalpur 11.9
2.5 POPULATION IN DIVISIONS OF MADHYA PRADESHWith regard to the rural population in the state, Indore has recorded the highest figures across
all three parameters; namely total rural population (8,525,297), male population (4,323,588)
and female population (4,201,709). Narmadapuram has reported the lowest population across
two indicators namely total population (2,568,245) and rural female population (1,248,432)
whereas Shahdol has recorded the lowest rural male population (1,306,927).
In case of urban population, Indore has attained the highest rank with a total population of
4,008,986, male population pegged at 2,083,466 and a female population size of 1,925,520. In
Shahdol, on the other hand, minimum population is observed across all the categories; total
urban population of 567,497, urban male population of 294,648 and female population of
272,849 as shown in the Statement 2.23.
Statement 2.23Division-wise rural and urban population : 2011
Division code
Division Name Rural UrbanPersons Males Females Persons Males Females
01 Chambal 3,346,191 1,815,238 1,530,953 1,010,460 541,751 468,709
02 Gwalior 4,411,605 2,346,051 2,065,554 2,217,048 1,177,675 1,039,373
03 Sagar 6,132,113 3,232,716 2,899,397 1,733,690 910,676 823,014
04 Rewa 5,707,286 2,947,110 2,760,176 1,189,724 626,518 563,206
05 Shahdol 2,594,810 1,306,927 1,287,883 567,497 294,648 272,849
06 Ujjain 6,200,608 3,166,231 3,034,377 2,481,722 1,275,757 1,205,965
07 Indore 8,525,297 4,323,588 4,201,709 4,008,986 2,083,466 1,925,520
08 Bhopal 4,933,201 2,573,187 2,360,014 3,082,404 1,610,845 1,471,559
09 Narmadapuram 2,568,245 1,319,813 1,248,432 818,279 424,086 394,193
10 Jabalpur 8,118,543 4,111,548 4,006,995 2,949,856 1,525,089 1,424,767
2.5.1 District-wise rural and urban population within divisions : 2011
Statements 2.24 to 2.33 provide an overview of the rural and urban population in the divisions
coupled with the district wise classification under each division reporting figures across three
parameters namely total population, male population and female population.
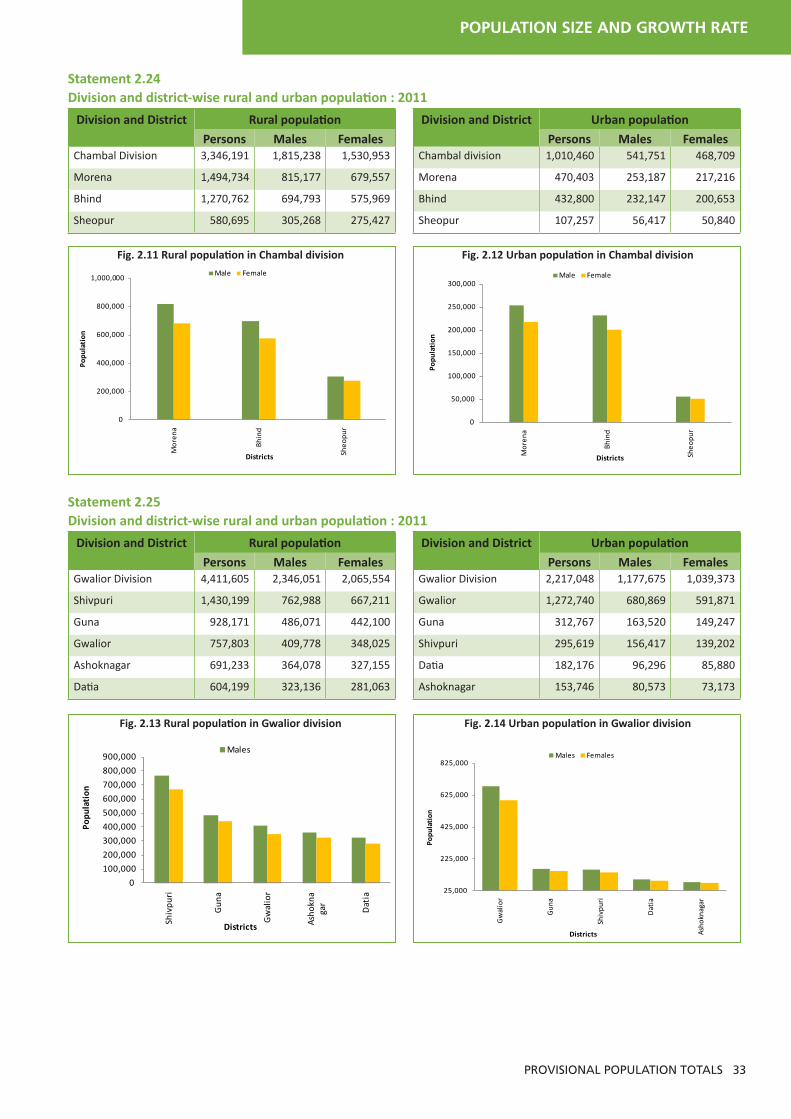
For Chambal division, the rural population stands at 3,346,191 and the urban population is
reported as 1,010,460. Across all three districts in the division, Morena district has reported
the highest population and Sheopur the lowest as shown in Statement 2.24, Figure 2.11 and
2.12.

32
Gwalior division has a rural population of 4,411,605 and an urban population of 2,217,048.
In the rural areas, Shivpuri has reported the highest population and Datia has recorded the
lowest; whereas in the urban areas Gwalior district is the top scorer while Ashoknagar has
recorded the lowest results in terms of population size as shown in Statement 2.25, Figure 2.13
and 2.14.
A look at data from Sagar division indicates that the rural population stands at 6,132,113 while
the urban population is pegged at 1,733,690. For both the rural and urban areas, Sagar district
houses the maximum population in the division whereas the least is seen in Panna as shown in
Statement 2.26, Figure 2.15 and 2.16.
For Rewa division, the rural population stands at 5,707,286 and the urban population is
1,189,724 with Rewa district attaining the top-most rank in rural areas and Satna district in
urban areas. The lowest figures for rural area is reported from Singrauli and for urban area it is
seen in Sidhi district as shown in Statement 2.27, Figure 2.17 and 2.18.
Shahdol division accounts for a rural population of 2,594,810 persons and an urban population
figure of 567,497. In the rural areas, Shahdol district is the top scorer and Umaria secured the
lowest rank while in the urban context the maximum population is seen in Shahdol district and
the minimum is observed for Dindori as shown in Statement 2.28, Figure 2.19 and 2.20.
A rural population of 6,200,608 and an urban population of 2,481,722 is recorded for Ujjain
division. In the rural areas, it is interesting to note that Shajapur district has reported the
highest figures in two out of the three categories, namely, total persons and male population
whereas Ujjain district has recorded the highest female population. Such a pattern has solely
been observed for the rural figures which are reported from Ujjain division. In the urban
areas, Ujjain district has reported the highest population and Neemuch the lowest as shown in
Statement 2.29, Figure 2.21 and 2.22.
Indore division comprises of a rural population of 8,525,297 and and urban population of
4,008,986. In the context of rural areas, Dhar shows the highest population and the lowest is
seen in Burhanpur; whereas in the urban areas Indore district is in first place while Alirajpur has
recorded the least population as shown in Statement 2.30, Figure 2.23 and 2.24.
Data from Bhopal division shows that the rural population amounts to 4,933,201 and the
urban population stands at 3,082,404. In the rural areas, Rajgarh has secured the maximum
population across all three categories whereas Bhopal district has reported the lowest. For the
urban areas of the division, the maximum population is reported in Bhopal and the minimum
is recorded for Sehore as shown in Statement 2.31, Figure 2.25 and 2.26.
For Narmadapuram division, the rural population is 2,568,245 and the urban population stands
at 818,279. Data for the rural areas shows that Betul stands in the first position and Harda
reported the lowest population. From the perspective of urban area, Hoshangabad district has
contributed the maximum population and the lowest population has been recorded in Harda
as shown in Statement 2.32, Figure 2.27 and 2.28.
Lastly, for Jabalpur division the rural population is recorded as 8,118,543 and the urban
population stands at 2,949,856. In the rural areas, Chhindwara has attained the first rank and
Narsimhapur has recorded the lowest population; whereas for urban areas Jabalpur district
has reported the highest population and Mandla has recorded the lowest population as shown
in Statement 2.33, Figure 2.29 and 2.30.
POPULATION SIZE AND GROWTH RATE
PROVISIONAL POPULATION TOTALS 33
Statement 2.24Division and district-wise rural and urban population : 2011
Division and District Rural population
Persons Males FemalesChambal Division 3,346,191 1,815,238 1,530,953
Morena 1,494,734 815,177 679,557
Bhind 1,270,762 694,793 575,969
Sheopur 580,695 305,268 275,427
Division and District Urban population
Persons Males FemalesChambal division 1,010,460 541,751 468,709
Morena 470,403 253,187 217,216
Bhind 432,800 232,147 200,653
Sheopur 107,257 56,417 50,840
Fig. 2.11 Rural population in Chambal division Fig. 2.12 Urban population in Chambal division
0
50,000
100,000
150,000
200,000
250,000
300,000
Mor
ena
Bhin
d
Sheo
pur
Popu
lati
on
Districts
Male Female
0
200,000
400,000
600,000
800,000
1,000,000
Mor
ena
Bhin
d
Sheo
pur
Popu
lati
on
Districts
Male Female
Statement 2.25Division and district-wise rural and urban population : 2011
Division and District Rural population
Persons Males FemalesGwalior Division 4,411,605 2,346,051 2,065,554
Shivpuri 1,430,199 762,988 667,211
Guna 928,171 486,071 442,100
Gwalior 757,803 409,778 348,025
Ashoknagar 691,233 364,078 327,155
Datia 604,199 323,136 281,063
Division and District Urban population
Persons Males FemalesGwalior Division 2,217,048 1,177,675 1,039,373
Gwalior 1,272,740 680,869 591,871
Guna 312,767 163,520 149,247
Shivpuri 295,619 156,417 139,202
Datia 182,176 96,296 85,880
Ashoknagar 153,746 80,573 73,173
Fig. 2.13 Rural population in Gwalior division Fig. 2.14 Urban population in Gwalior division
0
100,000
200,000
300,000
400,000
500,000
600,000
700,000
800,000
900,000
Shiv
puri
Gun
a
Gw
alio
r
Asho
kna
gar
Dat
ia
Popu
lati
on
Districts
Males
25,000
225,000
425,000
625,000
825,000
Gw
alio
r
Gun
a
Shiv
puri
Dat
ia
Asho
knag
ar
Popu
lati
on
Districts
Males Females

34
Statement 2.26Division and district-wise rural and urban population : 2011
Division and District Rural population
Persons Males FemalesSagar Division 6,132,113 3,232,716 2,899,397
Sagar 1,669,346 882,272 787,074
Chhatarpur 1,363,604 725,049 638,555
Tikamgarh 1,195,160 629,148 566,012
Damoh 1,013,296 529,316 483,980
Panna 890,707 466,931 423,776
Division and District Urban population
Persons Males FemalesSagar Division 1,733,690 910,676 823,014
Sagar 708,949 371,979 336,970
Chhatarpur 399,253 210,857 188,396
Damoh 250,407 131,162 119,245
Tikamgarh 249,760 130,743 119,017
Panna 125,321 65,935 59,386
Fig. 2.15 Rural population in Sagar division Fig. 2.16 Urban population in Sagar division
0
100,000
200,000
300,000
400,000
500,000
600,000
700,000
800,000
900,000
1,000,000
Saga
r
Chha
ttar
pur
Tika
mga
rh
Dam
oh
Pann
a
Popu
lati
on
Districts
Males Females
50,000
150,000
250,000
350,000
450,000
Saga
r
Chha
ttar
pur
Dam
oh
Tika
mga
rh
Pann
a
Popu
lati
on
Districts
Males Females
Statement 2.27Division and district-wise rural and urban population : 2011
Division and District Rural population
Persons Males FemalesRewa Division 5,707,286 2,947,110 2,760,176
Rewa 1,968,257 1,017,147 951,110
Satna 1,754,318 907,380 846,938
Sidhi 1,033,407 528,431 504,976
Singrauli 951,304 494,152 457,152
Division and District Urban population
Persons Males FemalesRewa Division 1,189,724 626,518 563,206
Satna 474,301 249,354 224,947
Rewa 395,487 207,771 187,716
Singrauli 226,828 120,733 106,095
Sidhi 93,108 48,660 44,448
Fig. 2.17 Rural population in Rewa division Fig. 2.18 Urban population in Rewa division
0
200,000
400,000
600,000
800,000
1,000,000
1,200,000
Rew
a
Satn
a
Sidh
i
Sing
raul
i
Popu
lati
on
Districts
Males Females
0
50,000
100,000
150,000
200,000
250,000
300,000
Satn
a
Rew
a
Sing
raul
i
Sidh
i
Popu
lati
on
Districts
Males Females

POPULATION SIZE AND GROWTH RATE
PROVISIONAL POPULATION TOTALS 35
Statement 2.28Division and district-wise rural and urban population : 2011
Division and District
Rural population 2011
Persons Males Females
Shahdol Division 2,594,810 1,306,927 1,287,883
Shahdol 845,633 427,688 417,945
Dindori 671,890 334,816 337,074
Anuppur 544,229 272,451 271,778
Umaria 533,058 271,972 261,086
Division and District
Urban population 2011
Persons Males Females
Shahdol Division 567,497 294,648 272,849
Shahdol 219,356 113,520 105,836
Anuppur 205,292 107,045 98,247
Umaria 110,521 57,555 52,966
Dindori 32,328 16,528 15,800
0
50,000
100,000
150,000
200,000
250,000
300,000
350,000
400,000
450,000
Shah
dol
Din
dori
Anup
pur
Um
aria
Popu
lati
on
Districts
Males Females
Fig. 2.19 Rural population in Shahdol division
0
20,000
40,000
60,000
80,000
100,000
120,000
Shah
dol
Anup
pur
Um
aria
Din
dori
Popu
lati
on
Districts
Males Females
Fig 2.20 Urban population in Shahdol division
Statement 2.29Division and district-wise rural and urban population : 2011
0
100,000
200,000
300,000
400,000
500,000
600,000
700,000
Shaj
apur
Ujja
in
Dew
as
Man
dsau
r
Ratl
am
Nee
muc
h
Popu
lati
on
Districts
Males Females
Fig. 2.21 Rural population in Ujjain division
Division and District
Rural populationPersons Males Females
Ujjain Division 6,200,608 3,166,231 3,034,377
Shajapur 1,219,002 628,763 590,239
Ujjain 1,207,533 616,168 591,365
Dewas 1,111,312 571,248 540,064
Mandsaur 1,062,470 539,880 522,590
Ratlam 1,019,563 515,685 503,878
Neemuch 580,728 294,487 286,241
Division and District
Urban populationPersons Males Females
Ujjain Division 2,481,722 1,275,757 1,205,965
Ujjain 779,064 400,264 378,800
Dewas 451,795 233,964 217,831
Ratlam 434,920 221,680 213,240
Shajapur 293,351 151,137 142,214
Mandsaur 277,362 141,559 135,803
Neemuch 245,230 127,153 118,077
100,000
150,000
200,000
250,000
300,000
350,000
400,000
450,000
Ujja
in
Dew
as
Ratl
am
Shaj
apur
Man
dsau
r
Nee
muc
h
Popu
lati
on
Districts
Males Females
Fig. 2.22 Urban population in Ujjain division

36
Statement 2.30Division and district-wise rural and urban population : 2011
Division and District
Rural population
Persons Males FemalesIndore Division 8,525,297 4,323,588 4,201,709
Dhar 1,771,557 896,057 875,500
Khargone (West Nimar) 1,573,458 799,788 773,670
Barwani 1,181,786 595,241 586,545
Khandwa (East Nimar) 1,050,067 540,408 509,659
Jhabua 932,086 467,326 464,760
Indore 848,023 436,559 411,464
Alirajpur 671,596 333,739 337,857
Burhanpur 496,724 254,470 242,254
Division and District
Urban populationPersons Males Females
Indore Division 4,008,986 2,083,466 1,925,520
Indore 2,424,312 1,263,924 1,160,388
Dhar 413,115 218,210 194,905
Khargone (West Nimar) 298,955 153,829 145,126
Khandwa (East Nimar) 259,376 133,083 126,293
Burhanpur 260,269 133,570 126,699
Barwani 203,873 104,337 99,536
Jhabua 92,005 47,504 44,501
Alirajpur 57,081 29,009 28,072
0
200,000
400,000
600,000
800,000
1,000,000
Dha
r
Khar
gone
(W
est N
imar
)
Barw
ani
Khan
dwa
(Eas
t N
imar
)
Jhab
ua
Indo
re
Alir
ajpu
r
Burh
anpu
r
Popu
lati
on
Districts
Males Females
Fig. 2.23 Rural population in Indore division
0
200,000
400,000
600,000
800,000
1,000,000
1,200,000
Indo
re
Dha
r
Khar
gone
(W
est N
imar
)
Khan
dwa
(Eas
t N
imar
)
Burh
anpu
r
Barw
ani
Jhab
ua
Alir
ajpu
r
Popu
lati
on
District
Males Females
Fig. 2.24 Urban population in Indore division
Statement 2.31Division and district-wise rural and urban population : 2011
Division and District
Rural population
Persons Males FemalesBhopal Division 4,933,201 2,573,187 2,360,014
Rajgarh 1,269,973 649,066 620,907
Vidisha 1,118,583 591,277 527,306
Sehore 1,062,637 554,528 508,109
Raisen 1,028,202 540,599 487,603
Bhopal 453,806 237,717 216,089
Division and District
Urban populationPersons Males Females
Bhopal Division 3,082,404 1,610,845 1,471,559
Bhopal 1,914,339 1,001,661 912,678
Vidisha 339,629 177,522 162,107
Raisen 303,497 160,515 142,982
Rajgarh 276,568 141,972 134,596
Sehore 248,371 129,175 119,196
0
100,000
200,000
300,000
400,000
500,000
600,000
700,000
Rajg
arh
Vidi
sha
Seho
re
Rais
en
Bhop
al
Popu
lati
on
Districts
Males FemalesFig. 2.25 Rural population in Bhopal division
0
200,000
400,000
600,000
800,000
1,000,000
1,200,000
Bhop
al
Vidi
sha
Rais
en
Rajg
arh
Seho
re
Popu
lati
on
District
Males FemalesFig. 2.26 Urban population in Bhopal division

POPULATION SIZE AND GROWTH RATE
PROVISIONAL POPULATION TOTALS 37
Statement 2.32Division and district-wise rural and urban population : 2011
Division and
District
Rural population
Persons Males Females
Narmadapuram Division
2,568,245 1,319,813 1,248,432
Betul 1,266,183 640,809 625,374
Hoshangabad 851,126 445,388 405,738
Harda 450,936 233,616 217,320
Division and
District
Urban population
Persons Males Females
Narmadapuram Division
818,279 424,086 394,193
Hoshangabad 389,849 203,582 186,267
Betul 309,064 158,912 150,152
Harda 119,366 61,592 57,774
0
100,000
200,000
300,000
400,000
500,000
600,000
700,000
Betu
l
Hos
hang
abad
Har
da
Popu
lati
on
Districts
Males Females
Fig. 2.27 Rural population in Narmadapuram division
0
50,000
100,000
150,000
200,000
250,000
Hos
hang
abad
Betu
l
Har
da
Popu
lati
on
District
Males Females
Fig. 2.28 Urban population in Narmadapuram division
Statement 2.33Division and district-wise rural and urban population : 2011
Division and District
Rural populationPersons Males Females
Jabalpur Division 8,118,543 4,111,548 4,006,995
Chhindwara 1,585,177 805,319 779,858
Balaghat 1,456,435 719,358 737,077
Seoni 1,215,000 611,435 603,565
Katni 1,028,149 526,100 502,049
Jabalpur 1,021,937 526,558 495,379
Mandla 923,309 459,392 463,917
Narsimhapur 888,536 463,386 425,150
Division and District
Urban populationPersons Males Females
Jabalpur Division 2,949,856 1,525,089 1,424,767
Jabalpur 1,438,777 751,890 686,887
Chhindwara 505,129 257,983 247,146
Katni 263,535 136,964 126,571
Balaghat 244,721 122,436 122,285
Narsimhapur 203,605 106,232 97,373
Seoni 163,876 83,481 80,395
Mandla 130,213 66,103 64,110
0
100,000
200,000
300,000
400,000
500,000
600,000
700,000
800,000
900,000
Chhi
ndw
ara
Bala
ghat
Seon
i
Katn
i
Jaba
lpur
Man
dla
Nar
sim
hapu
r
Popu
lati
on
Districts
Males Females
Fig. 2.29 Rural population in Jabalpur division
0
100,000
200,000
300,000
400,000
500,000
600,000
700,000
800,000
Jaba
lpur
Chhi
ndw
ara
Katn
i
Bala
ghat
Nar
sim
hapu
r
Seon
i
Man
dla
Popu
lati
on
District
Males Females
Fig. 2.30 Urban population in Jabalpur division

38
2.6 POPULATION IN TAHSILS OF MADHYA PRADESH 2.6.1 Top and bottom five tahsils by total, rural and urban population
Among the 342 tahsils in the state, in the context of total population size, Indore tahsil has
attained the top-most rank with a population of 2,384,382 followed by Huzur (2,105,057),
Gwalior (1,494,460) and Jabalpur (1,369,157). The tahsils which reported the lowest total
population figures are Orchha at 47,358 followed by Gulabganj (54,142), Dolariya (57,615) and
Tyonda (69,084) in ascending order as shown in Statement 2.34.
Statement 2.34 Top and bottom five tahsils by total population : 2011
Top five tahsils
Tahsil District Persons Males Females
Indore Indore 2,384,382 1,241,112 1,143,270
Huzur Bhopal 2,105,057 1,101,053 1,004,004
Gwalior Gwalior 1,494,460 802,770 691,690
Jabalpur Jabalpur 1,369,157 716,045 653,112
Sagar Sagar 822,832 434,654 388,178
Bottom five tahsils
Tahsil District Persons Males Females
Orchha Tikamgarh 47,358 25,129 22,229
Gulabganj Vidisha 54,142 28,361 25,781
Dolariya Hoshangabad 57,615 30,209 27,406
Tyonda Vidisha 69,084 36,507 32,577
Gyaraspur Vidisha 69,116 36,410 32,706
Statement 2.35 reveals the top and bottom five tahsils by rural population as per the provisional
Census 2011 figures. In terms of rural population, the tahsils with highest ranking include Dindori
(465,848), Alirajpur (412,136) and Sagar (410,554) whereas Orchha (35,846), Hoshangabad
(47,780) and Dolariya (48,068) the lowest population figures have been observed. From the
perspective of rural male population, Dindori has secured the first position with a population
size of 232,187 followed by Joura tahsil (217,789) and Sagar (217,358) while the low ranking
tahsils include Orchha (19,081), Dolariya (25,169) and Hoshangabad (25,196). In terms of rural
female population size, the tahsils reporting the highest figures include Dindori (233,661),
Alirajpur (207,724) and Sagar (193,196) whereas the least numbers have been recorded in
Orchha (16,765), Hoshangabad (22,584) and Dolariya (22,899).Statement 2.35 Top and bottom five tahsils by rural population : 2011
Top five tahsils
Tahsil District Persons Males Females
Dindori Dindori 465,848 232,187 233,661
Alirajpur Alirajpur 412,136 204,412 207,724
Sagar Sagar 410,554 217,358 193,196
Joura Morena 397,759 217,789 179,970
Gwalior Gwalior 392,479 214,018 178,461
Bottom five tahsils
Tahsil District Persons Males Females
Orchha Tikamgarh 35,846 19,081 16,765
Hoshangabad Hoshangabad 47,780 25,196 22,584
Dolariya Hoshangabad 48,068 25,169 22,899
Nowrozabad Umaria 51,884 26,299 25,585
Gulabganj Vidisha 54,142 28,361 25,781
As per the urban population figures reported in Census 2011, the ranking of the tahsils is
as shown in Statement 2.36. In the context of total urban population figures, the top tahsils
include Indore (2,189,534), Huzur (1,883,381) and Jabalpur (1,205,812) whereas the least
ranking tahsils in ascending order are Kundam (4,848), Lalbarra (5,534) and Shahpur (5,958).
The highest urban male population is reported from Indore (1,140,649), Huzur (985,408) and
Jabalpur (630,893) while Kundam (2,427), Lalbarra (2,775) and Shahpur (3,009) account for the
minimum population figures. In Indore (1,048,885), Huzur (897,973) and Jabalpur (574,919)
tahsils the maximum urban female population have been observed and on the other hand the
minimum population have been recorded for Kundam (2,421), Lalbarra (2,759) and Shahpur
(2,949).

POPULATION SIZE AND GROWTH RATE
PROVISIONAL POPULATION TOTALS 39
Statement 2.36Top and bottom five tahsils by urban population : 2011
Top five tahsils
Tahsil District Persons Males Females
Indore Indore 2,189,534 1,140,649 1,048,885
Huzur Bhopal 1,883,381 985,408 897,973
Jabalpur Jabalpur 1,205,812 630,893 574,919
Gwalior Gwalior 1,101,981 588,752 513,229
Ujjain Ujjain 515,215 265,291 249,924
Bottom five tahsils
Tahsil District Persons Males Females
Kundam Jabalpur 4,848 2,427 2,421
Lalbarra Balaghat 5,534 2,775 2,759
Shahpur Betul 5,958 3,009 2,949
Kirnapur Balaghat 6,137 3,050 3,087
Chitrangi Singrauli 6,533 3,457 3,076
Note: tahsil having zero urban population has been excluded.
2.6.2 Top and bottom five tahsils according to total population in divisions
Statements 2.37 to 2.46 give an overview of the total population along with male and female
population figures for the top and bottom five tahsils in each division of the state. Additionally,
along with the tahsil name is mentioned the name of the district as well.
For Chambal division, Morena tahsil (624,822) has reported the highest population whereas
the lowest is observed in Ron (78,059) as shown in Statement 2.37.
Statement 2.37Top and bottom five tahsils according to total population in Chambal division : 2011
Top five tahsils
Tahsil District Persons Males Females
Morena Morena 624,822 342,974 281,848
Bhind Bhind 538,352 291,070 247,282
Joura Morena 439,908 240,470 199,438
Gohad Bhind 317,013 174,176 142,837
Ambah Morena 258,868 139,483 119,385
five tahsils
Tahsil District Persons Males Females
Ron Bhind 78,059 42,443 35,616
Beerpur Sheopur 87,484 46,441 41,043
Mihona Bhind 89,454 48,681 40,773
Badoda Sheopur 101,627 52,859 48,768
Karahal Sheopur 108,380 56,329 52,051
In Gwalior division, the first position is secured by Gwalior tahsil (1,494,460) and the last by
Shadhora which has reported a population of 73,608 as shown in Statement 2.38.
Statement 2.38Top and bottom five tahsils according to total population in Gwalior division : 2011
Top five tahsils
Tahsil District Persons Males Females
Gwalior Gwalior 1,494,460 802,770 691,690
Guna Guna 404,803 212,348 192,455
Datia Datia 373,893 198,278 175,615
Shivpuri Shivpuri 340,106 181,081 159,025
Dabra Gwalior 324,397 174,530 149,867
Bottom five tahsils
Tahsil District Persons Males Females
Shadhora Ashoknagar 73,608 38,507 35,101
Chinour Gwalior 102,971 55,172 47,799
Bhitarwar Gwalior 108,715 58,175 50,540
Seondha Datia 115,724 62,675 53,049
Maksoodangarh Guna 117,966 61,801 56,165
The numbers from Sagar division reveal that Sagar tahsil (822,832) is the top ranked tahsil and
Orchha (47,358) has recorded lower figures as shown in Statement 2.39.

40
Statement 2.39Top and bottom five tahsils according to total population in Sagar division : 2011
Top five tahsils
Tahsil District Persons Males Females
Sagar Sagar 822,832 434,654 388,178
Chhatarpur Chhatarpur 359,626 190,090 169,536
Damoh Damoh 359,276 187,874 171,402
Tikamgarh Tikamgarh 301,531 158,073 143,458
Rajnagar Chhatarpur 255,110 134,653 120,457
Bottom five tahsils
Tahsil District Persons Males Females
Orchha Tikamgarh 47,358 25,129 22,229
Raipura Panna 77,591 40,086 37,505
Mohangarh Tikamgarh 88,628 46,825 41,803
Devendranagar Panna 88,724 46,432 42,292
Buxwaha Chhatarpur 90,322 48,334 41,988
The population figures for Rewa division indicate that Singrauli tahsil (517,194) has secured the
first position and Kusmi (81,247) contributed the least as shown in Statement 2.40.
Statement 2.40Top and bottom five tahsils according to total population in Rewa division : 2011
Top five tahsils
Tahsil District Persons Males FemalesSingrauli (Baidhan) Singrauli 517,194 269,831 247,363
Raghurajnagar Satna 504,253 264,788 239,465
Huzur Rewa 479,200 251,297 227,903
Maihar Satna 358,743 184,714 174,029
Chitrangi Singrauli 336,540 174,424 162,116
Bottom five tahsils
Tahsil District Persons Males FemalesKusmi Sidhi 81,247 41,177 40,070
Raipur-Karchuliyan Rewa 103,305 53,233 50,072
Kotar Satna 107,467 55,658 51,809
Churhat Sidhi 117,274 59,070 58,204
Gurh Rewa 127,029 65,464 61,565
In Shahdol division, Dindori tahsil (487,186) is the top performer whereas the least contribution
is made by Nowrozabad (78,427) as shown in Statement 2.41.
Statement 2.41Top and bottom five tahsils according to total population in Shahdol division : 2011
Top five tahsils
Tahsil District Persons Males FemalesDindori Dindori 487,186 243,069 244,117
Sohagpur Shahdol 486,384 248,360 238,024
Anuppur Anuppur 306,018 156,020 149,998
Pushparajgarh Anuppur 230,111 115,483 114,628
Manpur Umaria 228,810 116,761 112,049
Bottom five tahsils
Tahsil District Persons Males FemalesNowrozabad Umaria 78,427 40,064 38,363
Jaithari Anuppur 92,817 46,549 46,268
Chandia Umaria 104,773 53,827 50,946
Pali Umaria 107,496 55,009 52,487
Kotma Anuppur 120,575 61,444 59,131
For Ujjain division, Ujjain tahsil (672,550) has shown the highest population figures while the
lowest is observed in Jiran (72,833) as shown in Statement 2.42.
Statement 2.42Top and bottom five tahsils according to total population in Ujjain division : 2011
Top five tahsils
Tahsil District Persons Males FemalesUjjain Ujjain 672,550 345,291 327,259
Ratlam Ratlam 555,016 282,456 272,560
Dewas Dewas 505,784 261,047 244,737
Mandsaur Mandsaur 336,088 171,092 164,996
Badnagar Ujjain 269,499 137,734 131,765
Bottom five tahsils
Tahsil District Persons Males FemalesJiran Neemuch 72,833 36,785 36,048
Bajna Ratlam 80,176 40,325 39,851
Rawti Ratlam 84,152 41,947 42,205
Suwasra Mandsaur 88,396 45,039 43,357
Singoli Neemuch 105,293 53,619 51,674
Indore tahsil (2,384,382) has reported the maximum and Thikri (79,024) the minimum
population for Indore division as shown in Statement 2.43.

POPULATION SIZE AND GROWTH RATE
PROVISIONAL POPULATION TOTALS 41
Statement 2.43Top and bottom five tahsils according to total population in Indore division : 2011
Top five tahsils
Tahsil District Persons Males FemalesIndore Indore 2,384,382 1,241,112 1,143,270
Dhar Dhar 578,236 302,147 276,089
Khandwa Khandwa (East Nimar)
557,837 286,590 271,247
Alirajpur Alirajpur 446,277 221,865 224,412
Burhanpur Burhanpur 432,960 223,139 209,821
Bottom five tahsils
Tahsil District Persons Males FemalesThikri Barwani 79,024 40,587 38,437
Segaon Khargone (West Nimar)
83,477 42,013 41,464
Anjad Barwani 89,458 45,245 44,213
Bhavra Alirajpur 91,111 45,456 45,655
Hatod Indore 100,691 51,533 49,158
In Bhopal division, Huzur tahsil (2,105,057) has reported the highest population and Gulabganj
(54,142) the lowest as shown in Statement 2.44.
Statement 2.44Top and bottom five tahsils according to total population in Bhopal division : 2011
Top five tahsils
Tahsil District Persons Males FemalesHuzur Bhopal 2,105,057 1,101,053 1,004,004
Vidisha Vidisha 322,094 168,889 153,205
Biaora Rajgarh 281,504 144,944 136,560
Narsinghgarh Rajgarh 278,146 142,852 135,294
Sehore Sehore 274,961 143,511 131,450
Bottom five tahsils
Tahsil District Persons Males FemalesGulabganj Vidisha 54,142 28,361 25,781
Tyonda Vidisha 69,084 36,507 32,577
Gyaraspur Vidisha 69,116 36,410 32,706
Nateran Vidisha 82,663 43,572 39,091
Rehti Sehore 91,513 47,688 43,825
For Narmadapuram division, Bhainsdehi tahsil (289,196) is seen in top place in terms of
population size whereas the contribution made by Dolariya (57,615) is minimum as shown in
Statement 2.45.
Statement 2.45Top and bottom five tahsils according to total population in Narmadapuram division : 2011
Top five tahsils
Tahsil District Persons Males FemalesBhainsdehi Betul 289,196 146,300 142,896
Multai Betul 287,068 145,733 141,335
Betul Betul 280,086 143,059 137,027
Itarsi Hoshangabad 240,619 124,936 115,683
Ghoda Dongri Betul 235,678 119,777 115,901
Bottom five tahsils
Tahsil District Persons Males FemalesDolariya Hoshangabad 57,615 30,209 27,406
Handiya Harda 71,498 37,341 34,157
Timarni Harda 76,775 39,998 36,777
Sirali Harda 82,027 42,249 39,778
Chicholi Betul 87,239 44,096 43,143
For Jabalpur division, Jabalpur tahsil (1,369,157) has reported the highest population and
Tirodi (79,355) the lowest as shown in Statement 2.46.
Statement 2.46Top and bottom five tahsils according to total population in Jabalpur division : 2011
Top five tahsils
Tahsil District Persons Males FemalesJabalpur Jabalpur 1,369,157 716,045 653,112
Gadarwara Narsimhapur 421,408 220,937 200,471
Murwara Katni 369,462 191,057 178,405
Seoni Seoni 347,357 177,541 169,816
Chhindwara Chhindwara 337,059 172,277 164,782
Bottom five tahsils
Tahsil District Persons Males FemalesTirodi Balaghat 79,355 39,276 40,079
Dhanora Seoni 84,953 42,950 42,003
Bichhua Chhindwara 87,679 44,498 43,181
Umreth Chhindwara 91,436 46,143 45,293
Tendukheda Narsimhapur 95,023 49,579 45,444

42
2.6.3 Top and bottom five tahsils according to rural population in divisions
Statements 2.47 to 2.56 provide the rural population figures in the top and bottom five tahsils
in each division of the state.
In Chambal division, Joura tahsil (397,759) has reported the highest rural population and
Mihona (72,511) the least as shown in Statement 2.47.
Statement 2.47Top and bottom five tahsils according to rural population in Chambal division : 2011
Top five tahsils
Tahsil District Persons Males Females
Joura Morena 397,759 217,789 179,970
Morena Morena 359,509 199,285 160,224
Bhind Bhind 315,804 172,017 143,787
Gohad Bhind 230,399 126,957 103,442
Ambah Morena 211,693 114,428 97,265
Bottom five tahsils
Tahsil District Persons Males FemalesMihona Bhind 72,511 39,660 32,851
Ron Bhind 78,059 42,443 35,616
Badoda Sheopur 83,172 43,207 39,965
Beerpur Sheopur 87,484 46,441 41,043
Gormi Bhind 107,938 59,179 48,759
For Gwalior division, Gwalior tahsil (392,479) has made the maximum contribution to the
population and the lowest is attributed to Shadhora (73,608) as shown in Statement 2.48.
Statement 2.48Top and bottom five tahsils according to rural population in Gwalior division : 2011
Top five tahsils
Tahsil District Persons Males FemalesGwalior Gwalior 392,479 214,018 178,461
Datia Datia 263,110 139,940 123,170
Pichhore Shivpuri 242,412 128,955 113,457
Guna Guna 223,825 117,703 106,122
Pohri Shivpuri 207,357 110,530 96,827
Bottom five tahsils
Tahsil District Persons Males FemalesShadhora Ashoknagar 73,608 38,507 35,101
Bhitarwar Gwalior 89,616 47,994 41,622
Seondha Datia 92,576 50,265 42,311
Chinour Gwalior 93,027 49,849 43,178
Raghogarh Guna 98,223 51,389 46,834
Sagar tahsil (410,554) has secured the top position while the least figures have been recorded
in Orchha (35,846) for Sagar division as shown in Statement 2.49.
Statement 2.49Top and bottom five tahsils according to rural population in Sagar division : 2011
Top five tahsils
Tahsil District Persons Males FemalesSagar Sagar 410,554 217,358 193,196
Rajnagar Chhatarpur 216,355 114,196 102,159
Chhatarpur Chhatarpur 211,938 112,020 99,918
Tikamgarh Tikamgarh 202,897 106,503 96,394
Palera Tikamgarh 196,105 102,953 93,152
Bottom five tahsils
Tahsil District Persons Males FemalesOrchha Tikamgarh 35,846 19,081 16,765
Devendranagar Panna 67,490 35,292 32,198
Maharajpur Chhatarpur 68,111 36,099 32,012
Raipura Panna 77,591 40,086 37,505
Laundi Chhatarpur 77,939 41,725 36,214
In terms of rural population size in Rewa division, Chitrangi tahsil (330,007) has recorded the
maximum numbers and the minimum figures are observed in Kusmi (81,247) as shown in
Statement 2.50.

POPULATION SIZE AND GROWTH RATE
PROVISIONAL POPULATION TOTALS 43
Statement 2.50Top and bottom five tahsils according to rural population in Rewa division : 2011
Top five tahsils
Tahsil District Persons Males FemalesChitrangi Singrauli 330,007 170,967 159,040
Deosar Singrauli 324,398 170,630 153,768
Maihar Satna 318,665 163,858 154,807
Singrauli (Baidhan)
Singrauli 296,899 152,555 144,344
Sihawal Sidhi 268,911 136,235 132,676
Bottom five tahsils
Tahsil District Persons Males FemalesKusmi Sidhi 81,247 41,177 40,070
Kotar Satna 99,959 51,845 48,114
Churhat Sidhi 102,312 51,269 51,043
Raipur-Karchuliyan Rewa 103,305 53,233 50,072
Birsinghpur Satna 108,444 56,491 51,953
For Shahdol division, Dindori tahsil (465,848) has attained the top position and Nowrozabad
(51,884) the lowest as shown in Statement 2.51.
Statement 2.51Top and bottom five tahsils according to rural population in Shahdol division : 2011
Top five tahsils
Tahsil District Persons Males Females
Dindori Dindori 465,848 232,187 233,661
Sohagpur Shahdol 310,462 157,463 152,999
Manpur Umaria 228,810 116,761 112,049
Pushparajgarh Anuppur 221,697 110,963 110,734
Shahpura Dindori 206,042 102,629 103,413
Bottom five tahsils
Tahsil District Persons Males Females
Nowrozabad Umaria 51,884 26,299 25,585
Kotma Anuppur 58,169 29,116 29,053
Pali Umaria 72,515 36,804 35,711
Jaithari Anuppur 84,426 42,181 42,245
Chandia Umaria 88,878 45,732 43,146
In Ujjain division, the highest rural population figures are observed for Ratlam tahsil (263,024)
whereas the lowest contribution is made by Jiran (61,315) as shown in Statement 2.52.Statement 2.52Top and bottom five tahsils according to rural population in Ujjain division : 2011
Top five tahsils
Tahsil District Persons Males Females
Ratlam Ratlam 263,024 133,467 129,557
Badnagar Ujjain 233,069 119,013 114,056
Mahidpur Ujjain 217,285 111,409 105,876
Dewas Dewas 216,346 110,854 105,492
Tarana Ujjain 210,697 107,843 102,854
Bottom five tahsils
Tahsil District Persons Males Females
Jiran Neemuch 61,315 30,973 30,342
Suwasra Mandsaur 75,097 38,331 36,766
Bajna Ratlam 80,176 40,325 39,851
Rawti Ratlam 84,152 41,947 42,205
Singoli Neemuch 87,775 44,632 43,143
For Indore division, Alirajpur tahsil (412,136) shows the highest figures and Anjad (63,177) the
lowest as shown in Statement 2.53.Statement 2.53Top and bottom five tahsils according to rural population in Indore division : 2011
Top five tahsils
Tahsil District Persons Males Females
Alirajpur Alirajpur 412,136 204,412 207,724
KhandwaKhandwa (East Nimar)
357,156 183,717 173,439
Dhar Dhar 338,885 173,134 165,751
Jhabua Jhabua 286,946 143,240 143,706
Kukshi Dhar 284,566 142,654 141,912
Bottom five tahsils
Tahsil District Persons Males Females
Anjad Barwani 63,177 31,990 31,187
Hatod Indore 71,260 36,319 34,941
Thikri Barwani 72,203 37,045 35,158
Bhavra Alirajpur 80,142 39,977 40,165
SegaonKhargone (West Nimar)
83,477 42,013 41,464

44
A look at Bhopal division reveals that Narsinghgarh tahsil (235,917) is at first position in terms
of population size whereas Gulabganj (54,142) has reported the lowest population as shown
in Statement 2.54.
Statement 2.54Top and bottom five tahsils according to rural population in Bhopal division : 2011
Top five tahsils
Tahsil District Persons Males Females
Narsinghgarh Rajgarh 235,917 121,143 114,774
Berasia Bhopal 232,130 122,072 110,058
Biaora Rajgarh 221,807 114,117 107,690
Huzur Bhopal 221,676 115,645 106,031
Rajgarh Rajgarh 199,263 101,721 97,542
Bottom five tahsils
Tahsil District Persons Males Females
Gulabganj Vidisha 54,142 28,361 25,781
Tyonda Vidisha 69,084 36,507 32,577
Gyaraspur Vidisha 69,116 36,410 32,706
Budni Sehore 75,124 39,753 35,371
Rehti Sehore 79,897 41,636 38,261
For Narmadapuram division, Bhainsdehi tahsil (277,236) is at the first position according to
rural population whereas Hoshangabad (47,780) is having minimum population as shown in
Statement 2.55.
Statement 2.55Top and bottom five tahsils according to rural population in Narmadapuram division : 2011
Top five tahsils
Tahsil District Persons Males Females
Bhainsdehi Betul 277,236 140,203 137,033
Multai Betul 257,104 130,325 126,779
Betul Betul 166,114 84,761 81,353
Seoni-Malwa
Hoshangabad 156,581 81,583 74,998
Amla Betul 145,817 73,816 72,001
Bottom five tahsils
Tahsil District Persons Males Females
Hoshangabad Hoshangabad 47,780 25,196 22,584
Dolariya Hoshangabad 48,068 25,169 22,899
Timarni Harda 54,418 28,441 25,977
Khirkiya Harda 67,286 34,967 32,319
Handiya Harda 71,498 37,341 34,157
For Jabalpur division, Gadarwara tahsil (363,833) has reported the maximum rural population
whereas Tirodi (70,916) has recorded the minimum population as shown in Statement 2.56.
Statement 2.56Top and bottom five tahsils according to rural population in Jabalpur division : 2011
Top five tahsils
Tahsil District Persons Males Females
Gadarwara Narsimhapur 363,833 190,684 173,149
Bichhiya Mandla 247,815 123,506 124,309
Seoni Seoni 244,980 125,187 119,793
Baihar Balaghat 233,635 115,112 118,523
Bahoriband Katni 198,838 101,546 97,292
Bottom five tahsils
Tahsil District Persons Males Females
Tirodi Balaghat 70,916 35,138 35,778
Tendukheda Narsimhapur 81,943 42,756 39,187
Parasia Chhindwara 83,793 42,611 41,182
Dhanora Seoni 84,953 42,950 42,003
Katangi Balaghat 86,409 42,507 43,902

POPULATION SIZE AND GROWTH RATE
PROVISIONAL POPULATION TOTALS 45
2.6.4 Top and bottom five tahsils according to urban population in divisions
Proportion of urban population has been observed to be gradually increasing in the state.
Statements 2.57 to 2.68 help track the urban population figures in the top and bottom five
tahsils across the divisions.
In this regard, for Chambal division, Morena tahsil (265,313) has reported the highest urban
population and the lowest is seen in Mihona (16,943) as shown in Statement 2.57.
Statement 2.57Top and bottom five tahsils according to urban population in Chambal division : 2011
Top five tahsils
Tahsil District Persons Males Females
Morena Morena 265,313 143,689 121,624
Bhind Bhind 222,548 119,053 103,495
Gohad Bhind 86,614 47,219 39,395
Sheopur Sheopur 71,838 37,611 34,227
Lahar Bhind 64,491 34,303 30,188
Bottom five tahsils
Tahsil District Persons Males Females
Mihona Bhind 16,943 9,021 7,922
Vijaypur Sheopur 16,964 9,154 7,810
Badoda Sheopur 18,455 9,652 8,803
Gormi Bhind 20,861 11,087 9,774
Mehgaon Bhind 21,343 11,464 9,879
For Gwalior division, the maximum population is recorded in Gwalior tahsil (1,101,981) whereas
Chinour reported minimum of 9,944 as shown in Statement 2.58. Statement 2.58Top and bottom five tahsils according to urban population in Gwalior division : 2011
Top five tahsils
Tahsil District Persons Males Females
Gwalior Gwalior 1,101,981 588,752 513,229
Guna Guna 180,978 94,645 86,333
Shivpuri Shivpuri 179,972 95,227 84,745
Dabra Gwalior 141,716 76,613 65,103
Datia Datia 110,783 58,338 52,445
Bottom five tahsils
Tahsil District Persons Males Females
Chinour Gwalior 9,944 5,323 4,621
Isagarh Ashoknagar 12,585 6,636 5,949
Badarwas Shivpuri 13,567 7,022 6,545
Khaniyadhana Shivpuri 15,895 8,293 7,602
Pichhore Shivpuri 18,176 9,516 8,660
In Sagar division, Sagar tahsil (412,278) has secured the highest rank and Jabera (6,806) the
lowest as shown in Statement 2.59. Statement 2.59Top and bottom five tahsils according to urban population in Sagar division : 2011
Top five tahsils
Tahsil District Persons Males Females
Sagar Sagar 412,278 217,296 194,982
Damoh Damoh 168,974 88,093 80,881
Chhatarpur Chhatarpur 147,688 78,070 69,618
Tikamgarh Tikamgarh 98,634 51,570 47,064
Bina Sagar 78,110 40,707 37,403
Bottom five tahsils
Tahsil District Persons Males Females
Jabera Damoh 6,806 3,569 3,237
Gaurihar Chhatarpur 8,921 4,680 4,241
Baldeogarh Tikamgarh 9,081 4,837 4,244
Buxwaha Chhatarpur 10,236 5,402 4,834
Orchha Tikamgarh 11,512 6,048 5,464
Raghurajnagar tahsil (297,041) has the higest population size within Rewa division and Chitrangi
(6,533) the lowest as shown in Statement 2.60.

46
Statement 2.60Top and bottom five tahsils according to urban population in Rewa division : 2011
Top five tahsils
Tahsil District Persons Males Females
Raghurajnagar Satna 297,041 156,673 140,368
Huzur Rewa 250,313 132,427 117,886
Singrauli (Baidhan)
Singrauli 220,295 117,276 103,019
Gopadbanas Sidhi 54,317 28,581 25,736
Maihar Satna 40,078 20,856 19,222
Bottom five tahsils
Tahsil District Persons Males Females
Chitrangi Singrauli 6,533 3,457 3,076
Kotar Satna 7,508 3,813 3,695
Naigarhi Rewa 10,401 5,309 5,092
Majhauli Sidhi 11,907 6,184 5,723
Rampur Naikin Sidhi 11,922 6,094 5,828
For Shahdol division, Sohagpur tahsil (175,922) shows the highest population and the lowest
has been reported from Jaisinghnagar (8,233) as shown in Statement 2.61. Statement 2.61Top and bottom five tahsils according to urban population in Shahdol division : 2011
Top five tahsils
Tahsil District Persons Males Females
Sohagpur Shahdol 175,922 90,897 85,025
Anuppur Anuppur 126,081 65,829 60,252
Kotma Anuppur 62,406 32,328 30,078
Beohari Shahdol 35,201 18,437 16,764
Pali Umaria 34,981 18,205 16,776
Bottom five tahsils
Tahsil District Persons Males Females
Jaisinghnagar Shahdol 8,233 4,186 4,047
Jaithari Anuppur 8,391 4,368 4,023
Pushparajgarh Anuppur 8,414 4,520 3,894
Shahpura Dindori 10,990 5,646 5,344
Chandia Umaria 15,895 8,095 7,800
For Ujjain division, Ujjain tahsil (515,215) has recorded significantly high population whereas
Daloda (7,031) reported the minimum population as shown in Statement 2.62. Statement 2.62Top and bottom five tahsils according to urban population in Ujjain division : 2011
Top five tahsils
Tahsil District Persons Males Females
Ujjain Ujjain 515,215 265,291 249,924
Ratlam Ratlam 291,992 148,989 143,003
Dewas Dewas 289,438 150,193 139,245
Mandsaur Mandsaur 141,468 72,370 69,098
Neemuch Neemuch 128,575 67,566 61,009
Bottom five tahsils
Tahsil District Persons Males Females
Daloda Mandsaur 7,031 3,529 3,502
Tonk Khurd Dewas 7,960 4,101 3,859
Piploda Ratlam 8,295 4,200 4,095
Jiran Neemuch 11,518 5,812 5,706
Kalapipal Shajapur 11,716 6,099 5,617
For urban population in Indore division, Indore tahsil (2,189,534) has secured the highest rank
while Thikri (6,821) recorded the lowest rank as shown in Statement 2.63. Statement 2.63Top and bottom five tahsils according to urban population in Indore division : 2011
Top five tahsils
Tahsil District Persons Males Females
Indore Indore 2,189,534 1,140,649 1,048,885
Dhar Dhar 239,351 129,013 110,338
Burhanpur Burhanpur 230,594 118,415 112,179
KhandwaKhandwa (East Nimar)
200,681 102,873 97,808
KhargoneKhargone (West Nimar)
133,361 68,672 64,689
Bottom five tahsils
Tahsil District Persons Males Females
Thikri Barwani 6,821 3,542 3,279
Dahi Dhar 8,515 4,290 4,225
Bhavra Alirajpur 10,969 5,479 5,490
GogaonKhargone (West Nimar)
11,047 5,595 5,452
Jobat Alirajpur 11,971 6,077 5,894
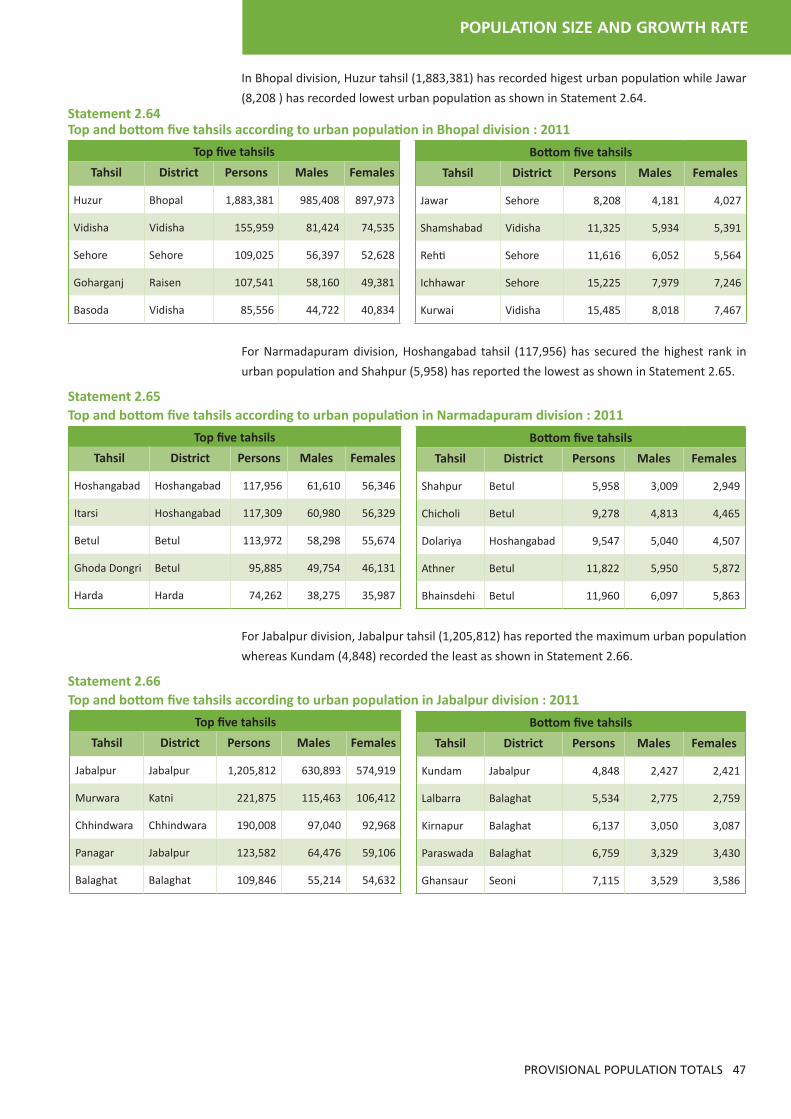
POPULATION SIZE AND GROWTH RATE
PROVISIONAL POPULATION TOTALS 47
In Bhopal division, Huzur tahsil (1,883,381) has recorded higest urban population while Jawar
(8,208 ) has recorded lowest urban population as shown in Statement 2.64. Statement 2.64Top and bottom five tahsils according to urban population in Bhopal division : 2011
Top five tahsils
Tahsil District Persons Males Females
Huzur Bhopal 1,883,381 985,408 897,973
Vidisha Vidisha 155,959 81,424 74,535
Sehore Sehore 109,025 56,397 52,628
Goharganj Raisen 107,541 58,160 49,381
Basoda Vidisha 85,556 44,722 40,834
Bottom five tahsils
Tahsil District Persons Males Females
Jawar Sehore 8,208 4,181 4,027
Shamshabad Vidisha 11,325 5,934 5,391
Rehti Sehore 11,616 6,052 5,564
Ichhawar Sehore 15,225 7,979 7,246
Kurwai Vidisha 15,485 8,018 7,467
For Narmadapuram division, Hoshangabad tahsil (117,956) has secured the highest rank in
urban population and Shahpur (5,958) has reported the lowest as shown in Statement 2.65.
Statement 2.65Top and bottom five tahsils according to urban population in Narmadapuram division : 2011
Top five tahsils
Tahsil District Persons Males Females
Hoshangabad Hoshangabad 117,956 61,610 56,346
Itarsi Hoshangabad 117,309 60,980 56,329
Betul Betul 113,972 58,298 55,674
Ghoda Dongri Betul 95,885 49,754 46,131
Harda Harda 74,262 38,275 35,987
Bottom five tahsils
Tahsil District Persons Males Females
Shahpur Betul 5,958 3,009 2,949
Chicholi Betul 9,278 4,813 4,465
Dolariya Hoshangabad 9,547 5,040 4,507
Athner Betul 11,822 5,950 5,872
Bhainsdehi Betul 11,960 6,097 5,863
For Jabalpur division, Jabalpur tahsil (1,205,812) has reported the maximum urban population
whereas Kundam (4,848) recorded the least as shown in Statement 2.66.
Statement 2.66Top and bottom five tahsils according to urban population in Jabalpur division : 2011
Top five tahsils
Tahsil District Persons Males Females
Jabalpur Jabalpur 1,205,812 630,893 574,919
Murwara Katni 221,875 115,463 106,412
Chhindwara Chhindwara 190,008 97,040 92,968
Panagar Jabalpur 123,582 64,476 59,106
Balaghat Balaghat 109,846 55,214 54,632
Bottom five tahsils
Tahsil District Persons Males Females
Kundam Jabalpur 4,848 2,427 2,421
Lalbarra Balaghat 5,534 2,775 2,759
Kirnapur Balaghat 6,137 3,050 3,087
Paraswada Balaghat 6,759 3,329 3,430
Ghansaur Seoni 7,115 3,529 3,586

48
2.6.5 Top and bottom five tahsils by percentage of rural and urban population Among the tahsils in the state which have reported the maximum percentage of rural
population include all mentioned five tahsils i.e. Beerpur, Karahal, Ater, Ron and Pohri (100%).
The tahsils where the lowest rural population percentage was calculated include Indore (8.2%),
Huzur (10.5%) and Jabalpur (11.9%) as shown in Statement 2.67.Statement 2.67 Top and bottom five tahsils by percentage of rural population : 2011
Top five tahsils
Tahsils District PercentBeerpur Sheopur 100.0
Karahal Sheopur 100.0
Ater Bhind 100.0
Ron Bhind 100.0
Pohri Shivpuri 100.0
Bottom five tahsils
Tahsils District PercentIndore Indore 8.2
Huzur Bhopal 10.5
Jabalpur Jabalpur 11.9
Ujjain Ujjain 23.4
Gwalior Gwalior 26.3
By percentage of urban population, the top ranking tahsils are reported as Indore (91.8%),
Huzur (89.5%) and Jabalpur (88.1%). On the other hand, the lowest percentage of urban
population is seen in Chitrangi (1.9%), Lalbarra (3.2%) and Kirnapur (3.5%) tahsils respectively
as shown in Statement 2.68.Statement 2.68 Top and bottom five tahsils by percentage of urban population : 2011
Top five tahsils
Tahsils District PercentIndore Indore 91.8
Huzur Bhopal 89.5
Jabalpur Jabalpur 88.1
Ujjain Ujjain 76.6
Gwalior Gwalior 73.7
Bottom five tahsils
Tahsils District PercentChitrangi Singrauli 1.9
Lalbarra Balaghat 3.2
Kirnapur Balaghat 3.5
Pushparajgarh Anuppur 3.7
Kundam Jabalpur 3.9
2.6.6 Distribution of tahsils by range of percentage of urban population to total population
Statement 2.69 strikes a relation between the number of tahsils and the corresponding range
of urban population residing in these tahsils for the years 2001 and 2011. In 2011 the maximum
number of tahsils (133) reported urban population in the range 0-9.99 percent. A similar trend
was observed in 2001 where the maximum number of tahsils (139) housed urban population in
the same range of 0-9.99 percent. The minimum number of tahsils, which stands at 3 for 2001
and 2011, correspond to urban population figures in the range of 80-99.99 percent.Statement 2.69Distribution of tahsils by range of percentage of urban population to total population : 2001 and 2011
Range of percentage of urban population No. of tahsil in 2011 No. of tahsil in 2001 0 - 9.99 133 139
10 - 19.99 100 100
20 - 39.99 70 72
40 - 59.99 32 23
60 - 79.99 4 5
80 - 99.99 3 3

POPULATION SIZE AND GROWTH RATE
PROVISIONAL POPULATION TOTALS 49
2.6.7 Tahsils with zero urban population In Statement 2.70 are mentioned 60 tahsils of the state with zero urban population, which
means that these tahsils do not have any urban population and hence treated as tahsils with
zero urban population. Statement 2.70Tahsils with zero urban population : 2011
Sl. No. Tahsil District
1 Beerpur Sheopur
2 Karahal Sheopur
3 Ater Bhind
4 Ron Bhind
5 Pohri Shivpuri
6 Mohangarh Tikamgarh
7 Gunnor Panna
8 Shahnagar Panna
9 Raipura Panna
10 Malthon Sagar
11 Kesli Sagar
12 Patera Damoh
13 Batiyagarh Damoh
14 Ramnagar Satna
15 Jawa Rewa
16 Raipur-Karchuliyan Rewa
17 Manpur Umaria
18 Bajna Ratlam
19 Rawti Ratlam
20 Ghatiya Ujjain
21 Gulana Shajapur
22 Moman Badodiya Shajapur
23 Gandhwani Dhar
24 Segaon Khargone (West Nimar)
25 Bhagwanpura Khargone (West Nimar)
26 Jhiranya Khargone (West Nimar)
27 Pati Barwani
28 Niwali Barwani
29 Varla Barwani
30 Tyonda Vidisha
Sl. No. Tahsil District
31 Nateran Vidisha
32 Gyaraspur Vidisha
33 Gulabganj Vidisha
34 Shyampur Sehore
35 Sirali Harda
36 Handiya Harda
37 Rehatgaon Harda
38 Bankhedi Hoshangabad
39 Rithi Katni
40 Badwara Katni
41 Bahoriband Katni
42 Dhimarkheda Katni
43 Narayanganj Mandla
44 Ghughari Mandla
45 Tamia Chhindwara
46 Umreth Chhindwara
47 Mohkhed Chhindwara
48 Bichhua Chhindwara
49 Dhanora Seoni
50 Kurai Seoni
51 Khairlanji Balaghat
52 Bamori Guna
53 Maksoodangarh Guna
54 Shadhora Ashoknagar*
55 Jaitpur Shahdol
56 Sihawal Sidhi
57 Kusmi Sidhi
58 Deosar Singrauli*
59 Khalwa Khandwa (East Nimar)
60 Khaknar Burhanpur*
* New districts formed after Census 2001.

50
2.7 GROWTH RATE Population growth rate is the average change in population as a result of the surplus of births
over the deaths in addition to the net migration in the country in a specified period of time.
This population growth rate is determined over a decade where the current growth rate figures
imply the change in population in the period 2001-11.
The decadal growth rate of the country is 17.6 percent where the rural growth rate is 12.2
percent while in the urban areas it is 31.8 percent. For Madhya Pradesh, the total growth rate
is 20.3 percent while the rural growth rate is pegged at 18.4 percent and the urban growth
is reported as 25.6 percent. A higher urban growth rate is indicative of an increasing trend in
urbanisation and an upward swing in migration.
The chapter gives a detailed account of the rural and urban growth rates recorded at various
levels in the state going upto the tahsil level. In addition, the growth rate of the state is
compared to the national level and to that registered by the other Empowered Action Group
States (EAG) and neighbouring states as well.
2.7.1 Growth rate of India : 2011
In Census 2011, India has registered a decadal growth of 17.6 percent. For rural areas the
growth rate is 12.2 percent whereas for urban areas it stands at 31.8 percent. This clearly
indicates a growing tendency of urbanisation during the last decade. The growth rate for all
the States/UTs in terms of rural and urban areas has been shown in the Statement 2.71 below.
Statement 2.71States/UTs with percentage decadal growth rate (persons) : 2001-11
State/ UT
code
India/State/ UTs #
Percentage decadal growth (persons)
2001-11Total Rural Urban
India 17.6 12.2 31.8
01 Jammu & Kashmir 23.7 19.8 35.7
02 Himachal Pradesh 12.8 12.5 15.6
03 Punjab 13.7 7.6 25.7
04 Chandigarh # 17.1 -68.5 26.9
05 Uttarakhand 19.2 11.3 41.9
06 Haryana 19.9 10.0 44.3
07 NCT of Delhi # 21.0 -55.6 26.6
08 Rajasthan 21.4 19.1 29.3
09 Uttar Pradesh 20.1 17.8 28.8
10 Bihar 25.1 23.9 35.1
11 Sikkim 12.4 -5.2 153.4
12 Arunachal Pradesh 25.9 22.9 37.6
13 Nagaland -0.5 -14.6 67.4
14 Manipur 18.7 10.6 42.7
15 Mizoram 22.8 18.2 27.4
16 Tripura 14.8 2.1 76.1
17 Meghalaya 27.8 27.0 31.0
State/ UT
code
India/State/ UTs #
Percentage decadal growth (persons)
2001-11Total Rural Urban
18 Assam 16.9 15.4 27.6
19 West Bengal 13.9 7.7 29.9
20 Jharkhand 22.3 19.5 32.3
21 Orissa 14.0 11.7 26.8
22 Chhattisgarh 22.6 17.8 41.8
23 Madhya Pradesh 20.3 18.4 25.6
24 Gujarat 19.2 9.2 35.8
25 Daman & Diu # 53.5 -40.2 218.4
26 Dadra & Nagar Haveli # 55.5 7.6 216.7
27 Maharashtra 16.0 10.3 23.7
28 Andhra Pradesh 11.1 1.6 36.3
29 Karnataka 15.7 7.6 31.3
30 Goa 8.2 -18.6 35.2
31 Lakshadweep # 6.2 -58.1 86.6
32 Kerala 4.9 -26.0 92.7
33 Tamil Nadu 15.6 6.5 27.2
34 Puducherry # 27.7 21.1 31.1
35 A & N Islands # 6.7 1.9 16.6
Source: Rural Urban Distribution of Population - India, Census of India 2011, #: Refers to Union Territory

POPULATION SIZE AND GROWTH RATE
PROVISIONAL POPULATION TOTALS 51
2.8 HIGHEST AND LOWEST URBAN GROWTH RATE IN STATES/UNION TERRITORIES The highest urban growth rate during the period 2001-11, among the States/UTs of India has
been recorded in Daman & Diu with 218.4 percent followed by Dadra & Nagar Haveli with
216.7 percent, Sikkim with 153.4 percent, Kerala with 92.7 percent and Lakshadweep with
86.6 percent.
The lowest urban growth rate from 2001-11, among the States and UTs of India, is recorded
for Himachal Pradesh with 15.6 percent followed by Andaman & Nicobar Islands with 16.6
percent, Maharashtra with 23.7 percent, Madhya Pradesh with 25.6 percent and Punjab with
25.7 percent as shown in Statement 2.72.Statement 2.72Highest and lowest urban growth rate in States/UTs : 2001-11
Highest urban growth rate
Name of States/UTs Growth rate
Daman & Diu # 218.4
Dadra & Nagar Haveli # 216.7
Sikkim 153.4
Kerala 92.7
Lakshadweep # 86.6
Lowest urban growth rate
Name of States/UTs Growth rate
Himachal Pradesh 15.6
A & N Islands # 16.6
Maharashtra 23.7
Madhya Pradesh 25.6
Punjab 25.7
2.9 HIGHEST AND LOWEST RURAL GROWTH RATE IN STATES/UNION TERRITORIES The highest rural growth rate during the decade 2001-11 among the States and UTs of India
is recorded in Meghalaya with 27.0 percent followed by Bihar with 23.9 percent, Arunachal
Pradesh with 22.9 percent, Puducherry with 21.1 percent and Jammu & Kashmir with 19.8
percent.
In the same decade, the lowest rural population growth rate, among the states and UTs of
India has been recorded in Chandigarh with -68.5 percent followed by Lakshadweep with -58.1
percent, NCT of Delhi with -55.6 percent, Daman & Diu with -40.2 percent and Kerala with
-26.0 percent as shown in Statement 2.73.Statement 2.73Highest and lowest rural growth rate in States/UTs : 2001-11
Highest rural growth rate
Name of States/UTs Growth rate
Meghalaya 27.0
Bihar 23.9
Arunachal Pradesh 22.9
Puducherry # 21.1
Jammu & Kashmir 19.8
Lowest rural growth rate
Name of States/UTs Growth rate
Chandigarh # -68.5
Lakshadweep # -58.1
NCT of Delhi # -55.6
Daman & Diu # -40.2
Kerala -26.0
2.10 DECENNIAL GROWTH RATE OF RURAL AND URBAN POPULATION IN MADHYA PRADESH The trend of growth rate in Madhya Pradesh has been tabulated since Census 1901. Since
1911, both the total and rural growth rates have shown a haphazard trend in which either both
have increased or decreased, thus leaving little scope to draw any concrete inference. However
the urban growth rate has shown an upward movement during the period 1921 to 1981. It is
only since 1991 that the urban growth rate has started declining thus confirming with the trend

52
of decline in population growth rate as shown in Statement 2.74 and Figure 2.31. The decline
in percentage points during the decade 1981-91 and 1991-01 for urban areas was 9.0 and 13.8
respectively and during 2001-11 this figure stands at 4.5 percent.Statement 2.74Decennial growth rate of rural and urban population in Madhya Pradesh : 1901 to 2011
Census year Total Rural Urban
1901 NA NA NA
1911 12.4 15.2 -11.8
1921 -2.4 -3.4 8.9
1931 10.2 9.0 22.6
1941 12.1 9.9 31.5
1951 8.4 4.8 34.5
1961 24.7 22.1 39.6
1971 29.3 26.3 44.3
1981 27.2 21.3 52.9
1991 27.2 22.4 43.9
2001 24.3 22.3 30.1
2011 20.3 18.4 25.6
-15
-5
5
15
25
35
45
55
1901
1911
1921
1931
1941
1951
1961
1971
1981
1991
2001
2011
Gro
wth
rate
Census year
Total Rural Urban
Fig. 2.31 Decennial growth rate in EAG states
2.11 GROWTH RATE : MADHYA PRADESH AND ITS DISTRICTSIn this chapter it is evident that the growth rate in the decade 2001-11, as compared to that
reported for the previous decade ranging 1991-01, has shown a large variation for the divisions
in the states. While analysing the district-wise data at divisional level the growth rate for
2001-11 indicates that a significant contribution to the state’s population was made by Indore
division followed by Bhopal, Gwalior, Ujjain and Jabalpur as shown in Statement 2.75.
The rural decennial growth rate, for 1991-01 and 2001-11, registered in all the districts of the
state can be studied from Statement 2.75. The rural growth rate figures reported by the state
is seen to follow a decreasing trend in 1991-01 and 2001-11 which stands at 22.3 percent
and 18.4 percent respectively. The rural growth rate for 2011 shows that Jhabua has recorded
the highest growth rate at 31.7 percent followed by Singrauli in second place reporting a
growth rate of 30.7 percent while the districts where the lowest growth rate is observed are
Mandsaur at 10.3 percent and Narsimhapur where the growth rate is pegged at 10.4 percent. It is interesting to note that only Barwani and Sheopur have retained their respective 3rd and
7th rank in Census 2011 as compared to 2001, while Jhabua which was at 36th place during
Census 2001 has jumped to the top most position in 2011.
The urban decennial growth rate recorded in 1991-01 and 2001-11 for all the districts is shown
in Statement 2.76. The urban growth rate reported by the state for 1991-01 was seen to be
30.1 percent whereas an increase is observed in 2001-11 with the current growth rate pegged
at 25.6 percent. For 2001-11 the districts registering the maximum growth rate are Raisen
which is in first position at 46.8 percent followed by Dhar in second place recording a growth
rate of 43.4 percent whereas the bottom two districts include Anuppur at 5.1 percent and
Burhanpur reporting 6.9 percent. However the top two districts for 1991-01 were seen as
Singrauli registering an urban growth of 219.4 percent and Sidhi at 139.9 percent while the
districts which recorded the lowest growth were Katni at 14.1 percent and Burhanpur at 12.2
percent. A comparison of the ranking of the districts, in terms of the decennial urban growth
rate, shows that the ranks have changed for all the districts and it is very interesting to note
that Singrauli which topped the table in Census 2001 has fallen drastically to 40th position in
Census 2011.

POPULATION SIZE AND GROWTH RATE
PROVISIONAL POPULATION TOTALS 53
Statement 2.75Ranking of districts by rural decennial growth rates : 1991-01 and 2001-11
Rank District Name 2001-11
District Name 1991-01
Rank
Madhya Pradesh 18.4 Madhya Pradesh 22.31 Jhabua 31.7 Gwalior 35.4 12 Singrauli 30.7 Bhopal 33.3 23 Barwani 27.3 Indore 31.0 34 Burhanpur 26.9 Barwani 30.8 45 Bhopal 25.8 Sehore 28.3 56 Guna 25.6 Ratlam 27.9 67 Sheopur 23.3 Sheopur 27.6 78 Umaria 23.2 Khargone
(West Nimar)27.2 8
9 Sidhi 22.7 Alirajpur 26.9 910 Shivpuri 22.6 Tikamgarh 26.7 1011 Katni 22.6 Satna 26.2 1112 Rajgarh 22.5 Morena 26.1 1213 Khargone
(West Nimar)22.1 Mandsaur 25.9 13
14 Dhar 22.0 Guna 25.8 1415 Khandwa
(East Nimar)21.8 Rajgarh 25.5 15
16 Dindori 21.3 Rewa 25.4 1617 Harda 20.8 Ujjain 25.3 1718 Tikamgarh 20.7 Shivpuri 25.2 1819 Ashoknagar 20.6 Panna 25.1 1920 Ratlam 20.4 Raisen 24.3 2021 Sehore 20.0 Dewas 24.0 2122 Shahdol 19.9 Burhanpur 23.8 2223 Morena 19.6 Sidhi 23.7 2324 Rewa 19.1 Shajapur 23.6 2425 Panna 19.0 Umaria 23.4 2526 Alirajpur 18.7 Chhatarpur 23.1 2627 Chhatarpur 18.5 Vidisha 23.1 2728 Satna 18.2 Harda 23.1 2829 Vidisha 17.2 Sagar 22.7 2930 Dewas 17.0 Katni 22.6 3031 Gwalior 16.7 Ashoknagar 22.6 3132 Sagar 16.6 Dhar 22.3 3233 Bhind 16.6 Jabalpur 21.7 3334 Seoni 16.2 Hoshangabad 21.4 3435 Shajapur 15.9 Neemuch 21.4 3536 Anuppur 15.4 Jhabua 20.7 3637 Indore 15.3 Singrauli 20.5 3738 Damoh 15.2 Narsimhapur 20.3 3839 Ujjain 15.2 Datia 19.9 3940 Mandla 15.1 Damoh 19.6 4041 Datia 14.7 Khandwa
(East Nimar)19.5 41
42 Chhindwara 13.5 Betul 18.1 4243 Hoshangabad 13.5 Shahdol 17.7 4344 Raisen 12.0 Chhindwara 15.8 4445 Balaghat 11.7 Seoni 15.4 4546 Betul 11.5 Mandla 14.1 4647 Neemuch 11.0 Dindori 13.3 4748 Jabalpur 10.6 Bhind 12.6 4849 Narsimhapur 10.4 Anuppur 10.8 4950 Mandsaur 10.3 Balaghat 5.5 50
5.5
24.0
15.8
22.7
25.2
18.1
23.1
27.2
24.3
22.3 15.4
26.2
14.1
19.6
19.5
23.1
25.8
25.4
31
25.1
21.4
28.3
27.6
25.3
25.523.6
20.5
26.1
13.3
25.9
31.4
26.7
17.7
27.9
20.3
21.7
22.6
22.6
12.6
23.7
23.4
21.4
35.4
10.8
20.7
26.9
23.8
23.1
19.9
33.3
12.0
22.017.0
13.5
19.0
20.0
16.6
22.6
11.511.7
18.5
22.1
11.0
16.2
18.2
15.1
15.2
21.8
17.2
25.6
19.1
13.5
23.3
15.2
22.515.9
30.7
19.6
21.3
10.3
27.3
20.7
19.9
20.4
10.4
10.6
20.6
22.6
16.6
22.7
23.2
16.7
15.4
15.331.7
18.7
26.9
20.8
14.7
25.8
PERCENTAGE INCREASE
30.1 AND ABOVE
25.1 - 30.0
20.1 - 25.0
15.1 - 20.0
15.0 AND BELOW
DECADAL GROWTH OF RURAL POPULATION : 1991-2001 AND 2001-2011
1991-2001
2001-2011

54
Statement 2.76Ranking of districts by urban decennial growth rates : 1991-01 and 2001-11
Rank District Name 2001-11
District Name 1991-01
Rank
Madhya Pradesh 25.6 Madhya Pradesh 30.11 Raisen 46.8 Singrauli 219.4 12 Dhar 43.4 Sidhi 139.9 23 Mandla 41.7 Dhar 60.4 34 Indore 40.1 Raisen 50.1 45 Morena 37.0 Anuppur 49.8 56 Seoni 35.8 Balaghat 49.5 67 Sidhi 35.5 Guna 45.8 78 Narsimhapur 33.0 Chhatarpur 45.1 89 Umaria 32.9 Sheopur 42.1 9
10 Ashoknagar 32.7 Shivpuri 39.3 1011 Datia 32.4 Bhopal 37.2 1112 Guna 30.9 Indore 35.8 1213 Vidisha 30.4 Rewa 35.4 1314 Gwalior 29.5 Bhind 35.0 1415 Bhopal 29.1 Dewas 33.9 1516 Barwani 29.1 Tikamgarh 33.8 1617 Alirajpur 28.5 Vidisha 33.5 1718 Sehore 28.2 Satna 33.3 1819 Bhind 27.7 Khargone
(West Nimar)31.3 19
20 Rajgarh 27.3 Narsimhapur 31.1 2021 Khargone
(West Nimar)27.0 Shajapur 30.8 21
22 Balaghat 26.2 Datia 30.5 2223 Dewas 26.1 Harda 30.4 2324 Mandsaur 25.7 Rajgarh 30.3 2425 Rewa 23.4 Sehore 28.0 2526 Shivpuri 23.3 Seoni 27.3 2627 Chhatarpur 23.1 Jhabua 26.6 2728 Satna 23.0 Ashoknagar 26.4 2829 Shajapur 22.6 Barwani 25.5 2930 Damoh 22.5 Damoh 25.4 3031 Sheopur 21.1 Chhindwara 24.8 3132 Neemuch 20.8 Hoshangabad 24.3 3233 Dindori 20.3 Sagar 22.8 3334 Jhabua 20.1 Khandwa
(East Nimar)22.2 34
35 Sagar 20.0 Jabalpur 21.6 3536 Khandwa
(East Nimar)19.9 Neemuch 21.3 36
37 Betul 19.3 Ujjain 21.2 3738 Ratlam 18.0 Mandla 21.0 3839 Harda 18.0 Gwalior 20.8 3940 Singrauli 17.9 Shahdol 20.8 4041 Ujjain 17.5 Panna 20.8 4142 Tikamgarh 17.4 Ratlam 19.0 4243 Jabalpur 17.2 Morena 19.0 4344 Katni 17.0 Umaria 18.9 4445 Hoshangabad 16.6 Alirajpur 18.2 4546 Panna 15.8 Betul 17.8 4647 Chhindwara 11.7 Dindori 16.3 4748 Shahdol 8.2 Mandsaur 15.0 4849 Burhanpur 6.9 Katni 14.1 4950 Anuppur 5.1 Burhanpur 12.2 50
21.0
24.8
28.0
22.8
39.3
17.8
19.0
15.0
49.5
19.0
45.1
31.3
35.0
50.1
60.4 27.3
33.3
25.4
22.2
33.9
33.5
45.8
35.4
20.8
24.3
42.1
21.2
30.3
30.8
16.3
22.4
33.8
20.8
31.1
21.6
26.4
14.118.9
21.3219.4
20.8
49.8
35.826.6
139.9
18.2
12.2
30.4
30.5
37.2
20.0
27.0
23.0
11.7
23.3
19.3
37.0
26.2
18.0
23.1
33.0
17.0
46.8
43.4 35.8
41.7
22.5
19.9
26.1
30.48.2
30.9
23.4
15.8
16.6
28.2
21.1
17.5
27.3
5.1
22.6
17.9
18.0
20.3
25.7
29.1
17.4
17.2
32.7
6.9
27.7
35.5
32.9
20.8
29.5
40.120.1
28.5
32.4
29.1
PERCENTAGE INCREASE
35.1 AND ABOVE
30.1 - 35.0
25.1 - 30.0
20.1 - 25.0
20.0 AND BELOW
DECADAL GROWTH OF URBAN POPULATION : 1991-2001 AND 2001-2011
2001-2011
1991-2001

POPULATION SIZE AND GROWTH RATE
PROVISIONAL POPULATION TOTALS 55
2.11.1 Distribution of districts by ranges of percentage decadal growth : 2001-11The population growth rate for 2001-11 in relation to the number of districts in the rural-
urban areas along with the population distribution is shown in Statement 2.77. The number
of districts (50) is the same in the rural and urban areas though the rural population stands
at 52,537,899 whereas the urban population is pegged at 20,059,666. In the rural areas, the
maximum number of districts (29), where 61.3 percent of the rural population resides, has
registered population growth rates in the range 10.00-19.99. In the urban areas, the maximum
number of districts (22) housing 44.7 percent of the urban population corresponds to growth
rate figures in the range 20.00-29.99.
Statement 2.77Distribution of districts by ranges of percentage decadal growth : 2001-11
Ranges Rural Urban
No. of district Population No. of district PopulationAbsolute Percent Absolute Percent
Total 50 52,537,899 100.0 50 20,059,666 100.0<10.00 0 0 0.0 3 684,917 3.4
10.00-19.99 29 32,232,040 61.3 12 5,100,989 25.420.00-29.99 19 18,422,469 35.1 22 8,972,792 44.730.00-39.99 2 1,883,390 3.6 9 2,029,831 10.240.00-49.99 0 0 0.0 4 3,271,137 16.3
50.00 + 0 0 0.0 0 0 0.0
2.11.2 Growth rate in EAG states As far as rural growth rate is concerned among EAG states, Bihar has reported the maximum
population growth rate of 23.9 percent whereas the lowest growth rate of 11.3 percent was
seen in Uttarakhand. It has been observed that the rural growth rates for both Orissa (11.7
percent) and Uttarakhand (11.3 percent) are lower than the national average of 12.2 percent.
Madhya Pradesh, on the other hand, has attained the fourth position among the EAG states by
recording a growth rate of 18.4 percent.
In the context of urban areas, Uttarakhand with 41.9 percent has secured the highest growth
rate while the lowest has been reported from Madhya Pradesh at 25.6 percent. The states
which have recorded urban growth rate figures lower than the national average of 31.8 percent
are Madhya Pradesh (25.6 percent), Orissa (26.8 percent), Uttar Pradesh (28.8 percent) and
Rajasthan (29.3 percent) as shown in Statement 2.78 and Figure 2.32.
Statement 2.78Growth rate in EAG states : 2011
India/State/ Union Territory
Percentage decadal growth (persons) 2001-11
Total Rural Urban
India 17.6 12.2 31.8
Bihar 25.1 23.9 35.1
Chhattisgarh 22.6 17.8 41.8
Jharkhand 22.3 19.5 32.3
Rajasthan 21.4 19.1 29.3
Madhya Pradesh 20.3 18.4 25.6
Uttar Pradesh 20.1 17.8 28.8
Uttarakhand 19.2 11.3 41.9
Orissa 14.0 11.7 26.8
Fig. 2.32 Growth rate in EAG states
5
15
25
35
45
Biha
r
Chha
ttis
garh
Jhar
khan
d
Raja
stha
n
Mad
hya
Prad
esh
Utt
ar P
rade
sh
Utt
arak
hand
Ori
ssa
Gro
wth
rate
EAG states
Rural Urban

56
2.11.3 Urban and rural growth rate in neighbouring states of Madhya Pradesh From the perspective of decadal growth rate in rural areas, Rajasthan has secured the first
position by charting a growth rate of 19.1 percent followed by Madhya Pradesh with 18.4
percent. The states with lower rural growth rate are Maharashtra with 10.3 percent and
Gujarat with 9.2 percent. In the urban areas, Chhattisgarh has recorded a significant growth
rate of 41.8 percent followed by Gujarat with 35.8 percent; whereas Madhya Pradesh with
25.6 percent and Maharashtra with 23.7 percent have reported lower figures as shown in
Statement 2.79 and Figure. 2.33.
Statement 2.79Growth rate in neighbouring states of Madhya Pradesh : 2011
5
15
25
35
45
Chha
ttis
garh
Raja
stha
n
Mad
hya
Prad
esh
Utt
ar
Prad
esh
Guj
arat
Mah
aras
htra
Gro
wth
rate
Madhya Pradesh and neighbouring states
Rural Urban
Madhya Pradesh and neighbouring
states
Percentage decadal growth (persons) 2001-11
Total Rural Urban
India 17.6 12.2 31.8
Chhattisgarh 22.6 17.8 41.8
Rajasthan 21.4 19.1 29.3
Madhya Pradesh 20.3 18.4 25.6
Uttar Pradesh 20.1 17.8 28.8
Gujarat 19.2 9.2 35.8
Maharashtra 16.0 10.3 23.7
Fig. 2.33 Growth rate in neighbouring states
2.11.4 Top and bottom five districts by growth rate : 2011Madhya Pradesh has witnessed a total growth rate of 20.3 percent in the decade 2001-11. The
highest growth rate can be attributed to Indore district which has recorded a growth of 32.7
percent followed by Jhabua with 30.6 percent.
Across all the districts of the state, the lowest population growth rate has been registered in
Annupur district with 12.3 percent followed by Betul with 12.9 percent growth as shown in
Statement 2.80.
Statement 2.80Top and bottom five districts by growth rate : 2011
Top five districts
District Division Growth rateIndore Indore 32.7
Jhabua Indore 30.6
Bhopal Bhopal 28.5
Singrauli Rewa 28.0
Barwani Indore 27.5
Botom five districts
District Division Growth rateAnuppur Shahdol 12.3
Betul Narmadapuram 12.9
Chhindwara Jabalpur 13.0
Mandsaur Ujjain 13.2
Balaghat Jabalpur 13.6
2.11.5 Top and bottom five districts by growth rate in rural areas : 2011For 2001-11, Madhya Pradesh has reported a rural growth rate of 18.4 percent. The maximum
growth rate has been observed in Jhabua district at 31.7 percent followed by Singrauli with 30.7
percent; while on the other hand the lowest rural growth rate figures have been registered in
Mandsaur district with 10.3 percent and Narsimhapur with 10.4 percent as shown in Statement
2.81.

POPULATION SIZE AND GROWTH RATE
PROVISIONAL POPULATION TOTALS 57
Statement 2.81Top and bottom five districts by growth rate in rural areas : 2011
Top five districts
District Division Growth rateJhabua Indore 31.7
Singrauli Rewa 30.7
Barwani Indore 27.3
Burhanpur Indore 26.9
Bhopal Bhopal 25.8
Bottom five districts
District Division Growth rateMandsaur Ujjain 10.3
Narsimhapur Jabalpur 10.4
Jabalpur Jabalpur 10.6
Neemuch Ujjain 11.0
Betul Narmadapuram 11.5
2.11.6 Top and Bottom five districts by growth rate in urban areas
The urban growth registered in Madhya Pradesh is 25.6 percent for the latest decade 2001-11.
The highest urban growth rate of 46.8 percent has been recorded in Raisen district followed by
Dhar district with 43.4 percent growth rate.
The lowest growth rate has been observed in Anuppur of 5.1 percent followed by Burhanpur
district which contributed 6.9 percent to the population growth in urban areas as shown in
Statement 2.82
Statement 2.82Top and bottom five districts by growth rate in urban areas : 2011
Top five districts
District Division Growth rateRaisen Bhopal 46.8
Dhar Indore 43.4
Mandla Jabalpur 41.7
Indore Indore 40.1
Morena Chambal 37.0
Bottom five districts
District Division Growth rateAnuppur Shahdol 5.1
Burhanpur Indore 6.9
Shahdol Shahdol 8.2
Chhindwara Jabalpur 11.7
Panna Sagar 15.8
2.12 URBAN AGGLOMERATION BY GROWTH RATE 2.12.1 Top and bottom five U.As. having population equal to or greater than one lakh by growth rate in Madhya Pradesh
The top five UAs by growth rate in Madhya Pradesh are Indore with 42.9 percent followed
by Chhatarpur with 35.4 percent, Bhopal with 29.1 percent, Khargone with 28.9 percent and
Gwalior with 27.3 percent is in fifth position as shown in Statement 2.83.
The bottom five UAs in terms of growth rate are Itarsi with 6.1 percent followed by Neemuch
with 13.9 percent, Damoh with 15.3 percent, Jabalpur with 15.4 percent and Ratlam with 16.8
percent, as shown in Statement 2.83.Statement 2.83Top and bottom five U.As. by growth rate in Madhya Pradesh : 2011
Top five UAs
U.A Division Growth rateIndore (U.A.) Indore 42.9
Chhatarpur (U.A.) Chhatarpur 35.4
Bhopal (U.A.) Bhopal 29.1
Khargone (U.A.) Khargone (West Nimar)
28.9
Gwalior (U.A.) Gwalior 27.3
Bottom five UAs
U.A Division Growth rateItarsi (U.A.) Hoshangabad 6.1
Neemuch (U.A.) Neemuch 13.9
Damoh (U.A.) Damoh 15.3
Jabalpur (U.A.) Jabalpur 15.4
Ratlam (U.A.) Ratlam 16.8

58
GUNAASHOKNAGAR
SAGARRAJGARH
RAISEN
CHHATARPUR
DAMOH
JABALPUR
PANNA
MORENA
SHEOPUR
BHIND
GWALIOR
DATIA
SHIVPURI
SATNA
REWA
SIDHI SINGRAULI
KATNI
UMARIASHAHDOL
ANUPPUR
MANDLA
DINDORI
BALAGHAT
HOSHANGABAD
NARSIMHAPUR
SEONICHHINDWARA
VIDISHA
BETUL
HARDAALIRAJPUR
JHABUA
DHAR
(WEST NIMAR)(EAST NIMAR)
INDOREDEWAS
UJJAINRATLAM
NEEMUCH
MANDSAUR
SHAJAPUR
SEHORE
TIKAMGARH
BARWANI
BURHANPUR
BHOPAL
KHARGONEKHANDWA
12.0
22.0 17.0
13.5
19.0
20.0
16.6
22.6
11.511.7
18.5
22.1
11.0
16.2
18.2
15.1
15.2
21.8
17.2
25.6
19.1
13.5
23.3
15.2
22.5
15.9
30.7
19.6
21.3
10.3
27.3
20.7
19.9
20.4
10.4
10.6
20.6
22.6
16.6
22.7
23.2
16.7
15.4
15.331.7
18.7
26.9
20.8
14.7
25.8
40 0 12040 80
KILOMETRES
MADHYA PRADESH
RA
J
A
S
T
H
A
NU T
TA
R
P RA
DE
SH
GU
JA
RA
T
M
AH
A RA
SH T
R A
CH
HA
TT
IS
GA
RH
INDIA
BOUNDARIES : - STATE..............................
DISTRICT.........................
DIVISION.........................
DECADAL GROWTH OF RURAL POPULATION 2001-2011
PERCENTAGE INCREASE
30.1 AND ABOVE
25.1 - 30.0
20.1 - 25.0
15.1 - 20.0 State 18.4
15.0 AND BELOW
GUNA
ASHOKNAGAR
SAGARRAJGARH
RAISEN
CHHATARPUR
DAMOH
JABALPUR
PANNA
MORENA
SHEOPUR
BHIND
GWALIORDATIA
SHIVPURI
SATNA
REWA
SIDHI SINGRAULI
KATNI
UMARIASHAHDOL
ANUPPUR
MANDLA
DINDORI
BALAGHAT
HOSHANGABAD
NARSIMHAPUR
SEONICHHINDWARA
VIDISHA
BETUL
HARDAALIRAJPUR
JHABUA
DHAR
(WEST NIMAR)(EAST NIMAR)
INDORE DEWAS
UJJAINRATLAM
NEEMUCH
MANDSAUR
SHAJAPUR
SEHORE
TIKAMGARH
BARWANI
BURHANPUR
BHOPAL
KHARGONEKHANDWA
20.0
27.0
23.0
11.7
23.3
19.3
37.0
26.2
18.0
23.1
33.0
17.0
46.8
43.435.8
41.7
22.5
19.9
26.1
30.4
8.2
30.9
23.4
15.8
16.6
28.2
21.1
17.5
27.3
5.122.6
17.9
18.0
20.3
25.7
29.1
17.4
17.2
32.7
6.9
27.7
35.5
32.9
20.8
29.5
40.120.1
28.5
32.4
29.1
40 0 12040 80
KILOMETRES
MADHYA PRADESH
RA
J
A
S
T
H
A
NU T
TA
R
P RA
DE
SH
GU
JA
RA
T
M
AH
A RA
SH T
R A
CH
HA
TT
IS
GA
RH
INDIA
BOUNDARIES : - STATE..............................
DISTRICT.........................
DIVISION.........................
DECADAL GROWTH OF URBAN POPULATION 2001-2011
PERCENTAGE INCREASE
35.1 AND ABOVE
30.1 - 35.0
25.1 - 30.0 State 25.6
20.1 - 25.0
20.0 AND BELOW
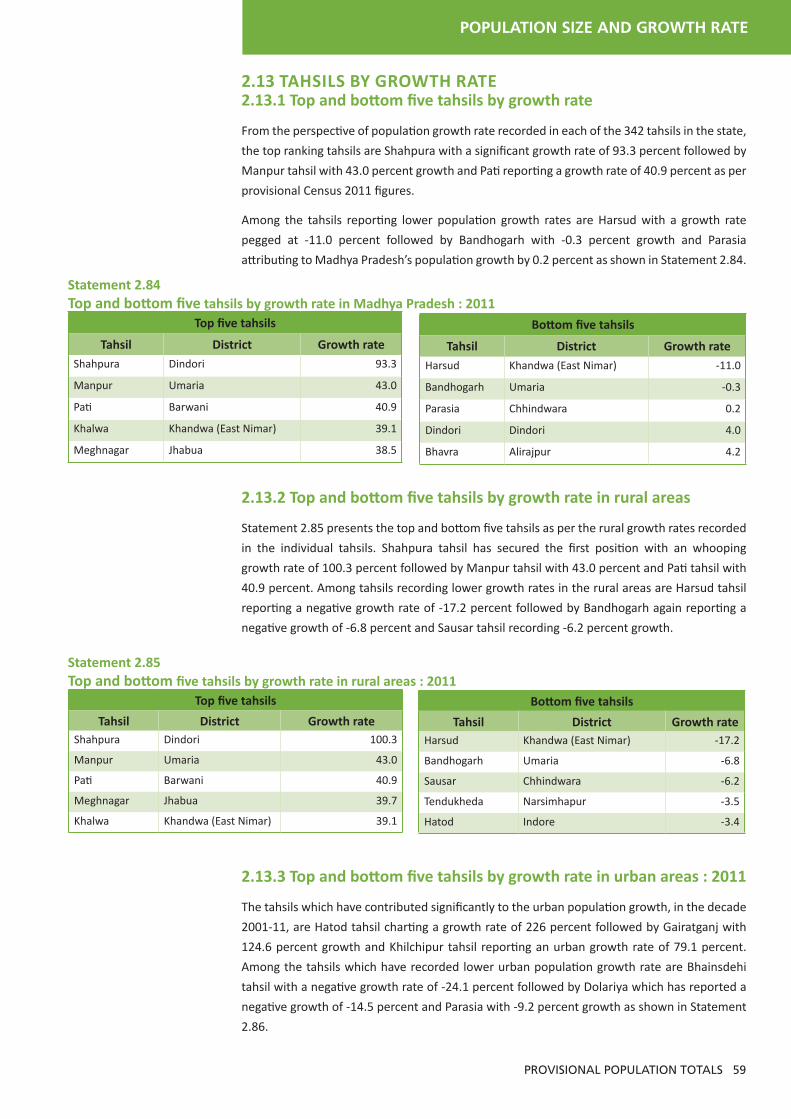
POPULATION SIZE AND GROWTH RATE
PROVISIONAL POPULATION TOTALS 59
2.13 TAHSILS BY GROWTH RATE 2.13.1 Top and bottom five tahsils by growth rate
From the perspective of population growth rate recorded in each of the 342 tahsils in the state,
the top ranking tahsils are Shahpura with a significant growth rate of 93.3 percent followed by
Manpur tahsil with 43.0 percent growth and Pati reporting a growth rate of 40.9 percent as per
provisional Census 2011 figures.
Among the tahsils reporting lower population growth rates are Harsud with a growth rate
pegged at -11.0 percent followed by Bandhogarh with -0.3 percent growth and Parasia
attributing to Madhya Pradesh’s population growth by 0.2 percent as shown in Statement 2.84.
Statement 2.84Top and bottom five tahsils by growth rate in Madhya Pradesh : 2011
Top five tahsils
Tahsil District Growth rateShahpura Dindori 93.3
Manpur Umaria 43.0
Pati Barwani 40.9
Khalwa Khandwa (East Nimar) 39.1
Meghnagar Jhabua 38.5
Bottom five tahsils
Tahsil District Growth rateHarsud Khandwa (East Nimar) -11.0
Bandhogarh Umaria -0.3
Parasia Chhindwara 0.2
Dindori Dindori 4.0
Bhavra Alirajpur 4.2
2.13.2 Top and bottom five tahsils by growth rate in rural areas
Statement 2.85 presents the top and bottom five tahsils as per the rural growth rates recorded
in the individual tahsils. Shahpura tahsil has secured the first position with an whooping
growth rate of 100.3 percent followed by Manpur tahsil with 43.0 percent and Pati tahsil with
40.9 percent. Among tahsils recording lower growth rates in the rural areas are Harsud tahsil
reporting a negative growth rate of -17.2 percent followed by Bandhogarh again reporting a
negative growth of -6.8 percent and Sausar tahsil recording -6.2 percent growth.
Statement 2.85Top and bottom five tahsils by growth rate in rural areas : 2011
Top five tahsils
Tahsil District Growth rateShahpura Dindori 100.3
Manpur Umaria 43.0
Pati Barwani 40.9
Meghnagar Jhabua 39.7
Khalwa Khandwa (East Nimar) 39.1
Bottom five tahsils
Tahsil District Growth rateHarsud Khandwa (East Nimar) -17.2
Bandhogarh Umaria -6.8
Sausar Chhindwara -6.2
Tendukheda Narsimhapur -3.5
Hatod Indore -3.4
2.13.3 Top and bottom five tahsils by growth rate in urban areas : 2011
The tahsils which have contributed significantly to the urban population growth, in the decade
2001-11, are Hatod tahsil charting a growth rate of 226 percent followed by Gairatganj with
124.6 percent growth and Khilchipur tahsil reporting an urban growth rate of 79.1 percent.
Among the tahsils which have recorded lower urban population growth rate are Bhainsdehi
tahsil with a negative growth rate of -24.1 percent followed by Dolariya which has reported a
negative growth of -14.5 percent and Parasia with -9.2 percent growth as shown in Statement
2.86.

60
Statement 2.86Top and bottom five tahsils by growth rate in urban areas : 2011
Top five tahsils
Tahsil District Growth rateHatod Indore 226.0
Gairatganj Raisen 124.6
Khilchipur Rajgarh 79.1
Rajpur Barwani 73.2
Bhanpura Mandsaur 70.8
Bottom five tahsils
Tahsil District Growth rateBhainsdehi Betul -24.1
Dolariya Hoshangabad -14.5
Parasia Chhindwara -9.2
Chitrangi Singrauli -8.5
Nepanagar Burhanpur -6.2
2.13.4 Distribution of tahsils by ranges of percentage decadal growth : 2011
Total number of tahsils is 342 out of which 282 tahsils have urban areas though the population
in the rural areas is almost two and a half times that in urban areas and stands at 52,537,899
while in urban areas the same stands at 20,059,666. In the rural areas, the maximum number
of tahsils (37) corresponds to the growth rate range of less than 10.00 and such tahsils house
10.0 percent of the rural population. The data from the urban area reveals that the maximum
number of tahsils (112), where 29.7 percent of the urban population resides, has registered
a growth rate in the range 10.00-19.99. Statement 2.87 establishes a linkage between the
number of tahsils, rural-urban population distribution and the corresponding growth rate
range.
Statement 2.87Distribution of tahsils by ranges of percentage decadal growth : 2011
Note : 1. The population figures for Census 2001 have been recast as per Census 2011 jurisdiction of the districts/tahsils.
2. Out of 342 tahsils of Census 2011, there is no urban population in 60 tahsils.
3. There were no urban population in 21 recast tahsils of Census 2001, hence growth rate for 21 tahsils have not been calculated.
Ranges Rural UrbanNo. of tahsil Population No. of tahsil Population
Absolute Percent Absolute Percent
Total 342 52,537,899 100.0 261 20,059,666 100
<10.00 37 5,270,137 10.0 35 1,651,600 8.2
10.00-19.99 174 24,863,767 47.3 112 5,959,100 29.7
20.00-29.99 109 18,673,416 35.5 68 7,415,966 37.0
30.00-39.99 19 3,133,307 6.0 21 1,072,714 5.3
40.00-49.99 2 391,230 0.7 10 2,632,182 13.1
50.00 + 1 206,042 0.4 15 1,112,154 5.5
2.14 GROWTH RATE OF TOWNS IN MADHYA PRADESH2.14.1 Growth rate of Municipal Corporations (M. Corp.) in Madhya Pradesh
Indore (M.Corp) with 32.9 percent has secured the first place, followed by Rewa (M.Corp.) with
28.5 percent growth and Gwalior (M.Corp.) reporting a growth rate of 27.4 percent. Dewas
(M.Corp.) and Bhopal (M.Corp.) with 24.9 percent share the same growth rate. Murwara
(M.Corp.) with 18.6 percent is 5th from the bottom and Sagar (M.Corp.) is next with 17.8
percent in the table. The last three (M.Corp.) are Khandwa (M.Corp.) with 16.5 percent, Jabalpur
(M.Corp.) with 13.1 percent and Burhanpur (M.Corp.) with 8.9 percent is at the bottom most
position as shown in Statement 2.88.

POPULATION SIZE AND GROWTH RATE
PROVISIONAL POPULATION TOTALS 61
Statement 2.88Growth rate of Muncipal Corporations : 2011
Municipal Corporation Growth rate Municipal Corporation Growth rateIndore (M.Corp.) 32.9 Ratlam (M.Corp.) 19.2
Rewa (M.Corp.) 28.5 Singrauli (M.Corp.) 19.0
Gwalior (M.Corp.) 27.4 Murwara (Katni) (M.Corp.) 18.6
Bhopal (M.Corp.) 24.9 Sagar (M.Corp.) 17.8
Dewas (M.Corp.) 24.9 Khandwa (M.Corp.) 16.5
Satna (M.Corp.) 24.3 Jabalpur (M.Corp.) 13.1
Ujjain (M.Corp.) 19.7 Burhanpur (M.Corp.) 8.9
2.14.2 Top and bottom five Municipalities in Madhya Pradesh having population equal to or greater than one lakh by growth rate
As per the provisional Census 2011 figures, the top and the bottom five municipalities have
shown a large gap in terms of population growth rate. Pithampur (M) stands on top recording
a overwhelming growth of 85.2 percent and Morena (M) with 32.8 percent secured the second
position followed closely by Guna (M) with 31.9 percent, Chhatarpur (M) with 31.5 percent and
Bhind (M) with 28.3 percent growth rates at 3rd, 4th and 5th place respectively.
Nagda (M) with a meagre growth rate of 3.6 percent is at the bottom followed by Damoh
(M) with 11.4 percent, Chhindwara (M) with 13.1 percent, Seoni (M) with 14.0 percent and
Neemuch (M) with a comparatively higher growth rate of 15.9 percent in Madhya Pradesh, as
shown in Statement 2.89Statement 2.89Top and bottom five Municipalities by growth rate : 2011
Top five municipalities
Municipality District Growth ratePithampur (M) Dhar 85.2
Morena (M) Morena 32.8
Guna (M) Guna 31.9
Chhatarpur (M) Chhatarpur 31.5
Bhind (M) Bhind 28.3
Bottom five municipalities
Municipality District Growth rateNagda (M) Ujjain 3.6
Damoh (M) Damoh 11.4
Chhindwara (M) Chhindwara 13.1
Seoni (M) Seoni 14.0
Neemuch (M) Neemuch 15.9
2.15 GROWTH RATE IN DIVISIONS OF MADHYA PRADESHThe total population growth rate in Madhya Pradesh as per provisional Census 2011 figures is
20.3 percent. As shown in Statement 2.93 Indore division has recorded the maximum growth
rate of 26.3 percent followed by Gwalior division with 23.5 percent and Bhopal with 23.0
percent. Ujjain divison with 16.8 percent, Narmadapuram with 14.6 percent and Jabalpur
reporting 15.5 percent are at the bottom.
Rural areas in Madhya Pradesh attributed 18.4 percent growth rate to the rural population.
Indore division with 23.0 percent growth is at the top followed by Rewa division with 21.2
percent and Gwalior recording 20.7 percent growth rate. The bottom three divsions in the
same category include Chambal with 19.1 percent growth, Bhopal with 18.7 percent and Sagar
contributing 17.9 percent growth.
Urban population growth rate of 25.6 percent has shown the maximum increase as compared
to the respective growth rate of total and rural population for Census 2011. Indore division has
shown the highest growth of 33.9 percent followed by Chambal division with 31.1 percent and

62
Bhopal division charting a growth of 30.6 percent. The divisions which have recorded lower
urban growth rate are Shahdol 11.7 percent growth rate, Narmadapuram 17.8 percent and
Jabalpur 19.7 percent as shown in Statement 2.90 and Figure 2.34.
Statement 2.90Divisions of Madhya Pradesh by growth rate : 2011
Division Name Total Rural Urban
Madhya Pradesh 20.3 18.4 25.6
Indore 26.3 23.0 33.9
Gwalior 23.5 20.7 29.3
Bhopal 23.0 18.7 30.6
Chambal 21.7 19.1 31.1
Rewa 21.5 21.2 23.0
Sagar 18.5 17.9 20.4
Shahdol 18.3 19.9 11.7
Ujjain 16.8 15.2 20.9
Jabalpur 15.5 14.1 19.7
Narmadapuram 14.6 13.7 17.8
10
20
30
40
Indo
re
Gw
alio
r
Bhop
al
Cham
bal
Rew
a
Mad
hya
Prad
esh
Saga
r
Shah
dol
Ujja
in
Jaba
lpur
Nar
mad
apur
am
Gro
wth
rate
Divisions
Rural Urban
Fig. 2.34 Division-wise decadal growth rate
2.15.1 District-wise growth rate within divisions of Madhya Pradesh : 2011
As per provisional Census 2011 figures, the growth rate for Madhya Pradesh is 20.3 percent
with the rural growth rate pegged at 18.4 percent and the urban growth rate is reported as
25.6 percent. Statements 2.94 to 2.103 provide an outline of the total, rural and urban growth
rates in each district of the state as per their respective divisions.
For Chambal division the rural growth rate is 19.1 percent while the urban growth rate is 31.1
percent. Sheopur (23.3%) has reported the highest rural growth rate whereas Bhind (16.6%)
has registered the lowest. In terms of urban growth rate figures, the maximum growth is in
Morena (31.1%) while the minimum is reported from Sheopur (21.1%) as shown in Statement
2.91 and Figure 2.35.
Statement 2.91Growth rate in Chambal division : 2011
Division and District
Total Rural Urban
Chambal Division 21.7 19.1 31.1
Morena 23.4 19.6 37.0
Sheopur 23.0 23.3 21.1
Bhind 19.3 16.6 27.7
10
20
30
40
Cham
bal
Div
isio
n
Mor
ena
Sheo
pur
Bhin
d
Gro
wth
rat
e
Districts
Rural Urban
10
20
30
40
Cham
bal
Div
isio
n
Mor
ena
Sheo
pur
Bhin
d
Gro
wth
rat
e
Districts
Rural Urban
10
20
30
40
Cham
bal
Div
isio
n
Mor
ena
Sheo
pur
Bhin
d
Gro
wth
rat
e
Districts
Rural Urban
10
20
30
40
Cham
bal
Div
isio
n
Mor
ena
Sheo
pur
Bhin
d
Fig. 2.35 Growth rate in Chambal division

POPULATION SIZE AND GROWTH RATE
PROVISIONAL POPULATION TOTALS 63
Gwalior division has reported a rural growth rate of 20.7 percent and an urban growth rate of
29.3 percent. The highest rural growth rate is registered in Guna (25.6%) while the lowest is
seen in Datia (14.7%). The urban growth rate figures reveal that Ashoknagar (32.7%) is in first
place and Shivpuri (23.3%) is in last position as shown in Statement 2.92 and Figure 2.36.
Statement 2.92Growth rate in Gwalior division : 2011
Division and District
Total Rural Urban
Gwalior Division 23.5 20.7 29.3
Guna 26.9 25.6 30.9
Gwalior 24.4 16.7 29.5
Shivpuri 22.7 22.6 23.3
Ashoknagar 22.6 20.6 32.7
Datia 18.4 14.7 32.4
10
20
30
40
Gw
alio
rD
ivis
ion
Gun
a
Gw
alio
r
Shiv
puri
Ash
okna
gar
Dat
ia
10
20
30
40
Cham
bal
Div
isio
n
Mor
ena
Sheo
pur
Bhin
d
Gro
wth
rat
e
Districts
Rural Urban
10
20
30
40
Cham
bal
Div
isio
n
Mor
ena
Sheo
pur
Bhin
d
Gro
wth
rat
e
Districts
Rural Urban
10
20
30
40
Cham
bal
Div
isio
n
Mor
ena
Sheo
pur
Bhin
d
Gro
wth
rat
e
Districts
Rural UrbanFig. 2.36 Growth rate in Gwalior division
In case of Sagar division, the rural growth rate stands at 17.9 percent whereas the urban growth
rate is 20.4 percent. Tikamgarh (20.7%) is seen in first place in regard to rural growth rate
while Damoh (15.2%) is in last position. From the perspective of urban growth rate, Chhatarpur
(23.1%) has registered the maximum growth whereas the lowest is seen in Panna (15.8%) as
shown in Statement 2.93 and Figure 2.37.
Statement 2.93Growth rate in Sagar division : 2011
Division and District
Total Rural Urban
Sagar Division 18.5 17.9 20.4
Tikamgarh 20.1 20.7 17.4
Chhatarpur 19.5 18.5 23.1
Panna 18.6 19.0 15.8
Sagar 17.6 16.6 20.0
Damoh 16.6 15.2 22.5
10
15
20
25
S
agar
Div
isio
n
Tika
mga
rh
Chha
tarp
ur
Pann
a
Saga
r
Dam
oh
10
20
30
40
Cham
bal
Div
isio
n
Mor
ena
Sheo
pur
Bhin
d
Gro
wth
rat
e
Districts
Rural Urban
10
20
30
40
Cham
bal
Div
isio
n
Mor
ena
Sheo
pur
Bhin
d
Gro
wth
rat
e
Districts
Rural Urban
10
20
30
40
Cham
bal
Div
isio
n
Mor
ena
Sheo
pur
Bhin
d
Gro
wth
rat
e
Districts
Rural Urban
Fig. 2.37 Growth rate in Sagar division
For Rewa division, the rural growth rate is seen to be 21.2 percent and on the other hand
the urban growth rate is 23 percent. The highest rural growth rate is reported from Singrauli
(30.7%) while the lowest is seen in Satna (18.2%). Sidhi (35.5%) is seen in first place in terms
of urban growth rate while Singrauli (17.9%) is in last position as shown in Statement 2.94 and
Figure 2.38.

64
Statement 2.94Growth rate in Rewa division : 2011
10
20
30
40
Rew
aD
ivis
ion
Sing
raul
i
Sidh
i
Rew
a
Satn
a
10
20
30
40
Cham
bal
Div
isio
n
Mor
ena
Sheo
pur
Bhin
d
Gro
wth
rat
eDistricts
Rural Urban
10
20
30
40
Cham
bal
Div
isio
n
Mor
ena
Sheo
pur
Bhin
d
Gro
wth
rat
eDistricts
Rural Urban
10
20
30
40
Cham
bal
Div
isio
n
Mor
ena
Sheo
pur
Bhin
d
Gro
wth
rat
e
Districts
Rural UrbanDivision and
District Total Rural Urban
Rewa Division 21.5 21.2 23.0
Singrauli 28.0 30.7 17.9
Sidhi 23.7 22.7 35.5
Rewa 19.8 19.1 23.4
Satna 19.2 18.2 23.0
Fig. 2.38 Growth rate in Rewa division
Shahdol division has a rural growth rate of 19.9 percent and an urban growth rate of 11.7
percent. The maximum rural growth rate has been registered by Umaria (23.2%) and the
minimum figures are reported from Anuppur (15.4%). In terms of urban growth rate figures a
similar pattern is seen with Umaria (32.9%) in top position and Anuppur (5.1%) at the bottom
which can be studied from Statement 2.95 and Figure 2.39.
Statement 2.95Growth rate in Shahdol division : 2011
Division and District
Total Rural Urban
Shahdol Division 18.3 19.9 11.7
Umaria 24.7 23.2 32.9
Dindori 21.3 21.3 20.3
Shahdol 17.3 19.9 8.2
Anuppur 12.3 15.4 5.1
0
10
20
30
40
Shah
dol
Div
isio
n
Um
aria
Din
dori
Shah
dol
Anu
ppur
10
20
30
40
Cham
bal
Div
isio
n
Mor
ena
Sheo
pur
Bhin
d
Gro
wth
rat
e
Districts
Rural Urban
10
20
30
40
Cham
bal
Div
isio
n
Mor
ena
Sheo
pur
Bhin
d
Gro
wth
rat
e
Districts
Rural Urban
10
20
30
40
Cham
bal
Div
isio
n
Mor
ena
Sheo
pur
Bhin
d
Gro
wth
rat
e
Districts
Rural UrbanFig. 2.39 Growth rate in Shahdol division
Ujjain division has recorded a rural growth rate of 15.2 percent and an urban growth rate of
20.9 percent. In regard to the rural growth rate, the highest figure is seen in Ratlam (20.4%)
whereas the lowest is seen in Mandsaur (10.3%). The urban growth rate figures reveal that
Dewas (26.1%) is in first place while the last position is occupied by Ujjain (17.5%) as shown in
Statement 2.96 and Figure 2.40.

POPULATION SIZE AND GROWTH RATE
PROVISIONAL POPULATION TOTALS 65
Statement 2.96Growth rate in Ujjain division : 2011
Division and District
Total Rural Urban
Ujjain Division 16.8 15.2 20.9
Ratlam 19.7 20.4 18.0
Dewas 19.5 17.0 26.1
Shajapur 17.2 15.9 22.6
Ujjain 16.1 15.2 17.5
Neemuch 13.8 11.0 20.8
Mandsaur 13.2 10.3 25.7
0
10
20
30
40
U
jjain
Div
isio
n
Ratla
m
Dew
as
Shaj
apur
Ujja
in
Nee
muc
h
Man
dsau
r
10
20
30
40
Cham
bal
Div
isio
n
Mor
ena
Sheo
pur
Bhin
d
Gro
wth
rat
eDistricts
Rural Urban
10
20
30
40
Cham
bal
Div
isio
n
Mor
ena
Sheo
pur
Bhin
d
Gro
wth
rat
eDistricts
Rural Urban
10
20
30
40
Cham
bal
Div
isio
n
Mor
ena
Sheo
pur
Bhin
d
Gro
wth
rat
eDistricts
Rural UrbanFig. 2.40 Growth rate in Ujjain division
Indore division has reported a rural growth rate of 23 percent whereas the urban growth rate
stands at 33.9 percent. Among the eight districts in the division, Jhabua (31.7%) has registered
the highest rural growth rate and the lowest is seen in Indore (15.3%). From the perspective
of urban growth rate, Dhar (43.4%) occupies the first place while Burhanpur (6.9%) is in last
position as shown in Statement 2.97 and Figure 2.41.
Statement 2.97Growth rate in Indore division : 2011
10
20
30
40
Cham
bal
Div
isio
n
Mor
ena
Sheo
pur
Bhin
d
Gro
wth
rat
e
Districts
Rural Urban
10
20
30
40
Cham
bal
Div
isio
n
Mor
ena
Sheo
pur
Bhin
d
Gro
wth
rat
e
Districts
Rural Urban
10
20
30
40
Cham
bal
Div
isio
n
Mor
ena
Sheo
pur
Bhin
d
Gro
wth
rat
e
Districts
Rural Urban
0
10
20
30
40
50
Indo
reD
ivis
ion
Indo
re
Jhab
ua
Barw
ani
Dha
r
Khar
gone
(Wes
tN
imar
)
Khan
dwa
(Eas
t Nim
ar)
Alir
ajpu
r
Burh
anpu
r
Division and District
Total Rural Urban
Indore Division 26.3 23.0 33.9
Indore 32.7 15.3 40.1
Jhabua 30.6 31.7 20.1
Barwani 27.5 27.3 29.1
Dhar 25.5 22.0 43.4
Khargone (West Nimar)
22.8 22.1 27.0
Khandwa (East Nimar)
21.4 21.8 19.9
Alirajpur 19.4 18.7 28.5
Burhanpur 19.2 26.9 6.9
Fig. 2.41 Growth rate in Indore division
Rural growth rate for Bhopal division is pegged at 18.7 percent while the urban growth is
reported as 30.6 percent. In terms of rural growth rate, Bhopal (25.8%) is seen in first position
whereas Raisen (12.0 percent) is in last place. Raisen (46.8%) has registered the highest urban
growth rate while the lowest is recorded in Rajgarh (27.3%) as shown in Statement 2.98 and
Figure 2.42.

66
Statement 2.98Growth rate in Bhopal division : 2011
0
10
20
30
40
50
Bhop
alD
ivis
ion
Bhop
al
Rajg
arh
Seho
re
Vidi
sha
Rais
en
10
20
30
40
Cham
bal
Div
isio
n
Mor
ena
Sheo
pur
Bhin
d
Gro
wth
rat
e
Districts
Rural Urban
10
20
30
40
Cham
bal
Div
isio
n
Mor
ena
Sheo
pur
Bhin
d
Gro
wth
rat
e
Districts
Rural Urban
10
20
30
40
Cham
bal
Div
isio
n
Mor
ena
Sheo
pur
Bhin
d
Gro
wth
rat
e
Districts
Rural Urban
Fig. 2.42 Growth rate in Bhopal divisionDivision and District
Total Rural Urban
Bhopal Division 23.0 18.7 30.6
Bhopal 28.5 25.8 29.1
Rajgarh 23.3 22.5 27.3
Sehore 21.5 20.0 28.2
Vidisha 20.0 17.2 30.4
Raisen 18.4 12.0 46.8
For Narmadapuram division the rural growth rate stands at 13.7 percent while the urban
growth rate is 17.8 percent. Harda (20.8%) has registered the highest rural growth while the
lowest is seen in Betul (11.5%). In terms of urban growth rate, Betul (19.3%) is seen in first
position whereas Hoshangabad (16.6%) is in last place as shown in Statement 2.99 and Figure
2.43.
Statement 2.99Growth rate in Narmadapuram division : 2011
0
5
10
15
20
25
Nar
mad
apur
amD
ivis
ion Har
da
Hos
hang
abad
Betu
l10
20
30
40
Cham
bal
Div
isio
n
Mor
ena
Sheo
pur
Bhin
d
Gro
wth
rat
e
Districts
Rural Urban
10
20
30
40
Cham
bal
Div
isio
n
Mor
ena
Sheo
pur
Bhin
d
Gro
wth
rat
e
Districts
Rural Urban
10
20
30
40
Cham
bal
Div
isio
n
Mor
ena
Sheo
pur
Bhin
d
Gro
wth
rat
e
Districts
Rural UrbanFig. 2.43 Gowth rate in Narmadapuram divisionDivision and
District Total Rural Urban
Narmadapuram Division
14.6 13.7 17.8
Harda 20.2 20.8 18.0
Hoshangabad 14.5 13.5 16.6
Betul 12.9 11.5 19.3
Jabalpur division has registered a rural growth rate of 14.1 percent and an urban growth rate of
19.7 percent. Across all the districts in the division, the highest rural growth rate is registered
in Katni (22.6%) and the lowest is seen in Narsimhapur (10.4%). From the perspective of urban
growth rate, Mandla (41.7%) is in first place while the last position is occupied by Chhindwara
(11.7%) as shown in Statement 2.100 and Figure 2.44.

POPULATION SIZE AND GROWTH RATE
PROVISIONAL POPULATION TOTALS 67
Statement 2.100Growth rate in Jabalpur division : 2011
0
10
20
30
40
50
Jaba
lpur
Div
isio
n
Katn
i
Seon
i
Man
dla
Jaba
lpur
Nar
sim
hapu
r
Bala
ghat
Chhi
ndw
ara10
20
30
40
Cham
bal
Div
isio
n
Mor
ena
Sheo
pur
Bhin
d
Gro
wth
rat
eDistricts
Rural Urban
10
20
30
40
Cham
bal
Div
isio
n
Mor
ena
Sheo
pur
Bhin
d
Gro
wth
rat
eDistricts
Rural Urban
10
20
30
40
Cham
bal
Div
isio
n
Mor
ena
Sheo
pur
Bhin
d
Gro
wth
rat
eDistricts
Rural UrbanFig. 2.44 Growth rate in Jabalpur divisionDivision and
District Total Rural Urban
Jabalpur Division 15.5 14.1 19.7
Katni 21.4 22.6 17.0
Seoni 18.2 16.2 35.8
Mandla 17.8 15.1 41.7
Jabalpur 14.4 10.6 17.2
Narsimhapur 14.0 10.4 33.0
Balaghat 13.6 11.7 26.2
Chhindwara 13.0 13.5 11.7
2.16 TAHSIL-WISE GROWTH RATE IN DIVISIONS2.16.1 Top and bottom five tahsils according to growth rate in divisions : Total
There is a large gap in growth rate between the top five and bottom five tahsils in all the
divisions of Madhya Pradesh.
In Chambal division, Karahal tahsil with 34.3 percent is on top and Mihona tahsil with 14.4
percent is at the bottom as shown in Statement 2.101.
Statement 2.101Top and bottom five tahsils according to total growth rate in Chambal division : 2011
Top five tahsils
Tahsil District Growth rate
Karahal Sheopur 34.3
Morena Morena 30.1
Beerpur Sheopur 24.0
Joura Morena 23.7
Kailaras Morena 23.7
Bottom five tahsils
Tahsil District Growth rate
Mihona Bhind 14.4
Lahar Bhind 15.6
Porsa Morena 15.7
Ater Bhind 16.8
Gormi Bhind 16.8
In Gwalior division, Khaniyadhana tahsil with 32.0 percent is on top and Chinour tahsil with
13.0 percent is at the bottom as shown in Statement 2.102.

68
Statement 2.102
Top and bottom five tahsils according to total growth rate in Gwalior division : 2011Top five tahsils
Tahsil District Growth rate
Khaniyadhana Shivpuri 32.0
Guna Guna 29.6
Ashoknagar Ashoknagar 29.6
Raghogarh Guna 28.1
Maksoodangarh Guna 27.8
Bottom five tahsils
Tahsil District Growth rate
Chinour Gwalior 13.0
Bhander Datia 15.7
Seondha Datia 16.3
Bhitarwar Gwalior 18.3
Isagarh Ashoknagar 18.6
In Sagar division, Shahnagar tahsil with 27.2 percent is on top and Maharajpur tahsil with 12.4
percent is at the bottom as shown in Statement 2.103.
Statement 2.103
Top and bottom five tahsils according to total growth rate in Sagar division : 2011Top five tahsils
Tahsil District Growth rate
Shahnagar Panna 27.2
Khargapur Tikamgarh 26.3
Ghuwara Chhatarpur 25.5
Chhatarpur Chhatarpur 24.2
Mohangarh Tikamgarh 23.6
Bottom five tahsils
Tahsil District Growth rate
Maharajpur Chhatarpur 12.4
Bina Sagar 13.2
Khurai Sagar 13.4
Jabera Damoh 15.0
Nowgong Chhatarpur 15.4
In Rewa division, Deosar tahsil with 33.0 percent is on top and Kotar tahsil with 14.7 percent is
at the bottom as shown in Statement 2.104.
Statement 2.104Top and bottom five tahsils according to total growth rate in Rewa division : 2011
Top five tahsils
Tahsil District Growth rate
Deosar Singrauli 33.0
Chitrangi Singrauli 30.2
Majhauli Sidhi 26.8
Kusmi Sidhi 24.8
Gopadbanas Sidhi 24.7
Bottom five tahsils
Tahsil District Growth rate
Kotar Satna 14.7
Churhat Sidhi 14.9
Birsinghpur Satna 15.2
Nagod Satna 16.0
Raipur-Karchuliyan Rewa 17.0
In Shahdol division, Shahpura tahsil with 93.3 percent is on the top and Bandhogarh tahsil with
-0.3 percent is at the bottom as shown in Statement 2.105.
Statement 2.105Top and bottom five tahsils according to total growth rate in Shahdol division : 2011
Top five tahsils
Tahsil District Growth rate
Shahpura Dindori 93.3
Manpur Umaria 43.0
Beohari Shahdol 32.6
Pali Umaria 29.0
Chandia Umaria 26.5
Bottom five tahsils
Tahsil District Growth rate
Bandhogarh Umaria -0.3
Dindori Dindori 4.0
Anuppur Anuppur 8.3
Jaithari Anuppur 10.7
Sohagpur Shahdol 11.3
In Ujjain division, Rawti tahsil with 34.8 percent is on top and Jawad tahsil with 9.5 percent is
at the bottom as shown in Statement 2.106.

POPULATION SIZE AND GROWTH RATE
PROVISIONAL POPULATION TOTALS 69
Statement 2.106
Top and bottom five tahsils according to total growth rate in Ujjain division : 2011Top five tahsils
Tahsil District Growth rate
Rawti Ratlam 34.8
Bajna Ratlam 33.3
Sailana Ratlam 32.2
Satwas Dewas 29.1
Khategaon Dewas 24.0
Bottom five tahsils
Tahsil District Growth rate
Jawad Neemuch 9.5
Malhargarh Mandsaur 10.1
Nagda Ujjain 10.5
Tonk Khurd Dewas 11.6
Daloda Mandsaur 12.3
In Indore division, Pati tahsil with 40.9 percent has secured the top position and Harsud tahsil
with -11.0 percent is at the bottom as shown in Statement 2.107.
Statement 2.107
Top and bottom five tahsils according to total growth rate in Indore division : 2011Top five tahsils
Tahsil District Growth rate
Pati Barwani 40.9
Khalwa Khandwa (East Nimar) 39.1
Meghnagar Jhabua 38.5
Indore Indore 38.2
Petlawad Jhabua 36.6
Bottom five tahsils
Tahsil District Growth rate
Harsud Khandwa (East Nimar) -11.0
Bhavra Alirajpur 4.2
Burhanpur Burhanpur 14.6
Badnawar Dhar 16.8
Maheshwar Khargone (West Nimar) 17.5
In Bhopal division, Huzur tahsil with 29.2 percent is on top and Gulabganj tahsil with 10.0
percent is at the bottom as shown in Statement 2.108.
Statement 2.108
Top and bottom five tahsils according to total growth rate in Bhopal division : 2011Top five tahsils
Tahsil District Growth rate
Huzur Bhopal 29.2
Khilchipur Rajgarh 28.1
Lateri Vidisha 28.0
Shamshabad Vidisha 26.6
Nasrullaganj Sehore 26.4
Bottom five tahsils
Tahsil District Growth rate
Gulabganj Vidisha 10.0
Udaipura Raisen 14.0
Baraily Raisen 15.0
Begamganj Raisen 15.8
Kurwai Vidisha 16.1
In Narmadapuram division, Khirkiya tahsil with 25.9 percent is on top and Ghoda Dongari tahsil
with 4.6 percent is at the bottom as shown in Statement 2.109.
Statement 2.109Top and bottom five tahsils according to total growth rate in Narmadapuram division : 2011
Top five tahsils
Tahsil District Growth rate
Khirkiya Harda 25.9
Sirali Harda 22.4
Handiya Harda 22.2
Rehatgaon Harda 22.1
Bhainsdehi Betul 21.0
Bottom five tahsils
Tahsil District Growth rate
Ghoda Dongri Betul 4.6
Multai Betul 7.8
Dolariya Hoshangabad 8.1
Amla Betul 8.9
Itarsi Hoshangabad 9.8
In Jabalpur division, Barhi tahsil with 35.6 percent is on top and Parasia tahsil with a mere 0.2
percent is at the bottom as shown in Statement 2.110.

70
Statement 2.110Top and bottom five tahsils according to total growth rate in Jabalpur division : 2011
Top five tahsils
Tahsil District Growth rate
Barhi Katni 35.6
Tamia Chhindwara 27.6
Panagar Jabalpur 26.7
Badwara Katni 26.4
Rithi Katni 23.0
Bottom five tahsils
Tahsil District Growth rate
Parasia Chhindwara 0.2
Sausar Chhindwara 7.1
Tirodi Balaghat 7.1
Waraseoni Balaghat 8.3
Pandhurna Chhindwara 8.5
2.16.2 Top and bottom five tahsils according to growth rate in divisions : Rural
In Chambal division, Karahal tahsil with 34.3 percent is on top and Lahar tahsil with 13.6
percent is at the bottom as shown in Statement 2.111.Statement 2.111Top and bottom five tahsils according to rural growth rate in Chambal division : 2011
Top five tahsils
Tahsil District Growth rate
Karahal Sheopur 34.3
Kailaras Morena 24.7
Vijaypur Sheopur 24.2
Beerpur Sheopur 24.0
Joura Morena 23.4
Bottom five tahsils
Tahsil District Growth Rate
Lahar Bhind 13.6
Gohad Bhind 14.4
Mihona Bhind 14.4
Ambah Morena 14.8
Porsa Morena 14.8
In Gwalior division, Khaniyadhana tahsil with 32.6 percent is on top and Dabrar tahsil with 2.0
percent is at the bottom as shown in Statement 2.112.
Statement 2.112Top and bottom five tahsils according to rural growth rate in Gwalior division : 2011
Top five tahsils
Tahsil District Growth rate
Khaniyadhana Shivpuri 32.6
Raghogarh Guna 29.2
Maksoodangarh Guna 27.8
Guna Guna 27.7
Bamori Guna 27.0
Bottom five tahsils
Tahsil District Growth rate
Dabra Gwalior 2.0
Datia Datia 13.5
Chinour Gwalior 14.0
Bhander Datia 14.5
Seondha Datia 15.7
In Sagar division,Khargapur tahsil with 27.4 percent is on top and Bina tahsil with 9.9 percent
is at the bottom as shown in Statement 2.113.
Statement 2.113Top and bottom five tahsils according to rural growth rate in Sagar division : 2011
Top five tahsils
Tahsil District Growth rate
Khargapur Tikamgarh 27.4
Shahnagar Panna 27.2
Ghuwara Chhatarpur 25.9
Mohangarh Tikamgarh 23.6
Tikamgarh Tikamgarh 23.4
Bottom five tahsils
Tahsil District Growth rate
Bina Sagar 9.9
Jabera Damoh 10.2
Khurai Sagar 10.2
Patharia Damoh 11.7
Nowgong Chhatarpur 12.5
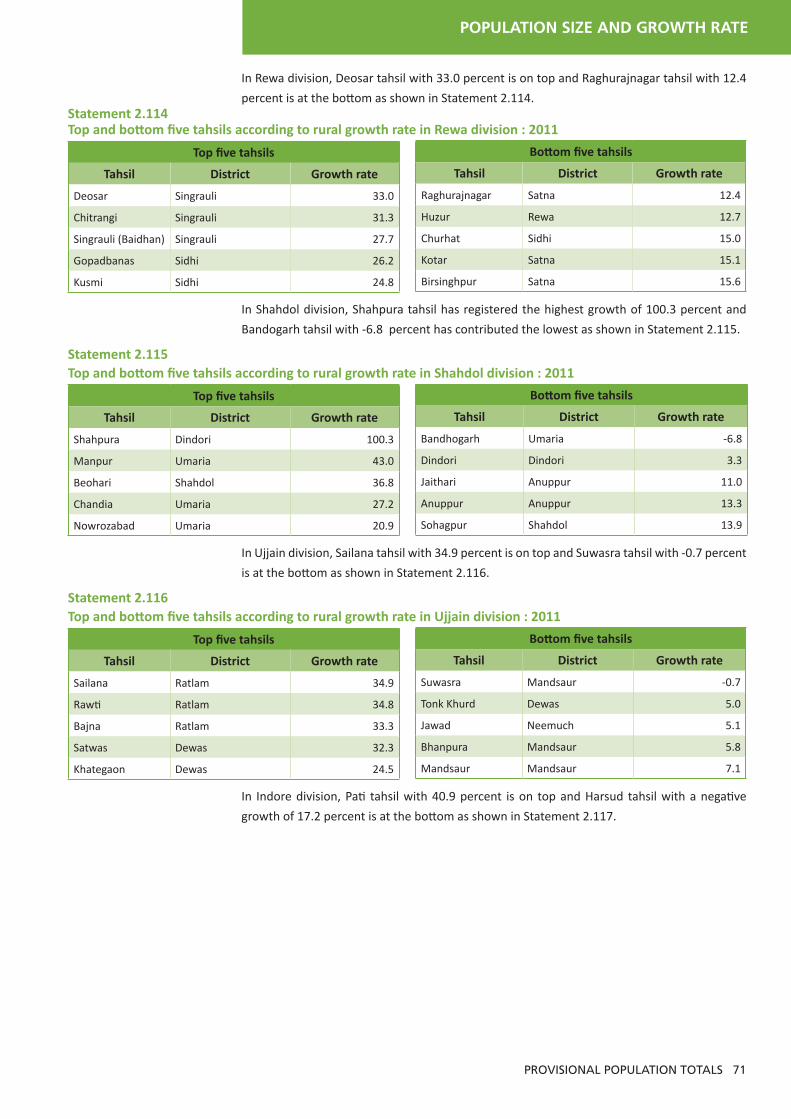
POPULATION SIZE AND GROWTH RATE
PROVISIONAL POPULATION TOTALS 71
In Rewa division, Deosar tahsil with 33.0 percent is on top and Raghurajnagar tahsil with 12.4
percent is at the bottom as shown in Statement 2.114.Statement 2.114Top and bottom five tahsils according to rural growth rate in Rewa division : 2011
Top five tahsils
Tahsil District Growth rate
Deosar Singrauli 33.0
Chitrangi Singrauli 31.3
Singrauli (Baidhan) Singrauli 27.7
Gopadbanas Sidhi 26.2
Kusmi Sidhi 24.8
Bottom five tahsils
Tahsil District Growth rate
Raghurajnagar Satna 12.4
Huzur Rewa 12.7
Churhat Sidhi 15.0
Kotar Satna 15.1
Birsinghpur Satna 15.6
In Shahdol division, Shahpura tahsil has registered the highest growth of 100.3 percent and
Bandogarh tahsil with -6.8 percent has contributed the lowest as shown in Statement 2.115.
Statement 2.115Top and bottom five tahsils according to rural growth rate in Shahdol division : 2011
Top five tahsils
Tahsil District Growth rate
Shahpura Dindori 100.3
Manpur Umaria 43.0
Beohari Shahdol 36.8
Chandia Umaria 27.2
Nowrozabad Umaria 20.9
Bottom five tahsils
Tahsil District Growth rate
Bandhogarh Umaria -6.8
Dindori Dindori 3.3
Jaithari Anuppur 11.0
Anuppur Anuppur 13.3
Sohagpur Shahdol 13.9
In Ujjain division, Sailana tahsil with 34.9 percent is on top and Suwasra tahsil with -0.7 percent
is at the bottom as shown in Statement 2.116.
Statement 2.116Top and bottom five tahsils according to rural growth rate in Ujjain division : 2011
Top five tahsils
Tahsil District Growth rate
Sailana Ratlam 34.9
Rawti Ratlam 34.8
Bajna Ratlam 33.3
Satwas Dewas 32.3
Khategaon Dewas 24.5
Bottom five tahsils
Tahsil District Growth rate
Suwasra Mandsaur -0.7
Tonk Khurd Dewas 5.0
Jawad Neemuch 5.1
Bhanpura Mandsaur 5.8
Mandsaur Mandsaur 7.1
In Indore division, Pati tahsil with 40.9 percent is on top and Harsud tahsil with a negative
growth of 17.2 percent is at the bottom as shown in Statement 2.117.

72
Statement 2.117Top and bottom five tahsils according to rural growth rate in Indore division : 2011
Top five tahsils
Tahsil District Growth rate
Pati Barwani 40.9
Meghnagar Jhabua 39.7
Khalwa Khandwa (East Nimar) 39.1
Petlawad Jhabua 37.7
Varla Barwani 35.3
Bottom five tahsils
Tahsil District Growth rate
Harsud Khandwa (East Nimar) -17.2
Hatod Indore -3.4
Bhavra Alirajpur 2.5
Indore Indore 6.2
Gogaon Khargone (West Nimar) 9.8
In Bhopal division, Huzur tahsil with 29.4 percent is on top and Silwani tahsil with 4.7 percent
is at the bottom as shown in Statement 2.118.
Statement 2.118Top and bottom five tahsils according to rural growth rate in Bhopal division : 2011
Top five tahsils
Tahsil District Growth rate
Huzur Bhopal 29.4
Lateri Vidisha 27.1
Rajgarh Rajgarh 25.4
Nasrullaganj Sehore 24.8
Narsinghgarh Rajgarh 24.3
Bottom five tahsils
Tahsil District Growth rate
Silwani Raisen 4.7
Gulabganj Vidisha 10.0
Basoda Vidisha 10.3
Gairatganj Raisen 10.3
Goharganj Raisen 11.4
In Narmadapura division, Khirkiya tahsil with 24.6 percent is on top and Athner tahsil with 2.1
percent is at the bottom as shown in Statement 2.119.Statement 2.119Top and bottom five tahsils according to rural growth rate in Narmadapuram division : 2011
Top five tahsils
Tahsil District Growth rate
Khirkiya Harda 24.6
Bhainsdehi Betul 24.1
Sirali Harda 22.4
Handiya Harda 22.2
Rehatgaon Harda 22.1
Bottom five tahsils
Tahsil District Growth rate
Athner Betul 2.1
Multai Betul 5.0
Chicholi Betul 5.6
Ghoda Dongri Betul 7.3
Pipariya Hoshangabad 7.4
In Jabalpur division, Barhi tahsil with 37.0 percent is on top and Sausar tahsil with -6.2 percent
is at the bottom as shown in Statement 2.120.Statement 2.120Top and bottom five tahsils according to rural growth rate in Jabalpur division : 2011
Top five tahsils
Tahsil District Growth rate
Barhi Katni 37.0
Tamia Chhindwara 27.6
Badwara Katni 26.4
Rithi Katni 23.0
Dhanora Seoni 22.9
Bottom five tahsils
Tahsil District Growth rate
Sausar Chhindwara -6.2
Tendukheda Narsimhapur -3.5
Jabalpur Jabalpur -2.5
Chhapara Seoni 4.4
Pandhurna Chhindwara 7.7

POPULATION SIZE AND GROWTH RATE
PROVISIONAL POPULATION TOTALS 73
2.16.3 Top and Bottom five tahsils according to growth rate in divisions : Urban In Chambal division, Morena tahsil with 50.6 percent is on top and Mihona tahsil with 14.4
percent is at the bottom as shown in Statement 2.121.
Statement 2.121Top and bottom five tahsils according to urban growth rate in Chambal division : 2011
Top five tahsils
Tahsil District Growth rate
Morena Morena 50.6
Mehgaon Bhind 44.8
Gohad Bhind 36.2
Ambah Morena 29.5
Bhind Bhind 27.1
Bottom five tahsils
Tahsil District Growth rate
Mihona Bhind 14.4
Vijaypur Sheopur 16.5
Badoda Sheopur 17.8
Kailaras Morena 18.2
Sabalgarh Morena 19.0
In Gwalior division, Indergarh tahsil with 57.8 percent is on top and Chinour tahsil with 4.3
percent is at the bottom as shown in Statement 2.122.Statement 2.122Top and bottom five tahsils according to urban growth rate in Gwalior division : 2011
Top five tahsils
Tahsil District Growth rate
Indergarh Datia 57.8
Dabra Gwalior 52.9
Ashoknagar Ashoknagar 41.9
Kumbhraj Guna 40.1
Mungaoli Ashoknagar 34.1
Bottom five tahsils
Tahsil District Growth rate
Chinour Gwalior 4.3
Chanderi Ashoknagar 16.9
Seondha Datia 18.6
Isagarh Ashoknagar 21.6
Bhander Datia 22.0
In Sagar division, Patharia tahsil with 61.6 percent is on top and Gaurihar tahsil with 4.0 percent
is at the bottom as shown in Statement 2.123.Statement 2.123Top and bottom five tahsils according to urban growth rate in Sagar division : 2011
Top five tahsils
Tahsil District Growth rate
Patharia Damoh 61.6
Chhatarpur Chhatarpur 35.4
Orchha Tikamgarh 35.4
Tendukheda Damoh 28.1
Chandla Chhatarpur 25.8
Bottom five tahsils
Tahsil District Growth rate
Gaurihar Chhatarpur 4.0
Deori Sagar 7.1
Maharajpur Chhatarpur 7.3
Laundi Chhatarpur 9.5
Shahgarh Sagar 12.6
In Rewa division, Majhgawan tahsil with 41.8 percent is on top and Chitrangi tahsil with -8.5
percent is at the bottom as shown in Statement 2.124.

74
Statement 2.124Top and bottom five tahsils according to urban growth rate in Rewa division : 2011
Top five tahsils
Tahsil District Growth rate
Majhgawan Satna 41.8
Huzur Rewa 29.7
Raghurajnagar Satna 25.3
Rampur Baghelan Satna 20.6
Rampur Naikin Sidhi 20.4
Bottom five tahsils
Tahsil District Growth rate
Chitrangi Singrauli -8.5
Semaria Rewa 8.9
Kotar Satna 9.4
Sirmour Rewa 9.5
Unchahara Satna 10.6
In Shahdol division, Pali tahsil with 67.0 percent has attained the top spot whereas Anuppur
tahsil with a negative growth of 1.9 percent is at the bottom as shown in Statement 2.125.
Statement 2.125Top and bottom five tahsils according to urban growth rate in Shahdol division : 2011
Top five tahsils
Tahsil District Growth rate
Pali Umaria 67.0
Bandhogarh Umaria 23.3
Chandia Umaria 22.8
Dindori Dindori 22.5
Pushparajgarh Anuppur 18.8
Bottom five tahsils
Tahsil District Growth rate
Anuppur Anuppur 1.9
Sohagpur Shahdol 7.0
Jaithari Anuppur 7.6
Kotma Anuppur 10.1
Jaisinghnagar Shahdol 11.4
In Ujjain division, Bhanpura tahsil with 70.8 percent is on top and Garoth tahsil with 3.8 percent
is at the bottom as shown in Statement 2.126.
Statement 2.126Top and bottom five tahsils according to urban growth rate in Ujjain division : 2011
Top five tahsils
Tahsil District Growth rate
Bhanpura Mandsaur 70.8
Tarana Ujjain 69.8
Sonkatch Dewas 47.7
Manasa Neemuch 40.8
Jawad Neemuch 28.7
Bottom five tahsils
Tahsil District Growth rate
Garoth Mandsaur 3.8
Nagda Ujjain 3.9
Bagli Dewas 5.8
Badnagar Ujjain 6.9
Daloda Mandsaur 7.1
In Indore division, Hatod tahsil with 226.0 percent is on top and Nepanagar tahsil with -6.2
percent is at the bottom as shown in Statement 2.127.
Statement 2.127Top and bottom five tahsils according to urban growth rate in Indore division : 2011
Top five tahsils
Tahsil District Growth rate
Hatod Indore 226.0
Rajpur Barwani 73.2
Dhar Dhar 57.5
Indore Indore 42.0
Harsud Khandwa (East Nimar) 38.9
Bottom five tahsils
Tahsil District Growth rate
Nepanagar Burhanpur -6.2
Burhanpur Burhanpur 8.8
Mhow Indore 9.5
Pansemal Barwani 11.6
Bhikangaon Khargone (West Nimar) 13.5
In Bhopal division, Gairatganj tahsil with 124.6 percent is on top and Begamganj tahsil with
11.9 percent is at the bottom as shown in Statement 2.128.

POPULATION SIZE AND GROWTH RATE
PROVISIONAL POPULATION TOTALS 75
Statement 2.128Top and bottom five tahsils according to urban growth rate in Bhopal division : 2011
Top five tahsils
Tahsil District Growth rate
Gairatganj Raisen 124.6
Khilchipur Rajgarh 79.1
Goharganj Raisen 57.0
Ashta Sehore 56.8
Nasrullaganj Sehore 38.0
Bottom five tahsils
Tahsil District Growth rate
Begamganj Raisen 11.9
Kurwai Vidisha 12.7
Jawar Sehore 15.1
Sarangpur Rajgarh 15.9
Narsinghgarh Rajgarh 16.5
In Narmadapuram division, Shahpur tahsil with 49.1 percent is on top and Bhainsdehi tahsil
with -24.1 percent is at the bottom as shown in Statement 2.129.
Statement 2.129Top and bottom five tahsils according to urban growth rate in Narmadapuram division : 2011
Top five tahsils
Tahsil District Growth rate
Shahpur Betul 49.1
Multai Betul 39.9
Pipariya Hoshangabad 31.2
Khirkiya Harda 30.1
Betul Betul 22.1
Bottom five tahsils
Tahsil District Growth rate
Bhainsdehi Betul -24.1
Dolariya Hoshangabad -14.5
Ghoda Dongri Betul 0.9
Amla Betul 2.3
Itarsi Hoshangabad 9.7
In Jabalpur division, Kareli tahsil with 52.1 percent is on top and Parasia tahsil with -9.2 percent
is at the bottom as shown in Statement 2.130.
Statement 2.130Top and bottom five tahsils according to urban growth rate in Jabalpur division : 2011
Top five tahsils
Tahsil District Growth rate
Kareli Narsimhapur 52.1
Sausar Chhindwara 45.7
Panagar Jabalpur 45.0
Nainpur Mandla 36.4
Barhi Katni 27.6
Bottom five tahsils
Tahsil District Growth rate
Parasia Chhindwara -9.2
Paraswada Balaghat -4.9
Tirodi Balaghat -4.6
Jamai Chhindwara -3.2
Vijayraghavgarh Katni 1.5

76
GUNA ASHOKNAGAR
SAGARRAJGARH
RAISEN
CHHATARPUR
DAMOH
JABALPUR
PANNA
MORENA
SHEOPUR
BHIND
GWALIOR
DATIA
SHIVPURI
SATNA
REWA
SIDHI SINGRAULI
KATNI
UMARIA
SHAHDOL
ANUPPUR
MANDLA
DINDORI
BALAGHAT
HOSHANGABAD
NARSIMHAPUR
SEONI
CHHINDWARA
VIDISHA
BETUL
HARDAALIRAJPUR
JHABUA
DHAR
(WEST NIMAR) (EAST NIMAR)
INDOREDEWAS
UJJAINRATLAM
NEEMUCH
MANDSAUR
SHAJAPUR
SEHORE
TIKAMGARH
BARWANI
BURHANPUR
BHOPAL
KHARGONE KHANDWA
62.737.3
16.0
9.0
24.2
29.8
17.1
19.6 14.4
22.6
22.8
18.911.9
21.3
4.6
12.4
19.8
19.8
28.9
23.3
25.2
16.7
12.3
31.4
18.9
8.3
15.6
39.2
17.9
19.4
19.3
23.9
20.7
14.7
17.3
20.6
29.9
18.6
58.5
7.8
18.2
20.4
25.4
17.2
29.7
62.7
80.8
27.4
74.1
34.4
20.9
23.2
84.0
75.8
70.2
82.9
80.4 85.6
77.4
77.2
81.188.1
78.7
87.6
80.2
80.2
71.1
76.7
74.8
83.3
87.7
68.6
81.1
84.4
91.0
82.1
80.6
80.7
76.1
95.4
79.3
85.3
82.7
70.1
81.4
79.6
91.7
70.3
60.8
79.4
41.5
81.8
74.6
82.8
37.3
72.6
25.9
92.2
65.6
79.1
76.8
19.2
40 0 12040 80KILOMETRES
74 76 78 80 82
28
26
24
22
20
8278 807674
20
22
24
26
28
o o o o o
o
o
o
o
o
ooooo
o
o
o
o
oMADHYA PRADESH
RA
J
A
S
T
H
A
N U T
TA
R
P R AD
ES
H
GU
JA
RA
T
M
AH
A RA
S H TR A
CH
HA
T
TI
SG
AR
H
INDIA
BOUNDARIES : - STATE.............................
DISTRICT.........................DIVISION.........................
RURAL AND URBAN POPULATION 2011
EAST OF GREENWICH
c Government of India copyright, 2011The state boundaries between Chhattisgarh and Madhya Pradesh have not been verified by the Government concerned.
URBANRURAL
PERCENTAGE OF RURAL AND URBAN POPULATION TO TOTAL POPULATION