population-level impact of white-nose syndrome … impact of white-nose syndrome on the endangered...
TRANSCRIPT

BioOne sees sustainable scholarly publishing as an inherently collaborative enterprise connecting authors, nonprofit publishers, academic institutions, researchlibraries, and research funders in the common goal of maximizing access to critical research.
Population-level impact of white-nose syndrome on the endangered Indiana batAuthor(s): Wayne E. Thogmartin, R. Andrew King, Patrick C. McKann, Jennifer A. Szymanski, and LoriPruittSource: Journal of Mammalogy, 93(4):1086-1098. 2012.Published By: American Society of MammalogistsDOI: http://dx.doi.org/10.1644/11-MAMM-A-355.1URL: http://www.bioone.org/doi/full/10.1644/11-MAMM-A-355.1
BioOne (www.bioone.org) is a nonprofit, online aggregation of core research in the biological, ecological, andenvironmental sciences. BioOne provides a sustainable online platform for over 170 journals and books publishedby nonprofit societies, associations, museums, institutions, and presses.
Your use of this PDF, the BioOne Web site, and all posted and associated content indicates your acceptance ofBioOne’s Terms of Use, available at www.bioone.org/page/terms_of_use.
Usage of BioOne content is strictly limited to personal, educational, and non-commercial use. Commercial inquiriesor rights and permissions requests should be directed to the individual publisher as copyright holder.

Journal of Mammalogy, 93(4):1086–1098, 2012
Population-level impact of white-nose syndrome on the endangeredIndiana bat
WAYNE E. THOGMARTIN,* R. ANDREW KING, PATRICK C. MCKANN, JENNIFER A. SZYMANSKI, AND LORI PRUITT
United States Geological Survey, Upper Midwest Environmental Sciences Center, 2630 Fanta Reed Road,La Crosse, WI 54603, USA (WET, PM)United States Fish and Wildlife Service, Division of Endangered Species, Bloomington Field Office, 620 S. Walker Street,Bloomington, IN 47403, USA (RAK, LP)United States Fish and Wildlife Service, Division of Endangered Species, United States Fish and Wildlife ResourceCenter, 555 Lester Avenue, Onalaska, WI 54650, USA (JAS)
* Correspondent: [email protected]
Establishing status and trend for an endangered species is critical to recovery, especially when it is faced with a
nascent extinction agent. We calculated, with hierarchical log-linear change-point models, hibernaculum-level
population trends between 1983 and 2009 for the endangered Indiana bat (Myotis sodalis) now subjected to the
fast-spreading fungal disease white-nose syndrome. We combined trends from 222 wintering populations before
and after onset of the disease to determine trend for clusters of interacting wintering populations, recovery units,
and the species. Before onset of the disease, a west-to-east gradient in trends existed, with westernmost
populations declining and easternmost populations increasing in abundance. The species as a whole, however,
was stationary between 1983 and 2005 (�0.5% mean annual change; 95% confidence interval [CI] ¼�2.8,
þ1.8%). Estimated mean population size in 2009 was 377,124 bats (195,398–957,348), with large variance
apparently caused by white-nose syndrome. With the onset of white-nose syndrome (2006–2009), the species
exhibited a 10.3% annual decline (95% CI ¼�21.1, þ2.0%). White-nose syndrome is having an appreciable
influence on the status and trends of Indiana bat populations, stalling and in some cases reversing population
gains made in recent years.
Key words: change-point analysis, endangered species, Geomyces destructans, Myotis sodalis, trend estimation
� 2012 American Society of Mammalogists
DOI: 10.1644/11-MAMM-A-355.1
White-nose syndrome has been associated with severe and
abrupt declines in bat abundance in eastern North America
since the winter of 2006 (Blehert et al. 2009; Frick et al. 2010a;
Turner et al. 2011), spreading throughout the eastern United
States and Canada. As of spring 2012, white-nose syndrome
had been confirmed in hibernacula as far north as Ontario and
Quebec, as far south as Alabama, and as far west as eastern
Missouri; the fungus causing white-nose syndrome, Geomycesdestructans, has been observed over a wider range, occurring
in Oklahoma, for instance (Blehert et al. 2011; Foley et al.
2011). G. destructans has afflicted 6 species of hibernating bats
(Blehert et al. 2011; Foley et al. 2011), including the little
brown (Myotis lucifugus), northern long-eared (M. septentrio-nalis), eastern small-footed myotis (M. leibii), big brown
(Eptesicus fuscus), tricolored (Perimyotis subflavus), and
Indiana bats (M. sodalis). The Indiana bat is a species for
which there is particular concern because of its status as
endangered under the United States Endangered Species Act of
1973. The Indiana bat is also a red-listed species according to
the International Union for the Conservation of Nature
(Arroyo-Cabrales and Ticul Alvarez Castaneda 2008). Infor-
mation regarding the spatial and temporal patterns in species
abundance is needed, but not available, for predicting
population-level impacts of this disease.
Indiana bats aggregate in winter in subterranean colonies;
thus, the most common means for determining population size
is periodic direct observation and counting of hibernating
individuals in caves and mines (Hayes et al. 2009). Trained
surveyors search all sections of a hibernaculum to count and
identify to species all bats observed. The fidelity by bats to
subterranean roosts allows researchers to focus monitoring on a
few discrete locations in winter (Hayes et al. 2009).
w w w . m a m m a l o g y . o r g
1086
Historically, surveys were limited to one per year at each
hibernaculum because repeated or prolonged disruption of bats
during hibernation can cause increased energy expenditure
from arousal and premature depletion of fat reserves (Speak-
man et al. 1991; Thomas 1995; Thomas et al. 1990).
Indiana bats have been counted at various times and
locations since 1929; these early counts were infrequent and
prospective in nature. By the mid-20th century, a number of
known aggregations of Indiana bats began to be counted on a
semiregular basis (Clawson 2002). By 1983, survey methods
were largely standardized and all known large aggregations of
Indiana bats were regularly estimated by state and federal
biologists and academic chiroptologists. Many smaller and
moderately sized aggregations, however, continued to be
counted less frequently; the most common rotation was
surveys conducted biennially (Clawson 2002; Kunz 2003).
For populations that exhibit complete fidelity to a hibernacu-
lum, this biennial count would pose no analytical problems, nor
would problems occur if the counts were synchronized.
However, Hayes et al. (2009:117) noted ‘‘Tallies based on
direct counts involve a suite of assumptions that are rarely
articulated, yet can ultimately impact their utility for inferring
population trends. . . [A]ttempts to infer population trends. . .
are based on the assumptions that availability and quality of
roosts are static and that bats exhibit high rates of fidelity to
roosts through time.’’ Myotis, however, are not entirely faithful
to their hibernaculum from one year to the next (Elder and
Gunier 1978; Fath 2002), nor are all counts made synchro-
nously. As a consequence, bats counted in 1 year in 1
hibernaculum may move to another nearby hibernaculum the
subsequent year and be counted again. This lack of
independence, if it were not accounted for, could lead to a
biased estimate of the number of bats in a region as well as
exert uncertain and potentially misleading effects on estimated
trends and variation in trends.
A credible estimate of species population trajectory and
accompanying levels of confidence are not possible absent a
robust consideration of the dependency among wintering
populations and the asynchronous nature of surveys. Our
objectives were, therefore, manifold. First, we determined
estimates of population trend for each sufficiently surveyed
hibernaculum across the species range (Fig. 1). Second, with
these trend estimates as the basis for inference, we hierarchi-
cally aggregated population trajectories across complexes of
interacting populations, United States Fish and Wildlife
Service recovery units, and the species, as a means of
dampening the unknown extent of site infidelity and uncertain
hibernaculum availability and quality. We accommodated
many of the uncertainties and difficulties associated with these
data with hierarchical Bayesian methods. Third, we tested
whether the epizootic white-nose syndrome was evident within
the time series of counts we analyzed. Conventional estimates
of trend are insufficient for analyzing periods in which
substantial shifts in mean population size and trend are
expected to occur at some intervening date. Thus, our modeling
approach allowed for an estimation of trend before and after the
advent of this disease.
METHODS
Hibernaculum counts.—The Indiana Bat Recovery Team
maintains a database of hibernaculum data for all known (i.e.,
current and historic) wintering locations of Indiana bats
(curated by A. King; Appendix I). This database contains
detailed historical counts from hibernacula with 1 or more
Indiana bat winter occurrence records. Since 2005, a biennial
data request for winter population counts of Indiana bats has
been sent to bat biologists across all 27 states of the species
range; these data are then used in calculating a range-wide
population estimate once every 2 years.
Standardization of hibernaculum surveys occurred by
~1980, so we limited our analyses of trends to those counts
collected between 1983 and 2009 (the 2011 biennial survey of
results was ongoing as of this analysis). Details of survey
protocol are described by Kunz (2003) and Hayes et al. (2009).
A mean of 103 Indiana bat hibernacula were surveyed each
year (range¼39–181) across 24 states between 1983 and 2009;
as Clawson (2002) noted, surveys were more commonly
conducted in odd years (128 hibernacula [95% confidence
interval {CI} ¼ 109,146] in odd years versus 77 hibernacula
[67, 86] in even years). Hibernaculum counts were conducted
by 1–7 surveyors between January and March, typically within
a 2.2-hour period (maximum ¼ 7 hours). Approximately 12%
of surveys required vertical caving gear for access to the
hibernaculum. Surveyors reported that 86% of hibernaculum
counts were derived by individual counting of bats; the
remaining 14% of estimates were determined by multiplying
the areal estimate of a cluster of hibernating bats by a bat
packing density, an expansion factor determined by the
surveyors. No animals were handled in the course of this study.
Trend estimation.—We used change-point modeling to
estimate trend before and after the intervention of white-nose
syndrome (Toms and Lesperance 2003). Change-point models
can be formulated either sequentially or retrospectively; with
the former, a decision is made regarding the occurrence of a
change on the basis of the data, whereas in the latter, the time
series of data is examined to determine if a change point has
occurred in the sequence and, if so, where this change
occurred. In the case of Indiana bat populations subject to
white-nose syndrome, this change point is expected to evolve
spatially with the spread of the disease (W. E. Thogmartin et
al., in litt.). Rather than model an evolving spatiotemporal
process given incomplete survey data, we took the former route
to change-point modeling and set a priori a change point
equivalent to year 2005. This is the year before the first
recorded occurrence of G. destructans (Blehert et al. 2009).
We modeled the trend for each hibernaculum with the
response as log(countþ1) and explanatory variables as years
(within the range of 1983–2009), and a constructed variable
named yr0609. Yr0609 took on the value of 0 for years
between 1983 and 2005, and then the value for year-2005 for
August 2012 1087THOGMARTIN ET AL.—WHITE-NOSE SYNDROME AND INDIANA BATS

years 2005 to 2009. This creates an inflection point at 2005,
where the fitted line was allowed to change slope. The
estimated coefficient corresponding to yr0609 is the estimated
change in the baseline trend estimated from 1983 to 2005.
Because the yr0609 estimate is relative to the 1983–2005 trend
estimate, if the 1983–2005 trend estimate is greater than the
yr0609 coefficient, the coefficient for yr0609 will be negative
even if the population is increasing. Conversely, if the
population from 2005–2009 is estimated to be decreasing,
but decreasing at a slower rate than 1983–2005, the coefficient
for yr0609 will be positive. Thus, the actual trend for 2005–
2009 is the sum of the 1983–2005 trend and the coefficient
yr0609 for the period 2005–2009.
The linear trend for each hibernaculum was estimated with
WinBUGS 1.4 (Lunn et al. 2000) using R2WinBUGS (Sturtz
et al. 2005) in the R statistical language (R Development Core
Team 2010). WinBUGS is a statistical package conducting
Bayesian inference with Markov chain Monte Carlo methods
(Gibbs sampling; Link et al. 2002; Ntzoufras 2009). We
modeled with noninformative, or flat, priors (Link and Barker
2010). The coefficient parameters were given diffuse (essen-
tially flat) normal distributions with mean of 1 and variance
equal to 1,000. The precision on error was gamma distributed
with shape and scale equal to 0.1. For each model, we ran three
chains for 60,000 iterations, discarding the first 40,000
iterations as burn-in and thinning by 5 to reduce serial
correlation (Link et al. 2002, Lunn et al. 2000). We used the
Gelman–Rubin convergence diagnostic to identify whether the
chains had converged for each of the main model parameters
(Ntzoufras 2009).
Of 462 hibernacula, 222 had estimable coefficients with
standard errors for year and yr0609. Trends were inestimable
when either the hibernaculum was no longer occupied in winter
(n¼106) or had too few surveys to calculate model coefficients
(n ¼ 116); of wintering populations with inestimable trends,
sums of counts from 1983–2009 averaged 178 bats (some of
FIG. 1.—Historical hibernacula (in black) of Indiana bats in the United States, primarily associated with karst formations (gray), plotted by
recovery unit and color-coded to reflect aggregations (or complexes) of hibernacula within 10-mile proximity. An additional buffer extends 25
miles around each hibernacula alluding to further potential connectedness of hibernacula.
1088 Vol. 93, No. 4JOURNAL OF MAMMALOGY

the larger hibernacula were not revisited or were only recently
discovered). It was the 222 hibernaculum-level estimates that
were then used for the aggregations of trend at complex,
recovery unit, and species level. If a hibernaculum did not have
an estimable regression with standard errors, it had zero weight
in aggregated estimates irrespective of the historically observed
number of bats.
We defined complexes of hibernacula as a means of
mitigating influences of interhibernaculum movement on trend
estimation. This interhibernaculum movement (immigration/
emigration) can yield rates of population change for individual
wintering populations that are outside of that expected from a
closed population (W. E. Thogmartin et al., in litt). A complex
was defined as a collection of hibernacula within a 10-mile
buffer of any other historical hibernaculum, irrespective of
whether it was in present-day use. This distance was ad hoc but
for our purposes yielded sensible rates of change (i.e., k� 2).
The nonzero weights for each hibernaculum were calculated
within each complex by dividing each hibernaculum mean
population size by the total mean population size within that
complex. Four time periods were investigated for their effect
on these weights: 1983–2002, 1983–2009, 1997–2005, and
2006–2009. There were no appreciable differences in weights
regardless of time period used, so the period 1983–2005 was
used because it represents a baseline (prewhite–nose syn-
drome) mean condition.
Once weights were calculated, coefficients for the intercept,
year, and yr0609 were combined as a weighted mean by
complex level. Coefficients were assumed to be uncorrelated
normal random variables with the standard error reported in the
lm summary in R. Aggregated parameter means were then the
sum of weights times each parameter estimate, and aggregated
parameter variances were calculated by summing squares of
the standard error multiplied by squares of the weights.
Standard errors of aggregated parameters were square roots of
these variances.
In our analysis, we assumed that there exists within each
hibernaculum a linear relationship between year and
log(countþ1) with normal random error, with an inflection
point at 2005. The linear relationship assumption within
hibernaculum was checked by visual inspection, and was
deemed reasonable for most hibernacula. Although resulting
trend estimates are a useful first approximation, it should be
noted that temporal correlation of the counts was ignored. It is
likely, therefore, that standard error estimates are too small.
Another assumption is that hibernaculum counts were
observed from a closed population, even though we know this
is not true since bats are known to occasionally change
hibernacula. We assessed the consequence of this assumption
by removing demographically impossible counts and reana-
lyzing trend with these data points removed (,2% of all
counts). We found a negligible influence on higher-level
estimates of trend resulting from extreme fluctuations in counts
caused by immigration, primarily because these changes
generally affect only the smallest wintering populations.
Model coefficients are not straightforward in their interpre-
tation given their logarithmic nature. Thus, we expressed
estimates of population trend as percent annual change (with
95% CIs), where percent annual change¼ (exp[year coefficient
from log-linear regression] � 1) 3 100%.
RESULTS
Hibernacula.—Wintering populations in the Ozark-Central
Recovery Unit before white-nose syndrome exhibited a median
decline of 9% (95% CI¼�4,�13%) between 1983 and 2005.
Conversely, wintering populations in Appalachian (þ8% [3,
14%]) and Northeastern (þ16% [3, 30%]) Recovery Units
increased. Wintering populations in the core of the species
range, the Midwest Recovery Unit, exhibited no credible
change (þ0.5% [�1, þ3%]). This pattern in population trends
suggested a west-to-east gradient (Fig. 2). This increasing trend
from west to east was more obvious when wintering
populations were combined via a population-weighted
average to the complex level (Fig. 2), with trends in each
recovery unit credibly different from its neighboring unit
except for Appalachian and Northeast units (Table 1).
With the onset of white-nose syndrome (2006–2009), the
species exhibited a 10.3% median annual decline from the
earlier rate of change (95% CI¼�21.1,þ2.0%). However, it is
not certain that this annual decline after 2005 can be explained
wholly by white-nose syndrome at our level of examination, as
spatial patterns in trends indicated considerable declines in
abundance not apparently associated with the occurrence of
this disease (e.g., in Tyson Quarry, St. Louis County, Missouri;
Fig. 3). There were increasing populations of hibernating
Indiana bats in white-nose syndrome-affected counties, as well
(i.e., Skinner Hollow, Bennington County, Vermont, and
Bellamy, Montgomery County, Tennessee).
For the 16 largest hibernacula, comprising more than 80% of
the estimated population, 10 of 16 exhibited a reduction in the
hibernating population since 2006, even in areas where white-
nose syndrome was absent (Appendix II). The largest
hibernaculum, Twin Domes in Harrison, Indiana, began with
~83,000 hibernating bats and declined to ~49,000 hibernating
bats by 2005, and thereafter declined precipitously to ~17,000
hibernating bats by 2009. Conversely, Ray’s Cave in Greene,
Indiana, the 2nd-largest hibernaculum, increased from
~17,000 to ~72,000 between 1983 and 2005, and then began
to decline (this decline may have begun as early as 1998), with
a current population somewhere on the order of 54,000
hibernating bats. Wyandotte Cave in Crawford, Indiana also
experienced a great increase in abundance, increasing from
~5,000 to ~52,000 hibernating bats; after 2005 the increase
ameliorated with a 2009 population on the order of ~46,000
bats.
Recovery unit.—Recovery considerations for the Indiana bat
under the Endangered Species Act are determined for
populations within recovery units. The Midwest Recovery
Unit possessed the largest population over the interval 1983–
2009 (Fig. 4); although the median population estimates over
August 2012 1089THOGMARTIN ET AL.—WHITE-NOSE SYNDROME AND INDIANA BATS

FIG. 2.—Mean (95% confidence interval) hibernacula and complex trend and changes in trend estimates plotted by recovery unit. Note differing
ordinate. Recovery units are Ozark-Central (1), Midwest (2), Appalachian (3), and Northeast (4).
TABLE 1.—Mean parameter estimates (intercept, 1983–2003 trend, and 2003–2009 trend) for hibernacula, complex, and recovery unit levels
(with 95% confidence intervals). n is the number of hibernacula per recovery unit contributing to the hibernacula trend estimates.
Recovery
unit (n)
Hibernacula Complex Recovery unit
Intercept 1983–2005 2006–2009 Intercept 1983–2005 2005–2009 Intercept 1983–2005 2005–2009
1 (57) 4.65
(�0.56, 11.81)
�0.06
(�0.47, 0.27)
�0.11
(�1.29, 0.99)
7.29
(0.88, 11.10)
�0.06
(�0.24, 0.28)
�0.11
(�0.32, 0.08)
9.15
(8.26, 10.04)
�0.09
(�0.14, �0.04)
�0.06
(�0.35, 0.23)
2 (101) 4.74
(�0.76, 9.91)
�0.0004
(�0.26, 0.26)
�0.01
(�0.84, 1.15)
7.59
(1.51, 10.43)
�0.002
(�0.19, 0.05)
�0.02
(�0.37, 2.50)
9.65
(9.39, 9.91)
�0.01
(�0.01, 0.03)
�0.09
(�0.21, 0.03)
3 (49) 2.25
(�0.40, 6.63)
0.02
(�0.12, 0.16)
�0.07
(�0.59, 0.70)
5.20
(�1.29, 7.96)
�0.10
(�0.03, 0.18)
�0.20
(�0.53, 0.19)
6.73
(5.86, 7.59)
�0.08
(0.03, 0.13)
�0.15
(�0.70, 0.40)
4 (14) 2.70
(�1.41, 7.56)
0.11
(�0.0003, 0.31)
�0.46
(�1.85, 0.001)
4.59
(�1.79, 7.50)
�0.13
(0.02, 0.20)
�0.52
(�2.06, �0.04)
5.92
(3.62, 8.22)
�0.15
(0.03, 0.27)
�0.53
(�0.93, �0.13)
1090 Vol. 93, No. 4JOURNAL OF MAMMALOGY

FIG. 3.—Hibernacula trends pre- and postonset of white-nose syndrome. Larger-sized bubbles denote greater trend magnitude; warmer colors
denote negative trends; cooler colors denote positive trends. Scale is equivalent in both panels. White-nose syndrome-affected counties are shown
in light red with postonset hibernacula trend estimates.
August 2012 1091THOGMARTIN ET AL.—WHITE-NOSE SYNDROME AND INDIANA BATS
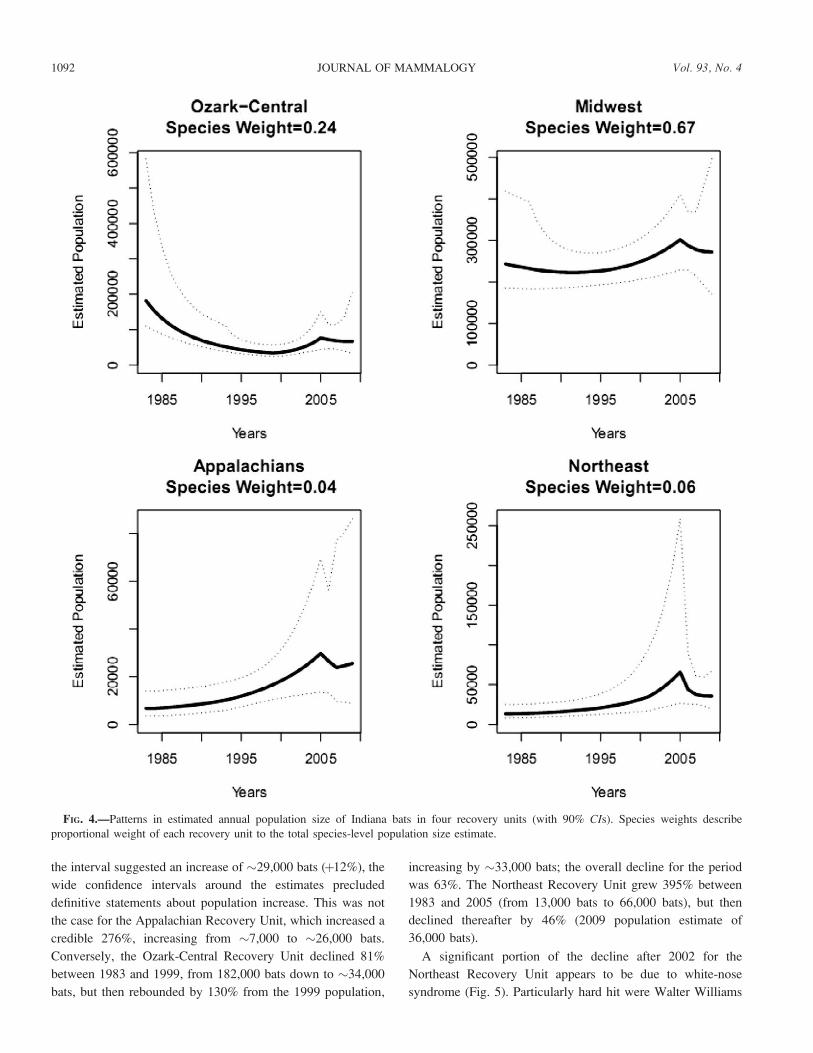
the interval suggested an increase of ~29,000 bats (þ12%), the
wide confidence intervals around the estimates precluded
definitive statements about population increase. This was not
the case for the Appalachian Recovery Unit, which increased a
credible 276%, increasing from ~7,000 to ~26,000 bats.
Conversely, the Ozark-Central Recovery Unit declined 81%
between 1983 and 1999, from 182,000 bats down to ~34,000
bats, but then rebounded by 130% from the 1999 population,
increasing by ~33,000 bats; the overall decline for the period
was 63%. The Northeast Recovery Unit grew 395% between
1983 and 2005 (from 13,000 bats to 66,000 bats), but then
declined thereafter by 46% (2009 population estimate of
36,000 bats).
A significant portion of the decline after 2002 for the
Northeast Recovery Unit appears to be due to white-nose
syndrome (Fig. 5). Particularly hard hit were Walter Williams
FIG. 4.—Patterns in estimated annual population size of Indiana bats in four recovery units (with 90% CIs). Species weights describe
proportional weight of each recovery unit to the total species-level population size estimate.
1092 Vol. 93, No. 4JOURNAL OF MAMMALOGY

Preserve Mine (possessing 26.1% of the recovery unit
population) and Williams Lake Mine (1.5%) in a 5-hibernac-
ulum complex in Ulster County, New York, a complex
comprising approximately 67% of the Northeast Recovery Unit
population. These populations declined by 90% (95% CI¼ 78–
97%) and 84% (22–99%), respectively. Infection in a 55-
hibernaculum complex in a 12-county area of Virginia and
West Virginia also appears to have stalled a growing
population in the Appalachian Recovery Unit.
Species.—The species exhibited a nonsignificant 0.5%
annual decrease (95% CI ¼�2.8, þ1.8%) between 1983 and
2005 (Fig. 6). On the basis of years for which we had the most
survey information, 2004–2006, we predicted annual species
population sizes of 432,720 (278,026–907,156), 473,537
(285,375–1,130,074), and 429,573 (292,339–712,898)
hibernating Indiana bats, respectively (Table 2). In 2005,
1983, and 2009, estimates were the 1st, 2nd, and 7th highest
median population sizes, respectively, for the period. The mean
probability of the species exceeding the recovery criteria
population size of 457,000 bats in any year was 20.5%.
DISCUSSION
The range-wide population of Indiana bat appears to have
been in a stationary state for at least 2 decades before the onset
of white-nose syndrome. White-nose syndrome has caused
regional decline of Indiana bats in the northeastern United
States, and halted a population increase in the Appalachians,
but the species-wide population size has not credibly declined.
Thus, as of 2009, the disease does not appear to be sufficiently
prevalent across the core portion of the species range to alter
species status.
Even in the Northeast Recovery Unit where the species was
first and most afflicted by white-nose syndrome, some
wintering populations experienced increases in abundance.
There are at least two possible reasons for this increase. Indiana
bats may have continued the prewhite-nose syndrome pattern
FIG. 5.—Patterns in population change (with 95% confidence intervals) for 2 hibernacula complexes known to be affected by white-nose
syndrome; the change point in these particular models were fit to the year of known infection as opposed to year 2005.
August 2012 1093THOGMARTIN ET AL.—WHITE-NOSE SYNDROME AND INDIANA BATS

of increase in areas unaffected by disease. Alternatively, bats
aroused from hibernation have been recorded switching
hibernacula in the midst of winter likely in response to
disturbance (Elder and Gunier 1978). The increases we
observed in wintering populations in the Northeast Recovery
Unit may be the mass movement of individuals to as-yet-
unaffected hibernacula. Unfortunately, the lack of information
on interhibernacula movement in Myotis species, let alone
Indiana bats, precludes us from distinguishing between these
hypotheses.
There was some evidence of a west-to-east gradient in
population trends, possibly indicating a north and eastward
movement in species range during the period of our
observations. An increasing number of species are exhibiting
shifts in range, often in association with changes in climate
(Parmesan et al. 1999; Parmesan and Yohe 2003; Root et al.
2003; Walther et al. 2001, 2002). Both Frick et al. (2010b) and
Adams (2010) indicated that higher precipitation was related
strongly to higher bat reproduction, with Adams (2010)
suggesting that these relations may lead to distributional
changes in an altered climate. Humphries et al. (2002)
described how warming winters may lead to increased
overwinter survival in the northern portion of bat species
ranges. Increased precipitation in the eastern United States
since about 1970 coupled with warming winter conditions
(Hayhoe et al. 2007; Karl and Knight 1998; McCabe and
Wolock 2002) may allow for higher reproduction and winter
survival in the Northeast Recovery Unit. Under a regime of
increasing temperature and precipitation (Hayhoe et al. 2007;
Najjar et al. 2000), conditions in the northeast are expected to
continue improving for bats (Robinson et al. 2005). The
decrease in the Ozark-Central Recovery Unit could be climate
mediated as well, but lack of similar declines in the Midwest
Recovery Unit and in southern portions of the Appalachian
Recovery Unit argues against latitudinally related climate
characteristics (such as temperature) and instead favors
longitudinal changes in precipitation gradients as the cause
for declines in the southwestern portion of the species range.
Other nonclimate-related factors, such as gating of cave
entrances, altered forest conditions, or loss of habitat from
urbanization, are also likely to play a role in regional gradients
in trend (Jones et al. 2009; United States Fish and Wildlife
Service 2007), possibly one larger than climate. For instance,
reduced insect prey accompanying widespread intensification
of agricultural practices is one potential culprit for declines in
the Ozark-Central and Midwest Recovery Units (Boyles et al.
2011; Kunz et al. 2011; Wickramasinghe et al. 2003, 2004).
Recently, renewable energy generation has resulted in the
erection of thousands of wind turbines in the midwestern
United States, resulting in significant mortality of both migrant
and resident bats (Arnett et al. 2008; Johnson et al. 2002; Kunz
et al. 2007); few Indiana bats, however, have ever been
recorded dying from wind turbine collision and to our
knowledge no assessment of the species-level consequences
of wind generation has been conducted for Indiana bats. If
spatially and temporally varying covariates were available,
examining these various causal factors in the context of the
hierarchical log-linear models we used would allow us to
FIG. 6.—Predicted patterns in total annual population size of
Indiana bats between 1983 and 2009 (with 90% CI). The dashed
horizontal line is the recovery criteria for this species, 457,000 bats.
TABLE 2.—Annual estimated population size for Indiana bats
between 1983 and 2009.
Year Mean 2.5% confidence level 97.5% confidence level
1983 368,547 247,350 1,022,807
1984 339,960 237,329 778,866
1985 322,553 232,567 630,927
1986 307,881 226,033 856,380
1987 299,935 225,479 654,191
1988 292,417 224,234 540,295
1989 281,720 220,235 457,614
1990 273,771 217,662 409,226
1991 267,804 215,780 376,652
1992 263,391 214,376 381,704
1993 268,375 217,358 463,292
1994 266,990 217,288 385,867
1995 268,175 217,604 364,950
1996 279,927 224,112 388,422
1997 283,794 225,260 393,182
1998 290,654 227,581 410,188
1999 309,988 235,412 459,961
2000 324,143 240,666 504,157
2001 349,323 250,627 575,879
2002 372,195 259,819 649,742
2003 399,172 269,591 752,208
2004 432,720 278,026 907,156
2005 473,537 285,375 1,130,074
2006 429,573 292,339 712,898
2007 407,026 271,965 709,385
2008 383,207 233,865 808,103
2009 377,124 195,398 957,348
1094 Vol. 93, No. 4JOURNAL OF MAMMALOGY

examine their potential contributions to population trends
(Thomson et al. 2010).
There are a few important points to make regarding our use
of change-point analyses. Variances estimated around the
change point (year 2005) increased considerably relative to
other years to accommodate inflections in trend. The
magnitude of this variance is symptomatic of the magnitude
of the change in trend between the pre- and postwhite-nose
syndrome periods. Further, our log-linear regression approach
ably accommodated the .80% of the population occurring in
hibernacula comprised of .1,000 individuals. This approach
works less well for estimating small wintering populations
because of the high influence these hibernacula experience
from immigration and emigration. Our hierarchical method of
combining hibernaculum counts into complex, recovery unit,
and species-level estimates led to a smoothing of the trend,
reducing the impact of this interhibernaculum movement on the
estimation process. But if the focus of trend estimation is at the
scale of the hibernaculum rather than coarser scales, then
methods will need to be implemented that can accommodate:
the irregular nature of survey effort, especially as hibernaculum
size decreases; the neighborhood context of wintering
populations; potentially abundant zero or near-zero counts;
and, possibly, a flexible (spatiotemporally varying) change
point. Hierarchical Bayesian count models with random effects
for year and the error term (to accommodate overdispersion
likely to occur in the smallest populations) are a good direction
for future study (Link and Sauer 2002). A state–space
formulation, which separates the observation process from
the demographically determined population process, would
help distinguish between environmental (process) and obser-
vational (nonprocess) sources of error (Dennis et al. 2006).
Nonprocess error resulting from uncertainty in the observed
counts may be reduced through incorporation of relevant
covariates and smoothing of the random effect for year.
Potential covariates to consider for modeling this observation
process might include, for instance, survey-specific measures
of observer effort, observer-generated levels of disturbance,
cave complexity, air and substrate temperatures, and packing
densities (Hayes et al. 2009; Tuttle 2003).
Our trend and population estimates have important implica-
tions for the federally endangered status and recovery
considerations of Indiana bats. The United States Fish and
Wildlife Service developed a plan to recover the species to a
size sufficient for removal from the Endangered Species Act
list (United States Fish and Wildlife Service 2007). We found
that only in the year before the onset of white-nose syndrome
(2005) did the mean estimate of Indiana bats exceed the
recovery criterion of 457,000 individuals. Given our wide
confidence intervals, we calculated that this criterion was
exceeded with a probability of 20.5%. Our model-based results
for the largest wintering populations are also quite comparable
with those identified in the Recovery Plan (Table 3; United
States Fish and Wildlife Service 2007, table 2), with 1
TABLE 3.—Winter population estimates for Priority 1A (n¼ 16) and 1B (n¼ 7) Indiana bat hibernacula as described in the draft recovery plan
(United States Fish and Wildlife Service 2007, table 2). All P1 hibernacula (n ¼ 23) have at some point in the recorded past had �10,000
hibernating Indiana bats and currently provide suitable winter habitat. P1A hibernacula have maintained a minimum of 5,000 Indiana bats during
the last 10 years, whereas P1B hibernacula have not met this criterion in the last 10þ years.
State County Hibernaculum Priority
Maximum estimate
since 1960
Recovery plan
2005 estimate
Model-based
2005 estimate
Illinois Alexander Magazine Mine P1A 33,500 33,500 49,354
Indiana Crawford Batwing Cave P1A 50,000 6,850 6,195
Indiana Crawford Wyandotte Cave P1A 54,913 54,913 52,343
Indiana Greene Ray’s Cave P1A 62,464 54,325 72,442
Indiana Harrison Jug Hole Cave P1A 29,430 29,430 28,918
Indiana Harrison Twin Domes Cave P1A 100,000 36,800 48,585
Indiana Monroe Coon Cave P1A 10,675 9,270 11,531
Indiana Monroe Grotto Cave P1A 10,338 9,875 6,613
Kentucky Carter Bat Cave P1A 100,000 29,500 25,039
Kentucky Edmonson Dixon Cave P1A 16,550 3,100 3,206
Missouri Iron Pilot Knob Mine P1A 139,000 50,550 Inestimablea
Missouri Washington Great Scott Cave P1A 85,700 6,450 5,115
New York Ulster Walter Williamms Preserve Mine P1A 11,394 11,394 28,716
New York Ulster Williams Hotel Mine P1A 15,438 15,438 18,366
Tennessee Blount White Oak Blowhole Cave P1A 12,500 7,861 5,965
West Virginia Pendleton Hellhole Cave P1A 11,890 11,890 20,233
Kentucky Edmonson Coach Cave P1B 100,000 - 8
Kentucky Edmonson Long Cave P1B 7,600 1,153 622
Kentucky Letcher Line Fork Cave P1B 10,000 1,844 1,314
Missouri Crawford Onyx Cave P1B 12,850 180 92
Missouri Franklin Copper Hollow Sink Cave P1B 21,000 250 114
Missouri Pulaski Brooks Cave P1B 19,461 70 93
Missouri Pulaski Ryden Cave P1B 10,539 10 3
a Hazardous conditions precluded safe entry into this hibernaculum, preventing winter surveys. Fall surveys at the entrance to this mine, however, suggested that large numbers of bats
existed until recent years (Clawson 2002, Elliott and Kennedy 2008).
August 2012 1095THOGMARTIN ET AL.—WHITE-NOSE SYNDROME AND INDIANA BATS

exception. We excluded an important wintering population,
Pilot Knob Mine in Missouri. The Recovery Plan assumed a
population size of 50,500 individuals for this hibernaculum,
constituting .10% of the estimated range-wide population. We
were unable to include Pilot Knob Mine in our analyses
because hazardous conditions would not allow safe surveying
in winter until very recently (Clawson 2002; Elliott 2008;
Elliott and Kennedy 2008), resulting in too few surveys for
inclusion in our estimation process. If we add 50,500 bats to
each year over the period of analysis, we find that the mean
estimate of Indiana bats exceeded the recovery criterion for 4
years, 2004–2007; it should be noted, however, that Elliott and
Kennedy (2008) reported a much lower estimate of Indiana
bats by 2008, 1,678 bats, so our model-based estimate for 2005
is likely the only year in which we can be confident that
Indiana bats met the recovery goal. With the recent discovery
of white-nose syndrome in the core of the species’ range,
subsequent population estimates are not likely to reach this
recovery criterion any time soon.
ACKNOWLEDGMENTS
We extend our appreciation to those who diligently collect
information on hibernating bats, without whose effort this study
would not be possible. We appreciate the comments on an early draft
of this manuscript provided by W. R. Elliott, L. E. Ellison, L. Robbins,
and an anonymous reviewer. Any use of trade, product, or firm names
are for descriptive purposes only and do not imply endorsement by the
United States Government.
LITERATURE CITED
ADAMS, R. A. 2010. Bat reproduction declines when conditions mimic
climate change projections for western North America. Ecology
91:2437–2445.
ARNETT, E. B., ET AL. 2008. Patterns of bat fatalities at wind energy
facilities in North America. Journal of Wildlife Management 72:61–
78.
ARROYO-CABRALES, J., AND S. TICUL ALVAREZ CASTANEDA. 2008. Myotis
sodalis. In IUCN 2010. IUCN red list of threatened species. Version
2010.2. www.iucnredlist.org. Accessed 21 July 2010.
BLEHERT, D. S., ET AL. 2009. Bat white-nose syndrome: an emerging
fungal pathogen. Science 323:227.
BLEHERT, D. S., J. M. LORCH, A. E. BALLMANN, P. M. CRYAN, AND C. U.
METEYER. 2011. Bat white-nose syndrome in North America.
Microbe 6:267–273.
BOYLES, J. G., P. M. CRYAN, G. F. MCCRACKEN, AND T. H. KUNZ. 2011.
Economic importance of bats in agriculture. Science 332:41–42.
CLAWSON, R. L. 2002. Trends in population size and current status. Pp.
2–8 in The Indiana bat: biology and management of an endangered
species (A. Kurta and J. Kennedy, eds.). Bat Conservation
International, Austin, Texas.
DENNIS, B., M. J. PONCIANO, S. R. LELE, M. L. TAPER, AND D. F.
STAPLES. 2006. Estimating density dependence, process noise, and
observation error. Ecological Monographs 76:323–341.
ELDER, W. H., AND W. J. GUNIER. 1978. Sex ratios and seasonal
movements of gray bats (Myotis grisescens) in southwestern
Missouri and adjacent states. American Midland Naturalist
99:463–472.
ELLIOTT, W. R. 2008. Gray and Indiana bat population trends in
Missouri. Proceedings of the National Cave and Karst Management
Symposium 18:46–61.
ELLIOTT, W. R., AND J. KENNEDY. 2008. Status of the Indiana Bat,
Myotis sodalis, in Pilot Knob Mine, Iron County, Missouri, 2008.
Final report to the United States Fish & Wildlife Service, Pilot
Knob National Wildlife Refuge.
ELLISON, L. E., T. J. O’SHEA, M. A. BOGAN, A. L. EVERETTE, AND D. M.
SCHNEIDER. 2003. Existing data on colonies of bats in the United
States: summary and analysis of the U.S. Geological Survey’s bat
population database. Pp. 127–237 in Monitoring trends in bat
populations of the United States and Territories: problems and
prospects (T. J. O. Shea and M. A. Bogan, eds.). United States
Geological Survey, Biological Resources Discipline, Information
and Technology Report USGS/BRD/ITR-2003-0003, Reston,
Virginia.
FATH, J. A. 2002. An overview of hibernacula in Illinois, with
emphasis on Magazine Mine. Pp. 110–115 in The Indiana bat:
biology and management of an endangered species (A. Kurta and J.
Kennedy, eds.). Bat Conservation International, Austin, Texas.
FOLEY, J., D. CLIFFORD, K. CASTLE, P. CRYAN, AND R. S. OSTFELD. 2011.
Investigating and managing the rapid emergence of white-nose
syndrome, a novel, fatal, infectious disease of hibernating bats.
Conservation Biology 25:223–231.
FRICK, W. F., ET AL. 2010a. An emerging disease causes regional
population collapse of a common North American bat species.
Science 329:679–682.
FRICK, W. F., D. S. REYNOLDS, AND T. H. KUNZ. 2010b. Influence of
climate and reproductive timing on demography of little brown
myotis Myotis lucifugus. Journal of Animal Ecology 79:128–136.
GARDNER, J. E., AND E. A. COOK. 2002. Seasonal and geographic
distribution and quantification of potential summer habitat. Pp. 9–
20 in The Indiana bat: biology and management of an endangered
species (A. Kurta and J. Kennedy, eds.). Bat Conservation
International, Austin, Texas.
HAYES, J. P., H. K. OBER, AND R. E. SHERWIN. 2009. Survey and
monitoring of bats. Pages 112–129 in Ecological and behavioral
methods for the study of bats (T. H. Kunz and S. Parsons, eds.).
Johns Hopkins University Press, Baltimore, Maryland.
HAYHOE, K., ET AL. 2007. Past and future changes in climate and
hydrological indicators in the US Northeast. Climate Dynamics
28:381–407.
HUMPHRIES, M. M., D. W. THOMAS, AND J. R. SPEAKMAN. 2002.
Climate-mediated energetic constraints on the distribution of
hibernating mammals. Nature 418:313–316.
JOHNSON, G. D., W. P. ERICKSON, M. D. STRICKLAND, M. F. SHEPHERD,
D. A. SHEPHERD, AND S. A. SARAPPO. 2002. Mortality of bats at a
large-scale wind power development at Buffalo Ridge, Minnesota.
American Midland Naturalist 150:332–342.
JONES, G., D. S. JACOBS, T. H. KUNZ, M. R. WILLIG, AND P. A. RACEY.
2009. Carpe noctem: the importance of bats as bioindicators.
Endangered Species Research 8:93–115.
KARL, T. R., AND R. W. KNIGHT. 1998. Secular trend of precipitation
amount, frequency, and intensity in the United States. Bulletin of
the American Meteorological Society 79:231–242.
KUNZ, T. H. 2003. Censusing bats: challenges, solutions, and sampling
biases. Pp. 9–21 in Monitoring trends in bat populations of the
United States and Territories: problems and prospects (T. J. O.’Shea
and M. A. Bogan, eds.). United States Geological Survey,
Biological Resources Discipline, Information and Technology
Report USGS/BRD/ITR-2003-0003, Reston, Virginia.
1096 Vol. 93, No. 4JOURNAL OF MAMMALOGY

KUNZ, T. H., ET AL. 2007. Ecological impacts of wind energy
development on bats: questions, research needs, and hypotheses.
Frontiers in Ecology and the Environment 5:315–324.
KUNZ, T. H., E. BRAUN DE TORREZ, D. BAUER, T. LOBOVA, AND T. H.
FLEMING. 2011. Ecosystem services provided by bats. Annals of the
New York Academy of Sciences 1223:1–38.
LINK, W. A., AND R. J. BARKER. 2010. Bayesian inference, with
ecological applications. Elsevier/Academic, Boston, Massachusetts.
LINK, W. A., E. CAM, J. D. NICHOLS, AND E. G. COOCH. 2002. Of BUGS
and birds: a Markov Chain Monte Carlo for hierarchical modeling
in wildlife research. Journal of Wildlife Management 66:277–291.
LINK, W. A., AND J. R. SAUER. 2002. A hierarchical analysis of
population change with application to Cerulean Warblers. Ecology
83:2832–2840.
LUNN, D. J., A. THOMAS, N. BEST, AND D. SPIEGELHALTER. 2000.
WinBUGS—a Bayesian modelling framework: concepts, structure,
and extensibility. Statistics and Computing 10:325–337.
MCCABE, G. J., AND D. M. WOLOCK. 2002. A step increase in
streamflow in the conterminous United States. Geophysical
Research Letters 29:2185–2188.
NAJJAR, R. G., ET AL. 2000. The potential impacts of climate change on
the mid-Atlantic coastal region. Climate Research 14:219–233.
NTZOUFRAS, I. 2009. Bayesian modeling using WinBUGS. Wiley,
Hoboken, New Jersey.
PARMESAN, C., ET AL. 1999. Poleward shifts in geographical ranges of
butterfly species associated with regional warming. Nature
399:579–583.
PARMESAN, C., AND G. YOHE. 2003. A globally coherent fingerprint of
climate change impacts across natural systems. Nature 421:37–42.
R DEVELOPMENT CORE TEAM. 2010. R: a language and environment for
statistical computing. R Foundation for Statistical Computing,
Vienna, Austria.
ROBINSON, R. A., ET AL. 2005. Climate change and migratory species.
BTO Research Report No. 414. Defra, London, United Kingdom.
ROOT, T. L., J. T. PRICE, K. R. HALL, S. H. SCHNEIDER, C. ROSENZWEIG,
AND J. A. POUNDS. 2003. Fingerprints of global warming on wild
animals and plants. Nature 421:57–60.
SPEAKMAN, J. R., P. I. WEBB, AND P. A. RACEY. 1991. Effects of
disturbance on the energy expenditure of hibernating bats. Journal
of Applied Ecology 28:1087–1104.
STURTZ, S., W. LIGGES, AND A. GELMAN. 2005. R2WinBUGS: a
package for running WinBUGS from R. Journal of Statistical
Software 12:1–16.
THOMAS, D. W. 1995. Hibernating bats are sensitive to nontactile
human disturbance. Journal of. Mammalogy 76:940–946.
THOMAS, D. W., M. DORAIS, AND J. BERGERON. 1990. Winter energy
budgets and cost of arousals for hibernating little brown bats,
Myotis lucifugus. Journal of Mammalogy 71:475–479.
THOMSON, J. R., ET AL. 2010. Bayesian change point analysis of
abundance trends for pelagic fishes in the upper San Francisco
Estuary. Ecological Applications 20:1431–1448.
TOMS, J. D., AND M. L. LESPERANCE. 2003. Piecewise regression: a tool
for identifying ecological thresholds. Ecology 84:2034–2041.
TURNER, G. G., D. M. REEDER, AND J. T. H. COLEMAN. 2011. A five-
year assessment of mortality and geographic spread of white-nose
syndrome in North American bats and a look to the future. Bat
Research News 52:13–27.
TUTTLE, M. D. 2003. Estimating population sizes of hibernating bats in
caves and mines. Pp. 31–40 in Monitoring trends in bat populations
of the United States and Territories: problems and prospects (T. J.
O.’Shea and M. A. Bogan, eds.). United States Geological Survey,
Biological Resources Division, Information and Technology Report
USGS/BRD/ITR-2003-0003, Reston, Virginia.
UNITED STATES FISH AND WILDLIFE SERVICE. 2007. Indiana bat (Myotis
sodalis) draft recovery plan: first revision. United States Fish and
Wildlife Service, Fort Snelling, Minnesota.
WALTHER, G.-R., C. A. BURGA, AND P. J. EDWARDS. 2001.
‘‘Fingerprints’’ of climate change—adapted behaviour and shifting
species ranges. Kluwer Academic/Plenum Publishers, New York.
WALTHER, G.-R., ET AL. 2002. Ecological responses to recent climate
change. Nature 416:389–395.
WICKRAMASINGHE, L. P., S. HARRIS, G. JONES, AND N. V. JENNINGS.
2004. Abundance and species richness of nocturnal insects on
organic and conventional farms: effects of agricultural intensifica-
tion on bat foraging. Conservation Biology 18:1283–1292.
WICKRAMASINGHE, L. P., S. HARRIS, G. JONES, AND N. VAUGHAN. 2003.
Bat activity and species richness on organic and conventional
farms: impact of agricultural intensification. Journal of Applied
Ecology 40:984–993.
Submitted 18 October 2011. Accepted 17 January 2012.
Associate Editor was Richard D. Stevens.
APPENDIX ICollation of wintering population counts of Indiana bats.—In
1995, the Indiana Bat Recovery Team requested distributional data in
a letter sent to consultants, researchers, and authorities on endangered
species in 28 states (Gardner and Cook 2002). From the responses
received from this data request and other published and unpublished
records, Gardner and Cook (2002) developed a range-wide database of
county distributional records for the Indiana bat and used geographical
information system (GIS) software (ArcInfot and ArcViewt,
Environmental Systems Research Institute, Redlands, California) to
produce seasonal distribution maps. In June 2005, the United States
Fish and Wildlife Service’s Bloomington Field Office e-mailed an
Indiana bat hibernaculum data request to over 75 individuals,
including service biologists, recovery team members, bat
researchers, state and federal agency biologists, consultants, and
other bat conservation partners in 27 states, who in turn forwarded the
request to other colleagues. Hibernaculum data were received from all
27 states. Bloomington Field Office biologists used the combined
responses from the 1995 and 2005 data requests, existing recovery
team records, and other published and unpublished records (Clawson
2002, Ellison et al. 2003) to develop a GIS-based hibernaculum
database containing detailed information for all known (i.e., current
and historic) hibernacula with one or more Indiana bat winter
occurrence records (curated by A. King). The Bloomington Field
Office also requested recovery team members and service biologists
from across the species’ range to provide updates to summer and
winter distribution maps of Gardner and Cook (2002) during an
Indiana Bat Risk Assessment Workshop in March 2005 and
subsequent e-mails sent after the close of the 2005 summer
reproductive season. All distribution records/maps have been
updated through at least October 2006 but more are added as
information becomes available. Since 2005, A. King has sent out a
biennial data request to bat biologists throughout the Indiana bat’s
range, collated resulting population data, and published a range-wide
population estimate every 2 years thereafter.
August 2012 1097THOGMARTIN ET AL.—WHITE-NOSE SYNDROME AND INDIANA BATS

APPENDIX II
Annual observed Indiana bat hibernaculum counts between 1983
and 2009, with the fitted change-point regression lines (and 95%
confidence intervals [CI]). Hibernaculum name, county, state, and
numeric identifiers are provided; the numeric identifiers identify
recovery unit (1¼Ozark-Central, 2¼Midwest, 3¼Appalachian, and
4 ¼ Northeast) and hibernaculum. Sample size (n surveys), recovery
unit population weight, and species-level population weight are also
provided. Weight is the contribution of the hibernaculum count to the
total annual estimated population size of Indiana bats between 1983
and 2003. Only hibernacula with populations averaging .400 bats are
shown. A quasi-extinction level of 250 bats is shown in some plots
with a dashed horizontal line; the vertical dashed line indicates the
year (2005) of the fixed change point. Figures supporting this
appendix are available online.
1098 Vol. 93, No. 4JOURNAL OF MAMMALOGY