population genetics, ecogenomics and physiological mechanisms of
TRANSCRIPT

Population genetics, ecogenomics and
physiological mechanisms of adaptation of
Daphnia to cyanobacteria
Inaugural-Dissertation
zur
Erlangung des Doktorgrades
der Mathematisch-Naturwissenschaftlichen Fakultät
der Universität zu Köln
vorgelegt von
Christian Küster
aus Engelskirchen
Uni-Druck, Köln
Köln 2012

Berichterstatter: Prof. Dr. Eric von Elert
Prof. Dr. Hartmut Arndt
�
�
�
�
�
�
�
�
�
�
�
�
�
�
�
�
�
Tag der mündlichen Prüfung: 18.01.2013

“Doppelpass alleine? Vergiss es!“
Lukas Podolski


Table of contents
Table of contents
General introduction and aim of the study 7
1) Seasonal dynamics of sestonic protease inhibition: impact on Daphnia populations
12
Introduction 14
Materials & methods 16
Results 19
Discussion 25
References 30
Supporting material 34
2) High-resolution melting analysis: a genotyping tool for population studies on Daphnia
38
Introduction 40
Materials & methods 43
Results 46
Discussion 51
References 55
3) Interspecific differences between D. pulex and D. magna in sensitivity to cyanobacterial protease inhibitors
59
Introduction 61
Materials & methods 63
Results 67
Discussion 71
References 75
4) Rapid evolution revealed by dormant eggs: physiological mechanisms
79
Introduction 81
Materials & methods 84
Results 89
Discussion 96
References 101

Table of contents
Concluding remarks and perspectives 106
General references 112
Abstract 116
Zusammenfassung 118
Record of achievement 121
Erklärung (gemäß § 4 Abs 1 Punkt 9) 122
Acknowledgements 123
Curriculum vitae 125
List of publications 126

General introduction
7
General introduction and aim of the study
Members of the genus Daphnia belong to the order Cladocera, and their body sizes
ranges from 0.2 mm to 5 mm in length. 150 different species of Daphnia occur in almost all
limnic ecosystems, ranging from acidic swamps to deep permanent lakes, shallow temporary
ponds and even to side arms of streams and rivers. Daphnia are unselective filter feeders
and are typically the major herbivorous grazers of algae, (cyano)bacteria and protozoa.
Depending on the Daphnia species, the size of the ingestible food particles ranges from 0.1
µm to 55 µm, representing the mean mesh size of the filter combs and the size of the
carapace gape (Geller & Müller 1981; Gophen & Geller 1984). Daphnia are a major prey of
planktivorous fish and invertebrate predators and thus provide an important link in the
transfer of carbon and energy from primary producers (phytoplankton) to higher trophic
levels. However, in eutrophic lakes this transfer is often constrained rather by food quality
than by food quantity: The phytoplankton of eutrophic lakes and thus the major food source
for Daphnia is often dominated by bloom-forming and/or filamentous cyanobacteria (Schreurs
1992), which are also associated with harmful effects to human health and livestock
(Carmichael 1994). Due to the formation of colonies and filaments, the particle size of
cyanobacteria often exceeds 55 µm and is therefore not an available carbon source for
Daphnia. Especially large-bodied Daphnia species, such as Daphnia magna and Daphnia
pulex, suffer from clogging of their filtering apparatus and increase rejection rates when
feeding on filamentous cyanobacteria (DeMott et al. 2001). Daphnia have to cope with
cyanobacteria especially in late summer and early fall (Sommer et al. 1986), when the
temperature of the epilimnion reaches its maximum (Jöhnk et al. 2008). During such times,
cyanobacterial mass developments of the genera Microcystis, Anabaena, Oscillatoria,
Planktothrix or Limnothrix have become a wide-spread phenomenon in freshwater
ecosystems (Dokulil & Teubner 2000).
The causes for the constrained carbon transfer from cyanobacteria to Daphnia have been
extensively investigated in the past decades. At least three major properties of cyanobacteria
may contribute to their relatively poor quality as a food source for Daphnia: As already
outlined above, bloom-forming cyanobacteria often exhibit filaments or colonies that can
interfere with the filtering apparatus of Daphnia (Porter & Mcdonough 1984), which has been
suggested as a strategy to escape from zooplankton grazing in eutrophic lakes (i.e.
(Ghadouani et al. 2003). In addition, cyanobacteria lack sterols and have a low content of
polyunsaturated fatty acids. This cyanobacterial deficiency in essential lipids leads to
reduced somatic and population growth of Daphnia due to constrained carbon assimilation

General introduction
8
(Von Elert 2002; Von Elert et al. 2003; Martin-Creuzburg & Von Elert 2004; Martin-Creuzburg
et al. 2008). Finally, many cyanobacteria produce secondary metabolites that are toxic for
Daphnia and can thus reduce the fitness of Daphnia in terms of survival, growth and
reproduction (Lürling & van der Grinten 2003; Rohrlack et al. 2003; Von Elert et al. 2012).
Besides microcystins, which belong to the group of heptapeptides and which are the most
extensively studied class of cyanobacterial toxins (Sivonen & Jones 1999; Rohrlack et al.
2001), the role of cyanobacterial protease inhibitors has recently become a focus of attention.
The most abundant protease inhibitors are depsipeptides that contain the modified amino
acid 3-amino-6-hydroxy-2-piperidone (Von Elert et al. 2005). More than twenty
depsipeptides, isolated from a wide range of cyanobacterial genera, have been described as
protease inhibitors, specifically inhibiting the serine proteases chymotrypsin or trypsin
(Gademann & Portmann 2008). Both digestive enzymes account for more than 80% of the
proteolytic activity in the gut of D. magna (Von Elert et al. 2004) and are verified as targets
for an inhibition by cyanobacterial inhibitors (Agrawal et al. 2005; Schwarzenberger et al.
2010). However, D. magna clones can respond to cyanobacterial inhibitors by remodeling
their digestive enzymes and by an elevated expression of respective protease genes (Von
Elert et al. 2012; Schwarzenberger et al. 2010). A study by Czarnecki et al. (2006) has
demonstrated that the potential of natural seston to inhibit trypsins is comparable to that of
pure cultures of cyanobacteria, which suggests that inhibition of Daphnia�s proteases is not
confined to experiments with cyanobacterial cultures as food but occurs also in nature.
However, Czarnecki et al. (2006) investigated lake seston that was sampled only at one
particular date and thus this study did not account for possible seasonal and inter-annual
fluctuations of cyanobacterial protease inhibition in Daphnia.
Chapter 1 examines the question whether the inhibitory potential of natural seston on
Daphnia�s trypsins and chymotrypsins changes seasonally. Additionally, I have investigated
whether seasonally fluctuating protease inhibition might have impacts on the genetic diversity
and the tolerance to cyanobacterial protease inhibitors of a co-occurring Daphnia population.
In order to test this, seston from a hypereutrophic pond was sampled regularly over two
successive years and analyzed for its potential to inhibit proteases of a single clone of D.
magna under standardized laboratory conditions. Simultaneously, I isolated D. magna clones
at two times within one season, measured the clonal diversity of the sub-population via
microsatellite analyses and subsequently used these established clones for growth
experiments on diets differing in the amount of cyanobacterial protease inhibitors. I
hypothesized that seasonally fluctuating sestonic protease inhibition had led to an increase of
the mean tolerance of the Daphnia population to cyanobacteria with protease inhibitors.

General introduction
9
Several studies have already shown that Daphnia individuals or populations are able to adapt
to the presence of toxin-producing cyanobacteria (i.e. Gustafsson & Hansson 2004). Sarnelle
& Wilson (2005) suggested that D. pulicaria populations, exposed to high cyanobacterial
levels over long periods of time, can adapt in terms of being more tolerant to dietary toxic
cyanobacteria. However, chapter 1 considered for the first time the possibility of rapid
adaptation of a natural Daphnia population to the occurrence of sestonic protease inhibition
within one season. Specifically, I hypothesized that Daphnia clones isolated after the
seasonal peak of sestonic protease inhibition would be more tolerant to cyanobacterial
protease inhibitors than clones isolated before the peak.
Adaptation of Daphnia populations to environmental stressors is typically a result of
microevolutionary processes. Concomitant with the occurrence of cyanobacteria in a lake
natural selection favors those Daphnia genotypes that are better adapted to constraints
associated with increased cyanobacterial abundances. The investigation of the origin and the
persistence of genetic variation, which in itself is a precondition of evolutionary processes,
provides a feasible possibility to understand how species and populations have evolved in
response to selection. In Daphnia several target genes that are probably involved in the
response to cyanobacterial toxins have been identified so far (i.e. Pflugmacher et al. 1998;
Schwarzenberger et al. 2010). However, the variation of these target genes in natural
Daphnia populations differing with respect to the coexistence with cyanobacteria has not
been studied yet. The screening of target genes of whole populations is a crucial
precondition to identify those functional phenotypes of expressed target genes that cause the
difference between tolerant and sensitive Daphnia genotypes. In chapter 2 I demonstrate
that high resolution melting analysis (HRMA) is a cost-effective and powerful tool for the rapid
screening and genotyping of target genes from large numbers of Daphnia individuals. As a
proof of principle for HRMA I have analyzed digestive trypsins of two D. magna populations
from different habitats. The trypsin genes chosen for chapter 2 have been shown to be
active in the gut of D. magna and thus constitute possible targets for an interference with
cyanobacterial trypsin inhibitors (Schwarzenberger et al. 2010). Both D. magna populations
probably differed in their experience with respect to cyanobacteria. One population originated
from a pond containing toxic cyanobacteria that possibly produce protease inhibitors and the
other from a pond without such cyanobacteria. I first sequenced pooled genomic PCR
products of digestive trypsins genes from both populations to identify variable DNA-
sequences. In a second step, those variable DNA-sequences of trypsin loci were screened
for SNPs in each D. magna clone from both populations using HRMA. The hypothesis was

General introduction
10
that D. magna clones from ponds with cyanobacteria have undergone selection by these
inhibitors, which has led to different trypsin alleles.
Besides the analyses of differences of the tolerance to cyanobacterial protease inhibitors
within (chapter 1) and among (chapter 2) Daphnia populations, chapter 3 covers the issue
of potential interspecific differences between two Daphnia species (D. magna and D. pulex). I
assumed that D. magna coexist more frequently with cyanobacteria than D. pulex does. This
putatively more frequent coexistence of cyanobacteria and D. magna might have resulted in
an increased tolerance of D. magna to cyanobacterial protease inhibitors. Seven clones each
of D. magna and D. pulex were isolated from different habitats in Europe and North America.
In order to test for interspecific differences in tolerance to cyanobacteria, somatic and
population growth rates on varying concentrations of two cyanobacterial strains were
determined for each D. magna and D. pulex clone. Both cyanobacterial strains contained
either chymotrypsin or trypsin inhibitors, but no microcystins. Possible differences in
tolerance to cyanobacterial protease inhibitors might have several causes, for which I have
tested in the chapter 3: (1) I hypothesized that high growth rates on cyanobacterial diets
might result from high specific protease activities; therefore I determined the specific trypsin
and chymotrypsin activity of each of the investigated D. magna and D. pulex clones. (2) I
assumed that a higher sensitivity of Daphnia�s gut proteases might cause reduced somatic
and population growth rates for diets with cyanobacterial protease inhibitors. Therefore I
compared the sensitivity of gut chymotrypsins and trypsins to the respective cyanobacterial
protease inhibitors among the different clones of each Daphnia species.
After considering various aspects of Daphnia�s tolerance to cyanobacterial protease
inhibitors within (chapter 1) and among populations (chapter 2) as well as between two
species (chapter 3), a different perspective is taken in chapter 4, which deals with
anthropogenic long-term effects on D. galeata in Lake Constance. Due to intensive
agriculture, phosphorus-containing detergents and the growing industry the total phosphorus
(Ptot) concentration of Lake Constance increased more than ten-fold in the middle of the last
century. Thus, Lake Constance underwent a period of eutrophication from the mid 1950s to
mid 1980s leading to pronounced changes in the taxonomical composition of the
phytoplankton community (Kümmerlin 1998). During the course of eutrophication,
cyanobacterial genera became abundant in Lake Constance, while formerly dominating
diatom species nearly vanished (Kümmerlin 1998). Due to a subsequent decline of the
anthropogenic phosphorus input since 1980, concentrations of Ptot decreased over time
(Güde et al. 1998). In the meantime Lake Constance has undergone the process of re-
oligotrophication and has become an oligotrophic one (Kümmerlin 1998); the re-

General introduction
11
oligotrophication went along with declining relative abundances of cyanobacteria in the
phytoplankton community. Concomitant with changes in the phytoplankton community
(Weider et al. 1997) noted significant genotypic shifts in the co-occurring D. galeata
population in Lake Constance. Hairston et al. (1999, 2001) have shown that these shifts went
along with an increase of the mean tolerance of the D. galeata population to cyanobacteria.
However, it remained unclear which target genes and metabolic pathways of the D. galeata
population were directly affected by the appearance of cyanobacteria during eutrophication.
In order to identify the physiological mechanisms and target genes underlying the increased
mean tolerance to cyanobacteria I have analyzed in chapter 4 the genome of three D.
galeata populations of Lake Constance via next-generation sequencing. D. galeata resting
eggs were isolated from three different layers of sediment cores, representing the time
before, during and after the peak of the eutrophication of Lake Constance. The extracted
DNA from individual resting eggs was pooled for each population separately. The genomic
DNA of each population was subsequently analyzed via next-generation sequencing to
determine the genetic diversity of the D. galeata population and to identify those genes and
pathways that were mainly influenced by these environmental changes mentioned above.
Taken together, the four chapters of the present study cover the influence of
cyanobacteria on Daphnia populations from different perspectives. Several studies have
already described differences in Daphnia�s tolerance to cyanobacteria, but just a few have
dealt with the question, which particular genes and metabolic pathways in Daphnia were
affected by the presence of cyanobacteria. The present study considers various aspects of
Daphnia�s tolerance to cyanobacteria within and between populations as well as between two
Daphnia species and tries to shed light onto the physiological mechanisms of Daphnia�s
adaptation to cyanobacterial toxins in natural populations.

12
Chapter 1
Seasonal dynamics of sestonic protease inhibition:
impact on Daphnia populations

Chapter 1�
13
Abstract
Daphnia populations often show rapid microevolutionary adaptation to environmental
changes. Here we investigated the possibility that microevolution of Daphnia populations
could be driven by natural sestonic protease inhibition (PI). We hypothesized that PI changes
seasonally, which might lead to concomitant changes in tolerance to PI in a co-occurring
Daphnia magna population. To test this, seston from a eutrophic pond was sampled regularly
over two successive years. Extracts of these freeze-dried samples were used to determine
their inhibitory potential (IP) on D. magna gut proteases. In the summer seston the IP against
chymotrypsins exceeded that of spring seston 200-fold. To test for possible impacts on the
co-existing D. magna population, we isolated clones before (spring) and after (fall) the peak
of the IP. Microsatellite analyses revealed that the two subpopulations were genetically
distinct. Individual exposure of three clones from each population to varying concentrations of
a cyanobacterium that contains chymotrypsin inhibitors revealed a decrease in population
and somatic growth rate for each clone, but no seasonal effects on Daphnia�s tolerance. To
include maternal effects we conducted a multi-clonal competition experiment on various
cyanobacterial concentrations. However, no evidence for seasonally increased tolerance of
D. magna to dietary protease inhibitors could be found.

Chapter 1
14
Introduction
Due to anthropogenic phosphorus loading, many lakes have undergone a period of
eutrophication in the last decades (Correll 1998; Daniel et al. 1998). The phytoplankton of
eutrophic lakes is usually dominated by bloom-forming species of cyanobacteria of the
genera Microcystis, Planktothrix, Limnothrix, Anabaena or Oscillatoria (Dokulil & Teubner
2000; Schreurs 1992). A considerable accumulation of cyanobacterial biomass can be
observed in late summer and early fall (Sommer et al. 1986), when the temperature of the
epilimnion reaches its maximum (Jöhnk et al. 2008). Abundances of zooplankton, especially
of non-selective filter feeders such as Daphnia (one of the main grazers of cyanobacteria),
are highly influenced by the presence of cyanobacteria. The increasing dominance of
cyanobacteria has been claimed to be a major factor leading to the decline in Daphnia
abundances within and between lakes (Threlkeld 1979; Hansson et al. 2007). Although
Daphnia populations and individuals can adapt to the presence of cyanobacteria by
developing a higher tolerance to the occurrence of cyanobacteria (Gustafsson & Hansson
2004; Hairston et al. 1999; Hairston et al. 2001; Sarnelle & Wilson 2005), the traits underlying
this adaptation have not yet been fully elucidated.
The causes for the poor assimilation of cyanobacterial carbon by Daphnia have been
studied extensively in past decades. Three major food quality constraints have been
revealed: (1) Cyanobacteria can be filamentous or colonial; both forms lead to mechanical
interferences with the filtering process of daphnids (Porter & Mcdonough 1984). (2)
Cyanobacteria lack sterols and have a low polyunsaturated fatty acid content; both are
essential for Daphnia nutrition (Von Elert 2002; Von Elert et al. 2003). In Daphnia, this
deficiency in lipids leads to reduced somatic growth and reproduction of daphnids due to
constrained carbon assimilation (Von Elert & Wolffrom 2001; Martin-Creuzburg & Von Elert
2004; Martin-Creuzburg et al. 2008). (3) Many cyanobacterial strains also contain toxins such
as microcystins, which have a negative effect on the fitness of Daphnia (Sivonen & Jones
1999; Rohrlack et al. 2001). However, a microcystin-free cyanobacterial strain of the genus
Microcystis resulted in reduced growth of Daphnia, even though mechanical interferences
and lipid deficiency could be excluded as causal factors (Lürling 2003). The reduced growth
rates might be explained by the presence of other secondary metabolites in cyanobacteria
that inhibit survival, growth, reproduction and/or feeding of Daphnia (Lürling & van der
Grinten 2003; Rohrlack et al. 2003). Among such secondary metabolites, protease inhibitors
are reported from a wide range of genera of marine and freshwater cyanobacteria. More than
twenty depsipeptides which act as protease inhibitors have been described from different
cyanobacteria genera (Gademann & Portmann 2008). Most of these depsipeptides

Chapter 1�
15
specifically inhibit the serine proteases chymotrypsin or trypsin: These two digestive
enzymes are responsible for 80% of the proteolytic activity in the gut of Daphnia magna (Von
Elert et al. 2004), and several studies indicate that cyanobacterial protease inhibitors directly
inhibit digestive proteases of Daphnia (Agrawal et al. 2005; Schwarzenberger et al. 2010). A
study by Czarnecki et al. (2006) has shown that the potential of natural seston to inhibit
Daphnia trypsins is comparable to the inhibitory potential of various Microcystis strains. This
makes it reasonable to assume that the interference of cyanobacterial protease inhibitors
with digestive proteases of Daphnia, which had thus far only been demonstrated in
cyanobacterial strains, occurs in nature as well. Blom et al. (2006) recently showed that
Daphnia sp. coexisting with Planktothrix rubescens, a cyanobacterium that contains the
trypsin inhibitor oscillapeptin J, are significantly less sensitive to oscillapeptin J than Daphnia
sp. from lakes free of this cyanobacterium. Considering the finding that almost 60% of 17
water blooms of cyanobacteria contained protease inhibitors (Agrawal et al. 2001), it is thus
reasonable to assume that increased tolerance to cyanobacteria in Daphnia populations may
be caused by enhanced tolerance to the cyanobacterial protease inhibitors. As a
consequence, the question arises as to whether this increased tolerance at the population
level is caused by a constant selection pressure due to cyanobacterial protease inhibitors or
by a short-term bottleneck effect due to the seasonal occurrence of cyanobacteria.
We hypothesized that, in accordance with the seasonal succession of phytoplankton, the
potential of the edible fraction of a natural seston to inhibit digestive trypsins and
chymotrypsins in Daphnia would vary with season. This seasonality would result in increased
frequencies of Daphnia genotypes with enhanced tolerance to cyanobacterial protease
inhibitors.
In the present study we investigated whether the potential of the natural seston to inhibit
the proteases trypsin and chymotrypsin in D. magna changed seasonally. Furthermore we
determined the clonal diversity of two D. magna samples, isolated before and after the
maximum of inhibitory potential in the seston, by using microsatellites in order to detect
concurrent changes in the corresponding D. magna population. Additionally, we conducted
growth experiments with single D. magna clones from each of the two samples on treatments
differing in the content of cyanobacteria with protease inhibitors. To investigate competitive
interactions and maternal effects at different cyanobacterial protease inhibitor concentrations,
we also performed a multi-clone experiment with the same clones over many generations.
Specifically, our predictions were that: (1) The potential of natural seston to inhibit
Daphnia chymotrypsins and trypsins changes seasonally. In accordance with the seasonal

Chapter 1
16
occurrence of cyanobacteria, we expect a higher potential of the seston to inhibit proteases
in fall than in spring; (2) D. magna clones from the fall are more tolerant to cyanobacterial
protease inhibitors, which results in higher growth rates on cyanobacterial diets in single-
clone experiments. Potential costs of this adaption might result in lower growth rates and
fitness on non-cyanobacterial diets. (3) D. magna clones from the fall show higher clonal
frequency in multi-clonal experiments on a cyanobacterial diet containing protease inhibitors
than clones from the spring.
Material and methods
Origin and cultivation of organisms
Two species of phytoplankton were used in the somatic and population growth
experiments as well as in the competition experiment: The cyanobacterium Microcystis
aeruginosa NIVA Cya 43 (Culture Collection of Algae, Norwegian Institute for Water
Research) was grown in 2 l chemostates in sterile Cyano medium (Von Elert & Jüttner, 1997)
at a dilution rate of 0.1 d-1 (20°C; illumination: 40 µmol m-2 s-1).The green algae
Chlamydomonas sp. (Strain 56, culture collection of the Limnological Institute at the
University of Constance) was grown in 5 l semi-continuous batch cultures (20°C; illumination:
120 µmol m-2 s-1) by replacing 20% of the culture with fresh sterile Cyano medium every
Monday, Wednesday and Friday in the late exponential phase of the culture.
The D. magna clones were isolated from the Aachener Weiher (AaW; N50° 56' 2.40", E6°
55' 40.81"). The AaW is an urban pond of 0.04 km² and a maximum depth of 1.6 m. The AaW
has a Secchi depth of less than one meter, and is therefore classified as a hypertrophic lake
(Carlson 1977). Forty-seven D. magna clones were isolated on June 4, 2008 (spring
samples) and 43 clones on September 3, 2008 (fall samples). D. magna clone B used in the
enzyme assay originated from the Großer Binnensee, a lake in Germany (Lampert &
Rothhaupt 1991). All clones of D. magna were cultured separately in aged, membrane-
filtered tap water and fed with saturating concentrations of C. sp. for at least three
generations.
Preparation of the seston samples
To test the potential of the edible fraction of seston (< 55 µm) in the AaW to inhibit
proteases, samples were taken at constant intervals from spring to fall in 2007 and 2008.

Chapter 1�
17
Fifty to 80 l of surface water was screened with a 55 µm mesh. In the discharge the
particulate fraction was then gently concentrated using a hollow-fiber filtration technique (A/G
Technology Corp. Needham, CFP-1-D-6a, 0.1 µm mesh size). The final volume of
approximately 0.8 l was frozen at -20°C and freeze-dried (Christ LOC-1m, LPHA 1-4).
Lyophilized seston was subsequently homogenized using a mortar and pestle. The resulting
powder was thoroughly mixed. 50 mg and 100 mg of freeze-dried natural seston were
suspended in 500 µl of 60% methanol and sonicated for 15 min followed by centrifugation (3
min at 104 x g). The extract was separated from the residue, and the supernatant was used in
the protease assay.
Protease assays
The activities of trypsins and chymotrypsins of D. magna clone B were measured as
according to (Von Elert et al. 2004). Six-day-old individuals were each transferred to 5 µl (per
animal) of cold (0°C) 0.1 M phosphate buffer (pH 7.5) containing 2 mM dithiothreitol (DTT) on
ice. 2 mM DTT in the incubation buffer was used as according to Johnston et al. (1995).
Individuals were homogenized with a Teflon pestle, the homogenate was centrifuged (3 min
at 1.4 x 10⁴ x g), and the supernatant was used immediately in the enzyme assay. SuccpNA
(N-succinyl-L-alanyl-L-alanyl-L-prolyl-L-phenylalanine 4-nitroanilide, Sigma, 125 µM) was
used as a substrate for chymotrypsins, while BapNA (N-R-benzoyl-DL-arginine 4-nitroanilide
hydrochloride, Sigma, 1.8 mM) served as a substrate for trypsins. Trypsin and chymotrypsin
assays were performed in a potassium phosphate buffer (0.1 M, pH 7.5). The absorption was
measured continuously for 10 min at time intervals of 30 sec at 30°C at 390 nm with a Cary
50 photometer (Varian, Palo Alto, USA). Absorption increased linearly with time in all assays.
The relevant parameter for the enzyme assays was the inhibition potential of the seston
samples. To ensure comparable conditions for all protease assays, we normalized the
protease activities to the same conversion rate of respective substrates prior to the addition
of aliquots of the seston extracts. Five to 20 µl of different concentrations of each extracted
seston biomass were tested for inhibition, whereas controls with 20 µl of 60% methanol had
no effects on protease activities. The resulting protease activities were plotted as a function
of extracted seston biomass. By fitting a sigmoidal dose response curve, the extracted
biomass that resulted in a 50% inhibition of Daphnia protease activity (IC50) was calculated.
Low IC50 values of the analyzed samples indicated a high inhibitory potential.

Chapter 1
18
Microsatellite analyses
The population structure of the spring and the fall D. magna populations were analyzed
using polymerase chain reactions (PCR) of six polymorphic microsatellite loci with
subsequent DNA fragment length analyses. The PCR assay for each D. magna clone was
performed in a final volume of 50 µl containing 50 ng of genomic DNA, 0.2 µM of respective
forward and reverse primer (Table 1), 0.2 mM of dNTPs, 2.5 units of Taq-DNA polymerase (5
Prime, Gaithersburg, USA) and 5 µl of corresponding 10x PCR buffer (5 Prime, Gaithersburg,
USA). Cycling parameters were 95°C for 5 min to activate the DNA polymerase followed by
35 cycles of denaturation for 30 s at 95°C, annealing for 30 s at respective primer Ta (Table
1) and 30 s elongation at 72°C. Final elongation was performed afterwards for 10 min at
72°C. After checking the success of the amplification via agarose gel electrophoresis, DNA
fragment length analyses were performed with a 3730 DNA Analyzer (Applied Biosystems,
Foster City, USA).
Table 1 Microsatellite loci used to genotype the D. magna clones, the respective forward and
reverse sequences, GenBank accession number and the corresponding annealing
temperatures (Ta).
Locus Primer Sequences [5� - 3�] GenBank accession Ta [°C]
DMA 12 F: AGCCAATCATCAATTCCCTC AF2919121 58 R: AAGGTCCGAATTGGATTACG
DMA 3 F: AAAGGAAAGCAACCGCTGC AF2919101 58
R: AAAAGGAAGGGGAATTACCC
DMA 14 F: GGGCAAGACACAGGTGC AF2919131 58
R: TGGCGGCATGCTGTCTAC
DP 162 F: CGAATCCGTTCGTCAAAAGC wfms00001662 58
R: TGGCGGCATGCTGTCTAC
S6-38 F: GATGTCTTGCATCAACAGTG S6-383 49
R: AGTCAAAGGTATGACTCACC
DMA 15 F: GTGTATTCTAAAATCGAATTTCG EU1313631 50
R: ACGTCAATGATCTTATTATACC
1developed by John Colbourne, unpublished 2Colbourne et al. (2004) 3Ortells et al. (2012)
Chapter 1�
19
Results
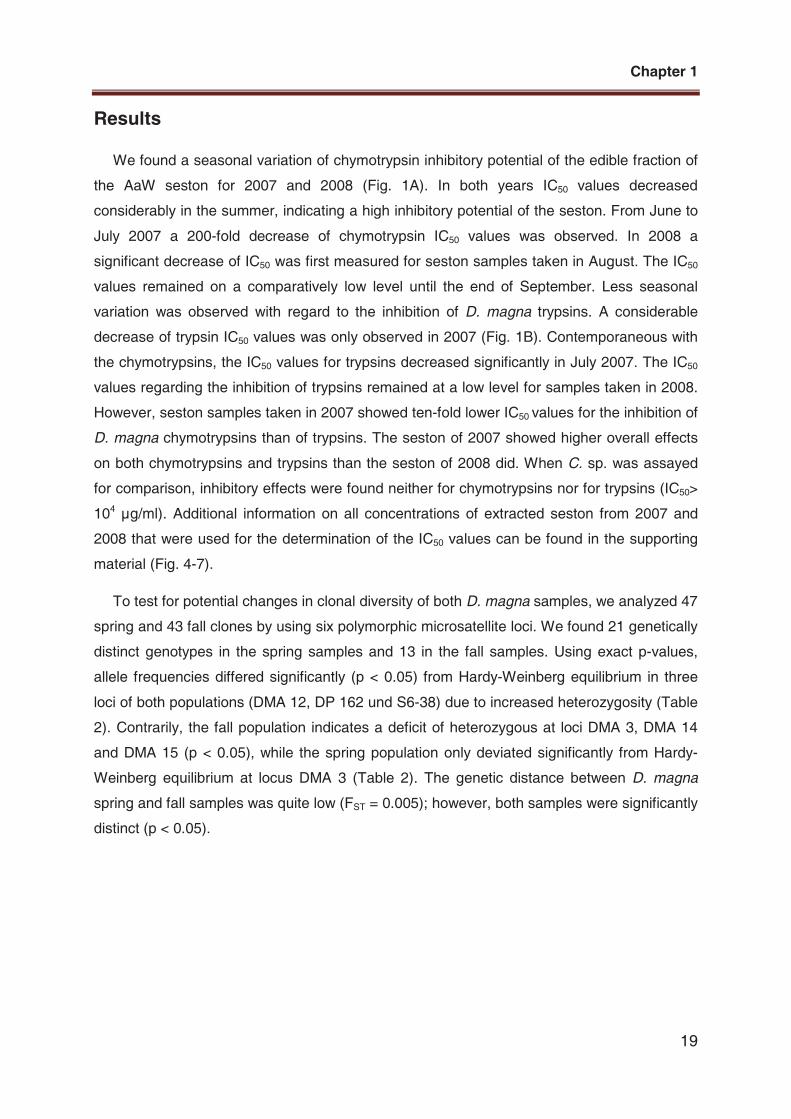
We found a seasonal variation of chymotrypsin inhibitory potential of the edible fraction of
the AaW seston for 2007 and 2008 (Fig. 1A). In both years IC50 values decreased
considerably in the summer, indicating a high inhibitory potential of the seston. From June to
July 2007 a 200-fold decrease of chymotrypsin IC50 values was observed. In 2008 a
significant decrease of IC50 was first measured for seston samples taken in August. The IC50
values remained on a comparatively low level until the end of September. Less seasonal
variation was observed with regard to the inhibition of D. magna trypsins. A considerable
decrease of trypsin IC50 values was only observed in 2007 (Fig. 1B). Contemporaneous with
the chymotrypsins, the IC50 values for trypsins decreased significantly in July 2007. The IC50
values regarding the inhibition of trypsins remained at a low level for samples taken in 2008.
However, seston samples taken in 2007 showed ten-fold lower IC50 values for the inhibition of
D. magna chymotrypsins than of trypsins. The seston of 2007 showed higher overall effects
on both chymotrypsins and trypsins than the seston of 2008 did. When C. sp. was assayed
for comparison, inhibitory effects were found neither for chymotrypsins nor for trypsins (IC50>
104 µg/ml). Additional information on all concentrations of extracted seston from 2007 and
2008 that were used for the determination of the IC50 values can be found in the supporting
material (Fig. 4-7).
To test for potential changes in clonal diversity of both D. magna samples, we analyzed 47
spring and 43 fall clones by using six polymorphic microsatellite loci. We found 21 genetically
distinct genotypes in the spring samples and 13 in the fall samples. Using exact p-values,
allele frequencies differed significantly (p < 0.05) from Hardy-Weinberg equilibrium in three
loci of both populations (DMA 12, DP 162 und S6-38) due to increased heterozygosity (Table
2). Contrarily, the fall population indicates a deficit of heterozygous at loci DMA 3, DMA 14
and DMA 15 (p < 0.05), while the spring population only deviated significantly from Hardy-
Weinberg equilibrium at locus DMA 3 (Table 2). The genetic distance between D. magna
spring and fall samples was quite low (FST = 0.005); however, both samples were significantly
distinct (p < 0.05).

Chapter 1
20
Sampling date
Jun Jul Aug Sep Oct
IC5
0 (
µg
/ml)
1
10
100
1000
10000
TrypsinsB)
IC5
0(µ
g/m
l)
1
10
100
1000
100002007
2008
ChymotrypsinsA)
Figure 1 Inhibition of digestive proteases from homogenates of D. magna clone B by dry
weight extracts of the edible fraction (< 55 µm) of seston of the AaW from different sampling
dates. Seston samples from 2007 (black circles) and 2008 (white squares) were assessed for
their effect on digestive chymotrypsins (A) and trypsins (B) of D. magna. Depicted are IC50
concentrations of extracted freeze-dried seston (± 95% CI). IC50 values indicate the inhibitory
potential of the seston sample. Low IC50 values indicate a high inhibitory potential of the
seston, which means that little freeze-dried seston was needed to inhibit 50% of D. magna
chymotrypsins. Non-overlapping 95% confidences intervals (CI) among two samples were
assumed as significantly different. 95% CI may appear asymmetric due to log-scale of IC50
values. Where error bars are not visible, the 95% CI are smaller than symbols.

Chapter 1�
21
Table 2 Observed (Ho) and expected (He) heterozygosity of the D. magna spring and fall
samples in six polymorphic microsatellite loci, according to Hardy-Weinberg equilibrium. N:
number of analyzed clones, Na: number of alleles. Significant differences at p < 0.05 (*) and p
< 0.01 (**).
Locus Population N Na He Ho p
DMA 12 Spring 47 3 0.595 0.766 0.00019** Fall 43 3 0.495 0.721 0.00011**
DMA 3 Spring 47 2 0.595 0.085 0.00000**
Fall 43 2 0.477 0.000 0.00000**
DMA 14 Spring 47 2 0.485 0.426 0.69900
Fall 43 2 0.385 0.512 0.04160*
DP 162 Spring 47 3 0.573 0.830 0.00033**
Fall 43 3 0.595 0.814 0.00013**
S6-38 Spring 47 2 0.374 0.489 0.04400*
Fall 43 2 0.484 0.791 0.00000**
DMA 15 Spring 47 2 0.446 0.425 0.0971
Fall 43 2 0.385 0.512 0.0415
We performed growth experiments using three different diets to check for possible
seasonal adaptation to chymotrypsin inhibition by the seston. Three genotypes of each D.
magna sample were kept on three different diets: Animals were fed either with pure C. sp. or
with one of two various mixtures of C. sp. and M. aeruginosa. We found an overall effect of
diet on somatic growth rates of each of the D. magna clones (Fig. 2A; ANOVA, S2: F2,6 =
678.4 ; p < 0.001; S7: F2,6 = 66.83 ; p < 0.001; S15: F2,6 = 251.8 ; p < 0.001, F3: F2,6 = 219,7;
p < 0.001; F11: F2,6 = 137.7; p < 0.001; F24: F2,6 = 1052.6; p < 0.001). Somatic growth rates
in M. aeruginosa treatments were significantly lower than in the control with pure C. sp. With
increasing M. aeruginosa concentration, the growth rates of all tested clones decreased
significantly (Tukey�s HSD, p < 0.05). Population growth (Fig. 2B) was also affected by diet
(ANOVA, S2: F2,6 = 144.5; p < 0.001; S7: F2,6 = 57.0; p < 0.001; S15: F2,6 = 7.33; p < 0.001;
F3: F2,6 = 28.7; p < 0.001; F11: F2,6 = 296.3; p < 0.001; F24: F2,6 = 227.6; p < 0.001). Similar
to the somatic growth rates, the population growth rates of clones F11, F24, S2 and S7
decreased significantly with increasing M. aeruginosa concentration (Tukey�s HSD, p < 0.05).
With regard to clones F3 and S15, only treatments with 20% M. aeruginosa resulted in lower
population growth rates. The factor �season� affected neither the somatic nor the population
growth rates.

Chapter 1
22
So
mati
c g
row
th r
ate
g (
1/d
)
0.0
0.2
0.4
0.6
AAA
B
C B
C
B
C
AA
A
B
C
B
C
B
C
A) 100 % C. sp.
90 % C. sp. + 10 % M. aeruginosa
80 % C. sp. + 20 % M. aeruginosa
D. magna clone
S2 S7 S15 F3 F11 F24
Po
pu
lati
on
gro
wth
rate
g (
1/d
)
0.0
0.1
0.2
0.3
B)
C
A
A
A
B
B
C
B
AB
A
A
AA
B
B
C
B
C
Figure 2 Somatic (A) and population (B) growth rates (mean ± SD, n=3) of D. magna clones
from the AaW on pure C. sp. and on two mixtures of C. sp. and M. aeruginosa. Clones
labeled with �S� and �F� were isolated in spring and fall, respectively. Different significance
levels (one Way ANOVA, Tukey�s HSD test, p < 0.05) within clones are indicated by different
letters.

Chapter 1�
23
Table 3 Results of repeated-measurement analyses of variances of D. magna clone
frequency in control and Microcystis treatment. Significant differences at p < 0.05 (*) and p <
0.01.
SS df F P
Clone S2
Treatment 0.002178 1 0.8252 0.393861
Error 0.018475 7
Time 0.064362 2 11.2087 0.001241**
Time x treatment 0.000936 2 0.1631 0.851125
Error 0.040195 14
Clone S7
Treatment 0.143614 1 5.67122 0.048779*
Error 0.177263 7
Time 0.019229 2 0.73833 0.495626
Time x treatment 0.004162 2 0.15980 0.853845
Error 0.182306 14
Clone S15
Treatment 0.085287 1 3.67251 0.096844
Error 0.162562 7
Time 0.016339 2 0.63204 0.546011
Time x treatment 0.004847 2 0.18750 0.831080
Error 0.180957 14
Clone F3
Treatment 0.004433 1 0.63738 0.450891
Error 0.048690 7
Time 0.014072 2 2.22842 0.144476
Time x treatment 0.000985 2 0.15592 0.857095
Error 0.044204 14
Clone F11
Treatment 0.005287 1 1.93804 0.206508
Error 0.019096 7
Time 0.008627 2 4.47832 0.031372*
Time x treatment 0.001802 2 0.93546 0.415606
Error 0.013484 14
Clone F24
Treatment 0.016051 1 0.6264 0.454665
Error 0.179381 7
Time 0.031368 2 0.5769 0.574439
Time x treatment 0.001483 2 0.0273 0.973145
Error 0.380612 14
Chapter 1
24
A)
Clo
ne f
req
uen
cy (
%)
0
10
20
30
40
100 % C. sp.
90 % C. sp. + 10 % M. aeruginosa
S2 B)
0
10
20
30
40
S7
C)
Clo
ne
fre
qu
en
cy (
%)
0
10
20
30
40
S15 D)
0
10
20
30
40
F3
E)
Time (day)
0 30 60 90
Clo
ne f
req
ue
ncy (
%)
0
10
20
30
40
F11 F)
Time (day)
0 30 60 900
10
20
30
40
F24
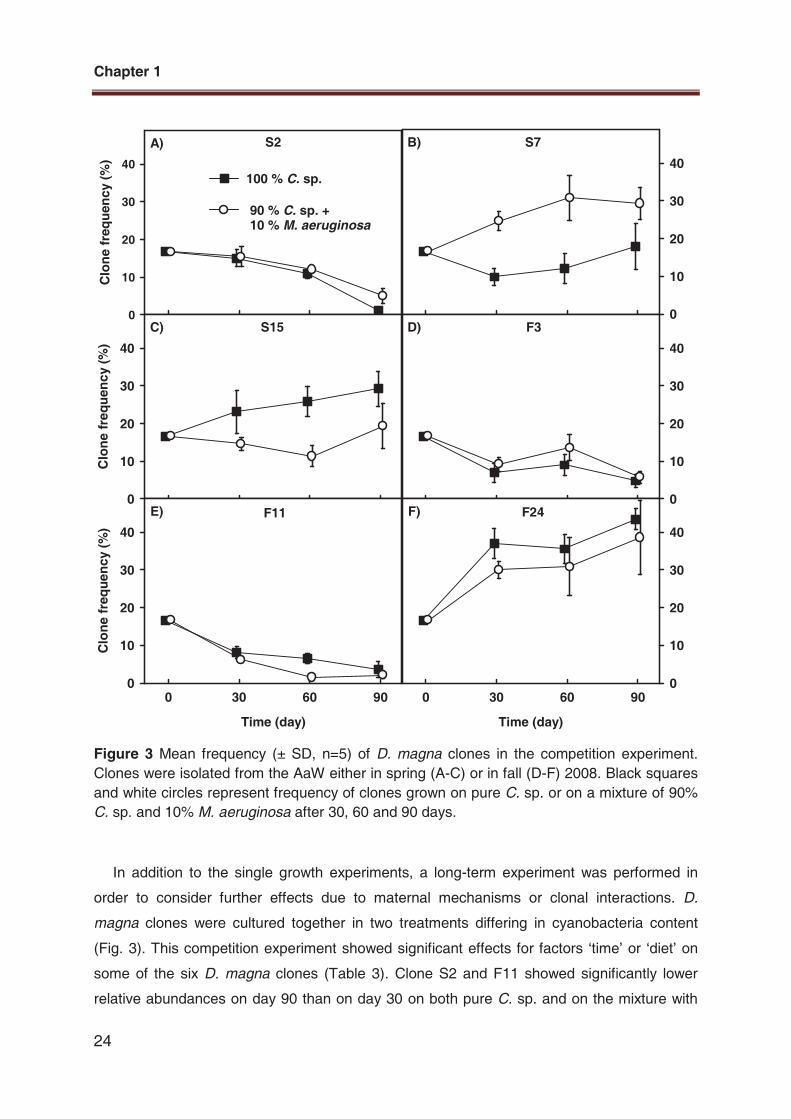
Figure 3 Mean frequency (± SD, n=5) of D. magna clones in the competition experiment.
Clones were isolated from the AaW either in spring (A-C) or in fall (D-F) 2008. Black squares
and white circles represent frequency of clones grown on pure C. sp. or on a mixture of 90%
C. sp. and 10% M. aeruginosa after 30, 60 and 90 days.
In addition to the single growth experiments, a long-term experiment was performed in
order to consider further effects due to maternal mechanisms or clonal interactions. D.
magna clones were cultured together in two treatments differing in cyanobacteria content
(Fig. 3). This competition experiment showed significant effects for factors �time� or �diet� on
some of the six D. magna clones (Table 3). Clone S2 and F11 showed significantly lower
relative abundances on day 90 than on day 30 on both pure C. sp. and on the mixture with

Chapter 1�
25
90% C. sp. and 10% M. aeruginosa (Fig. 3A, E). D. magna clone S7 was more abundant on
the M. aeruginosa mixture than on pure C. sp. (Fig. 3B). None of the factors �time�, �diet� and
�time x diet� had significant effects on clones S15, F3 and F24 (Fig. 3C, D, F) . To exclude
negative effects due to food quantity, the food concentration was always kept above 0.2 mg
C/l, the incipient limiting food level of D. magna (Porter et al. 1982).
Discussion
Czarnecki et al. (2006) have recently shown that the potential for natural lake seston to
inhibit trypsins of Daphnia was comparable to the potential of cultures of Microcystis sp. to
inhibit trypsins. The present study showed for the first time that natural lake seston can also
inhibit Daphnia chymotrypsins, which, in addition to trypsins, account for the largest
proportion of proteolytic activity in the gut of D. magna (Von Elert et al. 2004). With regard to
the well-known seasonal succession in the phytoplankton community (Sommer et al. 1986),
our study is the first to investigate seasonal changes of the potentials of a natural lake seston
to inhibit trypsins and chymotrypsins of D. magna. We focused on the seston fraction smaller
than 55 µm, which constitutes the edible size fraction for daphnids (Gophen & Geller, 1984;
Hessen, 1985), and found seasonal changes in the potential of the AaW seston to inhibit D.
magna chymotrypsins in each of two successive years. From the end of June to mid-July
2007, this inhibitory potential increased more than 200-fold within merely three weeks. We
found a similar pattern of chymotrypsin inhibition in 2008. Due to the lack of data about the
phytoplankton composition in the AaW, it remains unclear whether the increase of the
inhibitory potential was a consequence of a higher relative abundance of cyanobacteria
containing protease inhibitors. We cannot rule out the possibility that this increase resulted
from a relatively high cellular content of protease inhibitors within an otherwise unaltered
phytoplankton community. Such increases of the content of particular secondary metabolites
in response to growth conditions have already been demonstrated for microcystins in various
Microcystis strains (Long et al. 2001; Wiedner et al. 2003).
In parallel with seasonal changes in the potential of the phytoplankton to inhibit proteases,
the genetic structure of the D. magna population of the AaW changed in 2008. Microsatellite
analyses of D. magna clones established in the laboratory showed that the spring and fall
samples were genetically distinct. We found a decline in the number of D. magna genotypes
from spring to fall. Due to selective differences among Daphnia clones an erosion of clonal
diversity during the parthenogenetic phase is a common phenomenon in Daphnia

Chapter 1
26
populations (Lynch 1987; Vanoverbeke & De Meester 2010). The loss of genetic variability in
the AaW coincided with an increase of the inhibitory potential on chymotrypsins in the seston
and could result from natural selection due to increasing protease inhibition on D. magna
genotypes.
Three spring clones and three fall clones of D. magna were assayed in order to test
whether seasonal changes in genotypes might be caused by the inhibitory potential of the
seston on chymotrypsins. All six D. magna clones showed a significant reduction of their
somatic growth rate with increasing cyanobacterial abundance in the food. However, only
four of the six clones exhibited a reduction in population growth when feeding on 10% M.
aeruginosa. Two clones showed no negative effects in population growth, even at a relative
food abundance of 20% M. aeruginosa. This supports the data of Lürling (2003), who used
the same strain of M. aeruginosa and reported a reduction in population growth of D. magna
clones at a concentration of � 25% M. aeruginosa. The M. aeruginosa strain used here
produces the chemically known chymotrypsin inhibitors Cyanopeptolin 954 and Nostopeptin
BN920 (Von Elert et al. 2005) and contains no microcystins (Lürling 2003). The observed
negative effect of 20% of this cyanobacterium on somatic and population growth of the six D.
magna clones suggests that this reduction was caused by an interference of the
cyanobacterial inhibitors with the chymotrypsins in the gut of D. magna. Evidence that this
strain of M. aeruginosa interferes with D. magna chymotrypsins is based on several studies
(Von Elert et al. 2005; Schwarzenberger et al. 2010). Schwarzenberger et al. (2010) reported
that the activity of gut chymotrypsins of D. magna decreased clearly when the animals were
fed with M. aeruginosa. Additionally, D. magna can respond with physiological plasticity to
dietary cyanobacterial protease inhibitors by increasing the expression of the targets of these
inhibitors, i.e. chymotrypsins, and by the expression of less-sensitive isoforms
(Schwarzenberger et al. 2010, Von Elert et al. 2012). Clearly these regulatory responses are
adaptive for D. magna, as they increase the capacity for protein digestion in the presence of
dietary protease inhibitors. These specific responses in chymotrypsin expression strongly
point at an interference of the two known chymotrypsin inhibitors with D. magna
chymotrypsins when this strain of M. aeruginosa is fed.
Variances in the mean tolerance to cyanobacteria of Daphnia populations over time have
already been demonstrated. For example, Weider et al.(1997) noted significant genotypic
shifts in the D. galeata population of Lake Constance, Germany, by collecting resting eggs
from lake sediments dating from the mid-1960s to mid-1990s and analyzing the genotypic
structure of the hatchlings from these resting eggs. The observed shifts in genotype
composition were strongly correlated with changes in the trophic state of the lake. These

Chapter 1�
27
genotypic shifts were related to micro-evolutionary changes within the population in their
ability to cope with cyanobacteria as food (Hairston et al. 1999; Hairston et al. 2001).
However, in our single-clone growth experiments we could not confirm our hypothesis that an
adaptation of the D. magna population to cyanobacteria in the AaW occurred over the
seasons; clones isolated in fall 2008 did not grow better on mixtures with M. aeruginosa than
clones isolated in spring did.
Gustafsson et al. (2005) have shown that D. magna can acquire a tolerance to
cyanobacteria within a single animal�s lifetime and transfer this tolerance through maternal
effects to the next generation. Such a maternal transfer is not accounted for in the single-
clone growth assays described above. Maternal effects are adequately considered in multi-
generational competition experiments. Such experiments have demonstrated that food
quality determined which of several clones from the D. pulex species complex becomes
dominant in an experimental population (Weider et al. 2005; Weider et al. 2008). Here we
conducted such a multi-generational competition experiment, and 10% of the chymotrypsin-
inhibitor-producing cyanobacterium significantly affected the clonal composition of the
populations. In the competition experiment the same D. magna clones as used in the single-
clone growth assays were cultured together for 90 days on either pure C. sp. or on a mixture
of C. sp. and M. aeruginosa at saturating food levels. Two kinds of effects occurred at the
end of the experiment: First, the relative frequency of two clones (S2, F11) decreased
significantly, whereas three clones (F24, S2, S15) dominated the clonal compositions in both
treatments. This is reflected in a reduction of Shannon�s diversity (data not shown). Earlier
studies have already demonstrated that the genetic diversity in a multi-clonal competition
experiment decreased over time under constant conditions (Weider et al. 2008; Nelson et al.
2005). The single-clone growth experiments served hereby as controls for the competition
experiment, as the two experiments were started simultaneously with the same cohort of
newborns. Due to the fact that all D. magna clones had positive population growth rates on
both treatments we can rule out the possibility that the decrease in frequency of clone S2 and
F11 resulted from a general intolerance to the different food treatments directly from the start.
The second effect observed in the competition experiment was the significantly higher
frequency of D. magna clone S7 in the treatment with 10% M. aeruginosa than on the pure
green alga C. sp.. This suggests that clone S7 has a greater potential to dominate the D.
magna population in the presence of M. aeruginosa than in its absence. In the single-clone
growth experiment, the somatic and population growth of clone S7 in the presence of M.
aeruginosa did not differ from the growth of the other clones. However, the present study
underlines earlier results (Weider et al. 2008) showing that single clone experiments cannot

Chapter 1
28
predict the outcome of a complex competition experiment. The discrepancy in growth rates
between single clone and competition experiments of D. magna clone S7 can be explained
by inducible mechanisms. Increased tolerance can be transferred to the offspring via
maternal effects, a fact that has been interpreted as an inducible defense (Gustafsson et al.
2005). It remains unclear whether this inducible tolerance results from microevolution and
hence can only be found in D. magna clones originating from lakes containing cyanobacteria.
We hypothesized that D. magna clones from the fall population would show higher clonal
frequencies in the M. aeruginosa treatment. This could not be confirmed, and thus we could
not find any evidence that the D. magna clones isolated in fall were better adapted to
cyanobacteria containing protease inhibitors than the spring clones were. We used three
distinct clones of each sample, a number which might not have been sufficient to represent
the clonal D. magna composition of the spring and the fall samples in the AaW. Possibly
existing seasonal patterns of tolerance to cyanobacteria might be detectable by using a
greater number of D. magna clones of each sample. In contrast to the study of Weider et al.
(2008) in which seven Daphnia clones from different lakes were used, we used six D. magna
clones originating from just one habitat. It is reasonable to assume that clones originating
from the same population are genetically more similar with respect to traits that mediate
tolerance to cyanobacteria than clones isolated from various populations that differ with
respect to the prevalence of cyanobacteria. Sarnelle & Wilson (2005) demonstrated
differences in the tolerance to cyanobacteria of D. magna clones from different habitats,
giving evidence for local adaptation to cyanobacteria. In populations coexisting with
cyanobacteria, less tolerant clones might have become extinct due to natural selection
caused by the cyanobacteria. Since the selection pressure exerted by protease inhibitors
probably already existed over several previous seasons in the AaW, sensitive genotypes
would have been under negative selection for numerous generations and thus only be
present in low numbers. It remains unclear how many of the D. magna genotypes of the
spring population originated from clones that remained in the lake during the winter or
originated from hatched ephippia in spring. Ex-ephippia genotypes constitute new genotypes
resulting from sexual reproduction and are not under selection by food quality until hatching.
D. magna clones freshly hatched from ephippia might thus be less tolerant to cyanobacteria.
A high proportion of freshly hatched genotypes from ephippia in the spring should result in a
detectably lower fitness on cyanobacterial diet compared to clones from the fall. If more
clones of the population in spring originated from D. magna genotypes which had persisted
over the winter, the mean selection pressure on the population due to seasonally peaking

Chapter 1�
29
protease inhibitors could be too small to cause detectable fitness differences between spring
and fall samples.
The present study shows for the first time seasonal changes in the potential of a natural
lake seston to inhibit the major digestive proteases trypsin and chymotrypsin of D. magna.
The inhibitory potential on chymotrypsins was clearly higher in fall than in spring for each of
two successive years. However, in single-clone growth- and competition experiments we
could not find seasonal differences in tolerance between the D. magna spring and fall
samples to a cyanobacterium containing chymotrypsin inhibitors. Contrary to our hypothesis,
D. magna genotypes from the fall were not better adapted to a cyanobacterial diet containing
protease inhibitors than genotypes from the spring were. It remains to be seen if the
coexistence with seasonally varying dietary protease inhibitors in the AaW has led to a locally
adapted D. magna population with such a high level of tolerance to protease inhibitors that
seasonally peaking protease inhibitors have no detectable effects on the tolerance of D.
magna within this population. It will be interesting to see if a comparison among D. magna
populations that exist in the presence or absence of dietary protease inhibitors provides
evidence that seasonally occurring protease inhibitors constitute a constraint strong enough
to lead to locally adapted populations.

Chapter 1
30
References
Agrawal MK, Bagchi D & Bagchi SN (2001) Acute inhibition of protease and suppression of
growth in zooplankter, Moina macrocopa, by Microcystis blooms collected in Central India.
Hydrobiologia, 464, 37-44.
Agrawal MK, Zitt A, Bagchi D et al. (2005) Characterization of proteases in guts of Daphnia
magna and their inhibition by Microcystis aeruginosa PCC 7806. Environmental
Toxicology, 20, 314-322.
Blom JF, Baumann HI, Codd GA & Juttner F (2006) Sensitivity and adaptation of aquatic
organisms to oscillapeptin J and [D-Asp(3),(E)-Dhb(7)]microcystin-RR. Archiv für
Hydrobiologie, 167, 547-559.
Carlson, R. E. (1977) Trophic state index for lakes. Limology and Oceanography, 22, 361-
369
Colbourne JK, Robison B, Bogart K & Lynch M (2004) Five hundred and twenty-eight
microsatellite markers for ecological genomic investigations using Daphnia. Molecular
Ecology Notes, 4, 485-490.
Correll DL (1998) The role of phosphorus in the eutrophication of receiving waters: A review.
Journal of Environmental Quality, 27, 261-266.
Czarnecki O, Henning M, Lippert I & Welker M (2006) Identification of peptide metabolites of
Microcystis (Cyanobacteria) that inhibit trypsin-like activity in planktonic herbivorous
Daphnia (Cladocera). Environmental Microbiology, 8, 77-87.
Daniel TC, Sharpley AN & Lemunyon JL (1998) Agricultural phosphorus and eutrophication:
A symposium overview. Journal of Environmental Quality, 27, 251-257.
Dokulil MT & Teubner K (2000) Cyanobacterial dominance in lakes. Hydrobiologia, 438, 1-
12.
Excoffier L, Laval G & Schneider S (2005) Arlequin (version 3.0): An integrated software
package for population genetics data analysis. Evolutionary Bioinformatics, 1, 47-50.
Gademann K & Portmann C (2008) Secondary metabolites from cyanobacteria: Complex
structures and powerful bioactivities. Current Organic Chemistry, 12, 326-341.
Gophen M & Geller W (1984) Filter mesh size and food particle uptake by Daphnia.
Oecologia, 64, 408-412.
Guo SW & Thompson EA (1992) Performing the exact test of Hardy-Weinberg proportion
for multiple alleles. Biometrics, 48, 361-372.
Gustafsson S & Hansson LA (2004) Development of tolerance against toxic cyanobacteria in
Daphnia. Aquatic Ecology, 38, 37-44.
Gustafsson S, Rengefors K & Hansson LA (2005) Increased consumer fitness following
transfer of toxin tolerance to offspring via maternal effects. Ecology, 86, 2561-2567.
Hairston NG, Holtmeier CL, Lampert W et al. (2001) Natural selection for grazer resistance to
toxic cyanobacteria: Evolution of phenotypic plasticity? Evolution, 55, 2203-2214.

Chapter 1�
31
Hairston NG, Lampert W, Caceres CE et al. (1999) Lake ecosystems - Rapid evolution
revealed by dormant eggs. Nature, 401, 446.
Hansson LA, Gustafsson S, Rengefors K & Bomark L (2007) Cyanobacterial chemical
warfare affects zooplankton community composition. Freshwater Biology, 52, 1290-1301.
Hessen DO (1985) Filtering structures and particle-size selection in coexisting Cladocera.
Oecologia, 66, 368-372.
Jöhnk KD, Huisman J, Sharples J et al. (2008) Summer heatwaves promote blooms of
harmful cyanobacteria. Global Change Biology, 14, 495-512.
Johnston KA, Lee MJ, Brough C et al. (1995) Protease activities in the larval midgut of
Heliothis virescens: evidence for trypsin and chymotrypsin-like enzymes. Insect
Biochem.Molec.Biol. 25, 375-383.
Lampert W & Rothhaupt KO (1991) Alternating dynamics of rotifers and Daphnia magna in a
shallow lake. Archiv für Hydrobiologie, 120, 447-456.
Long BM, Jones GJ & Orr PT (2001) Cellular microcystin content in N-limited Microcystis
aeruginosa can be predicted from growth rate. Applied and Environmental Microbiology,
67, 278-283.
Lürling M (2003) Daphnia growth on microcystin-producing and microcystin-free Microcystis
aeruginosa in different mixtures with the green alga Scenedesmus obliquus. Limnology
and Oceanography, 48, 2214-2220.
Lürling M & van der Grinten E (2003) Life-history characteristics of Daphnia exposed to
dissolved microcystin-LR and to the cyanobacterium Microcystis aeruginosa with and
without microcystins. Environmental Toxicology and Chemistry, 22, 1281-1287.
Lynch M (1987) The consequences of fluctuating selection for isozyme polymorphisms in
Daphnia. Genetics, 115, 657-669.
Martin-Creuzburg D & Von Elert E (2004) Impact of 10 dietary sterols on growth and
reproduction of Daphnia galeata. Journal of Chemical Ecology, 30, 483-500.
Martin-Creuzburg D, Von Elert E & Hoffmann KH (2008) Nutritional constraints at the
cyanobacteria-Daphnia magna interface: The role of sterols. Limnology and
Oceanography, 53, 456-468.
Nelson WA, McCauley E & Wrona FJ (2005) Stage-structured cycles promote genetic
diversity in a predator-prey system of Daphnia and algae. Nature, 433, 413-417.
Ortells R, Olmo C & Armengol (2012) Colonization in action: genetic characteristics of
Daphnia magna Strauss (Crustacea, Anomopoda) in two recently restored ponds.
Hydrobiologia, 689, 37-49.
Porter KG, Gerritsen J & Orcutt JD (1982) The effect of food concentration on swimming
patterns, feeding-behavior, ingestion, assimilation, and respiration by Daphnia. Limnology
and Oceanography, 27, 935-949.
Porter KG & Mcdonough R (1984) The energetic cost of response to blue-green-algal
filaments by Cladocerans. Limnology and Oceanography, 29, 365-369.

Chapter 1
32
Reynolds J, Weir BS & Cockerham CC (1983) Estimation of the co-ancestry coefficient -
basis for a short-term genetic-distance. Genetics, 105, 767-779.
Rohrlack T, Christoffersen K, Hansen PE et al. (2003) Isolation, characterization, and
quantitative analysis of microviridin J, a new Microcystis metabolite toxic to Daphnia.
Journal of Chemical Ecology, 29, 1757-1770.
Rohrlack T, Dittmann E, Börner T & Christoffersen K (2001) Effects of cell-bound
microcystins on survival and feeding of Daphnia spp. Applied & Environmental
Microbiology. 67, 3523-3529.
Sarnelle O & Wilson AE (2005) Local adaptation of Daphnia pulicaria to toxic cyanobacteria.
Limnology and Oceanography, 50, 1565-1570.
Schreurs,H. (1992) Cyanobacterial dominance, relation to eutrophication and lake
morphology, thesis, University of Amsterdam.
Schwarzenberger A, Zitt A, Kroth P, Mueller S & Von Elert E (2010) Gene expression and
activity of digestive proteases in Daphnia: effects of cyanobacterial protease inhibitors.
BMC physiology, 10, 6.
Sivonen K &h Jones G (1999) Cyanobacterial toxins. toxic cyanobacteria in water: a guide
to their public health Consequences. Monitoring and Management, 41-111.
Sommer U, Gliwicz ZM, Lampert W & Duncan A (1986) The PEG-Model of seasonal
succession of planktonic events in fresh waters. Archiv für Hydrobiologie, 106, 433-471.
Threlkeld ST (1979) Midsummer dynamics of 2 Daphnia species in Wintergreen Lake,
Michigan. Ecology, 60, 165-179.
Vanoverbeke J & De Meester L (2010) Clonal erosion and genetic drift in cyclical
parthenogens - the interplay between neutral and selective processes. Journal of
Evolutionary Biology, 23, 997-1012.
Von Elert E & Jüttner F (1997) Phosporus limitation and not light controls the extracellular
release of allelopathic compounds by Trichormus dolium (cyanobacteria). Limnology and
Oceanography, 42, 1796-1802
Von Elert E & Wolffrom T (2001) Supplementation of cyanobacterial food with
polyunsaturated fatty acids does not improve growth of Daphnia. Limnology and
Oceanography, 46, 1552-1558.
Von Elert E (2002) Determination of limiting polyunsaturated fatty acids in Daphnia galeata
using a new method to enrich food algae with single fatty acids. Limnology and
Oceanography, 47, 1764-1773.
Von Elert E, Martin-Creuzburg D & Le Coz JR (2003) Absence of sterols constrains carbon
transfer between cyanobacteria and a freshwater herbivore (Daphnia galeata).
Proceedings of the Royal Society of London Series B-Biological Sciences, 270, 1209-
1214.
Von Elert E, Agrawal MK, Gebauer C et al. (2004) Protease activity in gut Daphnia magna:
evidence for trypsin and chymotrypsin enzymes. Comparative Biochemistry and
Physiology B-Biochemistry & Molecular Biology, 137, 287-296.

Chapter 1�
33
Von Elert E, Oberer L, Merkel P, Huhn T & Blom JF (2005) Cyanopeptolin 954, a chlorine-
containing chymotrypsin inhibitor of Microcystis aeruginosa NIVA Cya 43. Journal of
Natural Products, 68, 1324-1327.
Von Elert E, Zitt A, Schwarzenberger A (2012) Inducible tolerance in Daphnia magna against
dietary protease inhibitors. Journal of Experimental Biology, 215, 1209-1214
Wacker A & Von Elert E (2001) Polyunsaturated fatty acids: evidence for non-substitutable
biochemical resources in Daphnia galeata. Ecology, 82, 2507-2520.
Weider LJ, Lampert W, Wessels M, Colbourne JK & Limburg P (1997) Long-term genetic
shifts in a microcrustacean egg bank associated with anthropogenic changes in the Lake
Constance ecosystem. Proceedings of the Royal Society of London - Series B: Biological
Sciences, 264, 1613-1618.
Weider LJ, Makino W, Acharya K et al. (2005) Genotype x environment interactions,
stoichiometric food quality effects, and clonal coexistence in Daphnia pulex. Oecologia,
143, 537-547.
Weider LJ, Jeyasingh PD & Looper KG (2008) Stoichiometric differences in food quality:
impacts on genetic diversity and the coexistence of aquatic herbivores in a Daphnia hybrid
complex. Oecologia, 158, 47-55.
Wiedner C, Visser PM, Fastner J et al. (2003) Effects of light on the microcystin content of
Microcystis strain PCC 7806. Applied and Environmental Microbiology, 69, 1475-1481.

Chapter 1
34
Supporting material
0 1000 2000 3000 4000 50000
100
200
300
400
0 50 100 150 200
0
100
200
300
4000 100 200 300 400 500
0
100
200
300
400
0 100 200 300 400 5000
100
200
300
400
0 1000 2000 3000 4000 50000
100
200
300
400
0 100 200 300 400 500
0
100
200
300
400
Ch
ym
otr
yp
sin
acti
vit
y A
39
0 [n
mo
l p
NA
/min
]
Extracted seston biomass [µg dry wt/ml]
26.06.07 13.07.07
26.07.07 10.08.07
21.08.07 12.09.07
Fig. 4 In vitro effects of increasing concentrations of extracted biomass of each seston
sample taken in 2007 on the normalized activity of chymotrypsins of D. magna clone B. IC50
values (which indicate the inhibitory potential of a seston sample and are presented in Fig.
1A as black circles) are based on sigmoid dose-response curves (solid lines). IC50 values
with corresponding 95% confidence intervals (CI) were calculated using the software
GraphPad Prism (GraphPad Software, Inc.). Note different scales of the axes.

Chapter 1�
35
200 600 1000 1400 1800
100
200
300
400
200 600 1000 1400 1800
0
100
200
300
400
200 600 1000 1400 1800
0
100
200
300
400
200 600 1000 1400
0
100
200
300
400
0 200 400 600 800 1000
0
100
200
300
400
0 1000 2000 3000 4000
200
250
300
350
400
0 2000 4000 6000 8000
150
200
250
300
350
400
0 2000 4000 6000 8000 10000
200
250
300
350
400
0 2000 4000 6000 8000 10000
100
200
300
400
Extracted seston biomass [µg dry wt/ml]
Ch
ym
otr
yp
sin
acti
vit
y A
39
0 [n
mo
l p
NA
/min
]
06.08.2008
04.06.2008 16.06.2008
10.07.2008 23.07.2008
20.08.2008
03.09.2008 16.09.2008
30.09.2008 15.10.2008
200 600 1000 1400
0
100
200
300
400
Fig. 5 In vitro effects of increasing concentrations of extracted biomass of each seston
sample taken in 2008 on the normalized activity of chymotrypsins of D. magna clone B. IC50
values (which indicate the inhibitory potential of a seston sample and are presented in Fig.
1A as black circles) are based on sigmoid dose-response curves (solid lines). IC50 values
with corresponding 95% confidence intervals (CI) were calculated using the software
GraphPad Prism (GraphPad Software, Inc.). Note different scales of the axes.
Chapter 1
36
0 1000 2000 3000 4000 5000
0
50
100
150
200
250
300
350
0 500 1000 1500 2000 2500
0
50
100
150
200
250
300
0 100 200 300 400 500
0
50
100
150
200
250
300
0 100 200 300 400 500 600
0
50
100
150
200
250
300
0 1000 2000 3000 4000 5000
0
50
100
150
200
250
300
0 100 200 300 400 500
0
50
100
150
200
250
300
Extracted seston biomass [µg dry wt/ml]
Try
psin
acti
vit
y A
390 [n
mo
l p
NA
/min
]
26.06.07 13.07.07
26.07.07 10.08.07
21.08.07 12.09.07
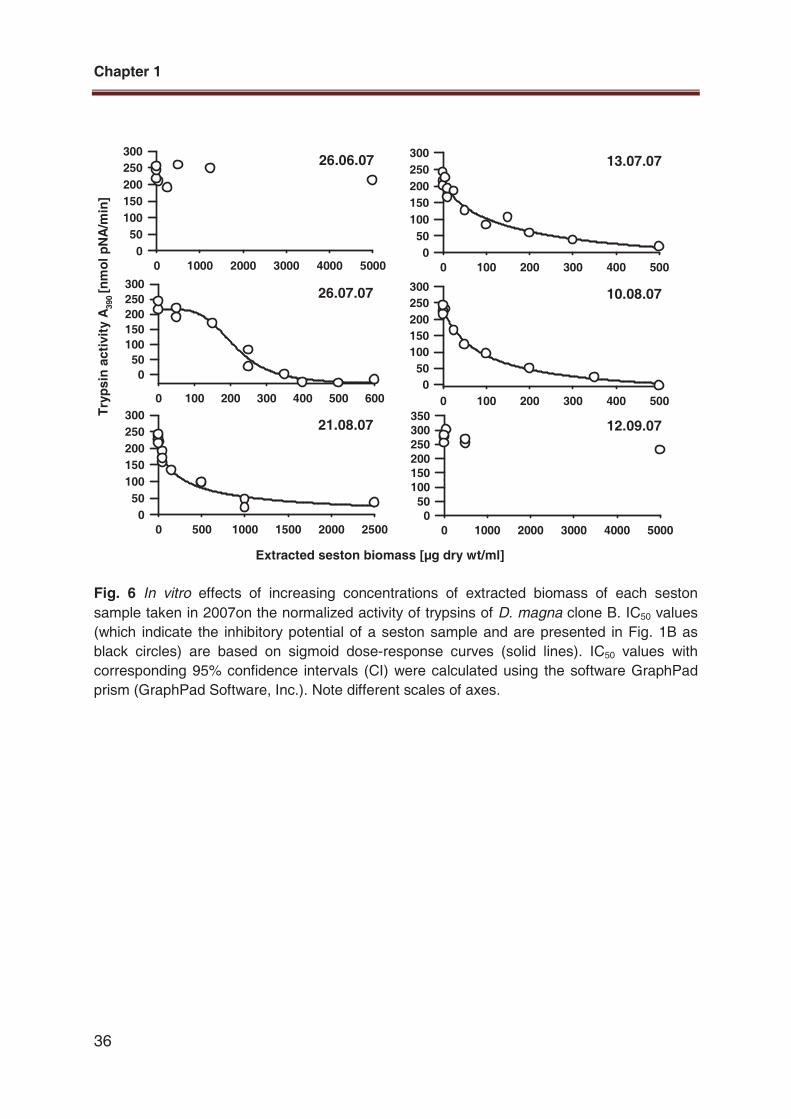
Fig. 6 In vitro effects of increasing concentrations of extracted biomass of each seston
sample taken in 2007on the normalized activity of trypsins of D. magna clone B. IC50 values
(which indicate the inhibitory potential of a seston sample and are presented in Fig. 1B as
black circles) are based on sigmoid dose-response curves (solid lines). IC50 values with
corresponding 95% confidence intervals (CI) were calculated using the software GraphPad
prism (GraphPad Software, Inc.). Note different scales of axes.
Chapter 1�
37
0 2000 4000 6000 8000 10000
0
100
200
300
400
0 200 400 600 800 1000 1200 1400
100
150
200
250
300
0 1000 2000 3000 4000 5000 6000
100
150
200
250
300
0 1000 2000 3000 4000 5000 6000
200
220
240
260
280
300
0 2000 4000 6000 8000 10000
0
100
200
300
400
500
0 2000 4000 6000 8000 10000
150
200
250
300
0 2000 4000 6000 8000 10000
0
100
200
300
400
0 2000 4000 6000 8000 10000
0
50
100
150200
250
300
350
0 2000 4000 6000 8000 10000
0
50
100
150
200
250
300350
0 2000 4000 6000 8000 10000
0
100
200
300
400
Try
psin
acti
vit
y A
39
0 [
nm
ol
pN
A/m
in]
Extracted seston biomass [µg dry wt/ml]
04.06.2008 16.06.2008
08.07.2008 23.07.2008
06.08.2008 20.08.2008
03.09.2008 16.09.2008
30.09.2008 15.10.2008
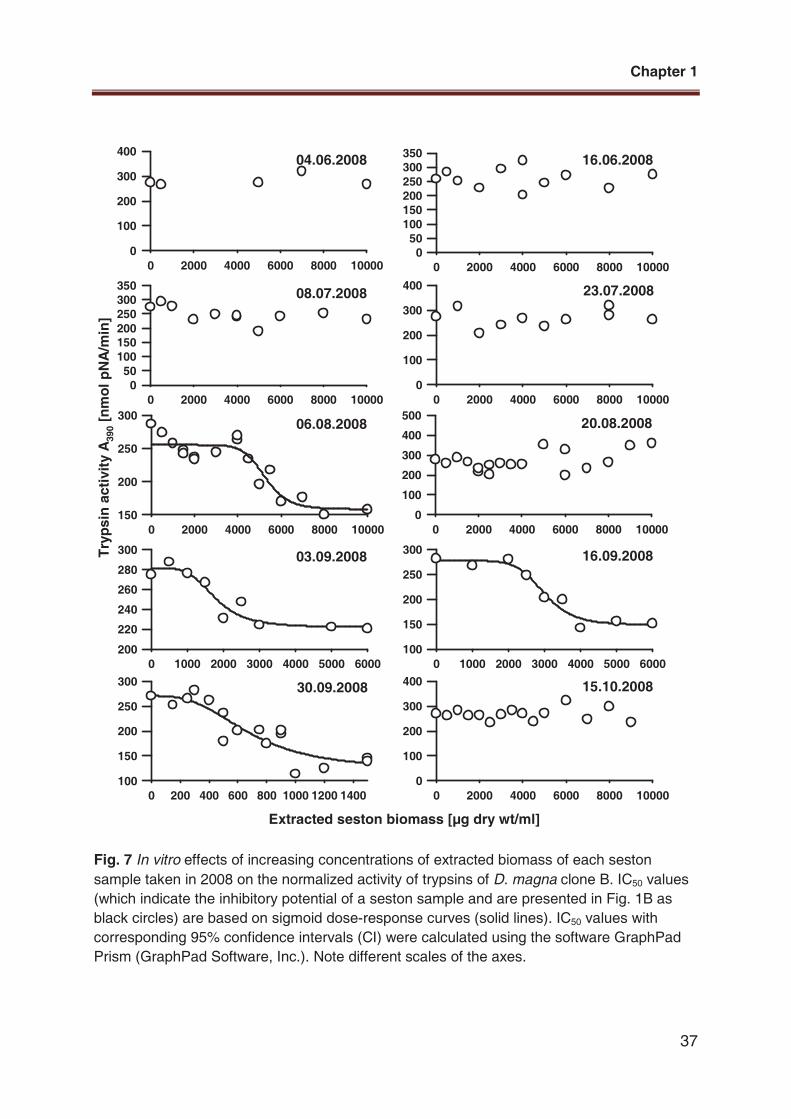
Fig. 7 In vitro effects of increasing concentrations of extracted biomass of each seston
sample taken in 2008 on the normalized activity of trypsins of D. magna clone B. IC50 values
(which indicate the inhibitory potential of a seston sample and are presented in Fig. 1B as
black circles) are based on sigmoid dose-response curves (solid lines). IC50 values with
corresponding 95% confidence intervals (CI) were calculated using the software GraphPad
Prism (GraphPad Software, Inc.). Note different scales of the axes.

38
Chapter 2
High-resolution melting analysis: a genotyping tool
for population studies on Daphnia

Chapter 2
39
Abstract
Determining genetic variation at the DNA level within and between natural populations is
important for understanding the role of natural selection on phenotypic traits, but many
techniques of screening for genetic variation are either cost intensive, not sensitive enough
or too labor and time-consuming. Here we demonstrate high resolution melting analysis
(HRMA) as a cost-effective and powerful tool for screening variable target genes in natural
populations. HRMA is based on monitoring the melting of PCR amplicons. Due to saturating
concentrations of a dye that binds at high concentrations to double-stranded DNA, it is
possible to genotype high numbers of samples rapidly and accurately. We analyzed digestive
trypsins of two Daphnia magna populations as an application example for HRMA. One
population originated from a pond containing toxic cyanobacteria that possibly produce
protease inhibitors, the other from a pond without such cyanobacteria. The hypothesis was
that D. magna clones from ponds with cyanobacteria have undergone selection by these
inhibitors, which has led to different trypsin alleles. We first sequenced pooled genomic PCR
products of trypsins from both populations to identify variable DNA sequences of active
trypsins. Secondly we screened variable DNA sequences of each D. magna clone from both
populations for single nucleotide polymorphisms (SNPs) via HRMA. The HRMA results
revealed that both populations exhibited phenotypic differences in the analyzed trypsins. Our
results indicate that HRMA is a powerful genotyping tool for studying the variation of target
genes in response to selection within and between natural Daphnia populations.

Chapter 2
40
Introduction
The analysis of genetic variation at the molecular level is necessary to understand the key
mechanisms of adaptive evolution in response to selection. Due to the rapidly growing
number of sequenced eukaryotic genomes and corresponding techniques, the possibilities
for analyzing genotype-phenotype interactions has increased considerably in the last decade.
In natural populations, adaptive and neutral genetic diversity have to be distinguished in this
context, both between and within populations. The neutral genetic variation can be assessed
relatively easy by using neutral markers such as microsatellites or allozymes. However,
genetic variation and population differentiation of adaptive traits are not directly linked with
neutral genetic diversity (Ohta 1992; Holderegger et al. 2006). For this reason, the variation
in loci coding for phenotypic traits has to be determined to more properly estimate population
differentiation in response to selection. Various approaches for screening of such loci have
been successfully established in the past decades and can be used to analyze variation in
populations. Conformational analyses, such as DGGE, SSCP or RSCA, are based on
separation of PCR samples on a gel or a different matrix and require prior sample processing
steps, which are time and labor consuming and increase the risk of contamination, because
PCR products are exposed to the environment (Reed et al. 2007). Direct genotyping
techniques such as chain termination sequencing or high-throughput sequencing techniques,
like Next-Generation Sequencing, are indeed quite sensitive but still too costly for many
large-scale population studies.
In the present study we describe a rapid, sensitive and cost-effective method for the
detection of genotype variations that can be used for genotyping single individuals in
populations: High-resolution melting analysis (HRMA). HRMA is a well established technique
for gene scanning based on the melting curves of PCR products (Gundry et al. 2003), which
does not require any processing, reagent addition or separations after PCR. It is based on
monitoring the melting behavior of whole amplicons of up to 250 base pairs after a common
PCR amplification. The characteristic dissociation (melting) behavior of each double-stranded
DNA (dsDNA) depends mainly on its GC content, sequence length, nucleotide composition
and strand complementarity (Ririe et al. 1997). HRMA is most commonly performed in the
presence of a saturating concentration of a fluorescent dye that binds specifically to dsDNA
(Wittwer et al. 2003). This binding leads to a fluorescence signal that can be detected by
highly sensitive quantitative PCR instruments. Fluorescent dyes used for HRMA have higher
fluorescence levels when bound to dsDNA than in an unbound state or after binding to
single-stranded DNA (Wittwer et al. 2003). To characterize the melting curve of a DNA
sample, the fluorescence is continuously monitored during the slow heating of the sample.

Chapter 2
41
The temperature-dependent dissociation of the dsDNA directly results in a decrease of
fluorescence. Detection and differentiation of distinct DNA samples relies on differences in
the melting temperature (Tm) and the shape of the melting curve (Montgomery et al. 2007),
so that most single nucleotide polymorphisms (SNPs) can be genotyped by HRMA. However,
some homozygous SNP variants cannot be differentiated because they possess a similar or
even identical melting curve shape. In particular, homozygous SNP variants of class III (C/G)
and class IV (A/T) mutations, also known as neutral base pair changes (Gundry et al. 2008),
can result in almost identical melting curves. In these cases, a known reference homozygous
genotype is added to each unknown homozygous sample (Palais et al. 2005). The newly
formed artificial heteroduplexes can subsequently be differentiated in a second melting
analysis by the shape of the corresponding melting curves; this procedure ensures the
complete identification of all homozygous variants.
HRMA has been applied in numerous clinical studies and for medical molecular
diagnostics, and has a broad range of applications (Reed et al. 2007). Another important field
of HRMA applications is the identification of parasitic organisms such as trematodes
(Radvansky et al. 2011), nematodes (Areekit et al. 2009) and parasitic protozoa in humans
(Andriantsoanirina et al. 2009) and in fungal pathogens (Luchi et al. 2011). Furthermore,
HRMA has been suggested as an alternative genotyping system for variation detection in
neutral markers in a population, for example in swordfish (Smith et al. 2010) or garden sage
(Mader et al. 2010), for insect species identification (Winder et al. 2011) and for
differentiating between social forms in populations of the red imported fire ant (Oakey et al.
2011).
HRMA has recently been reported in the ecological literature (e.g. Smith et al. 2010; Seeb
et al. 2011, Henri & Mouton 2012). In the present study we used HRMA in an ecological
context to determine the genetic variation of target genes between and within two natural
populations of the water flea Daphnia magna. In contrast to Daphnia pulex, which has
recently become a model organism (Colbourne et al. 2011), the reference genome data for
D. magna is still only partially available. Members of the genus Daphnia are unselective filter
feeders of algae and cyanobacteria in freshwater ecosystems and are often the most
important food source for planktivorous vertebrate and invertebrate predators. Daphnia is
therefore a keystone species in the energy transfer from primary producers (phytoplankton)
to higher trophic levels. In eutrophic lakes this energy transfer is constrained mainly by food
quality and not by food quantity (due to relatively high abundances of cyanobacteria). Three
major food quality constraints have been revealed for the poor assimilation of cyanobacterial
carbon by Daphnia: (1) Mechanical interferences with the filtering process of Daphnia due to

Chapter 2
42
colonial or filamentous forms of the cyanobacteria (Porter & Mcdonough 1984). (2) The low
content of polyunsaturated fatty acids and the lack of sterols in cyanobacteria, both of which
are essential for Daphnia nutrition (Von Elert 2002; Von Elert et al. 2003). (3) Many
cyanobacterial strains also produce toxins which negatively affect the fitness of Daphnia
(Rohrlack et al. 2001; Lürling 2003). Protease inhibitors are very common among such
cyanobacterial toxins: More than twenty depsipeptides, acting as protease inhibitors, have
been found in cyanobacterial toxins (Gademann & Portmann 2008). These depsipeptides
specifically inhibit the proteases chymotrypsin and trypsin, two digestive enzymes that are
responsible for more than 80% of the proteolytic activity in the gut of Daphnia magna (Von
Elert 2004). Studies by Agrawal et al. (2005), Schwarzenberger et al. (2010) and Von Elert et
al. (2012) have shown a direct inhibition of the digestive proteases of Daphnia by
cyanobacterial protease inhibitors. Furthermore, Czarnecki et al. (2006) have shown that the
potential of natural phytoplankton to inhibit trypsins is comparable to the inhibitory potential of
cyanobacterial strains. This strongly suggests that cyanobacterial protease inhibitors interfere
with digestive proteases in Daphnia in nature. However, Daphnia populations can adapt to
the presence of cyanobacteria in terms of a higher tolerance (Gustafsson & Hansson 2004;
Hairston et al. 1999; Sarnelle & Wilson 2005). Blom et al. (2006) showed that Daphnia sp.
coexisting with the cyanobacterium Planktothrix rubescens, which produces the trypsin
inhibitor oscillapeptin J, are significantly more tolerant to oscillapeptin J than Daphnia sp.
from habitats free of Planktothrix rubescens. Furthermore, Von Elert et al. (2012) have
recently shown that a physiological plasticity at the protein level in Daphnia leads to higher
tolerance against cyanobacterial protease inhibitors. Considering the finding that almost 60%
of 17 water blooms of cyanobacteria contained protease inhibitors (Agrawal et al. 2001), it is
reasonable to assume that increased tolerance to cyanobacteria in Daphnia populations may
be the result of higher tolerance to the cyanobacterial protease inhibitors.
In the present study we analyzed the genetic diversity of all three digestive trypsins that
have been shown to be active in the gut of D. magna between and within two distinct
populations. The populations originated from ponds, which mainly differ in the presence and
absence of toxic cyanobacteria that possibly contain protease inhibitors. The hypothesis was
that the coexistence of D. magna with cyanobacterial trypsin inhibitors has led to selective
pressure on digestive trypsins, resulting in differences in trypsin variability compared to a
population existing without cyanobacteria. To test this, we established clones from each
population under constant laboratory conditions. After DNA extractions and normalizations
steps, we performed a polymerase chain reaction (PCR) with each clone. We subsequently
pooled the genomic PCR-products of all digestive trypsin genes from each of the two

Chapter 2
43
populations. The pooled PCR-products of both populations were then sequenced to
distinguish between conserved and variable DNA sequences of active digestive trypsins.
Then we screened the variable DNA sequences in the trypsin loci for polymorphisms by
using HRMA with 15 single clones from each D. magna population.
Material and methods
Origin of Daphnia magna clones
Fifteen D. magna clones (termed as Sn clones) were isolated from Lake Bysjön (LAT
55.675448 LON 13.545070) in June 2010, cultivated as single clones at 20°C and are
referred to hereafter as the Swedish population. Lake Bysjön is a hypereutrophic lake and is
located in southern Sweden (Hansson et al. 2007). It frequently has massive cyanobacterial
blooms (Gustafsson 2007).
Fifteen D. magna clones (termed as Pn clones) were isolated from a small pond in the
Kampinoski National Park near Warsaw, Poland (LAT 52.322722 LON 20.730515) in August
2010. The clones were cultivated as single clonal lineages at 20°C and are referred to
hereafter as the Polish population. The ponds in Kampinoski National Park have no recorded
cyanobacterial blooms. All D. magna clones were cultured separately in aged, membrane-
filtered tap water and fed with saturating concentration of a green alga (Chlamydomonas
sp.).

Chapter 2
44
DNA sample preparation
Genomic DNA of each single D. magna clone from the Swedish and the Polish population
was extracted from at least ten adult individuals using the peqGOLD® Tissue DNA Mini Kit
(Peqlab, Erlangen, Germany) as according to the manufacturer�s standard protocol. DNA
concentration of each sample was determined using a NanoDrop® ND-1000
Spectrophotometer (Thermo Scientific, Wilmington, USA) and normalized to 20 ng/µL.
Table 1 Primer sequences (5`-3`) and corresponding melting temperature (Tm) for population
sequencing and subsequent HRMA of the digestive trypsins 610, 208 and 152.
Locus Primer sequences (5` - 3`) Tm (°C)
t610.1 F: GCCCATGATTGATGATGACA 57
R: TTTGGACAAGATGTCGCTGT 57
t610.2 F: CATCGTTGCTGGTGAACACA 58
R: GGTGATGGAAGTAGCTCCGTA 57
t610.3 F: GATGCCACTTGCCGTGAC 57
R: ATGGGATTGTTGGCGAAA 57
t610.HRM F: AGCTCCCCACTCTCGTTGA 57.5
R: AATATCGCAAAATGAATTACCG 57
t208.1 F: AGCTGATCCCATCCAACAGG 59.5
R: GGAGCATCCAACTACAAAATCG 59
t208.2 F: CGACATCTCTCTGCTCTTTGT 55
R: TTAAATCAGGAACAAGTCAGAACA 57
t208.3 F: TCTTCCCTTCCATGATCTGC 57
R: GCTTCATTCGACACCGTTTT 57.5
t208.HRM F: GATGCTCCATTGGACCTGAG 57
R: TGATTTTGAGGTGCGTTTGA 57
t152.1 F: AGCTGATCCCATCCAACAAG 57
R: AATGAAGCTGGCAACACCAC 58
t152.2 F: AGCGGCCTCGAACAGAAC 58
R: CGGAGTGTGTCGGAGATGAT 57.5
t152.3 F: TTGCTGGGTTTGATGCAGT 57
R: TTGATAGGGATGGGGATGG 57.5
t152.exon2 F: GAGTTGACGCTTCCATCCTC 57
R: CCTGTAGTCCTCGTGGATAATGA 58.5
t152.exon5 F: GCAGTCCGGTGGTATCATCT 57
R: CGGACGAGATAAATGTTCCAA 58
t152.exon6 F: TCAGGTGGTATCGACTCTTGC 57.5
R: TGAAGTTGATTCTAGGCGTTTG 57.5

Chapter 2
45
Sequencing and screening for SNPs
All genes chosen for the SNP screening and the HRMA coded for digestive trypsins,
which are active in the gut of D. magna (Schwarzenberger et al. 2010). Genome sequences
of the trypsin genes (t610, t208, t152) were obtained from an unpublished D. magna genome
assembly. Summaries for assembly and scaffolding are reported on the Daphnia Genomics
Consortium webpage: https://wiki.cgb.indiana.edu/display/grp/Daphnia+magna+Genome.
All primers, based on these trypsin genes for screening the population for SNPs were
designed using Primer 3 software (Rozen & Skaletsky 2000). To ensure the reliability of the
designed primers, all primer pairs were designed with the aim to minimize the formation of
secondary structures such as hairpins, self-dimers, cross-dimers and primer mismatches.
Due to repetitive regions in the introns of trypsin t152 three additional primer pairs had to be
designed to amplify and sequence the whole trypsin gene. The amplification was performed
via polymerase chain reaction (PCR) in a final volume of 10 µL containing 10 ng of genomic
DNA, 0.2 µmol of each primer, 10 µmol of the dNTPs, 0.25 U Taq DNA polymerase and 1 µL
of corresponding PCR buffer (5 Prime, Hamburg, Germany). After checking the success of
the amplification via agarose gel electrophoresis, aliquots of 1 µL PCR products of each
single clone were pooled for the Swedish and Polish clones separately. The pooled PCR
products from each population were then purified using a GenEluteTM PCR Clean-Up Kit
(Sigma-Aldrich, St. Louis, USA) and sequenced via chain termination sequencing by GATC
Biotech (Konstanz, Germany) using the ABI Big Dye Terminator Mix v3.1 on an ABI 3730xl
DNA Analyzer (Applied Biosystems, Foster City, USA). Subsequently, the sequenced
amplicons were screened for SNPs that affect phenotypic traits in terms of relevant amino
acid substitutions. Additional information on the exact location of all primer pairs and the
fragment size they amplify can be found in the supporting online material.
HRM analysis
For the HRMA, primer with an amplicon size of between 100 and 200 base pairs were
designed (Table 1), with the non-synonymous SNP towards the middle. The HRMA assay for
each clone was performed in 96 well plates in a final volume of 25 µL containing 50 ng of
genomic DNA, 0.3 µmol of each primer, 12.5 µL SensiMix HRMTM(Bioline, London, Great
Britain), 1 µL of EvaGreenTM dye (Bioline, London, Great Britain) and 5 mmol MgCl2.

Chapter 2
46
The DNA amplifications and the subsequent melting curve analyses were carried out
using a LightCycler 480 System® (Roche Diagnostics, Risch, Switzerland) under the following
conditions: 10 min initial polymerase activation at 95°C followed by 55 cycles of amplification,
each including 15 s denaturation at 95°C, 10 s annealing at 57°C and 10 s extension at 72°C.
Immediately after amplification, the products were heated to 95°C for 1 min and then cooled
to 40°C followed by an incremental temperature increase of 0.05°C/s to a target temperature
of 95°C. The fluorescence was monitored during the entire heating process. Data analyses
were carried out using LightCycler 480 Gene Scanning Software® version 1.5. The melting
curve data of the amplicons were normalized to the fluorescence (Y-axis) and temperature
(x-axis) and grouped according to melting curve shape. However, temperature shifting
normalization removes potential discriminatory power provided by the temperature data, but
compensates for well-to-well temperature variations between samples. The necessity for a
temperature normalization step mainly depends on the high resolution melting instruments
(Herrmann et al. 2007). Due to DNA mismatches at the SNP locations, the melting process of
heterozygous samples proceeds inconstantly resulting in a flattened melting curve with more
than one inflection point. In contrast, the melting curve shape of homozygous samples
indicates a consistent melting behavior with just one inflexion point (sigmoid shape).
Homozygous samples that were identified by the number of inflection points of their melting
curves were mixed with a known homozygous genotype followed by an additional melting
analysis. This ensured the complete identification of all homozygous variants. Subsequently,
one sample from each genotype was sequenced (chain-termination sequencing) in order to
determine the genotype specific nucleotide sequence.
Results
The sequence analysis of pooled PCR products of t152 revealed that this locus was
polymorphic. However, only synonymous SNPs were detected, which means that trypsin 152
was entirely conserved in terms of amino acid sequence within all clones of the Swedish and
Polish Daphnia magna populations. With regard to trypsin 610, the sequence of pooled PCR
products of the Swedish D. magna genotypes exhibited a single nucleotide variation coding
for the amino acid position 119 (Fig. 1A). At this position the Swedish haplotypes contained
the codon GAA or GCA; GAA codes for glutamic acid (Glu), GCA for alanine (Ala). Glu and
Ala differ with respect to the characteristics of their side chains: Glu is characterized by a
negatively charged, acidic side chain, while Ala carries a hydrophobic side chain. The Polish

Chapter 2
47
D. magna genotypes exhibit GAA only at this position, so that T610 has Glu at this position in
all Polish clones.
Regarding trypsin 208 the sequence of pooled PCR products of the Swedish D. magna
genotypes exhibited a single SNP coding for the amino acid position 130 (Fig. 1B). At this
position, Swedish haplotypes contained either the triplet codon ATG, which codes for
methionine (Met), or ATT, which codes for isoleucine (Ile). In contrast to Ile, Met contains a
sulfur atom and is more polar. The Polish D. magna genotypes exhibit only ATT at this
position in t208, so that Ile shows up at position 130 in all clones. DNA primer for HRMA
were designed with the specification that the resulting amplicons cover these variable
nucleotide sequences in t610 and t208. Subsequently, each D. magna clone from both
populations was genotyped individually at these variable loci via HRMA.
The HRMA of the chosen variable DNA sequence of trypsin 610 of all 30 D. magna clones
from the Swedish and the Polish populations revealed the presence of three different
genotypes. From each genotype one sample was subsequently sequenced (Fig. 2A). Out of
two polymorphic nucleotide sites within this 130 base pair fragment, one polymorphism
(position 71) was an A/C/M variation resulting in a Glu/Ala amino acid variation, while the
remaining nucleotide variation (position 39) was a synonymous substitution. Figure 2B shows
the normalized melting curves of the amplified DNA fragments of all D. magna clones.
Additional temperature shifts of the melting curves were performed in order to compensate
for temperature variations between the wells of the LightCycler 480 System®. This resulted in
a decrease of sensitivity, so that melting curves could mainly be discriminated by the shape
of the curves. Nine heterozygous genotypes (GT3) exhibited well-defined melting curves that
could be accurately distinguished from those of the homozygous genotypes. The melting
curves of the homozygous genotypes (GT1, GT2) merged into one group due to almost
identical shapes of the melting curves. To ensure the complete identification of all variants,
all homozygous genotypes (identified by the sigmoid shape of the corresponding melting
curves with just one inflexion point) were mixed with a known homozygous genotype, i.e.
GT1 (Figs. 2C & 2D), generating heteroduplexes. After an additional melting analysis, the
resulting melting curves had either the shape of a heterozygous or a homozygous variant
(Fig. 2D). An unchanged homozygous melting curve indicated that the original genotype was

Chapter 2
48
Figure 1 Procedure of determining variable parts in genes of digestive trypsins 610 (A) and
208 (B) of the Swedish and Polish populations. Genes of digestive trypsins of single clones
from both populations were amplified using the PCR technique. Afterwards, the PCR
products from different clones were pooled, sequenced and then screened for SNPs which
affect phenotypic traits in terms of relevant amino acid substitutions (for the Swedish and
Polish populations separately). Primers for the HRMA were designed such that resulting
amplicons cover these variable nucleotide sequences. Subsequently, melting curves of the
amplicons of each single D. magna clone were analyzed separately via HRMA. Trypsin 152
is not displayed due to the absence of non-synonymous nucleotide sequence variations.

Chapter 2
49
Fig. 2. Variable parts within the PCR amplicon of the digestive trypsin gene t610 (A). The
nucleotide variation at the second position (A/C/M) results in a phenotypic change in terms of
an amino acid substitution (Glu/Ala). B) displays the melting curves of all D. magna clones
from both populations after normalization of the fluorescence and correction for well-to-well
temperature differences, revealing two homozygous (GT1 + GT2) and one heterozygous
(GT3) genotype. C) The homozygous genotypes GT1 and GT2 could not be distinguished by
their melting curves; after mixing GT1 and GT2 with a known homozygous genotype (GT1),
the two genotypes could be distinguished in subsequent melting analyses (D). The last step
was performed to ensure the complete identification of all homozygous variants.
the homozygous genotype GT1, while a heterozygous melting curve pointed at an original
genotype GT2.
Concerning trypsin 208, the HRMA of the variable amplicon revealed the presence of five
distinct D. magna genotypes within both populations. From each genotype one sample was
subsequently sequenced (Fig. 3A). Out of four polymorphic nucleotide sites within this 152
base pair fragment, one nucleotide polymorphism (position 90) was a G/T/K variation
resulting in a Met/Ile amino acid variation. The remaining nucleotide polymorphisms at
positions 36, 51 and 69 were synonymous nucleotide substitutions. The melting curves of all
analyzed D. magna clones were normalized for fluorescence and were temperature shifted
(Fig. 3B). The heterozygous genotypes (GT3, GT4 and GT5) could be discriminated by the

Chapter 2
50
shape of the respective melting curve from each other and from the curves of the
homozygous genotypes. The sigmoidally shaped melting curves of the homozygous samples
(GT1, GT2), as above, were not distinguishable and merged into one group. As above, the
homozygous samples were mixed with a known homozygous genotype, i.e. GT1 (Figs. 3C &
3D). After additional melting analyses, the resulting melting curves had either the shape of a
heterozygous or a homozygous variant (Fig. 3D). An unchanged homozygous melting curve
indicated that the original genotype was the homozygous genotype GT1, while a
heterozygous melting curve pointed at an original genotype GT2.
With regard to the Polish and the Swedish populations, the HRMA of the variable parts of
trypsin 610 and 208 confirmed the sequence analyses of the pooled PCR products. All 15
Polish D. magna clones exhibited the same homozygous genotype for trypsin 610 and 208,
resulting in Glu at amino acid position 119 for trypsin 610, and Ile at amino acid position 130
for trypsin 208 as phenotypes (Table 2). In accordance with the sequencing results of the
pooled PCR product for t610 and t208, the genotype and respective amino acid phenotype
distribution for trypsin 610 and trypsin 208 of the Swedish population was more diverse
(Table 2). Combining the HRMA results of trypsin 610 and trypsin 208, five different
genotypes leading to five trypsin phenotypes were observed for the Swedish D. magna
clones (Table 2).
Table 2 Genotype and corresponding amino acid phenotype of trypsins 610 and 208 for each
single clone of the Swedish (S) and the Polish (P) populations.
Trypsin 610 Trypsin 208
D. magna clone Genotype Phenotype Genotype Phenotype
S6, S7, S14, S15, S39 GT1 Glu GT1 Met
S8 GT2 Ala GT2 Ile
S2 GT2 Ala GT5 Met
S16, S22, S38 GT3 Glu/Ala GT1 Met
S3, S4, S12, S17, S24,
S36
GT3 Glu/Ala GT4 Met/Ile
P1, P3, P4, P5, P6,
P13, P18, P19, P20,
P22, P24, P26, P27,
P30, P31
GT1 Glu GT3 Ile

Chapter 2
51
Figure 3 Variable parts within the PCR amplicon of the digestive trypsin gene 208 (t208) (A).
The nucleotide variation at the fourth position (G/T/K) results in a phenotypic change in terms
of an amino acid substitution (Ile/Met). B) displays the melting curves of all D. magna clones
from both populations after normalization of the fluorescence and correction for well-to-well
temperature differences. Due to the shape of the curves, two homozygous (GT1 and GT2)
and three heterozygous (GT3, GT4 and GT5) genotypes could be distinguished. C) The
homozygous genotypes GT1 and GT2 could not be discriminated by their melting curves;
after mixing GT1 and GT2 with a known homozygous genotype (GT1), the two genotypes
could be distinguished in subsequent melting analyses (D). The last step was performed to
ensure the complete identification of all homozygous variants.
Discussion
Natural genetic variation is the fundamental basis for evolution. The study of the origin and
persistence of genetic variation at the molecular level is a prerequisite to understand how
species and populations have evolved in response to selection. Single nucleotide
polymorphisms (SNPs), defined as a single base substitution at a specific locus, are the most
abundant class of genetic variation found in eukaryotic genomes (Vignal et al. 2002). It is
important to find reliable molecular tools for the detection of SNPs within and between natural

Chapter 2
52
populations, because even a single nucleotide substitution in a gene that affects phenotypic
traits can result in a complete change of the characteristics of a protein (Levan et al. 2001;
Mandola et al. 2003).
The sequence of the pooled PCR products revealed that two DNA sections in trypsin 610
and 208 were polymorphic in terms of relevant, non-synonymous nucleotide variations
among the Swedish and the Polish D. magna populations. The results of the subsequently
performed HRMA showed that all heterozygous genotypes were clearly distinguishable by
the shape of the corresponding melting curves, resulting in one heterozygous genotype for
trypsin 610 and three heterozygous genotypes for trypsin 208. However, two homozygous
genotypes could not be distinguished in each of the two trypsins. This was due to the
temperature variations between the wells of the LightCycler 480 System®, which resulted in
an increase of the experimental noise. Consequently, genotypes could be discriminated by
the shape of the respective melting curve rather than by the melting temperature.
Homozygous genotypes finally became distinguishable after generating heteroduplexes by
mixing each unknown homozygous genotype with a known homozygous genotype (Palais et
al. 2005). Subsequent HRMA yielded melting curves of the artificial heteroduplexes that were
either unchanged or exhibited the melting curve shape of a heterozygous genotype, which
permitted conclusions about the genotype of the sample. The generating of heteroduplexes
could alternatively be performed by consistently homozygous sample mixing (Vossen et al.
2009).
The final results of the HRMA regarding trypsin 610 and 208 revealed that the clonal
diversity in the Swedish D. magna population was much higher than in the Polish population.
All 15 Polish clones exhibited the same genotype for each of the two trypsins. This
functionally constrained monomorphism at the two trypsin loci in the Polish D. magna
population could be a consequence of low environmental variations. In such a situation, one
would expect that a few well-adapted clones would have been selected for. In addition,
Matthes (2004) has demonstrated that monomorphism in a D. pulex population of a
temporary habitat can be a consequence of founder effects. In contrast to the monomorphic
Polish population, three genotypes for trypsin 610 and five genotypes for trypsin 208 were
found in the Swedish D. magna population. The habitat of the Swedish clones, Lake Bysjön,
is known to be a hypereutrophic lake with seasonally occurring cyanobacterial blooms
(Hansson et al. 2007; Gustafsson 2007). In such hypereutrophic lakes, seasonal changes in
the phytoplankton community might lead to altering selection factors for the zooplankton
community, especially for non-selective filter feeders like Daphnia (DeMott 1989). This is
especially true for bloom-forming cyanobacteria containing toxic secondary metabolites,

Chapter 2
53
which inhibit Daphnia�s gut proteases; such cyanobacteria are more abundant in late summer
and early fall (Dokulil & Teubner 2000; Schreurs 1992; Czarnecki et al. 2006). These
changes in the phytoplankton community can be interpreted as being disturbances for the
respective Daphnia community. Weider (1992) observed that the frequency of disturbances
can have a pronounced effect on clonal diversity of a D. pulex population. In these
experiments, a disturbance event consisted of randomly diluting the animal density in the
experimental beakers. Weider (1992) showed that the highest level of clonal D. pulex
diversity was maintained at intermediate scales of disturbances. It is therefore reasonable to
assume that the higher clonal diversity in the Swedish population might be a consequence of
intermediates disturbances. However, it remains unclear whether this is a consequence of
the altering phytoplankton community or is caused by other abiotic or biotic factors.
With regard to trypsin 610, all Polish clones contained a Glu at amino acid position 119,
while 13 out of 32 Swedish haplotypes exhibited Ala at this position. It remains
undeterminable whether this phenotypic difference between the two populations was caused
by natural selection or by random genetic drift. Theoretically, a substitution of Glu with Ala
could decrease the sensitivity of an enzyme to a specific inhibitor. Shi et al. (1999) have
shown that an amino acid substitution in rat�s palmitoyltransferase of Glu with Ala did not
affect catalytic activity, but inhibition of this mutant enzyme by a specific inhibitor was
reduced 100-fold. Further experiments, such as heterologous expression and subsequent
enzymatic characterization of the different isoforms, have to be performed to determine if the
partial substitution of Glu with Ala in the Swedish D. magna population might be the
consequence of adaptive evolution, possibly caused by cyanobacteria.
For trypsin 208 in the Swedish population, we found five different genotypes resulting in
either Met or Ile as phenotypes at amino acid position 130, while all D. magna clones from
the Polish population exhibited Ile at this position. A substitution of Ile with Met within an
enzyme is most commonly regarded as a conservative change, because Ile and Met belong
both to the same amino acid group with hydrophobic side chains (French & Robson 1983).
An alignment of trypsin 208 from D. magna with trypsin from the narrow-fingered crayfish, of
which the X-ray structure has been determined (Fodor et al. 2005; Fodor et al. 2006)
(accession code: Q52V24, UniProt), revealed that the Met/Ile variability at amino acid
position 130 is probably located at the surface of trypsin 208 in a beta-sheet structure. Ile is
C-beta branched and is therefore slightly more predestinated in beta-sheets than Met (Betts
& Russel 2003). Thus, it can be assumed that phenotypes containing an Ile at amino acid
position 130 might be structurally a bit more stable than phenotypes containing a Met.
However, the amino acid sequence of trypsin 208 from D. magna was less than 45%

Chapter 2
54
identical with that of the crayfish trypsin. Additional structural comparisons were restricted by
the absence of structure data from trypsins of closer related genera. Thus, we cannot rule out
the possibility that the occurrence of phenotypes with Met at amino acid position 130 in
trypsin 208 in the Swedish population was a response to selection caused by cyanobacterial
protease inhibitors.
The present study has demonstrated the application of high-resolution melting analysis
(HRMA) in population studies of Daphnia. In combination with pooled DNA sequencing
HRMA can be used to screen for gene variants in natural populations. HRMA is a screening
tool for the detection of unknown polymorphisms and for the identification of known
polymorphisms in target genes of natural populations. Even single SNPs of class III (C/G) or
class IV (A/T) mutations can be detected easily with HRMA. Its simplicity, sensitivity and
specificity as well as its low cost could make HRMA the method of choice for screening high
numbers of individuals in populations for variability in target genes.

Chapter 2
55
References
Agrawal MK, Bagchi D & Bagchi SN (2001) Acute inhibition of protease and suppression of
growth in zooplankter, Moina macrocopa, by Microcystis blooms collected in Central India.
Hydrobiologia, 464, 37-44.
Agrawal MK, Zitt A, Bagchi D et al. (2005) Characterization of proteases in guts of Daphnia
magna and their inhibition by Microcystis aeruginosa PCC 7806. Environmental
Toxicology, 20, 314-322.
Andriantsoanirina V, Lascombes V, Ratsimbasoa A et al. (2009) Rapid detection of point
mutations in Plasmodium falciparum genes associated with antimalarial drugs resistance
by using High-Resolution Melting analysis. Journal of Microbiological Methods, 78, 165-
170.
Areekit S, Kanjanavas P, Pakpitchareon A et al. (2009) High resolution melting real-time
PCR for rapid discrimination between Brugia malayi and Brugia pahangi. Journal of the
Medical Association of Thailand = Chotmaihet thangphaet, 92 Suppl 3, S24-S28.
Betts MJ & Russel RB (2003) Amino acid properties and consequences of substitutions.
Bioinformatics for geneticists (eds Barnes MR, Fray IC), pp. 289-316, John Wiley & Sons,
Hoboken.
Blom JF, Baumann HI, Codd GA & Jüttner F (2006) Sensitivity and adaptation of aquatic
organisms to oscillapeptin J and [D-Asp(3),(E)-Dhb(7)]microcystin-RR. Archiv für
Hydrobiologie, 167, 547-559.
Colbourne JK, Pfrender ME, Gilbert D et al. (2011) The Ecoresponsive Genome of Daphnia
pulex. Science, 331, 555-561.
Czarnecki O, Henning M, Lippert I & Welker M (2006) Identification of peptide metabolites of
Microcystis (Cyanobacteria) that inhibit trypsin-like activity in planktonic herbivorous
Daphnia (Cladocera). Environmental Microbiology, 8, 77-87.
DeMott WR (1989) The role of competition in zooplankton succession. Plankton ecology.
Succession in plankton communities (eds U. Sommer), pp. 195-252. Springer Verlag,
Berlin.
Dokulil MT & Teubner K (2000) Cyanobacterial dominance in lakes. Hydrobiologia, 438, 1-
12.
Fodor K, Harmat V, Hetenyi C et al. (2005) Extended intermolecular interactions in a serine
protease-canonical inhibitor complex account for strong and highly specific inhibition.
Journal of Molecular Biology, 350, 156-169.
Fodor K, Harmat V, Neutze R et al. (2006) Enzyme : Substrate hydrogen bond shortening
during the acylation phase of serine protease catalysis. Biochemistry, 45, 2114-2121.
French S & Robson B (1983) What Is a conservative substitution? Journal of Molecular
Evolution, 19, 171-175.
Gademann K & Portmann C (2008) Secondary metabolites from cyanobacteria: Complex
structures and powerful bioactivities. Current Organic Chemistry, 12, 326-341.

Chapter 2
56
Gundry CN, Vandersteen JG, Reed GH et al. (2003) Amplicon melting analysis with labeled
primers: A closed-tube method for differentiating homozygotes and heterozygotes. Clinical
Chemistry, 49, 396-406.
Gundry CN, Dobrowolski SF, Martin Y et al. (2008) Base-pair neutral homozygotes can be
discriminated by calibrated high-resolution melting of small amplicons. Nucleic acids
research, 36, 3401-3408.
Gustafsson,S. (2007) Zooplankton response to cyanotoxins. PhD thesis, Lund University,
Lund.
Gustafsson S & Hansson LA (2004) Development of tolerance against toxic cyanobacteria in
Daphnia. Aquatic Ecology, 38, 37-44.
Hansson LA, Gustafsson S, Rengefors K & Bomark L (2007) Cyanobacterial chemical
warfare affects zooplankton community composition. Freshwater Biology, 52, 1290-1301.
Hairston NG, Lampert W, Caceres CE et al. (1999) Lake ecosystems - Rapid evolution
revealed by dormant eggs. Nature, 401, 446.
Herrmann MG, Durtschi JD, Wittwer CT & Voelkerding KV (2007) Expanded instrument
comparison of amplicon DNA melting analysis for mutation scanning and genotyping.
Clinical Chemistry, 53, 1544-1548.
Henri H & Mouton L (2012) High-Resolution Melting technology: a new tool for studying the
Wolbachia endosymbiont diversity in the field. Molecular Ecology Resources, 12, 75-81.
Holderegger R, Kamm U & Gugerli F (2006) Adaptive vs. neutral genetic diversity:
implications for landscape genetics. Landscape Ecology, 21, 797-807.
Levan TD, Bloom JW, Bailey TJ et al. (2001) A common single nucleotide polymorphism in
the CD14 promoter decreases the affinity of Sp protein binding and enhances
transcriptional activity. Journal of Immunology, 167, 5838-5844.
Luchi N, Pratesi N, Simi L et al. (2011) High-Resolution Melting Analysis: a new molecular
approach for the early detection of Diplodia pinea in Austrian pine. Fungal Biology, 115,
715-723.
Lürling M (2003) Daphnia growth on microcystin-producing and microcystin-free Microcystis
aeruginosa in different mixtures with the green alga Scenedesmus obliquus. Limnology
and Oceanography, 48, 2214-2220.
Mader E, Lohwasser U, Boerner A & Novak J (2010) Population structures of genebank
accessions of Salvia officinalis L. (Lamiaceae) revealed by high resolution melting
analysis. Biochemical Systematics and Ecology, 38, 178-186.
Mandola MV, Stoehlmacher J, Muller-Weeks S et al. (2003) A novel single nucleotide
polymorphism within the 5 ' tandem repeat polymorphism of the Thymidylate synthase
gene abolishes USF-1 binding and alters transcriptional activity. Cancer Research, 63,
2898-2904.
Matthes M (2004) Low genotypic diversity in a Daphnia pulex population in a biomanipulated
lake: the lack of vertical and seasonal variability. Hydrobiologia, 526, 33-42.

Chapter 2
57
Montgomery J, Wittwer CT, Palais R & Zhou L (2007) Simultaneous mutation scanning and
genotyping by high-resolution DNA melting analysis. Nature Protocols, 2, 59-66.
Oakey J, Harris E, Pease B, Jennings C & McCubbin K (2011) Differentiation of Solenopsis
invicta social forms using high resolution melt PCR. Bulletin of Entomological Research,
101, 581-589.
Ohta T (1992) The nearly neutral theory of molecular evolution. Annual Review of Ecology
and Systematics, 23, 263-286.
Palais RA, Liew MA & Wittwer CT (2005) Quantitative heteroduplex analysis for single
nucleotide polymorphism genotyping. Analytical Biochemistry, 346, 167-175.
Porter KG & Mcdonough R (1984) The energetic cost of response to blue-green-algal
filaments by cladocerans. Limnology and Oceanography, 29, 365-369.
Radvansky J, Bazsalovicsova E, Kralova-Hromadova I, Minarik G & Kadasi L (2011)
Development of high-resolution melting (HRM) analysis for population studies of
Fascioloides magna (Trematoda: Fasciolidae), the giant liver fluke of ruminants.
Parasitology Research, 108, 201-209.
Reed GH, Kent JO & Wittwer CT (2007) High-resolution DNA melting analysis for simple and
efficient molecular diagnostics. Pharmacogenomics, 8, 597-608.
Ririe KM, Rasmussen RP & Wittwer CT (1997) Product differentiation by analysis of DNA
melting curves during the polymerase chain reaction. Analytical Biochemistry, 245, 154-
160.
Rohrlack T, Dittmann E, Börner T & Christoffersen K (2001) Effects of cell-bound
microcystins on survival and feeding of Daphnia spp. Applied & Environmental
Microbiology., 67, 3523-3529.
Rozen S & Skaletsky H (2000) Primer3 on the WWW for general users and for biologist
programmers. Methods in molecular biology (Clifton, N.J.), 132, 365-386.
Sarnelle O & Wilson AE (2005) Local adaptation of Daphnia pulicaria to toxic cyanobacteria.
Limnology and Oceanography, 50, 1565-1570.
Schreurs,H. (1992) Cyanobacterial dominance, relation to eutrophication and lake
morphology. PhD thesis, University of Amsterdam, Amsterdam.
Schwarzenberger A, Zitt A, Kroth P, Mueller S & Von Elert E (2010) Gene expression and
activity of digestive proteases in Daphnia: effects of cyanobacterial protease inhibitors.
BMC physiology, 10, 6.
Seeb J, Pascal C, Grau E et al. (2011) Transcriptome sequencing and high-resolution melt
analysis advance single nucleotide polymorphism discovery in duplicated salmonids.
Molecular Ecology Resources, 11, 335-348.
Shi JY, Zhu HF, Arvidson DN & Woldegiorgis G (1999) A single amino acid change
(substitution of glutamate 3 with alanine) in the N-terminal region of rat liver carnitine
palmitoyltransferase I abolishes malonyl-CoA inhibition and high affinity binding. Journal of
Biological Chemistry, 274, 9421-9426.

Chapter 2
58
Smith B, Lu C & Bremer J (2010) High-resolution melting analysis (HRMA): a highly sensitive
inexpensive genotyping alternative for population studies. Molecular Ecology Resources,
10, 193-196.
Vignal A, Milan D, SanCristobal M & Eggen A (2002) A review on SNP and other types of
molecular markers and their use in animal genetics. Genetics Selection Evolution, 34,
275-305.
Von Elert E (2002) Determination of limiting polyunsaturated fatty acids in Daphnia galeata
using a new method to enrich food algae with single fatty acids. Limnology and
Oceanography, 47, 1764-1773.
Von Elert E, Martin-Creuzburg D & Le Coz JR (2003) Absence of sterols constrains carbon
transfer between cyanobacteria and a freshwater herbivore (Daphnia galeata).
Proceedings of the Royal Society of London Series B-Biological Sciences, 270, 1209-
1214.
Von Elert E (2004) Food quality constraints in Daphnia: interspecific differences in the
response to the absence of a long chain polyunsaturated fatty acid in the food source.
Hydrobiologia, 526, 187-196.
Von Elert E, Zitt A, Schwarzenberger A (2012) Inducible tolerance in Daphnia magna against
dietary protease inhibitors. Journal of Experimental Biology, 215, 1209-1214
Vossen RHAM, Aten E, Roos A & den Dunnen JT (2009) High-Resolution Melting Analysis
(HRMA)-More Than Just Sequence Variant Screening. Human Mutation, 30, 860-866.
Weider LJ (1992) Disturbance, competition and the maintenance of clonal diversity in
Daphnia pulex. Journal of Evolutionary Biology, 5, 505-522.
Winder L, Phillips C, Richards N et al. (2011) Evaluation of DNA melting analysis as a tool for
species identification. Methods in Ecology and Evolution, 2, 312-320.
Wittwer CT, Reed GH, Gundry CN, Vandersteen JG & Pryor RJ (2003) High-resolution
genotyping by amplicon melting analysis using LCGreen. Clinical Chemistry, 49, 853-860.

59
Chapter 3
Interspecific differences between D. pulex and D.
magna in sensitivity to cyanobacterial protease
inhibitors

Chapter 3
60
Abstract
It is known that cyanobacteria negatively affect herbivores due to the production of toxins
such as protease inhibitors. In the present study we investigated potential interspecific
differences between two major herbivores, Daphnia magna and Daphnia pulex, in terms of
their tolerance to cyanobacterial protease inhibitors. Seven clones each of D. magna and of
D. pulex were isolated from different habitats in Europe and North America. To test for
interspecific differences in tolerance to cyanobacteria, somatic and population growth rates
on varying concentrations of two Microcystis aeruginosa strains were determined for each D.
magna and D. pulex clone. The M. aeruginosa strains NIVA and PCC- contained either
chymotrypsin or trypsin inhibitors, but no microcystins. Each Daphnia clone showed a
reduction of population and somatic growth rate with increasing concentrations of NIVA.
Mean somatic and population growth rate reductions on a diet with 20% NIVA were
respectively 2.7-fold and 4.9-fold higher in D. pulex than in D. magna. The reduction in
population growth on 10% PCC- was 3.2-fold higher in D. pulex than in D. magna. This
indicates that D. magna is more tolerant to cyanobacteria with protease inhibitors than D.
pulex. The reduction of growth rates was probably caused by an interference of
cyanobacterial inhibitors with proteases in the gut of Daphnia, as other conceivable factors
explaining the reduced growth could be excluded as causal factors. Protease assays
revealed that the sensitivities of chymotrypsins and trypsins to cyanobacterial protease
inhibitors did not differ between D. magna and D. pulex. However, D. magna exhibited a 2.3-
fold higher specific chymotrypsin activity than D. pulex, which explains the observed higher
tolerance to cyanobacterial protease inhibitors of D. magna. The observed higher tolerance
of D. magna to cyanobacterial protease inhibitors compared to that of D. pulex might result
from differences in their coexistence with cyanobacteria.

Chapter 3
61
Introduction
The frequency of cyanobacterial blooms in many marine and freshwater environments
has increased world-wide during the last century, partly due to increasing temperatures as a
consequence of global warming (Paerl & Huisman 2008). When the temperature of the
epilimnion reaches its maximum in late summer and early fall (Jöhnk et al. 2008), the
phytoplankton of eutrophic lakes and ponds is mainly dominated by bloom-forming
cyanobacterial species of the genera Microcystis, Anabaena or Oscillatoria (Dokulil &
Teubner 2000). Blooms of cyanobacteria are often associated with harmful effects on human
health and livestock (Carmichael 1994). Additionally, cyanobacteria are of poor food quality
for herbivorous zooplankton in freshwater ecosystems. Bloom-forming cyanobacteria have
been claimed to be a major factor for a constrained mass and energy transfer from primary
producers to higher trophic levels during eutrophication (Threlkeld 1979; Hansson et al.
2007). The herbivorous crustacean Daphnia often provides an important link for the transfer
from primary production, e.g. from cyanobacteria, to higher trophic levels (Lampert 1987;
Persson et al. 2007).
Negative relationships between bloom-forming cyanobacteria and the abundance of
Daphnia have been discussed extensively over the years, and three major quality constraints
of cyanobacteria as a food source have been revealed so far: (1) The occurrence of
cyanobacterial filaments and the formation of colonies hinder ingestion by interfering with the
filtering apparatus of Daphnia (Porter & Mcdonough 1984). (2) Compared to most green
algae, cyanobacteria contain low levels of essential lipids such as highly unsaturated fatty
acids and sterols, which leads to reduced somatic and population growth of Daphnia due to
constrained carbon assimilation (Von Elert 2002; Von Elert et al. 2003; Martin-Creuzburg &
Von Elert 2004; Martin-Creuzburg et al. 2008). (3) Many cyanobacteria produce a variety of
bioactive secondary metabolites, such as hepatotoxins like microcystins (Sivonen & Jones
1999) and/or protease inhibitors (Gademann & Portmann 2008; Agrawal et al. 2005; Von
Elert et al. 2012). These compounds reduce the fitness of Daphnia in terms of survival,
growth and reproduction (Lürling & van der Grinten 2003; Rohrlack et al. 2001). In addition to
microcystins (which are the most extensively investigated class of cyanobacterial toxins), the
role of protease inhibitors in herbivore/cyanobacteria interaction has recently also become a
focus of attention. More than twenty depsipeptides have been found in different genera of
marine and freshwater cyanobacteria (Gademann & Portmann 2008), specifically inhibiting
the serine proteases chymotrypsin and trypsin. These two classes of proteases are the most

Chapter 3
62
important digestive enzymes in the gut of D. magna and are responsible for more than 80%
of the proteolytic activity (Von Elert et al. 2004).
Recent studies have indicated that protease inhibitors from cyanobacterial sources indeed
interfere with Daphnia�s digestive proteases (Schwarzenberger et al. 2010; Agrawal et al.
2005) and lead to reduced somatic growth of Daphnia (Von Elert et al. 2012). It is known that
the edible size fraction of natural phytoplankton can inhibit Daphnia�s trypsins and
chymotrypsins (Kuster et al. 2012). This inhibitory potential of seston can be in the same
order of magnitude as pure cyanobacterial cultures (Czarnecki et al. 2006). Hence, it is
reasonable to assume that an interference of cyanobacterial protease inhibitors with
Daphnia�s digestive proteases occurs in nature and is ecologically relevant.
However, several studies have also demonstrated that Daphnia may develop tolerances
against cyanobacterial toxins at the population level (Sarnelle & Wilson 2005; Gustafsson &
Hansson 2004; Hairston et al. 2001). Blom et al. (2006) have recently shown that Daphnia
sp. coexisting with Planktothrix rubescens, a cyanobacterium that contains the trypsin
inhibitor oscillapeptin J, is significantly more tolerant to oscillapeptin-J than Daphnia sp. from
a lake free of this cyanobacterium. Considering the finding that almost 60% of 17
cyanobacterial blooms contained protease inhibitors (Agrawal et al. 2001), it is reasonable to
assume that increased tolerance to cyanobacteria in Daphnia populations may be caused by
an enhanced tolerance to the cyanobacterial protease inhibitors. It has been suggested that
at least two fundamental mechanisms underlie the increased tolerance to these dietary
inhibitors: (1) Colbourne et al. (2011) have hypothesized that the ability of Daphnia to cope
with different environmental conditions is a consequence of an elevated rate of gene
duplications resulting in tandem gene clusters. And indeed, a surprisingly high number of
genes of digestive serine proteases have been found in the recently published genome of D.
pulex (Colbourne et al. 2011). (2) Von Elert et al. (2012) have shown that a physiological
plasticity at the protein level in Daphnia in terms of remodeling the digestive enzymes leads
to increased tolerance against cyanobacterial protease inhibitors.
In the present study we test for interspecific differences between two Daphnia species (D.
magna and D. pulex) in their tolerance to cyanobacterial protease inhibitors. D. pulex and D.
magna are both large-bodied species and frequently encountered in fishless ponds, where
predation risks by visually feeding fish are comparatively low (Demott & Pape 2005). Due to
the availability of full-genome data (D. pulex, Colbourne et al. 2011) or EST libraries (D.
magna, Watanabe et al. 2005), both Daphnia species are predestinated for further ecological
investigations and were therefore chosen for use in the present study. To determine potential

Chapter 3
63
differences between D. pulex and D. magna in their tolerance to cyanobacteria containing
protease inhibitors, we performed single-clone somatic and population growth experiments in
which the clones were fed with various cyanobacterial mixtures containing trypsin or
chymotrypsin inhibitors. Possible differences in tolerance to cyanobacterial protease
inhibitors might have several causes and are therefore tested in the present study: (1) We
determined the specific trypsin and chymotrypsin activity of each of the investigated D.
magna and D. pulex clones. We hypothesized that high growth rates on cyanobacterial diets
might result from high specific protease activities. (2) For each Daphnia clone we determined
the sensitivity of gut chymotrypsins and trypsins to the respective cyanobacterial protease
inhibitors. We assumed that higher sensitivity values of Daphnia�s gut proteases might cause
reduced somatic and population growth rates for diets with cyanobacterial protease
inhibitors.
Materials and Methods
Origin and cultivation of organisms
Two cyanobacterial strains and one green alga were used in the single-clone growth
experiments: The cyanobacterium Microcystis aeruginosa NIVA Cya 43 (Culture Collection of
Algae, Norwegian Institute for Water Research), subsequently labeled as �NIVA�, is known to
contain the chymotrypsin inhibitors Cyanopeptolin 954 and Nostopeptin 920 (Von Elert et al.
2005). NIVA was cultured in 2 l chemostates in sterile Cyano medium (Von Elert & Jüttner
1997) at a dilution rate of 0.1 d-1 (20°C; illumination: 40 µmol m-2 s-1). M. aeruginosa PCC
7806 Mut contains the trypsin inhibitors Cyanopeptolin A-D (Weckesser et al. 1996) and was
grown in 0.75 l chemostates under otherwise identical conditions as NIVA. M. aeruginosa
PCC 7806 Mut is a genetically engineered microcystin synthetase knock-out mutant of M.
aeruginosa PCC 7806 (Dittmann et al. 1997) and is subsequently labeled as �PCC-�. Neither
M. aeruginosa strain contains microcystins. The green algae Chlamydomonas sp. (strain 56,
culture collection of the Limnological Institute at the University of Constance) was grown in 5 l
semi-continuous batch cultures (20°C; illumination: 120 µmol m-2 s-1) by replacing 20% of the
culture with sterile Cyano medium every Monday, Wednesday and Friday in the late
exponential phase of the culture. C. sp. contains neither chymotrypsin/trypsin inhibitors nor
microcystins.

Chapter 3
64
Seven D. magna and seven D. pulex clones originating from different habitats (Table1)
were used in the somatic and population growth experiments. All clones were cultured
separately in aged, membrane-filtered tap water and fed with saturating concentrations of C.
sp. for at least three generations prior to the experiment.
Table 1. Characterization of the Daphnia clones used in the experiment.
Daphnia
spp.
Clone Location Latitude Longitude Reference
D. pulex Gerstel Germany N/A N/A. Koch et al. 2009
D. pulex NFL3 USA N39°54' W84°55' Schaack et al. 2010
D. pulex Gräf Germany N50°49'04" E10°42'02" Matthes 2004
D. pulex Disp14 Canada N42°13� W83°02' Haag et al. 2009
D. pulex Povi113 USA N42°45� W85°21� Schaack et al. 2010
D. pulex Giev08 Germany N51°57�48" E7°34'38" Y. Reydelet1
D. pulex TCO USA N43°49'48" W124°08'53" Colbourne et al. 2011
D. magna F10 Germany N50°56'02" E6°55'41" Kuster et al. 2012
D. magna G38 Belgium N51°04'04" E3°46'25" This study
D. magna S15 Sweden N55°40'31" E13°32'42" Kuster & Von Elert 2012
D. magna P6 Poland N52°19'21" E20°43'49" Kuster et al. 2012
D. magna P The
Netherlands
N51°44'01" E5°08'17" De Meester 1994
D. magna B Germany N54°19'39" E10°37'45" Lampert & Rothhaupt 1991
D. magna W Poland N/A N/A Pijanowska et al. 1993
1 Y. Reydelet, personal communication, 2011
Chapter 3
65
Somatic and population growth assays
Each of the 14 clones was assayed in single-clone experiments for somatic and
population growth. Five (D. magna) to seven (D. pulex) juveniles from the same cohort of the
third clutch and not older than 24 h were kept in 0.25 l aged and filtered tap water
(membrane filter of 0.45 µm pore size) under constant dim light at 20°C. The animals were
fed with non-limiting food concentrations (2 mg C/L) either of 100% C. sp. or of various
mixtures of C. sp. and the two M. aeruginosa strains: In two treatments the animals were fed
either with a mixture of 80% C. sp and 20% NIVA or with a mixture of 50% C. sp. and 50%
NIVA. In one further treatment the animals were fed with a mixture of 90% C. sp. and 10%
PCC-. Each treatment was triplicated, and animals were transferred daily into fresh water with
saturating food concentrations. Somatic growth rates were calculated on day six as
according to Wacker & Von Elert (2001) as
g = [(ln (Gt) - ln (G0)]/d.
for which (G) is the body weight of a subsample of the animals at the beginning (G0) and end
(Gt) of the experiment. Mean individual dry weights were mean values of two individuals.
Population growth rates were calculated from daily survival and fecundity of the first clutch by
using Euler�s equation,
1 = � lx � mx � e-lx
in which lx is the survival rate and mx the size of the first clutch on day x. Population and
somatic growth rates were calculated for each replicate and subsequently averaged to give
the mean of the treatment.
Preparation of cyanobacterial extracts and Daphnia homogenates
Freeze-dried NIVA or PCC- were thoroughly homogenized and mixed separately. 50 mg of
the resulting powder was suspended in 500 µl of 60% methanol and sonicated for 15 min
followed by centrifugation (3 min at 104 x g). Subsequently the supernatant was separated
from the residue and used as extract in the protease assays.
Seven-day-old individuals of each of the seven D. magna and D. pulex clones grown on
non-limiting food concentrations of C. sp. were homogenized with a Teflon pestle. The

Chapter 3
66
homogenate was subsequently centrifuged (3 min at 1.4 x 10⁴ x g) and the resulting
supernatant was used immediately in the enzyme assays.
Protease activity and protease inhibition assays
The activity of the proteases chymotrypsin and trypsin in homogenates of all Daphnia
clones was measured as according to Von Elert et al. (2004). The protein concentration of
the supernatant was analyzed using a Qubit fluorometer and the appropriate Quant-iTTM
Protein Assay Kit (Invitrogen, Carlsbad, USA) according to the manufacturer�s standard
protocol. For the protease activity and protease inhibition assays, SuccpNA (N-succinyl-L-
alanyl-L-alanyl-L-prolyl-Lphenylalanine 4-nitroanilide, Sigma, 125 �M in DMSO) was used as
a substrate for chymotrypsins, while BapNA (N-R-benzoyl-DL-arginine 4-nitroanilide
hydrochloride, Sigma, 1.8 mM in DMSO) served as a substrate for trypsins. Trypsin and
chymotrypsin assays were performed in a potassium phosphate buffer (0.1 M, pH 7.5). The
absorption change was measured continuously for 10 min at 30°C at 390 nm with a Cary 50
photometer (Varian). Specific proteolytic activity was determined as nmol para-nitroanilide
liberated per minute and µg protein for synthetic substrates. With regard to the chymotrypsin
inhibition assays, homogenates of each of the D. magna and D. pulex clones were assayed
after addition of 10 � 15 different concentrations of the NIVA extract. The resulting
chymotrypsin activities were plotted as a function of extracted NIVA biomass per ml assay
volume. By fitting a sigmoidal dose response curve, the concentration of extracted NIVA
biomass which resulted in a 50% inhibition of Daphnia chymotrypsin activity (IC50) was
calculated. The higher the IC50 values for the analyzed D. magna and D. pulex homogenates,
the more tolerant were their respective chymotrypsins to chymotrypsin inhibitors from NIVA.
Trypsin inhibition of the D. magna and D. pulex clones was assayed as above, except that
different concentrations of the PCC- extract were used.

Chapter 3
67
Data analysis
For the inhibition assays of each single clone of D. magna and D. pulex, the protease
activities were plotted as a function of extracted NIVA or PCC- biomass. Resulting IC50 values
were calculated by fitting a sigmoid dose-response curve using the software Graph Pad
Prism (GraphPad Software, Inc.). A Student�s t-test was used to analyze the effect M.
aeruginosa had on Daphnia�s somatic and population growth rates as well as on protease
inhibition and specific protease activity. A significance level of p = 0.05 was applied to all
statistical analyses. All statistical tests were performed using SigmaPlot 11 (Systat Software,
Inc.)
Results
In order to test for interspecific differences between D. pulex and D. magna with regard to
their tolerance to cyanobacteria, we performed population and somatic growth experiments
on four different diets. Seven clones of each species, each originating from different habitats,
were fed either with pure C. sp. or with mixtures of C. sp. and either of two M. aeruginosa
strains, NIVA and PCC-.
On a mixture of 80% C. sp. and 20% NIVA, the somatic growth of D. pulex was reduced
by 44.4% (± 6.3% SE) compared to the treatment with 100% C. sp., while D. magna�s
somatic growth rate was reduced significantly less (16.2% ± 6.9% SE, Fig. 1A, t-test: t12=
3.024, p<0.05). The population growth rates were similarly affected, with a reduction of
56.1% (± 11.2% SE) for D. pulex and 11.4% (± 10.9% SE) for D. magna compared to the
treatment with 100% C. sp. (Fig. 1C). The reduction in population growth rate was hereby
significantly greater for D. pulex than for D. magna (t-test: t12= 3.024, p<0.05). With
increasing NIVA concentration from 20% to 50%, the average somatic growth reduction
increased significantly for D. pulex from 44.4% (± 6.3% SE) to 66.2% (± 5.4% SE; Fig. 1B;
test: t12= -2.63, p<0.05), while the growth rate reduction for D. magna also increased
significantly from 16.2% (± 6.9% SE) to 45.7% (± 6.4% SE; Fig. 1B, test: t12= -3.139, p<0.05).
On 50% NIVA, the somatic growth rate of D. pulex was reduced significantly more than that
of D. magna (Fig. 1B, t-test: t12= 2.466, p<0.05). With regard to the population growth rate,
the reduction of D. pulex increased from 56.1% (± 11.2% SE) on the mixture with 20% NIVA
to 82.5% (± 7.4% SE) in the 50% NIVA treatment (Fig. 1D, test: t12= -1.966, p=0.073). The
population growth rate reduction for D. magna increased significantly from 11.4% (± 10.9%

Chapter 3
68
SE) on 20% NIVA to 53.8% (± 8.3% SE) on 50% NIVA (Fig. 1D, t-test: t12= -3.102, p<0.05).
When comparing the effects on population growth rates of the mixture with 50% NIVA, the
reduction in D. pulex (82.5% ± 7.4% SE) was significantly greater than in D. magna (53.8% ±
8.3% SE; Fig. 1D, t-test: t12= 2.587, p<0.05).
So
mati
c g
row
th r
ate
red
ucti
on
(%
)
0
20
40
60
80
100
NFL3
Gerstel
Gräf
Disp14
Povi113
Giev08
TCO
F10
G38
S15
P6
P
B
W
Po
pu
lati
on
gro
wth
rate
red
ucti
on
(%
)
-40
-20
0
20
40
60
80
100
D. pulex D. magna
20% NIVA
D. pulex D. magna
50% NIVA
D. magna
D. pulex
*
*
A)
C)
B)
So
mati
c g
row
th r
ate
red
ucti
on
(%
)
0
20
40
60
80
100*
Po
pu
lati
on
gro
wth
rate
red
ucti
on
(%
)
-40
-20
0
20
40
60
80
100*
D)
Figure 1. Reduction of relative somatic (A, B) and population (C, D) growth rates of clones of
D. pulex (circles) and D. magna (squares) in response to different mixtures of
Chlamydomonas sp. and Microcystis aeruginosa strain NIVA. Animals were fed either with
80% C. sp. and 20% NIVA (A, C) or with 50% C. sp. and 50% NIVA (B, D). Grey bars
represent the mean values (n=7). Significant differences (Student�s t-test, p < 0.05) between
species are indicated by an asterisk.

Chapter 3
69
Figure 2 Reduction of relative somatic (A)
and population (B) growth rates of clones of
D. pulex (circles) and D. magna (squares) in
response to Microcystis aeruginosa strain
PCC-. Animals were fed with a mixture of
90% Chlamydomonas sp. and 10% PCC-.
Grey bars represent mean relative growth
rate reductions (n=7). Significant differences
(Student�s t-test, p < 0.05) between species
are indicated by an asterisk, while no
differences are labeled with �n.s.�.
Compared to the treatment with 100% C. sp.,
the average relative somatic growth rate
reduction on a mixture with 90% C. sp. and 10%
PCC-, was 26.7% (± 9.7% SE) for the D. pulex
clones and 8.5% (± 5.8% SE) for the D. magna
clones (Fig. 2A); however these effects were not
different (t-test: t12= 1,687, p=0.117).
Considering the population growth on the same
treatments, D. pulex exhibited significantly
greater growth rate reductions (34.9% ± 5.9%
SE) than D. magna (11% ± 5.9% SE; Fig. 2B; t-
test: t12= 2.878, p<0.05).
We furthermore quantified the specific activity
of trypsins and chymotrypsins for each of the D.
magna and D. pulex clones as possible causes
for the observed differences in tolerance of the
two species to cyanobacterial protease
inhibitors. The specific chymotrypsin activity of
D. magna (331.8 nmol/min/mg protein ± 44.4
nmol/min/mg protein SE) was dramatically
higher (+ 225%) than the activity of D. pulex
(147.4 nmol/min/mg protein ± 40.4 nmol/min/mg
protein SE; Fig. 3A, t-test: t12= -3.073, p<0.05).
The specific trypsin activity for D. pulex was
45.2 nmol/min per mg protein (± 7.8
nmol/min/mg protein SE), whereas it was 54.4
nmol/min per mg protein (± 6.6 nmol/min/mg
protein SE) for D. magna (Fig. 3B); however,
these values were not different (t-test: t12= -
0.897, p=0.387).
D. pulex D. magna
10% PCC-
So
ma
tic g
row
th r
ate
re
du
cti
on
(%
)
-20
0
20
40
60
80A)
B)
Po
pu
lati
on
gro
wth
ra
te r
ed
uc
tio
n (
%)
-20
0
20
40
60
80
n.s.
* D. magna
Gerstel
NFL3
Gräf
Disp14
Povi113
Giev08
TCO
F10
G38
S15
P6
P
B
W
D. pulex

Chapter 3
70
CT
IC
50
(n
g/m
l)
0
100
200
300
400
Gerstel
NFL3
Gräf
Disp14
Povi113
Giev08
TCO
F10
G38
S15
P6
P
B
W
T I
C50 (
ng
/ml]
200
400
600
800
1000
1200C) D)
n.s.n.s.
D. magna
D. pulex
CT
acti
vit
y (
nm
ol
pN
A/m
in/µ
g p
rote
in)
0
100
200
300
400
500
600
T a
cti
vit
y (
nm
ol
pN
A/m
in/µ
g p
rote
in)
0
20
40
60
80
100A) B)
n.s.*
D. pulex D. magna D. pulex D. magna
Figure 3 Two possible causes for the observed differences in the sensitivity of D. magna and
D. pulex to cyanobacterial protease inhibitors were tested: (A) specific chymotrypsin (CT) and
(B) trypsin (T) activity of the D. pulex (circles) and D. magna clones (squares). Inhibition of
digestive proteases from homogenates of clones of D. pulex (circles) and D. magna
(squares): (C) effects of extracts of M. aeruginosa strains NIVA on chymotrypsins, and (D)
effects of extracts of M. aeruginosa strains PCC- on trypsins. Depicted are IC50 values, which
represent the concentration of extracted dry weight of cyanobacterial biomass that is required
to cause a 50% inhibition of respective proteases. Low IC50 values indicate a high sensitivity
of proteases from the respective Daphnia clones. Grey bars represent mean values (n=7).
Significant differences (Student�s t-test, p < 0.05) among species are indicated by an
asterisk; no differences are labeled with �n.s.�.
In order to test for possible additional causes of the interspecific differences in their
tolerance to cyanobacterial protease inhibitors, the sensitivity of Daphnia�s trypsins and
chymotrypsins to cyanobacterial protease inhibitors was determined. This was achieved by
specifying the concentration of extracted cyanobacterial biomass that was needed to inhibit
Chapter 3
71
50% (IC50) of either Daphnia�s chymotrypsins or their trypsins (Fig. 3C, D). IC50 values of the
effects of NIVA extracts on Daphnia�s chymotrypsins were 295.6 ng/mL (± 24 ng/mL SE) for
D. pulex and 239.8 ng/mL (± 10.5 ng/mL SE) for D. magna, although these effects were not
different (Fig. 3C, t-test: t12= 2.136, p=0.054). When specifying the IC50 values of effects of
PCC- extracts on Daphnia�s trypsins, no differences between D. pulex (798.7 ng/mL ± 77.7
ng/mL SE) and D. magna (876.8 ng/mL ± 111.6 ng/mL SE) were detected (Fig. 3D, t-test:
t12= -0.574, p=0.577).
Discussion
Cyanobacterial blooms are often associated with hazards to human health and livestock,
but are also harmful to many freshwater herbivorous grazers such as Daphnia. Owing to the
dominance of cyanobacteria in eutrophic lakes and ponds in late summer (Jöhnk et al. 2008),
Daphnia genotypes from these habitats have to cope more frequently with the poor food
quality of cyanobacterial carbon than genotypes from habitats free of cyanobacterial blooms.
The causes for the poor assimilation of cyanobacterial carbon by Daphnia have been studied
extensively in past decades, leading to the following observations: Firstly, colonial or
filamentous cyanobacteria can mechanically interfere with Daphnia�s filtering apparatus
(Porter & Mcdonough 1984). Secondly, cyanobacteria lack essential sterols (Von Elert et al.
2003) and sufficient amounts of polyunsaturated fatty acids (Martin-Creuzburg et al. 2008).
Thirdly, the production of hepaptotoxins such as microcystins can significantly reduce the
fitness of Daphnia (Lürling & van der Grinten 2003). In the present study, all the D. pulex
clones and most of the D. magna clones showed a reduction in somatic and population
growth at a concentration of 20% NIVA. The negative effects mentioned above can be ruled
out as causal factors for the observed growth reductions, since the food mixtures used here
consisted of saturating concentrations of the widely used high-quality reference food C. sp.
Furthermore, both cyanobacterial strains as well as C. sp. were cultured as single cells and
did not contain any microcystins. However, the somatic and population growth of some D.
magna clones was reduced only at a concentration of 50% NIVA. This supports data of
Lürling (2003), who used the same strain of M. aeruginosa (NIVA) and reported a reduction
in growth of D. magna clones at a concentration of � 25% NIVA. On the mixture with PCC-,
some D. magna clones and the majority of the D. pulex clones exhibited a reduction of
population and somatic growth rate already at a concentration of 10%. Higher concentrations
would probably have resulted in a significant growth reduction in all D. magna and D. pulex

Chapter 3
72
clones, since several other studies (Schwarzenberger et al. 2010; Schwarzenberger et al.
2012) have reported a clear reduction in growth of daphnids at a concentration of 20% PCC-.
Both M. aeruginosa strains (NIVA and PCC-) produce exclusively either the chemically
known chymotrypsin inhibitors Cyanopeptolin 954 and Nostopeptin 920 (NIVA, Von Elert et
al. 2005) or specific Cyanopeptolins (A-D) which are known to inhibit trypsins (PCC-,
Weckesser et al. 1996). Thus, it is reasonable to assume that the observed somatic and
population growth rate reduction of the D. magna and D. pulex clones in response to
cyanobacteria was caused by a dietary inhibition of either Daphnia�s digestive chymotrypsins
or trypsins. In this study somatic and population growth rates of D. magna and D. pulex
served as a measure of tolerance to cyanobacteria with protease inhibitors and as an
approach to test for interspecific differences. In several cases it has been demonstrated that
coexistence of Daphnia with toxic cyanobacteria leads to local adaptation of the Daphnia
populations, as was evidenced by increased tolerance to cyanobacteria (Hairston et al. 1999;
Sarnelle & Wilson 2005). These findings support the notion that the presence of
cyanobacteria positively selects for more tolerant Daphnia genotypes.
In the present study we have shown for the first time that D. magna exhibits a higher
mean tolerance to cyanobacterial protease inhibitors than D. pulex. This might result from
general differences in their coexistence with cyanobacteria. D. pulex and D. magna are both
large-bodied Daphnia species, and are therefore most commonly abundant in fishless or
turbid ponds, where predation risk by visually feeding fish is comparatively low (Demott &
Pape 2005). In contrast to D. magna, which is able to tolerate elevated temperatures of up to
25°C (Wojtal-Frankiewicz 2012), the geographic distribution of D. pulex ranges from the
temperate to the arctic zone (Colbourne et al. 1998). Additionally, Bengtsson (1993) has
already shown that D. pulex usually reaches their highest densities in spring and early
summer, while D. magna shows no clear seasonal density pattern. Cyanobacteria have, in
general, higher temperature optima than other algal groups (Dokulil & Teubner 2000) and
dominate the phytoplankton community mainly in late summer and early fall (Jöhnk et al.
2008). Thus, it is reasonable to assume that a coexistence of cyanobacteria with D. magna
occurs more frequently than a coexistence of cyanobacteria with D. pulex. This putatively
more frequent coexistence of D. magna and cyanobacteria would thus result in an increased
tolerance of D. magna to protease inhibitors from cyanobacterial sources. Microevolutionary
adaptation of Daphnia populations to cyanobacteria has been experimentally confirmed:
Exposure of a mixed population of several Daphnia clones to a microcystin-producing strain
of M. aeruginosa resulted in an enhanced tolerance in subsequent generations (Gustafsson
& Hansson 2004). Such a maternally transferred increase in tolerance of Daphnia�s offspring

Chapter 3
73
generation has also been demonstrated for the microcystin-free M. aeruginosa strain PCC-
(Schwarzenberger & Von Elert 2012) which was also used in the present study.
With the aim of identifying the causes of the observed differences in Daphnia�s tolerance,
we focused on interspecific differences in the tolerance to cyanobacterial protease inhibitors.
Von Elert et al. (2012) have recently shown that D. magna responded to the presence of
chymotrypsin inhibitors in the diet by a switch in the set of digestive chymotrypsins that
resulted in more tolerant isoforms. In the present study we could not find a correlation
between less sensitive proteases and higher growth rates. The protease inhibition assays
revealed that the tolerance of chymotrypsins and trypsins to cyanobacterial protease
inhibitors did not differ between D. magna and D. pulex. However, the mean specific
chymotrypsin activity of D. magna was significantly higher than that of D. pulex. This elevated
specific chymotrypsin activity of D. magna coincides with the less reduced somatic and
population growth rates in the presence of chymotrypsin inhibitors, which might be a
consequence of a more frequent coexistence of cyanobacteria and D. magna than of the
former and D. pulex. Schwarzenberger et al. (2010) have recently shown that a clone of D.
magna responded to dietary protease inhibitors by increased expression of protease genes.
However, with regard to the significantly higher population growth rates of D. magna on PCC-
than those of D. pulex, we couldn�t find differences in species-specific trypsin characteristics,
neither with respect to the specific activity nor to the respective sensitivity. Thus, we cannot
rule out the possibility that other factors such as more efficient detoxification mechanisms in
D. magna could be responsible for the observed higher tolerance to cyanobacterial trypsin
inhibitors. One possibility of reducing toxic effects in Daphnia is to biotransform toxins by
conjugation to glutathione, which has already been demonstrated for the cyanobacterial
hepatotoxin Microcystin-LR (Pflugmacher et al. 1998). Although similar detoxification
mechanisms of protease inhibitors in Daphnia have not been detected so far, they cannot be
excluded as a causal factor for the higher tolerance of D. magna on diets with cyanobacterial
trypsin inhibitors.
As a result of continuing global warming, negative effects of toxic cyanobacteria on human
health, livestock and the whole ecosystem will become stronger in the near future (Paerl &
Huisman 2008). Much effort is therefore invested in preventing or controlling cyanobacterial
blooms. Besides reducing nutrient input into lakes and ponds, the control of cyanobacterial
blooms through biological agents including organisms such as bacteria, viruses and
unicellular grazers has been discussed extensively in the last decades (Sigee et al. 1999;
Tucker & Pollard 2005). Depending on initial conditions, Daphnia may also control the
development of bloom-forming cyanobacteria and may even suppress established

Chapter 3
74
cyanobacterial blooms (Sarnelle 2007). The present study suggests that D. magna may
control the development of cyanobacterial blooms more efficiently than D. pulex due to
significant differences in their tolerance to cyanobacteria with protease inhibitors. In light of
with increasing temperatures as a consequence of global warming, our results suggest that
toxic cyanobacterial blooms and coinciding harmful effects to the ecosystem will occur more
frequently in lakes with D. pulex than in lakes with D. magna.

Chapter 3
75
References
Agrawal MK, Bagchi D & Bagchi SN (2001) Acute inhibition of protease and suppression of
growth in zooplankter, Moina macrocopa, by Microcystis blooms collected in Central India.
Hydrobiologia, 464, 37-44.
Agrawal MK, Zitt A, Bagchi D et al. (2005) Characterization of proteases in guts of Daphnia
magna and their inhibition by Microcystis aeruginosa PCC 7806. Environmental
Toxicology, 20, 314-322.
Bengtsson J (1993) Interspecific competition and determinants of extinction in experimental
populations of 3 rockpool Daphnia species. Oikos, 67, 451-464.
Blom JF, Baumann HI, Codd GA & Juttner F (2006) Sensitivity and adaptation of aquatic
organisms to oscillapeptin J and [D-Asp(3),(E)-Dhb(7)]microcystin-RR. Archiv für
Hydrobiologie, 167, 547-559.
Carmichael WW (1994) Toxins of cyanobacteria. Scientific American, 270, 78-86.
Colbourne JK, Crease TJ, Weider LJ et al. (1998) Phylogenetics and evolution of a
circumarctic species complex (Cladocera : Daphnia pulex). Biological Journal of the
Linnean Society, 65, 347-365.
Colbourne JK, Pfrender ME, Gilbert D et al. (2011) The ecoresponsive genome of Daphnia
pulex. Science, 331, 555-561.
Czarnecki O, Henning M, Lippert I & Welker M (2006) Identification of peptide metabolites of
Microcystis (Cyanobacteria) that inhibit trypsin-like activity in planktonic herbivorous
Daphnia (Cladocera). Environmental Microbiology, 8, 77-87.
De Meester L (1994) Life-Histories and habitat selection in Daphnia - Divergent life-histories
of Daphnia magna clones differing in phototactic behavior. Oecologia, 97, 333-341.
Demott WR & Pape BJ (2005) Stoichiometry in an ecological context: testing for links
between Daphnia P-content, growth rate and habitat preference. Oecologia, 142, 20-27.
Dittmann E, Neilan BA, Erhard M, vonDohren H & Borner T (1997) Insertional mutagenesis
of a peptide synthetase gene that is responsible for hepatotoxin production in the
cyanobacterium Microcystis aeruginosa PCC 7806. Molecular Microbiology, 26, 779-787.
Dokulil MT & Teubner K (2000) Cyanobacterial dominance in lakes. Hydrobiologia, 438, 1-
12.
Gademann K & Portmann C (2008) Secondary metabolites from cyanobacteria: Complex
structures and powerful bioactivities. Current Organic Chemistry, 12, 326-341.
Gustafsson S & Hansson LA (2004) Development of tolerance against toxic cyanobacteria in
Daphnia. Aquatic Ecology, 38, 37-44.
Haag CR, McTaggart SJ, Didier A, Little TJ & Charlesworth D (2009) Nucleotide
polymorphism and within-gene recombination in Daphnia magna and D. pulex, two
cyclical parthenogens. Genetics, 182, 313-323.

Chapter 3
76
Hairston NG, Holtmeier CL, Lampert W et al. (2001) Natural selection for grazer resistance to
toxic cyanobacteria: Evolution of phenotypic plasticity? Evolution, 55, 2203-2214.
Hairston NG, Lampert W, Caceres CE et al. (1999) Lake ecosystems - Rapid evolution
revealed by dormant eggs. Nature, 401, 446.
Hansson LA, Gustafsson S, Rengefors K & Bomark L (2007) Cyanobacterial chemical
warfare affects zooplankton community composition. Freshwater Biology, 52, 1290-1301.
Jöhnk KD, Huisman J, Sharples J et al. (2008) Summer heatwaves promote blooms of
harmful cyanobacteria. Global Change Biology, 14, 495-512.
Koch U, Von Elert E & Straile D (2009) Food quality triggers the reproductive mode in the
cyclical parthenogen Daphnia (Cladocera). Oecologia, 159, 317-324.
Kuster CJ & Von Elert E (2012) High-resolution melting analysis: a genotyping tool for
population studies on Daphnia. Molecular Ecology Resources, 12, 1048-1057.
Kuster C, Schwarzenberger A & Von Elert E (2012) Seasonal dynamics of sestonic protease
inhibition: impact on Daphnia populations. Hydrobiologia, in press
(doi: 10.1007/s10750-012-1303-x).
Lampert W (1987) Laboratory studies on zooplankton-cyanobacteria interactions. New
Zealand Journal of Marine and Freshwater Research, 21, 483-490.
Lampert W & Rothhaupt KO (1991) Alternating dynamics of rotifers and Daphnia magna in a
shallow lake. Archiv für Hydrobiologie, 120, 447-456.
Lürling M (2003) Daphnia growth on microcystin-producing and microcystin-free Microcystis
aeruginosa in different mixtures with the green alga Scenedesmus obliquus. Limnology and
Oceanography, 48, 2214-2220.
Lürling M & van der Grinten E (2003) Life-history characteristics of Daphnia exposed to
dissolved microcystin-LR and to the cyanobacterium Microcystis aeruginosa with and
without microcystins. Environmental Toxicology and Chemistry, 22, 1281-1287.
Martin-Creuzburg D & Von Elert E (2004) Impact of 10 dietary sterols on growth and
reproduction of Daphnia galeata. Journal of Chemical Ecology, 30, 483-500.
Martin-Creuzburg D, Von Elert E & Hoffmann KH (2008) Nutritional constraints at the
cyanobacteria-Daphnia magna interface: The role of sterols. Limnology and
Oceanography, 53, 456-468.
Matthes M (2004) Low genotypic diversity in a Daphnia pulex population in a biomanipulated
lake: the lack of vertical and seasonal variability. Hydrobiologia, 526, 33-42.
Paerl HW & Huisman J (2008) Climate - Blooms like it hot. Science, 320, 57-58.
Persson J, Brett MT, Vrede T & Ravet JL (2007) Food quantity and quality regulation of
trophic transfer between primary producers and a keystone grazer (Daphnia) in pelagic
freshwater food webs. Oikos, 116, 1152-1163.
Pflugmacher S, Wiegand C, Oberemm A et al. (1998) Identification of an enzymatically
formed glutathione conjugate of the cyanobacterial hepatotoxin microcystin-LR: the first
step of detoxication. Biochimica et Biophysica Acta-General Subjects, 1425, 527-533.

Chapter 3
77
Pijanowska J, Weider LJ & Lampert W (1993) Predator-mediated genotypic shifts in a prey
population - Experimental evidence. Oecologia, 96, 40-42.
Porter KG & Mcdonough R (1984) The energetic cost of response to blue-green-algal
filaments by cladocerans. Limnology and Oceanography, 29, 365-369.
Rohrlack T, Dittmann E, Börner T & Christoffersen K (2001) Effects of cell-bound
microcystins on survival and feeding of Daphnia spp. Applied & Environmental
Microbiology., 67, 3523-3529.
Sarnelle O & Wilson AE (2005) Local adaptation of Daphnia pulicaria to toxic cyanobacteria.
Limnology and Oceanography, 50, 1565-1570.
Sarnelle O (2007) Initial conditions mediate the interaction between Daphnia and bloom-
forming cyanobacteria. Limnology and Oceanography, 52, 2120-2127.
Schaack S, Choi E, Lynch M & Pritham EJ (2010) DNA transposons and the role of
recombination in mutation accumulation in Daphnia pulex. Genome Biology, 11.
Schwarzenberger A, Kuster CJ & Von Elert E (2012) Molecular mechanisms of tolerance to
cyanobacterial protease inhibitors revealed by clonal differences in Daphnia magna.
Molecular Ecology, 21, 4898-4911.
Schwarzenberger A & Von Elert E (2012) Cyanobacterial protease inhibitors lead to maternal
transfer of increased protease gene expression in Daphnia. Oecologia, in press
(doi: 10.1007/s00442-012-2479-5).
Schwarzenberger A, Zitt A, Kroth P, Mueller S & Von Elert E (2010) Gene expression and
activity of digestive proteases in Daphnia: effects of cyanobacterial protease inhibitors.
BMC physiology, 10, 6.
Sigee DC, Glenn R, Andrews MJ et al. (1999) Biological control of cyanobacteria: principles
and possibilities. Hydrobiologia, 395, 161-172.
Sivonen K & Jones G (1999) Cyanobacterial toxins. Toxic cyanobacteria in water: A guide to
their public health consequences�. Monitoring and Management: 41-111.
Threlkeld ST (1979) Midsummer dynamics of 2 Daphnia species in Wintergreen Lake,
Michigan. Ecology, 60, 165-179.
Tucker S & Pollard P (2005) Identification of cyanophage Ma-LBP and infection of the
cyanobacterium Microcystis aeruginosa from an Australian subtropical lake by the virus.
Applied and Environmental Microbiology, 71, 629-635.
Von Elert E & Jüttner F (1997) Phosphorus limitation and not light controls the extracellular
release of allelopathic compounds by Trichormus doliolum (cyanobacteria). Limnology and
Oceanography, 42, 1796-1802.
Von Elert E (2002) Determination of limiting polyunsaturated fatty acids in Daphnia galeata
using a new method to enrich food algae with single fatty acids. Limnology and
Oceanography, 47, 1764-1773.
Von Elert E, Martin-Creuzburg D & Le Coz JR (2003) Absence of sterols constrains carbon
transfer between cyanobacteria and a freshwater herbivore (Daphnia galeata).

Chapter 3
78
Proceedings of the Royal Society of London Series B-Biological Sciences, 270, 1209-
1214.
Von Elert E, Agrawal MK, Gebauer C et al. (2004) Protease activity in gut Daphnia magna:
evidence for trypsin and chymotrypsin enzymes. Comparative Biochemistry and
Physiology B-Biochemistry & Molecular Biology, 137, 287-296.
Von Elert E, Oberer L, Merkel P, Huhn T & Blom JF (2005) Cyanopeptolin 954, a chlorine-
containing chymotrypsin inhibitor of Microcystis aeruginosa NIVA Cya 43. Journal of
Natural Products, 68, 1324-1327.
Von Elert E, Zitt A & Schwarzenberger A (2012) Inducible tolerance to dietary protease
inhibitors in Daphnia magna. Journal of Experimental Biology, 215, 2051-2059.
Wacker A & Von Elert E (2001) Polyunsaturated fatty acids: Evidence for non-substitutable
biochemical resources in Daphnia galeata. Ecology, 82, 2507-2520.
Watanabe H, Tatarazako N, Oda S et al. (2005) Analysis of expressed sequence tags of the
water flea Daphnia magna. Genome, 48, 606-609.
Weckesser J, Martin C & Jakobi C (1996) Cyanopeptolins, depsipeptides from
cyanobacteria. Systematic and Applied Microbiology, 19, 133-138.
Wojtal-Frankiewicz A (2012) The effects of global warming on Daphnia spp. population
dynamics: a review. Aquatic Ecology, 46, 37-53.

79
Chapter 4
Rapid evolution revealed by dormant eggs:
physiological mechanisms

Chapter 4
80
Abstract
Genetic diversity in populations of Daphnia is continually shaped by variation of abiotic
and biotic selection factors over time. Many lakes, e.g. Lake Constance, have undergone a
period of eutrophication due to anthropogenic phosphorus loading. Several studies have
shown that resultant changes in the phytoplankton community have directly affected
population densities of one of the main filter feeders of Lake Constance, Daphnia galeata. In
order to investigate the influence of changing selection factors in Lake Constance on the
genetic structure of the D. galeata population, we have isolated D. galeata resting eggs from
four different layers of sediment cores, representing the time periods before, during and after
the peak of the eutrophication and the concomitant occurrence of cyanobacteria. We have
pooled genomic DNA from the different time periods and applied high-throughput sequencing
with a mean coverage of 50x to each population separately. We used the data to determine
the genes and metabolic pathways in the D. galeata population that were affected by these
environmental changes. Our data suggests that cyanobacterial protease inhibitors and
oxidative stress induced by microcystins from cyanobacteria have caused selective pressure
on the respective target genes and have led to putatively adaptive population-wide genomic
changes.

Chapter 4
81
Introduction
Due to rapid human population growth within the watershed and concomitant
anthropogenic phosphorus loading, many lakes in Europe, e.g. Lake Constance, have
undergone a period of eutrophication in the last century (Güde et al. 1998). However, Lake
Constance may certainly serve as an excellent example for a successful management of
environmental problems in aquatic systems: The intensive agriculture, P-containing
detergents as well as the growing industry resulted in a more than ten fold increase of the
total phosphorus (Ptot) concentrations (7 to 87 µg L-1) in Lake Constance from the beginning
of the 20th century till 1980 (Fig. 1). Due to a comprehensive sewage treatment program
including P-precipitation and substitution of phosphorus in detergents, the phosphorus input
into Lake Constance declined steadily since 1980 (Güde et al. 1998). This has led to re-
oligotrophication and resulted in oligotrophic conditions in Lake Constance with levels of Ptot
as low as 7 µg L-1 (Kümmerlin 1998).
Cyan
ob
acte
rial b
iom
ass (
g d
w/m
²)
0.0
0.5
1.0
1.5
2.0
2.5
3.0
Cyanobacteria
Year
1960 1970 1980 1990 2000 2010
Pto
t (m
g/m
³)
0
20
40
60
80
100
Ptot
Figure 1 annual concentration of Ptot (left Y-axis) and cyanobacterial biomass (right Y axis) in
Lake Constance from 1960 till 2010.
© Institut für Seenforschung (ISF) - Landesanstalt für Umwelt, Messungen und
Naturschutz Baden-Württemberg

Chapter 4
82
Concomitant with increases of the Ptot-concentration, the taxonomical composition of the
phytoplankton community changed during the course of eutrophication. In the early 1960s
the originally dominating diatoms of the genus Cyclotella were mainly replaced by diatoms of
the genus Stephanodiscus (Kümmerlin 1998). At the peak of the phosphorus concentration in
1980 cyanobacterial species, such as Anabaena planctonica and Aphanizomenon flos-
aquae, became also abundant in Lake Constance (Fig. 1). These species are generally
regarded as indicators for eutrophic conditions in a lake (Kümmerlin & Bürgi 1989). The
proportion of cyanobacteria increased during the period of highest phosphorus
concentrations (1969-1979) and reached a maximum of even up to 28% (average = 13%) of
the total phytoplankton biovolume during summer months (Hairston et al. 2001). During the
first two decades of progressive re-oligotrophication in the mid 1980s and 1990s
cyanobacteria became less abundant again. Ongoing increases of relative abundances of
phytoplankton species that are indicative for oligotrophic conditions, such as Cyclotella ssp.
(Bacillariophyceae) and Chrysophyceae, are recorded since 1986 (Kümmerlin 1998).
Resultant changes in the phytoplankton community of Lake Constance had also profound
effects on the zooplankton community, e.g. on Daphnia galeata, the major herbivorous
grazer in Lake Constance. For example, Weider et al. (1997) noted significant genotypic
shifts in the D. galeata population in Lake Constance, by collecting resting eggs from lake
sediments dating from the mid-1960s to mid-1990s and analyzing the genetic structure of the
hatchlings from these resting eggs. The observed shifts in genotype composition of the D.
galeata population were strongly correlated with changes of the total phosphorus in Lake
Constance. Hairston et al. (1999, 2001) have shown that these shifts in genotype
composition went along with an increase of the mean tolerance of D. galeata clones to
cyanobacteria during the time of eutrophication and with the concomitant appearance of
cyanobacteria. Hairston et al. (1999) provided strong experimental support for the reasoning
that the occurrence of cyanobacteria was indeed the selective force driving the shifts in
genotype frequency in the D. galeata population of Lake Constance observed by Weider et
al. (1997). However, it remains unclear, which particular genes and metabolic pathways of
the D. galeata population were directly affected by the appearance of cyanobacteria.
Cyanobacteria are, in general, known to be poor food for the major herbivorous grazer in
Lake Constance, D. galeata. At least three major food quality constraints of cyanobacterial
carbon to daphnids have been revealed so far: (1) Filamentous or colonial forms of
cyanobacteria can cause mechanical interference with Daphnia�s filtering apparatus (Porter &
Mcdonough 1984). (2) Cyanobacteria have low nutritional value in terms of a low content of
polyunsaturated fatty acids and the lack of sterols; both are essential for Daphnia (Von Elert
Chapter 4
83
2002, Von Elert et al. 2003). (3) Many cyanobacterial strains contain toxins, such as
hepatotoxins, neurotoxins (Sivonen & Jones 1999), and/or protease inhibitors (Gademann &
Portmann 2008, Agrawal et al. 2005, Von Elert et al. 2012). These secondary metabolites
affect the fitness of Daphnia in terms of reduced survival, growth and/or reproduction (Lürling
& van der Grinten 2003; Lürling et al. 2011, Kuster et al. 2012). Type and composition of
these secondary metabolites differ from strain to strain and between natural blooms of
cyanobacteria (Gademann & Portmann 2008, Agrawal et al. 2001). However, only a few of
these metabolites have already been characterized in terms of their exact mode of toxicity on
the one hand and the physiological response of Daphnia to these toxins on the other hand. In
the case of cyanobacterial protease inhibitors, which interfere with Daphnia�s major digestive
enzymes (chymotrypsin and trypsin, Von Elert 2004), the physiological response of Daphnia
to these inhibitors has been elucidated by showing that Daphnia remodel their digestive
enzymes and increase expression of the respective protease genes (Von Elert et al. 2012,
Schwarzenberger et al. 2010). Another possibility of adaptation to cyanobacterial toxins is to
reduce the toxic effects in Daphnia by biotransformation of the toxins by conjugation to
glutathione (GSH), which has already been demonstrated in-vitro for the cyanobacterial
hepatotoxin microcystin-LR (MC-LR, Pflugmacher et al. 1998). Besides glutathione-s-
transferases (GSTs), which catalyze the conjugation of GSH to MCs, more than ten other
gene families have been reported to be direct or indirect targets of this cyclic peptide at the
cellular and molecular level in animal cells (reviewed in Campos & Vasconcelos 2010). Thus,
the huge variety of different toxic cyanobacterial metabolites and their possible targets in
Daphnia�s genome makes it nearly impossible to identify a priori those specific genes in a
natural and locally adapted Daphnia population that have undergone positive selection in the
presence of toxic cyanobacteria. With regard to the D. galeata population in Lake Constance
a single-target gene approach is therefore not a reasonable way to identify the physiological
mechanism of the increased tolerance to cyanobacteria.
Meanwhile, affordable sequencing (Shendure & Ji 2008) of whole genomes allows for
multiple-target gene approaches. Application of next-generation sequencing at the population
level has enabled the easy detection of single nucleotide polymorphisms (SNPs) in genomes
population-wide. Coleman & Chishom (2010) used a population-genomic approach to
compare two bacterial populations from two distinct ocean regions differing in the
concentration of available phosphorus. Their results revealed that phosphorus-related genes
from these two bacterial populations form phylogenetically distinct clusters, whereas house-
keeping genes did not.

Chapter 4
84
In the present study we have analyzed the genetic structure of three D. galeata
populations of Lake Constance via next-generation sequencing. As according to Weider et al.
(1997) we have isolated D. galeata resting eggs from three different layers of sediment
cores, representing the time before, during and after the peak of the eutrophication of Lake
Constance. We subsequently extracted the DNA from each resting egg, pooled the DNA for
each population separately and applied next-generation sequencing with a mean coverage of
50x. We used the data to determine the genetic diversity of the D. galeata populations. In
order to understand the physiological mechanisms underlying the adaptation to increased
cyanobacterial abundances we performed a genome-wide assessment of SNPs and copy
number variations of several gene families in each of the three D. galeata populations.
Outstanding changes in SNP frequencies can be a hint for natural selection on respective
genes resulting in traces of a genetic bottleneck, as has already been demonstrated for
human populations (i.e. Schmegner et al. 2005). Additionally we hypothesized that copy
numbers of possible target genes, which might be affected by the presence of cyanobacteria,
might have increased in the D. galeata populations during the time of eutrophication, as
Daphnia has been shown to cope with different environmental conditions by increasing the
rate of gene duplications (Colbourne et al. 2011).
Materials & Methods
Study site
Lake Constance is a large (surface area: 571km²), deep (maximum depth: 253 m) and
warm-monomictic lake situated at the borders of Germany, Switzerland and Austria on the
northern edge of the Alps (Fig. 2). It consists of three water basins: the Obersee (upper lake)
the Untersee (lower lake), and a connecting stretch of the river Rhine, called the Seerhein.
Data on phytoplankton species identity and abundances in Lake Constance were collected
continuously since 1957. For the years 1957-1964 no cyanobacterial species were found in
the upper basin of Lake Constance (Hairston et al. 2001). In the following years
cyanobacteria became common in Lake Constance and increased in abundance to mean
summer dry weights between 1 and 2.5 g/m² (Fig. 1). Concomitant with a decrease in
phosphorus the abundances of cyanobacteria decreased continuously after 1990 to values
around 0.2 mg/m³.

Chapter 4
85
Field collection, sediment dating and ephippia collecting
Three sediment cores were collected at 150 m depth in the upper basin of Lake
Constance (Obersee) in late summer of 2011 (Fig. 2, N47°37'32.12" E9°26'21.96").
Sediments were dated by counting annual laminations including high-water phases with
increased sedimentation. Earlier studies by Wessels et al. (1995) and Weider et al. (1997)
have already shown that dating by annual laminations coincides with exact measurement of
zinc concentrations and 137Cs-dating and therefore provides a very precise sediment dating.
Three different sediment age categories were chosen representing the time before (1954-
1960), during (1974-1979) and after (1994-1999) the peak of eutrophication in Lake
Constance. As according to Weider et al. (1997) the outer edge of each section was sliced
away in order to avoid the possible inadvertent transfer of ephippia between layers. The
sediment strata of all three sediment cores were subsequently sieved and screened with a
200 µm mesh to collect the ephippia, which were then sorted by hand under a dissecting
microscope, counted and stored in distilled water at 4°C.
Figure 2 Map of Lake Constance, modified after Wessels (1998). The sampling site of the
sediment cores are marked by an arrow

Chapter 4
86
DNA extraction and high-throughput sequencing
130 diapausing eggs from each of the three sediment age categories were decapsulated,
because an earlier study indicated that ephippia interfere with DNA amplification reactions
(Pollard et al. 2003). Daphnia genotypes in ephippial eggs result from sexual recombination
and can therefore be assumed as genetically unique. Decapsulated eggs were subsequently
pooled for each sediment age separately. The resultant population DNA was extracted by
using the peqGOLD® Tissue DNA Mini Kit (Peqlab, Erlangen, Germany) as according to the
manufacturer�s standard protocol. DNA concentration of each sample was determined using
Quant-iT� PicoGreen® dsDNA reagent (Invitrogen AG, Carlsbad, USA). The DNA extraction
efficiency and the final genomic DNA concentration varied between all samples (1954-1960:
1.9 ng/µl; 1974-1979: 8.7 ng/µl; 1994-1999: 4.6 ng/µl), but was sufficient to be normalized
and to build up genome libraries for all populations using the Illumina/Solexa Genome
Analyzer System. The D. galeata populations representing the time before (1954-1960),
during (1974-1979) and after the eutrophication (1994-1999) are referred hereafter as
POPpre, POPeu and POPpost, respectively.
Single-read mapping and RPKM measures
Total reads of each population were blasted against an unpublished D. galeata transcrip-
tome using blastn. This reference D. galeata transcriptome consisted of expressed sequence
tags (ESTs) derived from one inbred G100 isoclonal lineage that had been experimentally
challenged under 15 different conditions. The transciptome consists of 29500 contigs with an
average length of 665bp (further information on the D. galeata transcriptome can be found on
https://wiki.cgb.indiana.edu/display/grp/Daphnia+galeata). The minimum score for a positive
single read mapping onto the transcriptome assembly was set to 1E-30. In order to test for
possible adaptation of the D. galeata populations to the appearance of cyanobacteria in Lake
Constance on the level of gene copy number variations, we quantified gene levels in reads
per kilobase of exon model per million mapped reads (RPKM, Mortazavi et al. 2008). The
measurement of the RPKM values depicts the molar concentration of a gene after
normalizing for length and for the total number of reads in the sample. This ensures a
transparent comparison of gene levels both within and between population DNA samples. As
according to Mortazavi et al. (2008) the RPKM values for each contig were calculated using
the equation:

Chapter 4
87
���� � ���
����� ���������� � ������ ����������
Genes with RPKM values � 10 were considered as ecologically relevant and were therefore
included in the analysis. RPKM ratios � 2 of ecologically relevant genes between two
populations were assumed in the present study as significantly different. If, for an ecologically
relevant gene, the ratio of the RPKM values from two populations was � 2, the RPKM values
were assumed as significantly different.
SNP analysis
Major allele frequency (MAF) refers to the frequency at which the most common allele
occurs in a population. The MAF of each single nucleotide polymorphism (SNP) in each
population was determined. For each population the MAF of all SNPs in each contig was
arithmetically averaged. MAFs with coverage of at least ten reads per SNP and population
were considered as ecologically relevant and therefore included in the analysis.
In order to determine changes in allele frequencies (CAF), we calculated changes of
MAFs from POPeu and POPpost related to MAFs from POPpre for each contig separately using
the equation:
���� � ����
�
�
In which pi is the MAF for SNP i of the POPpre and qi the respective allele frequency in POPeu
or POPpost. �n� represents the total number of SNPs in a contig. This calculation was
performed for each of the 29500 contigs and for POPeu and POPpost, separately.
Target gene approach
In order to screen for possible target genes that might have been influenced by the
elevated cyanobacterial abundance during the peak of the eutrophication of Lake Constance,
several gene families were selected for the SNP analyses. We have analyzed genes that
encode for proteins with functions in the processes of MC uptake, toxic effects and

Chapter 4
88
biotransformation of secondary metabolites (Table 1). Target genes found in the literature
were searched for homologs in D. pulex transcripts using the wfleabase database (Colbourne
et al. 2005). Genes from D. pulex were subsequently blasted against the D. galeata
transcriptome using blastx. The minimum score for a positive blast result was set to 1E-50.
MAFs and CAFs were calculated for each gene and averaged to give the mean of each gene
family.
Table 1. Characteristics of target genes used in the comparative SNP analysis
Protein/Gene Biological function Effects of cyanobacterial toxins
Genes in D. galeata
Reference
Glutathione peroxidase
lessening of formation of lipid hydroperoxides, protection from oxidative damage
Detoxification of microcystin-LR-induced lipid hydroperoxides
4 Gehringer et al.(2004)
Glutathione-S-transferase
Contribution to biotransformation of xenobiotics, protection from oxidative damage
Detoxification of microcystins
17 Pflugmacher et al.(1998)
Mitogen activated protein kinase (MAPK)
Signal transduction, cell proliferation and differentiation
Microcystin-LR induced apoptosis through activation of multiple MAPK pathways
5 Komatsu et al. (2007)
Protein phosphatase
Regulation of protein activity
Inhibition by microcystins
5 DeMott & Dhawale (1995)
Elastase Protease Inhibition by elastase inhibitors
11 Singh et al. (2005)
Chymotrypsin Protease Inhibition by chymotrypsin inhibitors
15 Von Elert et al. (2012)
ABC-Transporter
Membrane transporter Increased gene expression induced by microcystin-LR
14 Ame et al. (2009)
NADH/NADPH oxidase
Electron transfer to superoxide
Microcystin-LR affects their phosphorylation resulting in reactive oxygen species (ROS)
5 Nong et al. (2007)
Trypsin Protease Inhibition by trypsin inhibitors
72 Agrawal et al.(2005)

Chapter 4
89
Data analysis
Kruskal-Wallis-test was used to analyze the effect of time on the MAFs of each gene
family in each population. Analysis of variance (ANOVA) could not be used due to a non-
Gaussian distribution of the MAFs. A significance level of p = 0.05 was applied to all
statistical analyses. All statistical tests were performed with SigmaPlot 11 (Systat Software,
Inc.). With regard to the CAF analysis, non overlapping error bars of a gene family were
assumed to be significantly different from the mean of all SNPs in each contig.
Results
With regard to the RPKM analyses median and mean values of each of the 29500 contigs
in all populations (POPpre, POPeu, POPpost) were quite similar (Table 2). We therefore
assumed a permission for RPKM comparisons among all populations.
Table 2 Summary of RPKM values for POPpre, POPeu and POPpost
��������� ��� ������ ����� ��� ������ ����
������ ����� ������ ���� ������ ������ �����
����� ���� ������ ���� ����� ����� �������
������� ���� ������ �� ������ ������ ������
Comparison of RPKM values between POPpre and POPeu revealed that 1003 ecologically
relevant predicted genes differed between both populations. 318 genes were significantly
more abundant in POPpre than in POPeu, while it was the other way around for 685 genes
(Fig. 3). When comparing the RPKM values of POPeu and POPpost overall 444 gene were
significantly different, out of which 166 genes were more abundant in POPpost than in POPeu,
while 278 ecologically relevant gene models had significantly higher RPKM values in POPeu
than in POPpost (Fig. 4).

Chapter 4
90
RPKM 1954-1960
10 100 1000
RP
KM
197
4-1
979
10
100
1000
more frequent in 1954-1960
more frequent in 1974-1979
Figure 3 Comparison of RPKM values of the genomic DNA of D. galeata isolated from
resting eggs from two different sediment layers, representing the time periods before (1954-
1960, x-axis) and during (1974-1979, y-axis) the peak of the eutrophication in Lake
Constance. RPKM values depict the molar concentration of a predicted gene after
normalizing for length and for the total number of reads in the sample. The higher the RPKM
value, the more abundant is a gene in a population. Each red triangle represents a gene with
a significantly higher RPKM value in the population from 1974-1979 compared to the
population from 1954-1960. Black stars represent genes that are significantly more frequent
in the population from 1954-1960 compared to the population from 1974-1979. Mind the log-
scale.
With regard to the comparison between POPpost and POPpre RPKM values of 1112 gene
were different: 634 genes were significantly more abundant in POPpost than in POPpre, while it
was the other way around for 478 genes (Fig. 5). One group of genes had outstandingly high
RPKM values in all populations and was additionally significantly more abundant in POPpost
than in POPpre (genes in red circle, Fig. 4). Blasting these genes via blastx against the NCBI
non-redundant protein sequences (http://www.ncbi.nlm.nih.gov/) revealed that each gene of
this group resulted from mtDNA. The RPKM values obtained for mitochondrial genes were
normalized to RPKM values of single copy genes from the same population, in order to

Chapter 4
91
obtain estimates of the number of mitochondrial genes per cell. A subsequent one-way
analysis of variances (ANOVA) exhibited significant differences of these normalized RPKM
values of mitochondrial genes between the three populations (F2,27=545.051; p<0.001).
Normalized RPKM vales of mitochondrial genes increased significantly from 164 (± 9 SE) in
POPpre to 235 (± 13 SE) in POPeu and further on to 334 (± 12 SE) in POPpost (Fig. 6,
p<0.001).
RPKM 1974-1979
10 100 1000
RP
KM
199
4-1
999
10
100
1000
more frequent in 1974-1979
more frequent in 1994-1999
Figure 4 RPKM value comparisons between the genomic DNA of D. galeata DNA isolated
from resting eggs from two different sediment layers, representing the time periods during
(1974-1979, x-axis) and after (1994-1999, y-axis) the peak of the eutrophication in Lake
Constance. RPKM values depict the molar concentration of a predicted gene after
normalizing for length and for the total number of reads in the sample. The higher the RPKM
value, the more abundant is a gene in a population. Each blue circle represents a gene with
a significantly higher RPKM value in the population from 1994-1999 compared to the
population from 1974-1979. With regard to the red triangles it is the other way around; these
genes are significantly more frequent in the population from 1974-1979 compared to the
population from 1994-1999. Mention the log transformation of both axes.

Chapter 4
92
RPKM 1954-1960
10 100 1000 10000
RP
KM
199
4-1
999
10
100
1000
10000
more frequent in 1954-1960
more frequent in 1994-1999
Figure 5 Comparison of RPKM values of the genomic DNA of D. galeata DNA isolated from
resting eggs from two different sediment layers, representing the time periods before (1954-
1960, x-axis) and after (1994-1999, y-axis) the peak of the eutrophication in Lake Constance.
RPKM values depict the molar concentration of a predicted gene after normalizing for length
and for the total number of reads in the sample. The higher the RPKM value, the more
abundant is a gene in a population. Each blue circle represents a gene with a significantly
higher RPKM value in the population from 1994-1999 compared to the population from 1954-
1960. With regard to the black stars it is the other way around; these genes are significantly
more frequent in the population from 1954-1960 compared to the population from 1994-1999.
Mention the log transformation of both axes. The red circle indicates a group of predicted
genes that resulted from mitochondrial DNA.
Concerning the MAF analyses, six out of ten target genes exhibited neither increases or
decreases in the major allele frequencies of respective SNPs over time (Fig. 7, Kruskal-
Wallis, p > 0.05): Elastases (H2=0.130, p = 0.937), protein phosphatases (H2=1.340, p =
0.512), mitogen-activated protein kinases (H2=2.940, p = 0.230), ABC transporter(H2=5.155,
p = 0.076), NADPH oxidases (H2=1.580, p = 0.454), glutathione-peroxidases (H2=4.500, p =
0.104). However, four other target genes exhibited significant effects regarding the major
base frequencies of SNPs (Fig. 7): trypsins (H2=43.865, p � 0.001), chymotrypsins
(H2=6.855, p � 0.05), GSTs (H2=22.633, p � 0.001) and mitochondrial genes (H2=23.094, p �
0.05) had significantly higher MAF values in POPpost than in POPpre.

Chapter 4
93
1954-1960 1974-1979 1994-1999
RP
KM
rati
o (
mtD
NA
: S
CG
)
100
150
200
250
300
350 Mean ± SEn=10
A B C
Figure 6 Estimation of the number of mitochondrial genes per cell for each of the D. galeata
DNA from resting eggs from three different sediment layers, representing the time periods
before (1954-1960), during (1974-1979) and after (1994-1999) the eutrophication peak in
Lake Constance (mean ± SE, n = 10). The RPKM values obtained for mitochondrial genes
were normalized to RPKM values of single copy genes from the same population. Different
letters indicated significantly differences between populations (one Way ANOVA, Tukey�s
HSD test, P<0.001).
The analysis of changes in major allele frequency (CAFs) of POPeu and POPpost compared
to POPpre revealed a mean CAF of about 10.4% concerning all 29500 genes for both
populations (Fig. 8). CAFs of gluthathione-peroxidases, NADH-oxidases, elastases and
chymotrypsins were assumed as not to differ from the mean in both populations due to
overlapping error bars. However, CAFs of GSTs (POPeu: 14.5% ± 0.96% SE; POPpost: 14.6%
± 0.95% SE), ABC-transporter (POPeu: 11.4% ± 0.75% SE; POPpost: 12.3% ± 0.68% SE) and
trypsins (POPeu: 11.96% ± 0.46% SE; POPpost: 12.06% ± 0.45% SE) were in POPeu as well
as in POPpost significantly higher than the mean, whereas major allele frequencies of protein-
phosphatases (POPeu: 7.9% ± 1.05% SE; POPpost: 8.6% ± 1.35% SE) and mitochondrial
genes (POPeu: 1.48% ± 0.41% SE; POPpost: 1.57% ± 0.51% SE) changed significantly less
than the mean of all genes. Mitogen-activated protein kinases exhibited significant lower
CAFs for POPeu (7.9% ± 2.1%), while they were not different from the mean in POPpost
(9.04% ± 1.56%).

Chapter 4
94
Glutathione-S-Transferases
NADPH Oxidases
ABC Transporter
Mitogen-activatedprotein kinases
Chymotrypsins
Major allele frequency (MAF) of SNPs (%)
86 88 90 92 94 96 98 100
86 88 90 92 94 96 98 100
All SNPs
mtDNA
Glutathione-peroxidases
Proteinphosphatases
Elastases
Trypsins
Major allele frequency (MAF) of SNPs (%)
Mean ± SE
AAA
ABB
AAA
AABB
AAA
ABB
ABB
(n=72)
(n=15)
(n=11)
(n=5)
(n=5)
(n=14)
(n=5)
(n=17)
(n=4)
(n=10)
(n=27116)
AAA
AAA
AAA
1954-1960
1974-1979
1994-1999
Figure 7 Major allele frequencies (MAFs) of SNPs within target gene families from D. galeata
DNA isolated from resting eggs from three different sediment layers, representing the time
periods before (1954-1960), during (1974-1979) and after (1994-1999) the eutrophication
peak in Lake Constance (mean ± SE, various n). Target gene families were selected on the
basis of that interference of cyanobacterial secondary metabolites with the gene products
has been reported elsewhere. High mean frequencies of major alleles indicate less variability
within a gene family. Different letters within target gene families indicated significantly
differences between populations (one Way ANOVA, Tukey�s HSD test, P<0.001).

Chapter 4
95
(n=72)
(n=15)
(n=11)
(n=5)
(n=5)
(n=14)
(n=5)
(n=17)
(n=4)
(n=10)
Changes in allele frequency (CAF) of SNPs (%)
0 2 4 6 8 10 12 14 16
0 2 4 6 8 10 12 14 16
mtDNA
Glutathione-peroxidases
Glutathione-S-Transferases
NADPH Oxidases
ABC Transporter
Mitogen-activatedprotein kinases
Proteinphosphatases
Elastases
Chymotrypsins
Trypsins
Mean ± SE
Changes in allele frequency (CAF) of SNPs (%)
1974-1979
1994-1999
Figure 8 Changes of the major allele frequencies (CAFs) of SNPs within target gene families
from D. galeata DNA isolated from resting eggs from two different sediment layers,
representing the time periods during (1974-1979) and after (1994-1999) the eutrophication
peak in Lake Constance compared to resting eggs from a sediment layer, representing the
time period before (1954-1960) the eutrophication peak (mean ± SE, various n). The dotted
line represents the mean frequency changes of all SNPs. Values with error bars not-
overlapping the dotted line were assumed as significantly different from the mean.

Chapter 4
96
Discussion
Anthropogenic phosphorus loading in the past century has led to an enhancement of
eutrophication in many lakes in Europe (Güde et al. 1998). In Lake Constance these changes
in the trophic state resulted in shifts in the taxonomical compositions of the phytoplankton
favoring the abundance of cyanobacterial genera (Kümmerlin 1998). Concomitant with the
altered phytoplankton community in Lake Constance, Weider et al. (1997) noted significant
genotypic shifts in the D. galeata population by collecting resting eggs from lake sediments.
In the present study we verified these genotypic population shifts by comparing RPKM values
and SNP frequencies of the D. galeata populations before, during and after the time of
eutrophication in Lake Constance. With regard to the RPKM-values more than twice as many
genes changed significantly from POPpre to POPeu than from POPeu to POPpost, while the
temporal distance of adjacent populations was the same (~ 20 years). Additionally, the higher
mean MAFs of all genes in POPeu than in POPpre lead to the conclusion that the genotypic
composition of the D. galeata population changed substantially as a result of changing
environmental conditions in Lake Constance during the time of eutrophication.
It has been suggested that these changes in the genetic structure of the D. galeata
population were related to micro-evolutionary changes which reflected differences of the
clones in their ability to cope with cyanobacteria as food (Hairston et al. 1999, 2001).
Cyanobacteria are capable of producing a wide range of toxic secondary metabolites
including hepatotoxins, neurotoxins and protease inhibitors (Wiegand & Pflugmacher 2005).
During the time of eutrophication the species Anabaena planktonica and Aphanizomenon
flos-aquae became abundant in Lake Constance (Kümmerlin 1998). Members of the genus
Aphanizomenon are known to produce neurotoxins and cyanotoxins, such as
cyclindrospermopsin (Banker et al. 1997), while Anabaena produces the neurotoxins
anatoxin-a (Bruno et al. 1994) and MICs (Sivonen & Jones, 1999). Furthermore, Hairston et
al. (1999) used in their study a microcystin producing strain of the genus Microcystis, which
was originally isolated from Lake Constance in 1972, which leads to the suggestion that
members of the genus Microcystis were also abundant in Lake Constance during the time of
eutrophication. Therefore it is reasonable to assume that the D. galeata population of Lake
Constance had to struggle with microcystins and other toxins from cyanobacterial sources
during the time of eutrophication. Consequently, natural selection favored those D. galeata
genotypes that were better adapted to increasing cyanobacterial toxin concentrations leading
to an increase of the mean tolerance of the D. galeata population to cyanobacteria, which
has already been observed by Hairston et al. (1999, 2001). However, the respective genes

Chapter 4
97
and metabolic pathways of the D. galeata population, which were affected by changes of the
phytoplankton community and the occurrence of cyanobacteria, remained unclear in the
mentioned studies. Here we found evidence that the occurrence of cyanobacterial toxins
were contributing to the genotypic shift in the D. galeata population of Lake Constance during
the course of eutrophication.
The most frequent cyanotoxins in freshwater ecosystem are the cyclic peptide toxins of
MCs and nodularins (Chorus & Bartram 1999). MCs are potent hepatotoxins produced by a
variety of cyanobacterial genera, such as Anabaena, Oscillatoria, Planktothrix and
Microcystis (Chorus & Bartram) and are known to irreversibly inhibit the protein
phosphatases PP1 and PP2A of Daphnia (DeMott & Dhawale 1995). Additionally, several
recent reports have argued that an exposure to MCs causes the production of ROS [ e.g.
hydrogen peroxide (H202), superoxide anion (O2-), hydroxyl (OH�)] which leads to oxidative
stress within animal cells resulting in lipid peroxidation and DNA damage (Ding et al. 2001,
Amado & Monserrat 2010). Oxidative degradation of lipids and fatty acids as a result of
oxidative stress lead to the formation of hydroperoxides, representing the end product of lipid
peroxidation (Sharma et al. 2004). The termination of ROS-induced lipid peroxidation and the
detoxification of hydroperoxides are therefore crucial to protect cells from oxidative stress
(Sharma et al. 2004). Alpha class GSTs are known to play an even more important role in
protection against lipid peroxidation than glutathione-peroxidases (Yang et al. 2002). GSTs
can interrupt the autocatalytic chain of lipid peroxidation by reducing hydroperoxides through
the conjugation to GSH (i.e. Yang et al. 2001).
GSTs probably catalyze the biotransformation of microcystins in Daphnia by conjugation
to GSH, which has already been shown in vitro (Pflugmacher et al. 1998). The resultant
conjugate of MC and GSH is less toxic than MC alone and has been suggested as a first
step of the cellular detoxification mechanism (Amado & Monserrat 2010).
Several studies have indicated that exposure to MCs leads to higher GST activity and
increased transcription of GST genes in animal cells (i.e. Cazenave et al. 2005, Gehringer et
al. 2004). In the present study we demonstrated that major allele frequencies of GSTs
changed significantly stronger during the course of eutrophication in Lake Constance than
the mean of all other genes. Our data suggest that MICs from cyanobacterial sources led to
elevated levels of oxidative stress in Daphnia cells during the time of eutrophication and
increased inhibition of the protein phosphatases PP1 and PP2a. Thus it is reasonable to
assume that the selection pressure on Daphnia�s detoxifying enzymes, such as GSTs,
increased concomitant with the occurrence of cyanobacteria that contained toxins. As a

Chapter 4
98
consequence, natural selection should have favored those D. galeata genotypes that
exhibited more efficient GSTs. In addition, we observed an overall increase of the major
allele frequencies of all genes, which indicates a decrease of the genetic diversity of the D
galeata population in Lake Constance. Our data suggests that the loss of genetic variability
as well as the even significantly stronger decrease in GST diversity of POPpost was a
consequence of the occurrence of MCs from cyanobacterial sources.
The assumption that an increase in the abundance of cyanobacteria constitutes the major
selection factor for the D. galeata population during the time of eutrophication, is further
corroborated by the finding that the mtDNA in the D. galeata population increased
concomitantly with the occurrence of cyanobacteria in Lake Constance. Several studies have
demonstrated that MCs from cyanobacteria interact with mitochondrial components, leading
to dysfunction of the organelle and cell apoptosis (Campos & Vasconcelos 2010, Amado &
Monserrat 2010). In Daphnia the exposure of cells to MC-LR finally leads to broken and
blurry mitochondria in the alimentary canal and epidermis (Chen et al. 2005). In more detail,
MCs were suggested to disrupt the mitochondrial electron transport chain, which then favors
the generation of ROS (Ding et al. 2002). High ROS levels coincide with dysfunctional
mitochondria due to depolarization of the membrane potential and increased mitochondrial
membrane permeability (Ding et al. 2000a; Ding & Ong 2003). Additionally, Mikhailov et al.
(2003) have shown that MC-LR can bind to the beta subunit of ATP-synthase, which finally
contributes to mitochondrial membrane depolarization, disruption of mitochondrial electron
transport chain and the generation of ROS. The depolarization of the mitochondrial
membrane potential finally leads to the release of cytochrome c and subsequently to
apoptosis of the cell (i.e. Zhang et al. 2007). The observed significant higher amount of
mtDNA in POPeu than in POPprä is possibly a physiological response to cyanobacterial toxins
and may result from two different mechanisms: Firstly, the number of mitochondria per cell
increased in the D. galeata population during the time of eutrophication. Lee et al. (2000)
have shown that oxidative stress induced by H2O2 results in an increase of functional
mitochondria and mtDNA in human fibroblasts. Our data suggest that the observed increase
might constitute a compensatory response to the enhanced disruption of mitochondria
caused by the increased exposure to cyanobacterial toxins during the time of eutrophication.
Secondly, the number of mtDNA copies per mitochondrium increased, while the number of
mitochondria per cell remained constant. Several studies have indicated that exposure to
MCs induces DNA damage in vitro and in vivo by the oxidation of purines (Juhel et al. 2007,
Zegura et al. 2004). Liu et al. (2003) and Wang et al. (2011) have demonstrated that copy
number changes of human mtDNA are correlated with oxidative stress. Thus, we suggest

Chapter 4
99
that an increased mtDNA copy number might compensate for deletions in the mtDNA caused
by increased oxidative stress. Further comparisons have to be performed to elucidate
whether the increased ratio of mtDNA to single copy genes indicates an increase of the
number of mitochondria per cell or an increase of mtDNA copies per mitochondrium.
However, in POPpost the number of mtDNA per cell was the highest, even higher than in
POPeu. D. galeata resting eggs for POPeu were isolated from the sediment layers
representing the time period from 1974-1979. We suggest that the selection pressure on
Daphnia�s mitochondria caused by cyanobacterial microcystins maintained till the end of the
1980s, since the last cyanobacterial peak was recorded in 1988 (Fig. 1). We assumed that
the maintenance of microcystins in the 1980s led to a successive linear increase of mtDNA in
the D. galeata. Thus, the finding of highest mtDNA copy number in POPpost it not very
surprising, since the recovery to the status of pre-eutrophication in terms of neutral evolution
is much slower than adaptive evolution assuming that the increased amount of mitochondria
has no disadvantage for the D. galeata population.
Besides significant increases of major allele frequencies (MAF) in GSTs and copy
numbers of mtDNA, MAFs of Daphnia�s serine proteases trypsin and chymotrypsin also
increased significantly from POPprä to POPpost. Trypsins and chymotrypsins are responsible
for 80% of the proteolytic activity in the gut of Daphnia (Von Elert et al. 2004). Several
studies indicate that cyanobacterial protease inhibitors directly inhibit these digestive
proteases of Daphnia (Agrawal et al. 2005; Schwarzenberger et al. 2010) and lead to
reduced somatic growth of Daphnia (Von Elert et al. 2012). More than twenty depsipeptides
were found in different genera of marine and freshwater cyanobacteria (Gademann &
Portmann 2008), specifically inhibiting the serine proteases chymotrypsin and trypsin. A
recent study by Kuster et al. (2012) has shown that the edible size fraction of natural seston
can inhibit Daphnia�s trypsins and chymotrypsins, and this inhibitory potential can be in the
same order of magnitude as pure cyanobacterial cultures (Czarnecki et al. 2006). Hence, it is
reasonable to assume that an interference of cyanobacterial protease inhibitors with
Daphnia�s digestive proteases occurs in nature and is ecologically relevant. In the D. galeata
population of Lake Constance chymotrypsins and trypsins exhibited significantly higher
relative changes in their major allele frequency than the mean of all SNPs. The loss of
genetic variability in protease genes coincided with increasing abundances of cyanobacteria
in the course of Lake Constance�s eutrophication. We suggest that this loss could result from
natural selection due to increasing cyanobacterial protease inhibition and the extinction of
less tolerant D. galeata genotypes.

Chapter 4
100
In conclusion, the here presented population genome approach renders evidence that at
least two independent cellular mechanisms caused by cyanobacterial toxins are responsible
for the changes of the genetic structure of the D. galeata population in Lake Constance: (1)
MICs from cyanobacterial sources have caused increased levels of ROS, the major causes
for oxidative stress in cells and their mitochondria. (2) Cyanobacterial inhibitors interfered
with Daphnia�s proteases leading to an inhibition of their digestive enzymes. Life-history
experiments with ex-ephippia hatchlings demonstrated that eutrophication in Lake Constance
resulted in more cyanobacteria-tolerant D. galeata populations (Hairston et al. 1999). Our
data reveals that at least two types of cyanobacterial inhibitors, protease inhibitors and MCs
were major selective forces driving the microevolutionary changes towards a more
cyanobacteria-tolerant D. galeata population during the time of eutrophication.

Chapter 4
101
References
Agrawal MK, Bagchi D & Bagchi SN (2001) Acute inhibition of protease and suppression of
growth in zooplankter, Moina macrocopa, by Microcystis blooms collected in Central India.
Hydrobiologia, 464, 37-44.
Agrawal MK, Zitt A, Bagchi D et al. (2005) Characterization of proteases in guts of Daphnia
magna and their inhibition by Microcystis aeruginosa PCC 7806. Environmental
Toxicology, 20, 314-322.
Amado L & Monserrat J (2010) Oxidative stress generation by microcystins in aquatic
animals: Why and how. Environment International, 36, 226-235.
Ame MV, Baroni MV, Galanti LN, Bocco JL & Wunderlin DA (2009) Effects of microcystin-LR
on the expression of P-glycoprotein in Jenynsia multidentata. Chemosphere, 74, 1179-
1186.
Banker R, Carmeli S, Hadas O et al. (1997) Identification of cylindrospermopsin in
Aphanizomenon ovalisporum (Cyanophyceae) isolated from Lake Kinneret, Israel. Journal
of Phycology, 33, 613-616.
Bruno M, Barbini DA, Pierdominici E, Serse AP & Ioppolo A (1994) Anatoxin-a and a
previously unknown toxin in Anabaena planctonica from blooms found in Lake Mulargia
(Italy). Toxicon, 32, 369-373.
Campos A & Vasconcelos V (2010) Molecular mechanisms of microcystin toxicity in animal
cells. International Journal of Molecular Sciences, 11, 268-287.
Cazenave J, Wunderlin DA, Bistoni MDL et al. (2005) Uptake, tissue distribution and
accumulation of microcystin-RR in Corydoras paleatus, Jenynsia multidentata and
Odontesthes bonariensis - A field and laboratory study. Aquatic Toxicology, 75, 178-190.
Chen W, Song LR, Ou DY & Gan NQ (2005) Chronic toxicity and responses of several
important enzymes in Daphnia magna on exposure to sublethal microcystin-LR.
Environmental Toxicology, 20, 323-330.
Chorus,I. & Bartram,J. (1999) Toxic Cyanobacteria in Water: a Guide to Public Health
Significance. Monitoring and Management: 416pp
Colbourne JK, Singan VR & Gilbert DG (2005) wFleaBase: The Daphnia genome database.
BMC Bioinformatics, 6.
Colbourne JK, Pfrender ME, Gilbert D et al. (2011) The ecoresponsive genome of Daphnia
pulex. Science, 331, 555-561.
Coleman ML & Chisholm SW (2010) Ecosystem-specific selection pressures revealed
through comparative population genomics. Proceedings of the National Academy of
Sciences of the United States of America, 107, 18634-18639.

Chapter 4
102
Czarnecki O, Henning M, Lippert I & Welker M (2006) Identification of peptide metabolites of
Microcystis (Cyanobacteria) that inhibit trypsin-like activity in planktonic herbivorous
Daphnia (Cladocera). Environmental Microbiology, 8, 77-87.
Demott WR & Dhawale S (1995) Inhibition of in-vitro protein phosphatase-activity in 3
zooplankton species by microcystin-lr, a toxin from cyanobacteria. Archiv für
Hydrobiologie, 134, 417-424.
Ding WX & Ong CN (2003) Role of oxidative stress and mitochondrial changes in
cyanobacteria-induced apoptosis and hepatotoxicity. Fems Microbiology Letters, 220, 1-7.
Ding WX, Shen HM & Ong CN (2000) Critical role of reactive oxygen species and
mitochondrial permeability transition in microcystin-induced rapid apoptosis in rat
hepatocytes. Hepatology, 32, 547-555.
Ding WX, Shen HM & Ong CN (2001) Critical role of reactive oxygen species formation in
microcystin-induced cytoskeleton disruption in primary cultured hepatocytes. Journal of
Toxicology and Environmental Health-Part A, 64, 507-519.
Ding WX, Shen HM & Ong CN (2002) Calpain activation after mitochondrial permeability
transition in microcystin-induced cell death in rat hepatocytes. Biochemical and
Biophysical Research Communications, 291, 321-331.
Gademann K & Portmann C (2008) Secondary metabolites from cyanobacteria: Complex
structures and powerful bioactivities. Current Organic Chemistry, 12, 326-341.
Gehringer MM, Shephard EG, Downing TG, Wiegand C & Neilan BA (2004) An investigation
into the detoxification of microcystin-LR by the glutathione pathway in Balb/c mice.
International Journal of Biochemistry & Cell Biology, 36, 931-941.
Güde H, Rossknecht H & Wagner G (1998) Anthropogenic impacts on the trophic state of
Lake COnstance during the 20th century. Archiv für Hydrobiologie, 53, 85-108.
Hairston NG, Holtmeier CL, Lampert W et al. (2001) Natural selection for grazer resistance to
toxic cyanobacteria: Evolution of phenotypic plasticity? Evolution, 55, 2203-2214.
Hairston NG, Lampert W, Caceres CE et al. (1999) Lake ecosystems - Rapid evolution
revealed by dormant eggs. Nature, 401, 446.
Juhel G, O'Halloran J, Culloty SC et al. (2007) In vivo exposure to microcystins induces DNA
damage in the haemocytes of the zebra mussel, Dreissena polymorpha, as measured with
the comet assay. Environmental and Molecular Mutagenesis, 48, 22-29.
Komatsu M, Furukawa T, Ikeda R et al. (2007) Involvement of mitogen-activated protein
kinase signaling pathways in microcystin-LR-induced apoptosis after its selective uptake
mediated by OATP1B1 and OATP1B3. Toxicological Sciences, 97, 407-416.
Kümmerlin RE (1998) Taxonomical response of the phytoplankton community of Upper Lake
Constance (Bondesee-Obersee) to eutrophication and re-oligotrophication. Archiv für
Hydrobiologie, 53, 109-117.

Chapter 4
103
Kümmerlin RE & Bürgi H (1989) Die langjährige Entwicklung des Phytoplanktons im
Bodensee (1961�1986). Berichte der Internationalen Gewässerschutzkommission für den
Bodensee, 39.
Kuster C, Schwarzenberger A & Von Elert E (2012) Seasonal dynamics of sestonic protease
inhibition: impact on Daphnia populations. Hydrobiologia, 1-14.
Lee HC, Yin PH, Lu CY, Chi CW & Wei YH (2000) Increase of mitochondria and
mitochondrial DNA in response to oxidative stress in human cells. Biochemical Journal,
348, 425-432.
Liu CS, Tsai CS, Kuo CL et al. (2003) Oxidative stress-related alteration of the copy number
of mitochondrial DNA in human leukocytes. Free Radical Research, 37, 1307-1317.
Lürling M & van der Grinten E (2003) Life-history characteristics of Daphnia exposed to
dissolved microcystin-LR and to the cyanobacterium Microcystis aeruginosa with and
without microcystins. Environmental Toxicology and Chemistry, 22, 1281-1287.
Lürling M, Faassen EJ & Van Eenennaam JS (2011) Effects of the cyanobacterial neurotoxin
beta-N-methylamino-L-alanine (BMAA) on the survival, mobility and reproduction of
Daphnia magna. Journal of Plankton Research, 33, 333-342.
Mikhailov A, Harmala-Brasken AS, Hellman J, Meriluoto J & Eriksson JE (2003) Identification
of ATP-synthase as a novel intracellular target for microcystin-LR. Chemico-Biological
Interactions, 142, 223-237.
Mortazavi A, Williams BA, McCue K, Schaeffer L & Wold B (2008) Mapping and quantifying
mammalian transcriptomes by RNA-Seq. Nature Methods, 5, 621-628.
Nong Q, Komatsu M, Izumo K et al. (2007) Involvement of reactive oxygen species in
microcystin-LR-induced cytogenotoxicity. Free Radical Research, 41, 1326-1337.
Pflugmacher S, Wiegand C, Oberemm A et al. (1998) Identification of an enzymatically
formed glutathione conjugate of the cyanobacterial hepatotoxin microcystin-LR: the first
step of detoxication. Biochimica et Biophysica Acta-General Subjects, 1425, 527-533.
Pollard HG, Colbourne JK & Keller W (2003) Reconstruction of centuries-old Daphnia
communities in a lake recovering from acidification and metal contamination. Ambio, 32,
214-218.
Porter KG & Mcdonough R (1984) The energetic cost of response to blue-green-algal
filaments by cladocerans. Limnology and Oceanography, 29, 365-369.
Schmegner C, Hoegel J, Vogel W & Assum G (2005) Genetic variability in a genomic region
with long-range linkage disequilibrium reveals traces of a bottleneck in the history of the
European population. Human Genetics, 118, 276-286.
Schwarzenberger A, Zitt A, Kroth P, Mueller S & Von Elert E (2010) Gene expression and
activity of digestive proteases in Daphnia: effects of cyanobacterial protease inhibitors.
BMC physiology, 10, 6.

Chapter 4
104
Sharma R, Yang Y, Sharma A, Awasthi S & Awasthi YC (2004) Antioxidant role of
glutathione S-transferases: Protection against oxidant toxicity and regulation of stress-
mediated apoptosis. Antioxidants & Redox Signaling, 6, 289-300.
Shendure J & Ji H (2008) Next-generation DNA sequencing. Nature Biotechnology, 26,
1135-1145.
Sivonen K & Jones G (1999) Cyanobacterial toxins. Toxic cyanobacteria in water: A guide to
their public health consequences. Monitoring and Management: 41-111.
Von Elert E (2002) Determination of limiting polyunsaturated fatty acids in Daphnia galeata
using a new method to enrich food algae with single fatty acids. Limnology and
Oceanography, 47, 1764-1773.
Von Elert E (2004) Food quality constraints in Daphnia: interspecific differences in the
response to the absence of a long chain polyunsaturated fatty acid in the food source.
Hydrobiologia, 526, 187-196.
Von Elert E, Agrawal MK, Gebauer C et al. (2004) Protease activity in gut Daphnia magna:
evidence for trypsin and chymotrypsin enzymes. Comparative Biochemistry and
Physiology B-Biochemistry & Molecular Biology, 137, 287-296.
Von Elert E, Martin-Creuzburg D & Le Coz JR (2003) Absence of sterols constrains carbon
transfer between cyanobacteria and a freshwater herbivore (Daphnia galeata).
Proceedings of the Royal Society of London Series B-Biological Sciences, 270, 1209-
1214.
Von Elert E, Zitt A & Schwarzenberger A (2012) Inducible tolerance to dietary protease
inhibitors in Daphnia magna. Journal of Experimental Biology, 215, 2051-2059.
Wang YC, Lee WC, Liao SC et al. (2011) Mitochondrial DNA copy number correlates with
oxidative stress and predicts mortality in nondiabetic hemodialysis patients. Journal of
Nephrology, 24, 351-358.
Weider LJ, Lampert W, Wessels M, Colbourne JK & Limburg P (1997) Long-term genetic
shifts in a microcrustacean egg bank associated with anthropogenic changes in the Lake
Constance ecosystem. Proceedings of the Royal Society of London - Series B: Biological
Sciences, 264, 1613-1618.
Wessels M, Lenhard A, Giovanoli F & Bollhofer A (1995) High resolution time series of lead
and zinc in sediments of Lake Constance. Aquatic Sciences, 57, 291-304.
Wiegand C & Pflugmacher S (2005) Ecotoxicological effects of selected cyanobacterial
secondary metabolites a short review. Toxicology and Applied Pharmacology, 203, 201-
218.
Yang Y, Cheng JZ, Singhal SS et al. (2001) Role of glutathione S-transferases in protection
against lipid peroxidation - Overexpression of hgsta2-2 in k562 cells protects against
hydrogen peroxide-induced apoptosis and inhibits JNK and caspase 3 activation. Journal
of Biological Chemistry, 276, 19220-19230.

Chapter 4
105
Yang YS, Sharma R, Zimniak P & Awasthi YC (2002) Role of alpha class glutathione S-
transferases as antioxidant enzymes in rodent tissues. Toxicology and Applied
Pharmacology, 182, 105-115.
Zegura B, Lah TT & Filipic M (2004) The role of reactive oxygen species in microcystin-LR-
induced DNA damage. Toxicology, 200, 59-68.
Zhang H, Zhang J, Chen Y & Zhu Y (2007) Influence of intracellular Ca2+ mitochondria
membrane potential, reactive oxygen species, and intracellular ATP on the mechanism of
Microcystin-LR induced apoptosis in carassius auratus lymphocytes in vitro.
Environmental Toxicology, 22, 559-564.
�

Concluding remarks
106
Concluding remarks and perspectives
Cyanobacteria are prokaryotic photoautotrophs and belong to the most successful and
oldest life forms on earth (Gademann & Portmann 2008). They include unicellular and
colonial species and inhabit almost all aquatic environments as planktonic cells or bentic
biofilms. Besides the well known association with hazards to human health and livestock
(Carmichael 1994) cyanobacterial blooms cause substantial reductions of the fitness of
freshwater zooplankton. Cyanobacteria have been claimed to be a major factor for a
constrained mass and energy transfer from primary producers to primary consumers (i.e.
daphnids, copepods) and even higher trophic levels, such as insect larvae or planktivorous
fish. Daphnia, which is an unselective filter feeder and important herbivorous grazer in many
lakes and ponds, has to struggle with the poor food quality of cyanobacteria due to multiple
factors. One of these factors is the morphology of cyanobacterial cells. For example, large
cyanobacterial filaments can resist ingestion by interfering with the filtering apparatus of
Daphnia (DeMott et al. 2001). Additionally cyanobacteria lack sterols and contain only small
amounts of polyunsaturated fatty acids. Such lipids are essentials for Daphnia�s nutrition,
since daphnids cannot synthesize these compounds in sufficient amounts by itself (i.e. Von
Elert et al. 2003, Von Elert 2002). Thirdly, cyanobacteria produce a variety of secondary
metabolites, such as microcystins and protease inhibitors (Sivonen & Jones 1999,
Gademann & Portmann 2008). These compounds lead to significantly reduced growth in
Daphnia (i.e. Von Elert et al. 2012). In the growth experiments of chapter 1 and chapter 3
biochemical lipid deficiencies and negative effects of microcystins can be ruled out as causal
factors for the observed growth reduction of Daphnia on cyanobacterial diets, since
microcystin-free cyanobacteria were fed in mixtures with a green algal ensuring sufficient
supply of essential lipids. Additionally, all cyanobacterial strains as well as the green alga
were cultured as single cells and were such well ingestible. The cyanobacterial strains used
here produced exclusively either the chemically known chymotrypsin inhibitors Cyanopeptolin
954 and Nostopeptin BN920 (Von Elert et al. 2005) or specific cyanopeptolins (A-D), which
are known to inhibit trypsins (Weckesser et al. 1996). Von Elert et al. (2012) have recently
shown that the concentration of chymotrypsin inhibitors in cyanobacterial cells were four to
five orders of magnitude higher than the concentration, which is needed to inhibit 50 % of
Daphnia�s chymotrypsin activity. Thus, it is reasonable to assume that the observed negative
effects on population and somatic growth were caused by an interference of the
cyanobacterial protease inhibitors with trypsins and chymotrypsins in the gut of Daphnia.
Both digestive enzymes are responsible for more than 80 % of the proteolytic activity in the

Concluding remarks
107
gut of D. magna (Von Elert et al. 2004). Several studies have demonstrated a direct inhibition
of Daphnia�s trypsins and chymotrypsins by cyanobacterial inhibitors (Von Elert et al. 2005,
Schwarzenberger et al. 2010, Agrawal et al. 2005). The data presented in chapter 1
corroborate the finding of Czarnecki et al. (2006) that an inhibition of Daphnia�s trypsins
occurs in nature and might therefore be ecologically relevant. Furthermore, the data in
chapter 1 show for the first time that the seston fraction smaller than 55 µm, which
constitutes the edible size fraction for Daphnia (Gophen & Geller 1984, Hessen 1985), can
also inhibit Daphnia�s chymotrypsins. Besides trypsins, chymotrypsins account for the largest
proportion of proteolytic activity in the gut of D. magna (Von Elert et al. 2004). With regard to
the well-known seasonal succession of the phytoplankton community (Sommer et al. 1986)
chapter 1 describes for the first time seasonal changes of the potential of natural lake seston
to inhibit both types of proteases in D. magna. The potential of the edible seston to inhibit
chymotrypsins was up to 100-300 times higher in fall than in spring for each of the
successive years that were analyzed, which strongly suggests that the proportion of
cyanobacteria with protease inhibitors in the phytoplankton community of this lake increased
significantly within each season. This coincides with the finding that cyanobacteria mass
developments occur more frequently at the end of the season, when the temperature of the
epilimnion reaches its maximum (Sommer et al. 1986, Jöhnk et al. 2008).
In parallel with seasonal changes in the potential of the natural phytoplankton to inhibit
proteases, the genetic structure of the D. magna population changed significantly.
Microsatellite analyses revealed that D. magna clones isolated in spring were genetically
distinct from those isolated in fall. Additionally, the genetic diversity of the D. magna
population decreased within season. This loss of genetic variability coincided with an
increase of the inhibitory potential on chymotrypsins in the seston and might thus result from
natural selection due to increasing protease inhibition on D. magna genotypes. I assumed
that this would consequently lead to an increased mean tolerance of Daphnia to
cyanobacterial protease inhibitors by the end of the season. Blom et al. (2006) showed that
Daphnia sp. coexisting with Planktothrix rubescens, a cyanobacterium that contains the
trypsin inhibitor oscillapeptin J, were significantly more tolerant to this trypsin inhibitor than
Daphnia sp. from lakes free of this cyanobacterium. However, neither in single-clone growth
experiments nor in competition experiments I found evidence that D. magna genotypes from
the fall were better adapted to cyanobacteria containing protease inhibitors in terms of higher
growth rates than genotypes from the spring (chapter 1). It remains unclear whether
seasonally peaking sestonic protease inhibition over several years had already led to a
locally adapted D. magna population. This would result in a comparably high level of
Concluding remarks
108
tolerance to cyanobacterial protease inhibitors throughout the season as has been observed
in chapter 1. Comparisons of the tolerance of Daphnia populations that exist in the absence
or the presence of dietary protease inhibitors could provide evidence for such a local
adaptation of a Daphnia population to cyanobacteria, as has already been shown earlier
(Sarnelle et al. 2005).
Depending on initial conditions Daphnia may not only control the development of bloom-
forming cyanobacteria but as well suppress already established cyanobacterial blooms
(Sarnelle 2007). The data presented in chapter 3 suggest that D. magna may control the
development of cyanobacterial blooms more efficiently than D. pulex due to significant
differences in their tolerance to cyanobacteria. In this case I deliberately chose cyanobacteria
producing protease inhibitors but no microcystins, as protease inhibitors are among the most
widespread cyanobacterial secondary metabolites and as I specifically wanted to compare
Daphnia�s tolerance to this class of inhibitors. Protease assays revealed that the sensitivities
of chymotrypsins and trypsins to cyanobacterial protease inhibitors did not differ between D.
magna and D. pulex. However, D. magna exhibited a significantly higher specific
chymotrypsin activity than D. pulex, which explains the observed higher tolerance of D.
magna to cyanobacterial protease inhibitors. The differences in growth and chymotrypsin
activity might result from general differences in their coexistence with cyanobacteria:
Compared to other algal groups cyanobacteria have high temperature optima (Dokulil &
Teubner 2000) and dominate the phytoplankton community in eutrophic lakes mainly in late
summer and early fall (Jöhnk et al. 2008). Their important herbivorous grazers, D. magna
and D. pulex, are both most commonly abundant in fishless or turbid ponds (DeMott & Pape
2005). D. magna is able to tolerate elevated temperatures up to 25 °C (Wojtal-Frankiewicz
2012) and is able to increase in abundance upon nutrient enrichment and associated
eutrophication (Verreydt et al. 2012). In contrast to D. magna the geographic distribution of
D. pulex ranges rather from the temperate to the arctic zone (Colbourne et al. 1998). In
addition, D. pulex usually reaches its highest densities in spring an early summer, while D.
magna shows no clear seasonal density pattern (Bengtsson 1993). Following this line of
reasoning, coexistence of D. magna and cyanobacteria would thus occur more frequently
than a coexistence of cyanobacteria with D. pulex. Due to microevolutionary adaptation a
putatively more frequent coexistence would consequently result in an increased tolerance of
D. magna to cyanobacterial protease inhibitors. Although there is evidence that the observed
higher mean tolerance of D. magna to cyanobacteria with protease inhibitors results indeed
from a more frequent coexistence with cyanobacteria, a correlation has still to be established
in extended field studies. However, as a result of continuing global warming the appearance

Concluding remarks
109
of toxic cyanobacterial blooms and their negative effects on whole ecosystems will become
even stronger in the near future (Paerl & Huisman 2008). The data in chapter 3 suggests
that D. magna may control the increase of cyanobacterial genera more efficiently than D.
pulex due to significant differences in their tolerance to cyanobacteria with protease
inhibitors. Additionally, I suggest that toxic cyanobacterial blooms and coinciding harmful
effects to the ecosystem will occur more frequently in lakes with D. pulex than in lakes with D.
magna.
The detection and identification of possible target genes in natural Daphnia populations
that might have undergone selection by the presence of cyanobacterial protease is covered
by chapter 2. Here I analyzed the genetic diversity of three digestive trypsins of D. magna
clones from different habitats via high resolution melting analysis (HRMA), which I introduced
as a cost-effective and specific genotyping tool for population studies on Daphnia. The
chosen trypsins are known to be active in the gut of Daphnia and therefore provide a
possible target for cyanobacterial protease inhibitors (Schwarzenberger et al. 2010). One
Daphnia population originated from a pond containing toxic cyanobacteria that possibly
produce trypsin inhibitors and the other from a pond without such cyanobacteria. The final
results in chapter 2 revealed that the clonal diversity of two trypsin genes was much higher
in the D. magna population that already had experience with cyanobacteria than in the D.
magna population without such experience. In addition, the HRMA-results revealed that both
Daphnia populations exhibited phenotypic differences in the analyzed trypsins. Further
growth experiments on cyanobacterial diets of several clones from both populations have to
be performed in order to investigate whether the observed phenotypic difference of active
trypsins are indeed a microevolutionary response to the presence of trypsin inhibitors.
However, in chapter 2 I successfully demonstrated that even single nucleotide
polymorphisms (SNPs) of class III (C/G) or class IV (A/T) can be easily detected with HRMA
allowing a reliable genotyping of the analyzed Daphnia individuals. Thus, HRMA provides an
excellent choice for screening high numbers of individuals in population studies.
Besides positive correlation of increasing water temperatures and the abundance of
cyanobacteria as a result of global warming (Paerl & Huisman 2008), which has already
discussed in chapter 3, the eutrophication of lakes caused by anthropogenic phosphorus
loading also favors the occurrence of cyanobacterial mass developments (Jöhnk et al. 2008).
In Lake Constance an increase of the total phosphorus (Ptot) resulted in shifts of the
taxonomical composition of the phytoplankton favoring the abundance of cyanobacterial
genera (Kümmerlin 1998). Concomitant with the altered phytoplankton community in Lake
Constance the genetic structure of the co-occurring D. galeata population changed

Concluding remarks
110
significantly (Weider et al. 1997). It has been suggested that these changes were related to
the ability of the D. galeata population to cope with cyanobacteria as food (Hairston et al.
1999, 2001). However, the physiological mechanisms underlying the increased tolerance of
the D. galeata population to cyanobacteria after the peak of eutrophication in Lake
Constance remained unclear in the mentioned studies. With the aim to identify these
physiological mechanisms and genes, which were affected in Daphnia by changes of the
phytoplankton community and the occurrence of cyanobacteria, I performed in chapter 4 a
population genome approach in terms of sequencing genomic DNA of the D. galeata
population before, during and after the time of eutrophication. As outlined in chapter 4 I
achieved evidence that selection, caused by cyanobacterial toxins, on at least two traits in
Daphnia was responsible for the alteration of the genetic structure of the D. galeata
population in Lake Constance: The increased ingestion of the hepatotoxin microcystin from
cyanobacterial sources, have led to increased generation of reactive oxygen species (ROS)
in Daphnia cells. ROS are known to be the major causes for oxidative stress in animal cells
leading to peroxidation of lipids and fatty acids, DNA damaging as well as to dysfunctional
mitochondria (Amado & Monserrat 2010). Alpha class glutathione-S-transferases (GST) are
known to play an important role in protection against microcystins and oxidative stress (Yang
et al. 2002). GSTs catalyze the biotransformation of microcystins in Daphnia by conjugation
to glutathione (Pflugmacher et al. 1998). The resultant conjugate is less toxic and it has been
suggested that this constitutes the first step of cellular detoxification (Amado & Moserrat
2010). In addition, GSTs can interrupt the autocatalytic chain of lipid peroxidation, which is a
result of oxidative stress (Yang et al. 2001). The next-generation sequencing data in chapter
4 revealed that the major allele frequencies of glutathione-S-transferases in the D. galeata
population changed significantly stronger during the time of eutrophication in Lake Constance
than the mean of all other genes. This observation supports the assumption that, as a
response to oxidative stress, caused by an increased proportion of cyanobacteria with
microcystins in the phytoplankton community, natural selection favored those D. galeata
genotypes in Lake Constance that exhibited more efficient GSTs. Additionally, the amount of
mitochondrial DNA increased in the D. galeata population during the time of eutrophication,
which possibly indicates a compensation of the enhanced disruption of mitochondria due to
increased exposure to cyanobacterial microcystins. Besides the impact of cyanobacterial
microcystins on the genome of the D. galeata population, also cyanobacterial protease
inhibitors probably had significant impacts on Daphnia�s genomic structure during the time of
eutrophication, because genes of trypsins and chymotrypsins in Daphnia exhibited
significantly higher relative changes than the mean of all genes. Taken together the data in
chapter 4 make it reasonable to assume that protease inhibitors and oxidative stress

Concluding remarks
111
induced by microcystins were the selective forces driving the genotypic shift towards a more
cyanobacteria-tolerant D. galeata population during the time of eutrophication.
Daphnia is a keystone species in the functioning of lake ecosystems and is known for its
rapid evolutionary response to dynamic environmental stressors (Miner et al. 2012). Since
Daphnia has recently become another model organism due to the availability of full-genome
data (Colbourne et al. 2011) the linkage between genomics and ecology of Daphnia has
become a focus of attention. The identification of specific genes that were related to i.e.
climate change, predator avoidance, parasite- and toxin resistance is a prerequisite to
understand the physiological mechanisms underlying Daphnia�s adaptation. The present
study considers various intra- and interspecific aspects of Daphnia�s tolerance to
cyanobacteria. This dissertation covers not only more classical ecological approaches, such
as growth and competition experiments, but as well focuses on the analysis of specific target
genes of Daphnia that are related to secondary metabolites of cyanobacteria. The
introduction of high-resolution melting analysis as a cost-effective tool for genotyping a large
number of Daphnia individuals as well as population-wide genome sequencings connected
with pronounced bioinformatical statistics hopefully helps to elucidate some aspects in the
linkage between genome/gene evolution and the ecology of Daphnia.

General references
112
General references
Agrawal MK, Zitt A, Bagchi D et al. (2005) Characterization of proteases in guts of Daphnia
magna and their inhibition by Microcystis aeruginosa PCC 7806. Environmental
Toxicology, 20, 314-322.
Amado L & Monserrat J (2010) Oxidative stress generation by microcystins in aquatic
animals: Why and how. Environment International, 36, 226-235.
Bengtsson J (1993) Interspecific competition and determinants of extinction in experimental
populations of 3 rockpool Daphnia species. Oikos, 67, 451-464.
Blom JF, Baumann HI, Codd GA & Juttner F (2006) Sensitivity and adaptation of aquatic
organisms to oscillapeptin J and [D-Asp(3),(E)-Dhb(7)]microcystin-RR. Archiv für
Hydrobiologie, 167, 547-559.
Carmichael WW (1994) Toxins of cyanobacteria. Scientific American, 270, 78-86.
Colbourne JK, Crease TJ, Weider LJ et al. (1998) Phylogenetics and evolution of a
circumarctic species complex (Cladocera: Daphnia pulex). Biological Journal of the
Linnean Society, 65, 347-365.
Colbourne JK, Pfrender ME, Gilbert D et al. (2011) The ecoresponsive genome of Daphnia
pulex. Science, 331, 555-561.
Czarnecki O, Henning M, Lippert I & Welker M (2006) Identification of peptide metabolites of
Microcystis (Cyanobacteria) that inhibit trypsin-like activity in planktonic herbivorous
Daphnia (Cladocera). Environmental Microbiology, 8, 77-87.
DeMott WR, Gulati RD & Van Donk E (2001) Daphnia food limitation in three hypereutrophic
Dutch lakes: Evidence for exclusion of large-bodied species by interfering filaments of
cyanobacteria. Limnology and Oceanography, 46, 2054-2060.
Demott WR & Pape BJ (2005) Stoichiometry in an ecological context: testing for links
between Daphnia P-content, growth rate and habitat preference. Oecologia, 142, 20-27.
Dokulil MT & Teubner K (2000) Cyanobacterial dominance in lakes. Hydrobiologia, 438, 1-
12.
Gademann K & Portmann C (2008) Secondary metabolites from cyanobacteria: Complex
structures and powerful bioactivities. Current Organic Chemistry, 12, 326-341.
Geller W & Müller H (1981) The filtration apparatus of Cladocera - filter mesh-sizes and their
implications on food selectivity. Oecologia, 49, 316-321.
Ghadouani A, Pinel-Alloul B & Prepas EE (2003) Effects of experimentally induced
cyanobacterial blooms on crustacean zooplankton communities. Freshwater Biology, 48,
363-381.
Gophen M & Geller W (1984) Filter mesh size and food particle uptake by Daphnia.
Oecologia, 64, 408-412.
Güde H, Rossknecht H & Wagner G (1998) Anthropogenic impacts on the trophic state of
Lake COnstance during the 20th century. Archiv für Hydrobiologie, 53, 85-108.

General references
113
Gustafsson S & Hansson LA (2004) Development of tolerance against toxic cyanobacteria in
Daphnia. Aquatic Ecology, 38, 37-44.
Hairston NG, Lampert W, Caceres CE et al. (1999) Lake ecosystems - Rapid evolution
revealed by dormant eggs. Nature, 401, 446.
Hairston NG, Holtmeier CL, Lampert W et al. (2001) Natural selection for grazer resistance to
toxic cyanobacteria: Evolution of phenotypic plasticity? Evolution, 55, 2203-2214.
Hessen DO (1985) Filtering structures and particle-size selection in coexisting Cladocera.
Oecologia, 66, 368-372.
Jöhnk KD, Huisman J, Sharples J et al. (2008) Summer heatwaves promote blooms of
harmful cyanobacteria. Global Change Biology, 14, 495-512.
Kümmerlin RE (1998) Taxonomical response of the phytoplankton community of Upper Lake
Constance (Bondesee-Obersee) to eutrophication and re-oligotrophication. Archiv für
Hydrobiologie, 53, 109-117.
Lürling M & van der Grinten E (2003) Life-history characteristics of Daphnia exposed to
dissolved microcystin-LR and to the cyanobacterium Microcystis aeruginosa with and
without microcystins. Environmental Toxicology and Chemistry, 22, 1281-1287.
Martin-Creuzburg D & Von Elert E (2004) Impact of 10 dietary sterols on growth and
reproduction of Daphnia galeata. Journal of Chemical Ecology, 30, 483-500.
Martin-Creuzburg D, Von Elert E & Hoffmann KH (2008) Nutritional constraints at the
cyanobacteria-Daphnia magna interface: The role of sterols. Limnology and
Oceanography, 53, 456-468.
Miner BE, De Meester L, Pfrender ME, Lampert W & Hairston NG (2012) Linking genes to
communities and ecosystems: Daphnia as an ecogenomic model. Proceedings of the
Royal Society B-Biological Sciences, 279, 1873-1882.
Paerl HW & Huisman J (2008) Climate - Blooms like it hot. Science, 320, 57-58.
Pflugmacher S, Wiegand C, Oberemm A et al. (1998) Identification of an enzymatically
formed glutathione conjugate of the cyanobacterial hepatotoxin microcystin-LR: the first
step of detoxication. Biochimica et Biophysica Acta-General Subjects, 1425, 527-533.
Porter KG & Mcdonough R (1984) The energetic cost of response to blue-green-algal
filaments by cladocerans. Limnology and Oceanography, 29, 365-369.
Rohrlack T, Christoffersen K, Hansen PE et al. (2003) Isolation, characterization, and
quantitative analysis of microviridin J, a new Microcystis metabolite toxic to Daphnia.
Journal of Chemical Ecology, 29, 1757-1770.
Rohrlack T, Dittmann E, Börner T & Christoffersen K (2001) Effects of cell-bound
microcystins on survival and feeding of Daphnia spp. Applied & Environmental
Microbiology., 67, 3523-3529.
Sarnelle O & Wilson AE (2005) Local adaptation of Daphnia pulicaria to toxic cyanobacteria.
Limnology and Oceanography, 50, 1565-1570.
Sarnelle O (2007) Initial conditions mediate the interaction between Daphnia and bloom-
forming cyanobacteria. Limnology and Oceanography, 52, 2120-2127.

General references
114
Schreurs,H. (1992) Cyanobacterial dominance, relation to eutrophication and lake
morphology. PhD thesis, University of Amsterdam, Amsterdam.
Schwarzenberger A, Zitt A, Kroth P, Mueller S & von Elert E (2010) Gene expression and
activity of digestive proteases in Daphnia: effects of cyanobacterial protease inhibitors.
BMC physiology, 10, 6.
Sivonen K & Jones G (1999) Cyanobacterial toxins. Toxic cyanobacteria in water: A guide to
their public health consequences . Monitoring and Management: 41-111.
Sommer U, Gliwicz ZM, Lampert W & Duncan A (1986) The PEG-model of seasonal
succession of planktonic events in fresh waters. Archiv für Hydrobiologie, 106, 433-471.
Verreydt D, De Meester L, Decaestecker E et al. (2012) Dispersal-mediated trophic
interactions can generate apparent patterns of dispersal limitation in aquatic
metacommunities. Ecology Letters, 15, 218-226.
Von Elert E (2002) Determination of limiting polyunsaturated fatty acids in Daphnia galeata
using a new method to enrich food algae with single fatty acids. Limnology and
Oceanography, 47, 1764-1773.
Von Elert E, Martin-Creuzburg D & Le Coz JR (2003) Absence of sterols constrains carbon
transfer between cyanobacteria and a freshwater herbivore (Daphnia galeata).
Proceedings of the Royal Society of London Series B-Biological Sciences, 270, 1209-
1214.
Von Elert E, Agrawal MK, Gebauer C et al. (2004) Protease activity in gut Daphnia magna:
evidence for trypsin and chymotrypsin enzymes. Comparative Biochemistry and
Physiology B-Biochemistry & Molecular Biology, 137, 287-296.
Von Elert E, Oberer L, Merkel P, Huhn T & Blom JF (2005) Cyanopeptolin 954, a chlorine-
containing chymotrypsin inhibitor of Microcystis aeruginosa NIVA Cya 43. Journal of
Natural Products, 68, 1324-1327.
von Elert E, Zitt A & Schwarzenberger A (2012) Inducible tolerance to dietary protease
inhibitors in Daphnia magna. Journal of Experimental Biology, 215, 2051-2059.
Weckesser J, Martin C & Jakobi C (1996) Cyanopeptolins, depsipeptides from
cyanobacteria. Systematic and Applied Microbiology, 19, 133-138.
Weider LJ, Lampert W, Wessels M, Colbourne JK & Limburg P (1997) Long-term genetic
shifts in a microcrustacean egg bank associated with anthropogenic changes in the Lake
Constance ecosystem. Proceedings of the Royal Society of London - Series B: Biological
Sciences, 264, 1613-1618.
Wojtal-Frankiewicz A (2012) The effects of global warming on Daphnia spp. population
dynamics: a review. Aquatic Ecology, 46, 37-53.
Yang Y, Cheng JZ, Singhal SS et al. (2001) Role of glutathione S-transferases in protection
against lipid peroxidation - Overexpression of hgsta2-2 in k562 cells protects against
hydrogen peroxide-induced apoptosis and inhibits JNK and caspase 3 activation. Journal
of Biological Chemistry, 276, 19220-19230.

General references
115
Yang YS, Sharma R, Zimniak P & Awasthi YC (2002) Role of alpha class glutathione S-
transferases as antioxidant enzymes in rodent tissues. Toxicology and Applied
Pharmacology, 182, 105-115.

Abstract
116
Abstract
In many freshwater ecosystems Daphnia represent both, an important herbivorous grazer
of phytoplankton and a major prey of planktivorous fish and invertebrate predators. Thus,
Daphnia provide an important link for the transfer of energy and carbon from primary
producers to higher trophic levels. In eutrophic lakes this transfer is often reduced by the
occurrence of cyanobacteria that are known for their low food quality for Daphnia:
Cyanobacteria lack essential sterols and polyunsaturated fatty acids, are often filamentous or
colonial and contain even toxins like microcystins and protease inhibitors. Although Daphnia
populations are able to adapt to the presence of cyanobacteria, little is known about the
physiological mechanisms and the particular genes and metabolic pathways underlying this
adaptation.
The present study considers various intra- and interspecific aspects of Daphnia�s
tolerance to cyanobacteria. Besides classical ecological approaches, such as growth and
competition experiments, the focus of the present dissertation was the analysis of specific
target genes of Daphnia that were related to the response to secondary metabolites of
cyanobacteria, such as protease inhibitors and microcystins. I found here for the first time
evidence that cyanobacterial inhibitors, interfering with Daphnia�s major gut proteases
(chymotrypsin and trypsin), occurred in the edible fraction of natural lake seston and varied
significantly within season. In parallel with seasonal changes in the potential of the
phytoplankton to inhibit proteases, the genetic structure of the co-occurring D. magna
population changed significantly, which might result from natural selection due to the
increased content of cyanobacterial protease inhibitors in the seston.
Depending on initial conditions Daphnia may also control the development of bloom-
forming cyanobacteria with protease inhibitors and may even suppress already established
cyanobacterial blooms. In life-table experiments with cyanobacteria containing inhibitors of
chymotrypsin and trypsin I investigated the tolerance of various clones of D. magna and D.
pulex with different geographic origins. I showed that D. magna is more tolerant to
cyanobacteria with protease inhibitors and thus may control the development of
cyanobacterial blooms more efficiently than D. pulex. Protease assays revealed that the
sensitivities of chymotrypsins and trypsins to cyanobacterial inhibitors did not differ between
D. magna and D. pulex. However, D. magna exhibited a more than two times higher specific
chymotrypsin activity than D. pulex, which explains the observed higher tolerance to
cyanobacterial protease inhibitors of D. magna. The higher tolerance of D. magna to

Abstract
117
cyanobacterial protease inhibitors compared to that of D. pulex might result from differences
in their coexistence with cyanobacteria.
Adaptation of Daphnia populations to environmental stressors is typically a result of
microevolutionary processes leading to natural selection. Determining genetic variation at the
DNA level within and between natural Daphnia population is important for understanding the
role of natural selection on phenotypic traits. In the present study I demonstrate that high-
resolution melting analysis (HRMA) is a cost effective and sensitive tool for screening
variable target genes in natural Daphnia populations. HRMA is based on monitoring the
melting of PCR-amplicons and has usually been applied in clinical studies and medical
molecular diagnostics. As a proof of principle for the application of HRMA in Daphnia
population genetics I have analyzed the genetic variability of digestive trypsins in two D.
magna populations. Both populations differed in their experience with respect to
cyanobacterial trypsin inhibitors. I hypothesized that D. magna clones from ponds with
cyanobacteria have undergone selection by these inhibitors, which has led to different trypsin
alleles. My results revealed that both populations exhibited phenotypic difference in the
analyzed trypsins and that HRMA is a powerful genotyping tool for screening high numbers
of individuals in population studies.
The last part of my thesis considers anthropogenic long-term effects on D. galeata in Lake
Constance, which underwent periods of eutrophication and re-oligotrophication in the last
century. In order to investigate the influence of changing selection factors in Lake Constance
on the genomic structure of the D. galeata population, I have isolated and pooled D. galeata
resting eggs from four different layers of sediment cores, representing the time periods
before, during and after the peak of the eutrophication. The extracted genomic population
DNA samples from the different time periods were sequenced with a mean coverage of 50x
via next-generation sequencing. After mapping the total reads of each population on
predicted genes of D. galeata, I performed a genome-wide assessment of single nucleotide
polymorphisms (SNPs) and copy number variations of several gene families in each of the
three D. galeata populations. The data were used to determine the genetic diversity of the D.
galeata populations and to indentify particular target gene families and metabolic pathways
that were influenced by the environmental changes mentioned above. The data suggest that
cyanobacterial protease inhibitors and oxidative stress induced by microcystins from
cyanobacteria were the selective forces contributing to the genotypic shift towards a more
cyanobacteria-tolerant D. galeata population during the time of eutrophication.

Zusammenfassung
118
Zusammenfassung
In vielen Seen sind Daphnien als unselektive Filtrierer einer der Hauptkonsumenten von
pelagischen Phytoplanktern und dienen des Weiteren als Nahrungsquelle von planktivoren
Fischen und invertebraten Räubern. Dadurch nehmen Daphnien eine Schlüsselstellung im
Transfer von Energie und Kohlenstoff von Primärproduzenten zu höheren trophischen
Ebenen ein. Dieser Transfer ist in eutrophen Gewässern häufig durch die Anwesenheit von
Cyanobakterien gestört, da diese ein Futter von geringer Qualität für Daphnien darstellen.
Cyanobakterien besitzen die Fähigkeit, Kolonien oder Filamente zu bilden, womit sie ab einer
gewissen Größe nicht mehr von Daphnien ingestiert werden können. Des Weiteren fehlen
Cyanobakterien Sterole und ausreichende Mengen an mehrfach ungesättigten Fettsäuren.
Darüber hinaus können Cyanobakterien für Daphnien toxische Sekundärmetabolite, wie zum
Beispiel Proteaseinhibitoren oder Microcystine, enthalten. Daphnienpopulationen sind in der
Lage sich an die Anwesenheit von Cyanobakterien anzupassen; allerdings sind sowohl die
physiologischen Mechanismen, die dieser Anpassung zugrunde liegen, als auch die
verantwortlichen Gene und Stoffwechselwege bisher nur wenig erforscht.
In der vorliegenden Arbeit werden verschiedene intra- und interspezifische Aspekte
untersucht, die sich mit der Anpassung von Daphnien an Cyanobakterien beschäftigen.
Neben klassischen Wachstums- und Konkurrenzversuchen liegt ein Schwerpunkt dieser
Arbeit in der Identifizierung und Analyse spezieller Zielgene aus Daphnien, von denen
vermutet wird, dass toxische Sekundärmetabolite aus Cyanobakterien einen Selektiondruck
auf diese Gene ausüben können. Zu diesen toxischen Sekundärmetaboliten gehören neben
hepatotoxisch wirkenden Microcystinen auch cyanobakterielle Inhibitoren von Trypsinen und
Chymotrypsinen. Diese beiden Proteasen sind zusammen für mehr als 80% der
proteolytischen Aktivität im Darm von Daphnien verantwortlich. In Kapitel 1 konnte ich
zeigen, dass das die für Daphnien freßbare Größenfraktion des Sestons eines natürlichen
Gewässers Trypsine und Chymotrypsine inhibiert, und dass die Stärke der Inhibition starken
saisonalen Schwankungen unterliegt. Des Weiteren konnte ich zeigen, dass sich parallel mit
den jahreszeitlichen Schwankungen des Inhibitionsvermögens des Sestons auch die
genetische Struktur der coexistierende D. magna Population signifikant veränderte, was eine
Folge von natürlicher Selektion sein könnte.
Je nach Ausgangsbedingungen sind Daphnien in der Lage, die Entstehung
cyanobakterieller Massenentwicklungen zu unterdrücken. In Wachstumsversuchen mit
Cyanobakterien, die Inhibitoren gegenüber Trypsinen und Chymotrypsinen enthielten, habe

Zusammenfassung
119
ich die Toleranz verschiedener D. magna und D. pulex Klone aus unterschiedlichen
Ursprungshabitaten untersucht. Ich konnte zeigen, dass D. magna eine höhere Toleranz
gegenüber Cyanobakterien aufweist als D. pulex. Dies lässt die Vermutung zu, dass D.
magna die Entstehung von Cyanobakterienblüten effizienter kontrollieren kann als D. pulex.
Enzymatische Untersuchungen ergaben, dass sich weder Chymotrypsine noch Trypsine aus
D. magna und D. pulex hinsichtlich ihrer Sensitivitäten gegenüber cyanobakteriellen
Inhibitoren unterschieden. Es konnte jedoch gezeigt werden, dass D. magna eine doppelt so
hohe spezifische Chymotrypsinaktivität besitzt als D. pulex. Dies könnte ein Grund für die
beobachtete höhere Toleranz gegenüber Cyanobakterien von D. magna im Vergleich zu D.
pulex sein.
Eine Anpassung von Daphnienpopulation an veränderte Umweltbedingungen ist häufig
eine Konsequenz von natürlicher Selektion aufgrund von Mikroevolution. Die genaue
Bestimmung genetischer Variabilität innerhalb und zwischen Daphnienpopulation ist von
entscheidender Bedeutung, um natürliche Selektion und deren Auswirkung auf
phäntoypische Merkmale besser verstehen zu können. In der vorliegenden Arbeit wird die
Methode der hochauflösenden Schmelzkurvenanalyse (high-resolution melting analysis,
HRMA) als günstige und sensitive Alternative zu herkömmlichen Sequenzierungsmethoden
genutzt, um genetische Variabiltät von Zielgenen effektiv analysieren zu können. HRMA
basiert auf der exakten Analyse des Schmelzverhaltens kompletter PCR Produkte und wird
vornehmlich in klinischen Studien sowie in der molekularen Diagnostik verwendet. Als
Anwendungsbeispiel der HRMA wurde die genetische Variabilität verschiedener Trypsingene
aus zwei D. magna Populationen untersucht. Eine der beiden Populationen stammte aus
einem Gewässer ohne Cyanobakterien, während die andere Population aus einem
Gewässer mit jährlich auftretenden Cyanobakterienblüten entstammt. Die Hypothese war,
dass D. magna Klone aus cyanobakterienreichen Gewässern aufgrund von natürlicher
Selektion durch Proteaseinhibitoren andere Trypsinallele aufweisen als Klone aus
cyanobakterienfreien Gewässern. Die Ergebnisse ergaben Unterschiede in der
Aminosäuresequenz der analysierten Trypsinen zwischen beiden D. magna Population. Im
Allgemeinen konnte ich zeigen, dass sich die Methode der hochauflösenden
Schmelzkurvenanalyse ideal zur Genotypisierung einer großen Anzahl von Individuen in
Populationsanalysen eignet.
Der letzte Abschnitt meiner Dissertation behandelt den Einfluss anthropogener
Langzeiteffekte auf die im Bodensee existierende D. galeata Population. Durch erhöhten
Phosphoreintrag und nachfolgend eingeleitete Sanierungsmaßnahmen durchlief der
Bodensee eine Phase der Eutrophierung und anschließenden Re-Oligotrophierung in der

Zusammenfassung
120
zweiten Häfte des letzen Jahrhunderts. Um die Einflüsse dieser schwankenden
Umweltbedingungen auf die genetische Struktur der D. galeata Population zu analysieren,
wurden aus verschiedenen Schichten mehrerer Bohrkerne aus dem Sediment des
Bodensees Dauereier von D. galeata isoliert. Die Schichten, aus denen die Dauereier
separat isoliert wurden, entsprachen der Zeit vor, während und nach dem Höhepunkt der
Eutrophierung des Bodensees. Anschließend wurde die DNA aus jeder Population separat
extrahiert, mittels �Next-Generation Sequencing� analysiert und anschließend mit
vorhandenen Transkriptomdaten von D. galeata abgeglichen. Dies ermöglichte es mir einen
genomweiten Vergleich einzelner Nukleotidpolymorphismen (SNPs) sowie Unterschiede in
der Anzahl der Kopien bestimmter Zielgene zwischen den einzelnen Populationen zu
untersuchen. Die so gewonnen Daten dienten zum einen dazu, die genetische Diversität der
D. galeata Population vor, während und nach der Eutrophierung zu messen. Des Weiteren
sollten Zielgene und Stoffwechselwege identifiziert werden, die sich möglichweise durch sich
wechselnden Umweltbedingungen des Bodensees in der D. galeata Population verändert
haben. Die Analyse der Daten stützt die Vermutung, dass ein Anstieg von
Proteaseinhibitoren sowie oxidativer Stress durch Mikrocystine, bedingt durch das im Zuge
der Eutrophierung vermehrte Auftreten von Cyanobakterien, wichtige Selektionfaktoren
darstellten, die zu den gefundenen genetischen Veränderungen der D. galeata Populationen
beigetragen haben.

Record of achievement
121
Record of achievement
Chapter 1: Seasonal dynamics of sestonic protease inhibition: impact on Daphnia
populations
The isolation of the D. magna fall population, microsatellite analyses, all single-clone growth
and competition experiments and the IC50 determination of the seston extracts from 2008
were exclusively performed by me or under my direct supervision. The isolation of the D.
magna spring population and the IC50 determination of the seston extracts from 2007 were
performed by A. Schwarzenberger.
Chapter 2: High-resolution melting analysis: a genotyping tool for population studies
on Daphnia
Results described in this chapter were exclusively performed by me.
Chapter 3: Interspecific differences between D. pulex and D. magna in sensitivity to
cyanobacterial protease inhibitors
Results described in this chapter were exclusively performed by me or under my direct
supervision.
Chapter 4: Rapid evolution revealed by dormant eggs: physiological mechanisms
I performed the field sampling and sample processing with the help of M. Wessels from the
Institut für Seenforschung Langenargen (ISF). The next-generation sequencing analysis as
well as the single-read mapping on the D. galeata transcriptome was performed in the lab of
John Colbourne at the Indiana University, USA. I contributed to bioinformatical analysis and
exclusively analyzed the collected data.

�
122�
Köln, 07.11.2012
Erklärung
Ich versichere, dass ich die von mir vorgelegte Dissertation selbstständig angefertigt, die
benutzten Quellen und Hilfsmittel vollständig angegeben und die Stellen der Arbeit �
einschließlich Tabellen, Karten und Abbildungen -, die anderen Werken in Wortlaut oder dem
Sinn nach entnommen sind, in jedem Einzelfall als Entlehnung kenntlich gemacht habe; dass
diese Dissertation noch keiner anderen Fakultät oder Universität zur Prüfung vorgelegen hat;
dass sie � abgesehen von unten angegebenen Teilpublikationen � noch nicht veröffentlicht
worden ist sowie, daß ich eine solche Veröffentlichung vor Abschluss des
Promotionsverfahrens nicht vornehmen werde.
Die Bestimmungen der Promotionsordnung sind mir bekannt. Die von mir vorgelegte
Dissertation ist von Prof. Dr. Eric von Elert betreut worden.
Christian Küster

Acknowledgements
123
Acknowledgements
Hiermit möchte ich mich ganz herzlich bedanken bei
• meinem Betreuer Prof. Dr. Eric von Elert für die Vergabe und die hervorragende
Betreuung meiner Doktorarbeit. Seine spezielle Mischung aus Fördern und Fordern
hat bei mir genau den richtigen Nerv getroffen. Durch ihn habe ich gelernt selbständig
wissenschaftlich zu arbeiten und vor allem Ergebnisse kritisch zu hinterfragen. Ich
hatte jederzeit die Möglichkeit meine Ideen und Ergebnisse persönlich und
umfangreich mit ihm zu besprechen. Vielen Dank!
• Prof. Dr. Arndt für die Erstellung des Zweitgutachtens.
• meinen Doktorbrüdern und -schwestern Christoph, Thomas, Marc, Patrick, Marian
und Jana mit denen ich stets verrückte wissenschaftliche Hypothesen austauschen
konnte und die man nie lange um ein zünftiges Feierabendbier bitten musste.
Insbesondere danke ich Chris1 für die letzten fünf Jahre, in der er meine Launen
stets zu ertragen und zu kontern wusste.
• Gesa Heinichen, Laura Schäfer und Lea von Ganski für die Unterstützung im
Laboralltag.
• Jennifer Kuhn für die Einweisung in das LightCylcer System.
• Martin Wessels für die Unterstützung beim Stechen der Bodenseebohrkerne.
• John Colbourne für die Next-generation-sequencing Analysen sowie Hilfestellung in
bioinformatischen Fragestellungen.
• Katja Preuß und Hannelore Krisch als gute Seelen der Ag von Elert.
• allen restlichen Mitgliedern der Ag von Elert.

Acknowledgements
124
• den Jungs aus der Werkstatt, die meine abstrusen Ideen immer perfekt umzusetzen
wussten.
• meiner Freundin Sabina, die mich in jeglicher Hinsicht während meiner Doktorarbeit
moralisch unterstützt hat. Eine tollere Freundin kann es auf der Welt nicht geben �
• meiner Familie für die Unterstützung während meiner Doktorarbeit.
• allen, die ich hier vergessen habe.�

Curriculum vitae
125
Curriculum vitae
Name: Christian Küster
Geburtsdatum: 24.09.1982 in Engelskirchen
Familienstand: ledig
Nationalität: deutsch
Beruflicher Werdegang:
1989-1993 Gemeinschaftsgrundschule Heerstraße, Troisdorf
1993-2002 Gymnasium zum Altenforst, Troisdorf
2002-2003 Zivildienst im St. Johannes Krankenhaus, Troisdorf
2003-2009 Biologiestudium, Universität zu Köln
2009 Abschluss des Biologiestudiums and der Universität zu
Köln. Diplomarbeit über �Saisonale Veränderung der Sensi
tivität von Daphnia magna gegenüber Cyanobakterien�
2009-2012 Promotion an der Universität zu Köln

Teilpublikationen
126
Bisherige Publikationen im Peer-Review Verfahren
1Küster, C.J., Schwarzenberger, A. & Von Elert, E. (2012) Seasonal dynamics of sestonic
protease inhibition: Impact on Daphnia populations. Hydrobiologia, in press (doi:
10.1007/s10750-012-1303-x).
2Küster, C.J. & Von Elert, E. (2012) High-resolution melting analysis: A genotyping tool for
population studies on Daphnia. Molecular Ecology Resources 12: 1048-1057 (doi:
10.1111/j.1755-0998.2012.03177.x).
3Küster, C.J. & Von Elert, E. (2012) Interspecific differences between D. pulex and D.
magna in sensitivity to cyanobacterial protease inhibitors. PLoS ONE, submitted
Schwarzenberger, A., Küster, C.J. & Von Elert, E. (2012) Molecular mechanisms of
tolerance to cyanobacterial protease inhibitors revealed by clonal differences in Daphnia
magna. Molecular Ecology 21 (19): 4898-4911 (doi: 10.1111/j.1365-294X.2012.05753.x).
1 entspricht chapter 1
2 entspricht chapter 2
3 entspricht chapter 3