population forecasts for yamhill county, its cities and ... forecast final.pdf · population...
TRANSCRIPT

Population Forecasts for Yamhill County, its Cities and
Unincorporated Area 2011-2035
Prepared by: Population Research Center
College of Urban and Public Affairs Portland State University
October 2012

Population Forecasts for Yamhill County, its Cities and
Unincorporated Area 2011-2035
October 2012
Project Staff:
Risa Proehl, Population Estimates Program Manager Vivian Siu, Research Analyst Kevin Rancik, GIS Analyst

Page i

Page ii

TABLE OF CONTENTS Map of the Study Area i
Map of Population Areas ii
INTRODUCTION 2
OVERVIEW OF THE REPORT 9
DEMOGRAPHIC TRENDS AFFECTING YAMHILL COUNTY
POPULATIONS
13
DEMOGRAPHIC ASSUMPTIONS FOR THE POPULATION FORECASTS 29
POPULATION FORECASTS FOR YAMHILL COUNTY AND ITS SUB-
AREAS
38
Population Forecasts for Yamhill County, McMinnville, and Newberg 40
Population Forecasts for the County’s Eight Smallest City Areas and the non-UGB Unincorporated Area
41
METHODS AND DATA FOR POPULATION FORECASTS 43
APPENDIX 1 Detailed Population Forecasts for Yamhill County, McMinnville, and Newberg
55
APPENDIX 2 Detailed Population Forecasts for Yamhill County’s Eight Smaller City Areas and the non-UGB Unincorporated Area
57
APPENDIX 3 Demographic Assumptions for Yamhill County and the Cities of McMinnville and Newberg
61
APPENDIX 4 Information Considered When Developing Forecasts for Yamhill County’s Sub-areas
65
APPENDIX 5 Supporting Data and Forecast Summary Tables 76
APPENDIX 6 Maps of Housing Unit Density in Yamhill County and its Sub-areas
84
APPENDIX 7 Data Sources and Description 90
APPENDIX 8 Historical City and County Populations for Yamhill County 94
APPENDIX 9 Submitted Comments about the Preliminary Forecasts 96
APPENDIX 10 Adjustment to Preliminary Forecasts 109
Page 2
INTRODUCTION
Yamhill County officials commissioned Portland State University’s Population Research
Center (PRC) to produce long-term population forecasts for the County, its ten
incorporated cities and the county unincorporated area. Since the city of Willamina
overlaps into Polk County, a separate forecast for the city portion located in Yamhill
County is required in addition to the forecast for the city as a whole. The city level
forecasts include the cities’ respective urban growth boundary areas (UGB)1. For most
cities this includes the surrounding unincorporated area in addition to the area within the
city limits. The forecast for the county unincorporated area represents the area outside the
UGBs. The forecast horizon extends 24 years from 2011 to 2035; and the forecasts are
produced in 5-year intervals between 2010 and 2035, and for the single years of 2012 and
2032. The County will use the forecasts to coordinate revisions of the comprehensive plans
for each of the study areas. The projections are benchmarked to the Population Research
Center’s 2011 certified population estimates for the city and county populations.
In 2011, Yamhill County’s population was 99,850 and about 55 percent resided in the
County’s two largest cities: McMinnville (over 32,000) and Newberg (over 22,000). The
2011 population estimates for each of Yamhill County’s eight smaller cities (or ‘city
areas’) are all under 6,200, with most ranging from1,000 to about 3,000 persons. The
population forecasts for both large and smaller cities and the unincorporated area outside
UGBs (non-UGB unincorporated area) were based on a most-likely, or medium growth,
scenario for future growth.
Consideration was given to factors that influence Yamhill County’s population dynamics,
such as the population’s ethnic and age composition, the number of annual births that
occur, employment and commuting patterns, the number of building permits issued, and
public school enrollment in the county’s school districts. Data used to develop the
forecasts include vital statistics; population, land use, building permit, and employment
1 The UGB used for McMinnville and its study area was a proposed amended UGB that was withdrawn in spring 2012; all references to the McMinnville UGB in this report pertain to this proposed UGB. See Appendix 9 for additional information about the McMinnville’s UGB.

Page 3
data; and school enrollments for districts within Yamhill County. Several different
demographic methods and models were employed to prepare the forecasts, including the
development of cohort-component models for the County and larger areas, and housing
unit models for each of the county’s smaller cities and the non-UGB unincorporated area.
The cohort-component model incorporates rates of fertility, mortality, and migration. The
housing unit model assumes a number of future added housing units, levels of housing
occupancy, and averages of the number of persons per household. A description of recent
historic demographic trends throughout the County and a summary of recent significant
population changes during the forecast period are included in this report. Also, the data
sources and methods utilized in the development of the forecasts are described in more
detail later. For the countywide forecast and the two largest cities, cohort component
forecasting models were utilized that incorporate rates of fertility, mortality and net
migration. For the remaining eight considerably smaller city areas, housing unit models
consisting of housing unit inventories and group quarters populations, average household
sizes, and occupancy trends were used.
The growth assumptions about future trends in the forecasts for the County and for all of
its sub-areas in our study each suggest that there will be continuing increases in population,
but at slightly different rates from the beginning to the end of the forecast period. There are
variations in the forecasts for the size and timing of the annual population increases. The
share that each city represents of the county’s total population does not change drastically
during the forecast period, but the share that the non-UGB unincorporated area represents
decreases from about 22 percent to 16 percent. This shift of persons residing in rural areas
to more urbanized areas is a common trend throughout Oregon and the United States that
has been ongoing for many years.
In the growth scenario for our population forecasts, we assume that the downturn of the
local economy will continue to recover, but slowly. Therefore, housing construction is
anticipated to be fairly sluggish for a few years in some areas, start to increase slightly in
other areas, and will accelerate overall after 2015. At that time the net in-migration of
families with children, the elderly, and Hispanics is predicted to increase and continue

Page 4
throughout most of the forecast period. Regardless of how the economy performs,
however, the rapid population growth during the 1990s and much of the last decade seen
by many areas in Oregon is not sustainable in many areas, including Yamhill County,
especially because the population is aging. An aging population means that the share of
population that persons in the older age groups represent is becoming larger. While
mortality rates may change minimally and the probability of dying decreases only slightly,
the number of deaths does become greater in an aging population and has a negative effect
on population growth. Additionally, in Yamhill County, the fertility rates are below
replacement levels and so together with the aging population, natural increase (births
minus deaths) has a weaker effect on increasing numbers. Positive population growth then
becomes more and more dependent on net in-migration.
Caveats Regarding the Report
The body of this report covers demographic information and analysis for Yamhill County
and its geographic sub-areas. With the exception of the non-UGB unincorporated area, the
sub-areas in this study at times are called ‘cities’ but are actually ‘city areas’, which refer
to the area within the city limits combined with its corresponding UGB area outside city
limits; or in other words, all of the area within the city’s urban growth boundary. In this
study, the unincorporated area is usually referred to as the ‘non-UGB unincorporated area’
and it represents the area outside of any city and UGB.
Three of Yamhill County’s cities, Carlton, Dundee, and Lafayette either have a UGB that
is identical, or nearly identical, to their city boundary. The other cities have a UGB outside
the city limits. Area in some of the UGBs is where a portion of the city area’s housing
stock is located and other UGBs outside the city have little to no population. In general, a
small percentage of population resides in any location in the UGB outside the cities in
Yamhill County. About 7 percent of Dayton’s housing units (around 70) are in its
unincorporated UGB area. The percentage of housing that is located in the other UGBs
outside city limits in Yamhill County is only about 2 percent or less, ranging from fewer
than 5 housing units in the cities of Amity and Yamhill to 180-200 units in McMinnville

Page 5
and Newberg’s UGBs, respectively; and there are approximately 40 units in Sheridan’s
UGB area.
In order to minimize skewing of demographic trends within our study area, 2000 and 2010
Census data were aggregated to correspond to 2011 jurisdictional boundaries obtained
from the Yamhill County’s GIS Department. Comparing data that represent geographic
areas that are consistent over time removes the influence that changing boundaries have on
determining actual population trends in a jurisdiction. Please note that some populations
reported in our tables for 2000 and 2010 may slightly differ from 2000 and 2010 Census
published populations. The difference is due to the data reallocation process to conform to
the 2011 boundaries. Because the 2010 and 2011 boundaries are from two different
sources, they are not perfectly matched to one another. We determined that any differences
between the published Census data and the data we reallocated for this study are negligible
and have no effect on demographic trends and population forecasts.
Historical demographic trends in this report are described for 2000-2011. Certified 2011
population estimates for Yamhill County and its cities are adjusted to include their UGBs
and are shown on page 9 of this report. The 2000-2011 demographic data and trends are
incorporated into the forecasts, and how they are incorporated is described in the methods
section of this document.
The annual certified population estimates produced by PRC represent the area within the
city limits. If a city does not send annual housing and population data to the estimates
program, its certified estimate is held constant to the previous year and may not account for
recent changes. As mentioned above, the populations shown in this report for 2011
represent the 2011 certified estimates adjusted to incorporate the city UGB areas. In
instances where annual data for the city were not available, the population reported for
2011 may not include all changes that occurred from 2010 to 2011. However, the
population forecasts for 2012 and beyond account for any annual data that may be lacking.
Page 6
The 2010-2040 population forecast for Yamhill County produced by Oregon’s Office of
Economic Analysis (OEA) is used as a gauge for our countywide forecast results. The
published OEA forecast currently available on their website was produced in 2004, and our
forecast results are quite lower than those. However, OEA is, at this time, revising their
forecasts to become more up-to-date, and to reflect the recent economic downturn
experienced nationwide and incorporate Census 2010. It is our understanding that the
OEA’s revised forecast will become available within a few weeks after completion of this
report. We conferred with OEA staff when producing our own forecast and had an
opportunity to review their revised forecast in August 2012. Although the revised forecast
accounts for the recession, it does not include Census 2010. Our forecast results for
Yamhill County were very close to OEA’s revised forecast, but slightly higher in the early
part of the forecast period, and slightly lower toward the end. The differences in forecasts
were by less than one percent in any 5-year time period (less than 850 persons), except the
last period (2030-2035) when our forecast was 1,700 persons fewer than OEA’s. During
the 25 year period from 2010 to 2035, the average annual growth in OEA’s forecast is
about1.6 percent and it is 1.5 percent in our forecast.
A Note of Caution about the Forecasts Themselves
Given that these projections are developed for long-term trends, they are conservative.
This means that they do not assume drastic changes to the population trends (such as seen
during a depression or natural disaster), and large fluctuations in growth rates are not
envisioned.
Policy makers should view population projections as one of several available sources of
information about likely future conditions. The forecasts in this report are based on
assumptions developed from analysis of historical trends and expectations for the future.
While the past gives some indication of what is likely to happen in the future, there is
always the possibility of the occurrence of unforeseen events that could have a significant
impact on population change. Thus, users of these projections should be aware that
unexpected changes could happen and that it is wise to evaluate projections periodically in
future years. Given the uncertainty of the timing, occurrence and magnitude of future
Page 7
events, several points should be kept in mind when interpreting the population forecasts in
this report.
First, the Yamhill County population projections represent a forecast derived from
assumptions representing our best judgment as to the possibilities for future conditions. It
is not possible to judge at this time which of the assumptions, or combinations of
assumptions, may best forecast future populations. The next several years will better reveal
whether the modeled demographic trends are likely to occur. If different conditions arise,
then it would be appropriate to revise the population projections, taking into account new
assumptions.
Second, variations in forecasts become larger in the long run. As years go by, the
population forecasts depend increasingly on assumptions about who and how many
persons will move into and out of Yamhill County and the number of births that will occur
annually to parents who reside in Yamhill County. The population forecasts become less
certain over longer periods of time because the assumptions relied upon to forecast
population more than twenty years from now may or may not come to fruition in reality.
Third, the smaller the population, the harder it is to develop an accurate forecast. Slight
unpredicted variations in demographic trends can cause larger fluctuations in the
population forecasts than those for larger populations. Forecasts for large cities and
counties tend to be more precise than forecasts for small cities or towns.
Finally, population forecasts prepared by other researchers for one or more of our study
areas exist and are available to the public. There is a temptation in interpreting the
forecasts to ask: "Which is the correct forecast?" Asking such a question implies that there
is need to pick one forecast at present and then base future plans on it without flexibility.
The more appropriate use of the forecasts is to consider that there is likely to be some
variation around our medium growth forecast presented in this report, and that we would
want to update them as conditions evolve. Instead of using the numbers as an exact
outcome that will occur over the twenty-four year forecast horizon, we urge government

Page 8
officials and the public to "monitor and manage" the changing conditions that will affect
future populations. The forecast presented in this report can serve as a guideline in this
process of monitoring and managing.
Page 9
OVERVIEW OF THE REPORT
This report presents the results of a study conducted by the Population Research Center
(PRC) to address the long-range planning needs of Yamhill County and produce
population forecasts at the county and sub-county level. This report considers recent and
historical demographic changes experienced within the County and provides forecasts from
2010 to 2035 in 5-year intervals and for years 2012 and 2032. Expected future populations
that result from the most-likely demographic trends throughout Yamhill County are
presented in this report. Sub-county populations and forecasts in this study represent the
area within each city’s urban growth boundary with the exception of the non-UGB county
unincorporated area and the Polk County portion of Willamina. Since Willamina extends
into Polk County, populations are reported for the city and its UGB as a whole, as well as
for the portion of Willamina (and its UGB) located in Yamhill County separately.
For the sake of organization of this report and discussion of demographic characteristics,
trends and forecasts, Yamhill County and its sub-areas are grouped into 2 categories: 1) the
County and the most populous and more urbanized areas of McMinnville and Newberg
and their UGBs, which captures about 55 percent of the County population; and 2) the
remaining eight cities and their UGBs (most which have a 2011 population estimate of less
than 4,000 persons except Sheridan which has 6,200), and the non-UGB County
unincorporated area. Although the unincorporated area represented in this study has a 2011
population estimate of around 23,000, slightly larger than the Newberg area, it is grouped
with the smaller, less urbanized cities in this report as it is more rural. Yamhill County and
its two largest cities are sometimes discussed within one group; and the remaining eight
cities and non-UGB unincorporated area in Yamhill County are discussed in another
group. The 2011 population estimates and the grouping of the study area’s jurisdictions are
shown in the table below.
Page 10
Table 1. Populations in Yamhill County
Areas 2011
Population Estimate*
Yamhill County 99,850
McMinnville 32,808
Newberg1 22,730
Amity 1,635
Carlton 2,036
Dayton 2,731
Dundee 3,210
Lafayette 3,745
Sheridan 6,230
Willamina2 2,057
Yamhill 1,024 Non-UGB Unincorporated Yamhill County 22,510
*The certified 2011 populations for the cities were adjusted to include the UGBs. 1This figure excludes the urban reserve area (URA); 2This figure represents the entire city.
This report covers the following topics:
Demographic Trends in Yamhill County and its Sub-Areas. A description of recent
demographic trends and influencing population changes in the County, such as fertility,
migration, and housing growth. Also included in this section is a description of some
additional factors that influence population changes throughout the County: age and
racial/ethnic composition of the population, housing construction, and employment trends.
Significant demographic trends that are specific to the individual geographic sub-areas of
the Yamhill County study area are also described.
Population Growth Assumptions for the County and its Larger Areas. A description of the
assumptions used in the population forecasts for the County and its larger urban areas of
McMinnville, and Newberg and their UGBs.
Page 11
Population Growth Assumptions for the Smaller City Areas and the non-UGB
Unincorporated Area. A description of the assumptions used in population forecasts for
Yamhill County’s 8 less populous city areas, and for the non-UGB unincorporated area.
The Population Forecasts (Countywide and Larger Area Results). A summary of the
forecast results and the predicted population changes for the County, and McMinnville,
and Newberg.
Population Forecasts for the County’s Eight Smaller City Areas and the non-UGB
Unincorporated Area. A summary of the forecast results and the predicted population
changes in Yamhill County’s 8 less populous city areas and the non-UGB unincorporated
area.
Methods and Data Employed for Countywide and other Larger Area Forecasts. A
description of the population forecast models and data sources used for the larger area
forecasts.
Methods and Data Employed for the Smaller City Areas and non-UGB Unincorporated
Area Population Forecasts. A description of the demographic models and data used to
develop these forecasts.
Several Appendices provide more detailed information, including:
APPENDIX 1. Tables with detailed forecasts and historical populations in 5-year
intervals for Yamhill County, the 2 larger cities for McMinnville and Newberg.
APPENDIX 2. Tables with detailed forecasts and historical populations in 5-year
intervals for Yamhill County’s 8 smaller cities and the non-UGB unincorporated area.
APPENDIX 3. Assumptions of demographic rates for Yamhill County, McMinnville,
and Newberg.

Page 12
APPENDIX 4. A table holding information considered when developing the forecasts and
adjusting the forecast models for the ten city areas and the non-UGB unincorporated area.
APPENDIX 5. Tables presenting a compilation of demographic data and rates for
Yamhill County and its sub-areas; and the rates and data assumed for the forecast
populations.
APPENDIX 6. A map showing housing density within Yamhill County (2010).
APPENDIX 7. Data sources and data used are described in detail.
APPENDIX 8. Tables presenting county and city population data from the decennial
censuses conducted from 1970-2010.
APPENDIX 9. Responses to the initial draft report and preliminary forecasts, including
e-mails and comments.
APPENDIX 10. Summary of adjustments to the preliminary forecasts.

Page 13
RECENT DEMOGRAPHIC TRENDS AFFECTING YAMHILL COUNTY POPULATIONS
Evaluating past demographic trends provides clues about what the forecast for the future
will look like, and helps determine the realm of likely possibilities. Past trends explain the
dynamics of population growth particular to local areas. Relating recent and historical
population change to events that influenced the change serves as a gauge for what might
realistically occur in a given area over the long term.
Different growth patterns occur in different parts of Yamhill County. Each of the ten cities
(or city areas), and the non-UGB unincorporated area were examined for any significant
demographic characteristics or changes in population or housing growth that might
influence their individual forecasts. Factors that were analyzed include births, age and
racial/ethnic composition of the population, housing construction activity, and school
enrollment and employment trends. It should be noted that population trends of individual
cities and the unincorporated area often differ from the demographic trends of the county
as a whole. However, in general, population growth rates in 2011 were lower than in
previous years such as the early to mid-2000s. Annual growth rates have tended to
decelerate since 2007 and recently have begun to stabilize.
POPULATION
The total population in Yamhill County in 2011 is estimated to be 99,850, an increase of
525 persons since Census 2010. This growth of only half of a percent is significantly lower
than the average annual growth rate during the 2000s, which was 1.5 percent. Population
growth in Yamhill County during the 2000s was slightly higher than growth for the State
of Oregon (1.1 percent per year). During the 2000s an average of 1,420 persons per year
was added to Yamhill County’s population, and during the 1990s, 1,940 persons were
added on average annually. The share of Oregon’s population residing in Yamhill County
in 2011 was about 2.6 percent, which increased from 2.5 percent in 2000 and 2.3 percent in
1990. The share of the County’s population that the sum of the cities represents

Page 14
experienced an increase during the same time period, reaching 77 percent in 2011, while
the share of population residing in the non-UGB unincorporated area decreased.
Since at least 2000, over half of Yamhill County’s population has resided in one of its two
largest cities, McMinnville and Newberg. McMinnville, with a 2011 population of just
over 32,000 accounted for about 40 percent of the County’s population growth during both
the 1990s and 2000s. Newberg, whose 2011 population was almost 23,000, accounted for
over a quarter of countywide growth during the same time periods. Both cities experienced
growth rates higher than the County, as well. During recent years, however, the magnitude
of increases in population has slowed down significantly.
In 2011, the eight smaller city areas collectively were home to 22 percent of the population
in Yamhill County (almost 22,000 persons), an increase from 20 percent in 2000. This
population experienced an average annual increase of just under 2 percent in the 2000s, or
by 360 persons per year. The rate of population growth in all these cities in recent years,
however, declined in magnitude as did County growth.
The population in the non-UGB unincorporated area was about 23,000 in 2011 and
represented about 23 percent of the County population. From 2000 to 2011 this area’s
population decreased, but by less than 1,000 persons over the time period. The share of
population residing in the non-UGB unincorporated area decreased from about 28 percent
in 2000.
From 2000 to 2011, seven of Yamhill County’s cities experienced a small increase in their
share of county population – by at least a fraction of a percentage point. McMinnville’s
share of the county’s population increased the most, by about 2 percentage points. The
shares in Amity, Sheridan and Willamina all decreased slightly, but by less than a half of a
percentage point each over the period. All three cities are located furthest southwest in
Yamhill County, away from the Portland metropolitan area. A rural to urban shift of where
persons choose to reside has been a common occurrence throughout Oregon and in the
United States over many years.

Page 15
Table 2 below displays the recent population for Yamhill County and its cities, and non-
UGB unincorporated area. Also shown are the shares that cities represent of the county
population and average annual change from 2000-2011.
Of all of Yamhill County’s cities, Lafayette, Carlton, Yamhill, and McMinnville
experienced the highest average annual growth rates from 2000-2011 ( at least 2.0
percent). The average growth rates for the other cities range from less than one percent to
1.9 percent per year during the same period. Most cities experienced average annual
growth rates higher than the County.
Table 2. Yamhill County Populations by Jurisdiction
Major Urban Areas
Population Share of County Population
# Ave. Annual Change
% Ave. Annual Change 2000* 2011 2000 2011
Yamhill County 84,992 99,850 1,351 1.5% McMinnville 26,286 32,808 30.9% 32.8% 593 2.0% Newberg 18,538 22,730 21.8% 22.8% 381 1.9% Other Yamhill County Cities
Population Share of County Population
# Ave. Annual Change
% Ave. Annual Change 2000* 2011 2000 2011
Amity 1,481 1,635 1.7% 1.6% 14 0.9% Carlton 1,514 2,036 1.8% 2.0% 47 2.7% Dayton 2,244 2,731 2.6% 2.7% 44 1.8% Dundee 2,642 3,210 3.1% 3.2% 52 1.8% Lafayette 2,586 3,745 3.0% 3.8% 105 3.4% Sheridan 5,581 6,228 6.6% 6.2% 59 1.0% Willamina 1,859 2,057 - - 18 0.9% Willamina (Yamhill Co.)
1,128 1,180 1.3% 1.2% 5 0.4%
Yamhill 805 1,037 0.9% 1.0% 21 2.3% *Population for 2000 is allocated to 2011 boundaries and includes UGB areas; the 2000 population in this table may differ from Census 2000 published population (see caveat explanation on page 3).
AGE COMPOSITION
The number of persons in age groups 0-17, 18-64, and 65 and older residing in Yamhill
County all increased from 2000 to 2011. However, regarding the percentages that they
represent of the total population, there was a decrease in the share of children’s population.
Page 16
The share of total population that persons ages 0-17 years represent decreased from 27 to
25 percent during the time period. The share of persons ages 18-64 remained about the
same at around 61 percent, but the share of the elderly - persons ages 65 and older -
increased from 12 to 14 percent during the same time period.
In 2011, the share that persons ages 0-17 represented in Yamhill County (25 percent) was
higher than the State by 2 percentage points, and the shares of persons ages 18-64 (61
percent), and 65 and older (14 percent), were lower by one and a half percentage points
and a half of a point, respectively.
The most recent age-group data available for Yamhill County’s sub-areas are from the
2010 Census. From 2000 to 2010, all cities and the unincorporated area in Yamhill County
experienced a decrease in the share of children’s population. The share of children’s
population in most areas declined by between 2 to 5 percentage points. The shares in
McMinnville and Carlton declined by about one percentage point, and in Lafayette and
Sheridan by less than half of a point.
According to Census 2010, all cities except Sheridan have a higher share of children’s
population than Yamhill County as a whole. Sheridan and the unincorporated area both
have the smallest share of children’s population (around 22-23 percent). The cities with the
highest share of children are Dayton, Lafayette, and Amity, Carlton, and Willamina. In
2010, children captured more than 30 percent of the total population in each of these cities.
In 2010, the unincorporated area had the highest share of elderly (17 percent), followed
McMinnville (15 percent). The remaining cities each had shares of 12 percent or less,
which is below the county share (13 percent).
SCHOOL ENROLLMENT
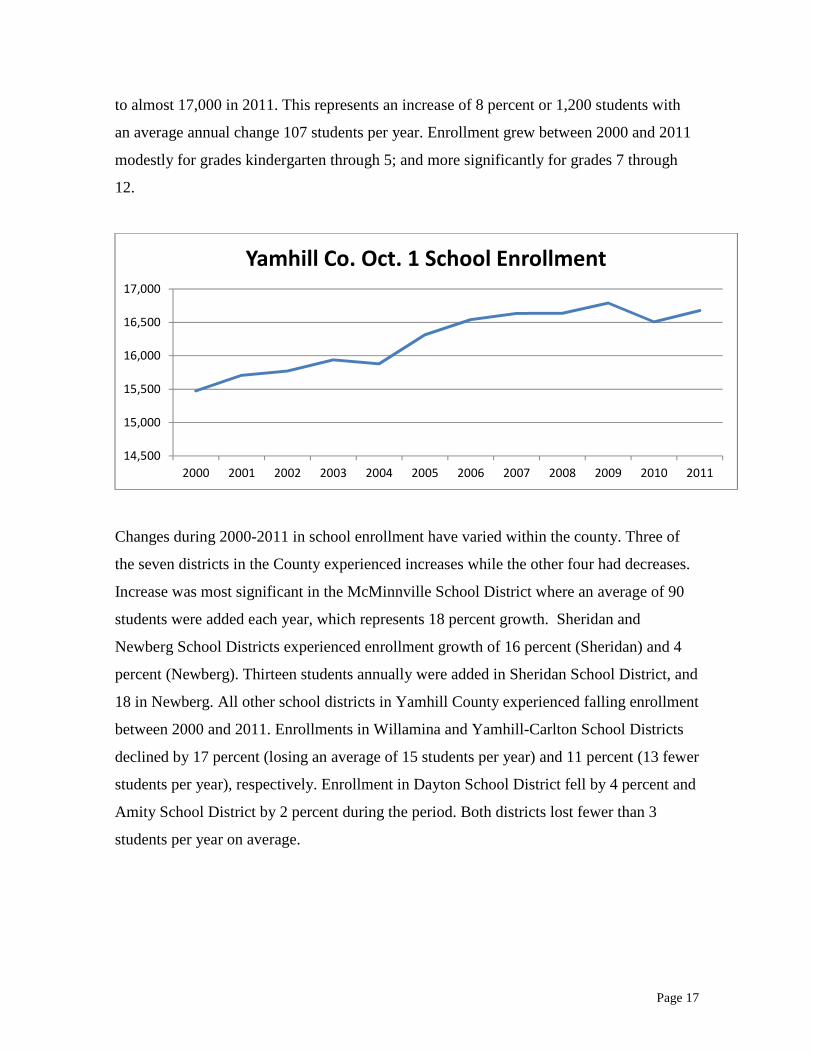
Changes in school enrollment in local school districts serve as an indicator of population
change, especially for the 5-17 age group. Elementary and secondary school enrollment
data show an increase in school enrollment in Yamhill County from about 15,500 in 2000
Page 17
to almost 17,000 in 2011. This represents an increase of 8 percent or 1,200 students with
an average annual change 107 students per year. Enrollment grew between 2000 and 2011
modestly for grades kindergarten through 5; and more significantly for grades 7 through
12.
Changes during 2000-2011 in school enrollment have varied within the county. Three of
the seven districts in the County experienced increases while the other four had decreases.
Increase was most significant in the McMinnville School District where an average of 90
students were added each year, which represents 18 percent growth. Sheridan and
Newberg School Districts experienced enrollment growth of 16 percent (Sheridan) and 4
percent (Newberg). Thirteen students annually were added in Sheridan School District, and
18 in Newberg. All other school districts in Yamhill County experienced falling enrollment
between 2000 and 2011. Enrollments in Willamina and Yamhill-Carlton School Districts
declined by 17 percent (losing an average of 15 students per year) and 11 percent (13 fewer
students per year), respectively. Enrollment in Dayton School District fell by 4 percent and
Amity School District by 2 percent during the period. Both districts lost fewer than 3
students per year on average.
14,500
15,000
15,500
16,000
16,500
17,000
2000 2001 2002 2003 2004 2005 2006 2007 2008 2009 2010 2011
Yamhill Co. Oct. 1 School Enrollment
Page 18
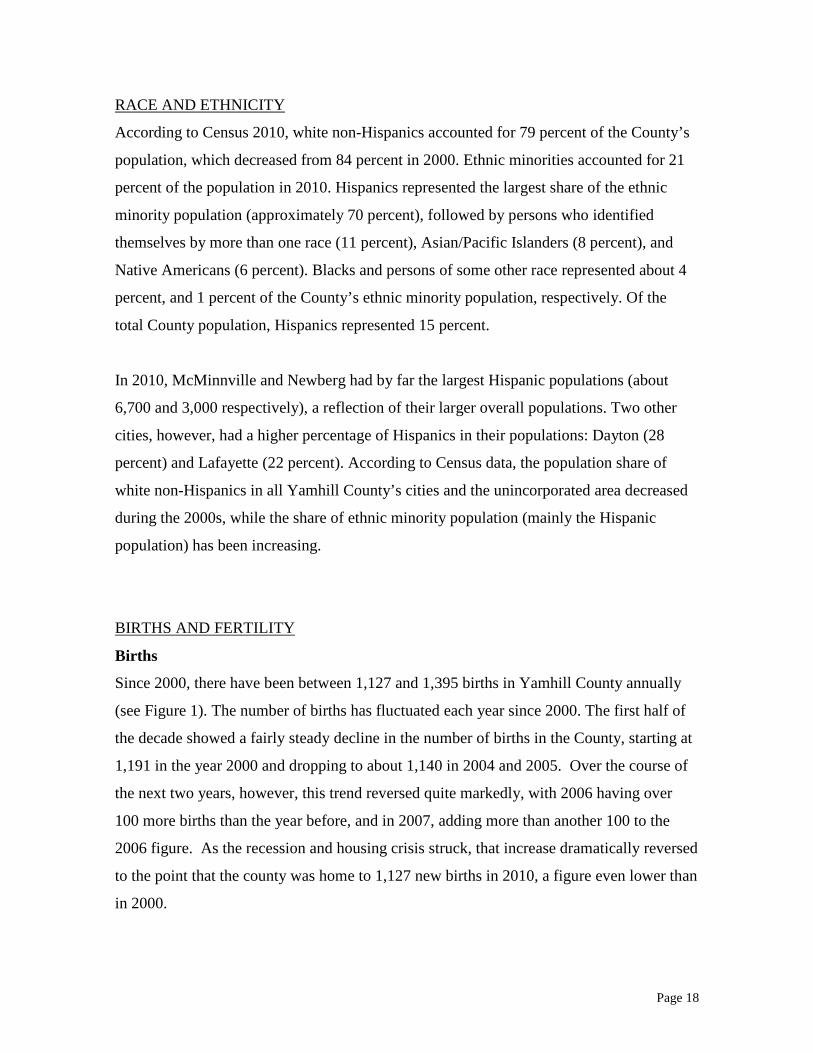
RACE AND ETHNICITY
According to Census 2010, white non-Hispanics accounted for 79 percent of the County’s
population, which decreased from 84 percent in 2000. Ethnic minorities accounted for 21
percent of the population in 2010. Hispanics represented the largest share of the ethnic
minority population (approximately 70 percent), followed by persons who identified
themselves by more than one race (11 percent), Asian/Pacific Islanders (8 percent), and
Native Americans (6 percent). Blacks and persons of some other race represented about 4
percent, and 1 percent of the County’s ethnic minority population, respectively. Of the
total County population, Hispanics represented 15 percent.
In 2010, McMinnville and Newberg had by far the largest Hispanic populations (about
6,700 and 3,000 respectively), a reflection of their larger overall populations. Two other
cities, however, had a higher percentage of Hispanics in their populations: Dayton (28
percent) and Lafayette (22 percent). According to Census data, the population share of
white non-Hispanics in all Yamhill County’s cities and the unincorporated area decreased
during the 2000s, while the share of ethnic minority population (mainly the Hispanic
population) has been increasing.
BIRTHS AND FERTILITY
Births
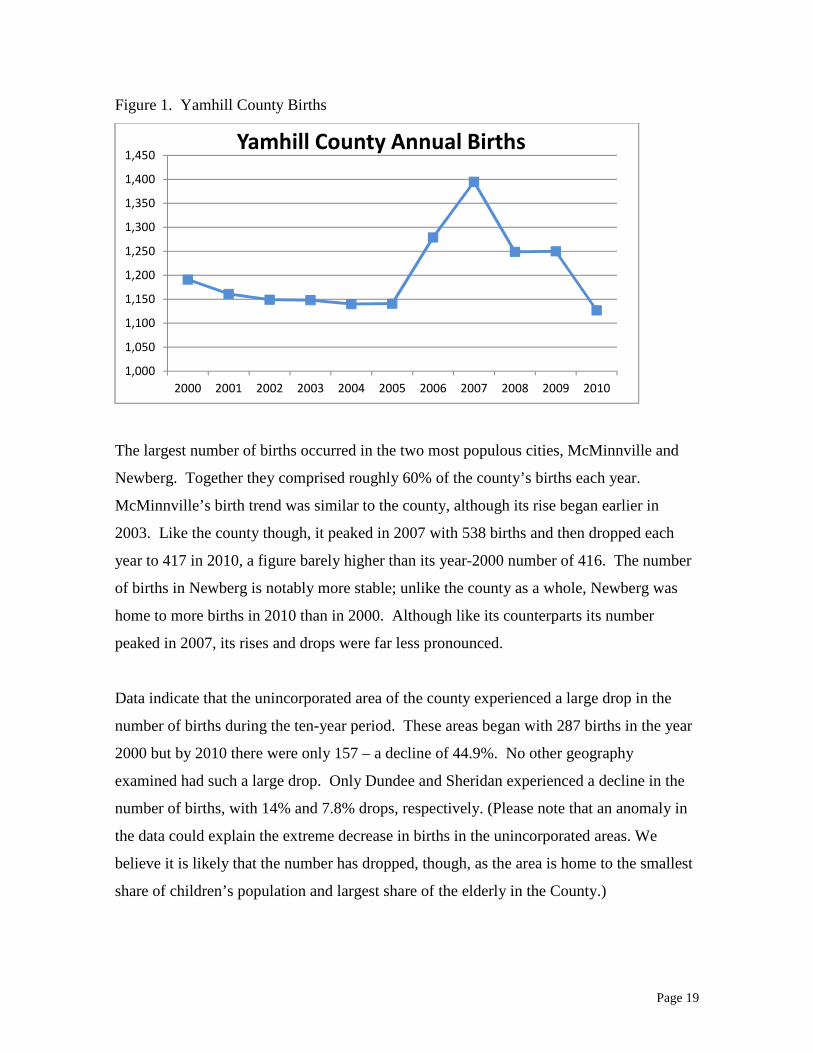
Since 2000, there have been between 1,127 and 1,395 births in Yamhill County annually
(see Figure 1). The number of births has fluctuated each year since 2000. The first half of
the decade showed a fairly steady decline in the number of births in the County, starting at
1,191 in the year 2000 and dropping to about 1,140 in 2004 and 2005. Over the course of
the next two years, however, this trend reversed quite markedly, with 2006 having over
100 more births than the year before, and in 2007, adding more than another 100 to the
2006 figure. As the recession and housing crisis struck, that increase dramatically reversed
to the point that the county was home to 1,127 new births in 2010, a figure even lower than
in 2000.
Page 19
Figure 1. Yamhill County Births
The largest number of births occurred in the two most populous cities, McMinnville and
Newberg. Together they comprised roughly 60% of the county’s births each year.
McMinnville’s birth trend was similar to the county, although its rise began earlier in
2003. Like the county though, it peaked in 2007 with 538 births and then dropped each
year to 417 in 2010, a figure barely higher than its year-2000 number of 416. The number
of births in Newberg is notably more stable; unlike the county as a whole, Newberg was
home to more births in 2010 than in 2000. Although like its counterparts its number
peaked in 2007, its rises and drops were far less pronounced.
Data indicate that the unincorporated area of the county experienced a large drop in the
number of births during the ten-year period. These areas began with 287 births in the year
2000 but by 2010 there were only 157 – a decline of 44.9%. No other geography
examined had such a large drop. Only Dundee and Sheridan experienced a decline in the
number of births, with 14% and 7.8% drops, respectively. (Please note that an anomaly in
the data could explain the extreme decrease in births in the unincorporated areas. We
believe it is likely that the number has dropped, though, as the area is home to the smallest
share of children’s population and largest share of the elderly in the County.)
1,000
1,050
1,100
1,150
1,200
1,250
1,300
1,350
1,400
1,450
2000 2001 2002 2003 2004 2005 2006 2007 2008 2009 2010
Yamhill County Annual Births
Page 20
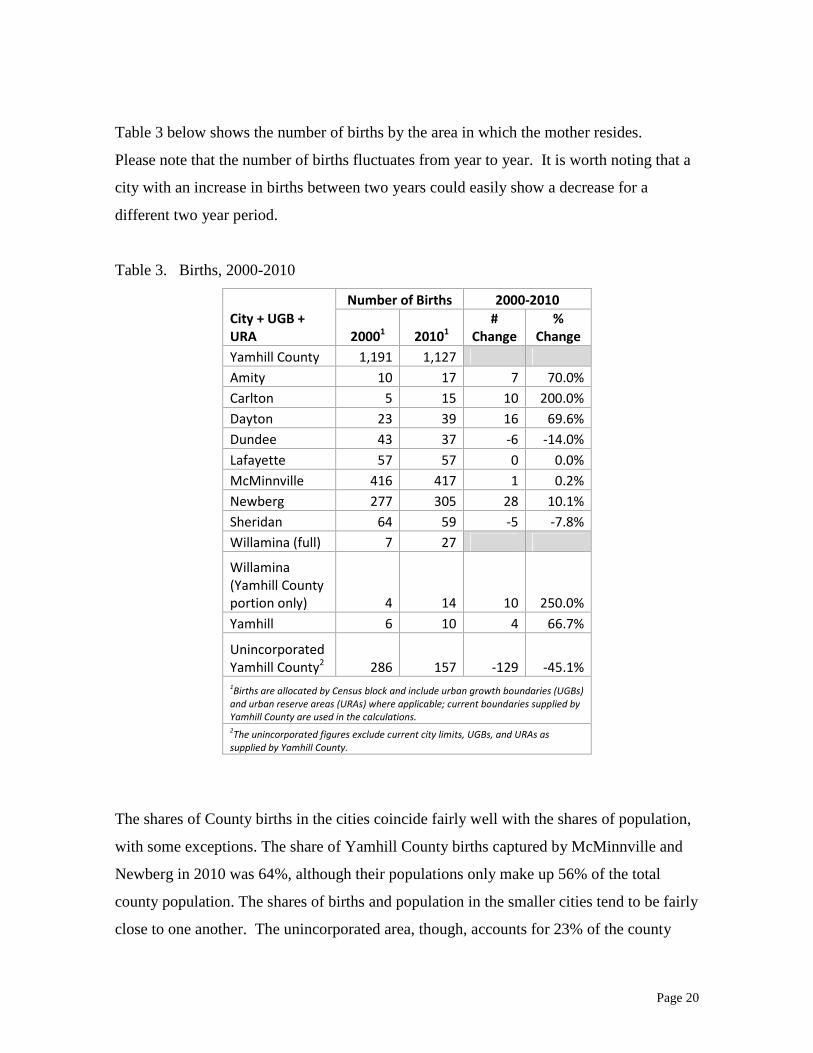
Table 3 below shows the number of births by the area in which the mother resides.
Please note that the number of births fluctuates from year to year. It is worth noting that a
city with an increase in births between two years could easily show a decrease for a
different two year period.
Table 3. Births, 2000-2010
City + UGB +
URA
Number of Births 2000-2010
20001 2010
1
#
Change
%
Change
Yamhill County 1,191 1,127
Amity 10 17 7 70.0%
Carlton 5 15 10 200.0%
Dayton 23 39 16 69.6%
Dundee 43 37 -6 -14.0%
Lafayette 57 57 0 0.0%
McMinnville 416 417 1 0.2%
Newberg 277 305 28 10.1%
Sheridan 64 59 -5 -7.8%
Willamina (full) 7 27
Willamina
(Yamhill County
portion only) 4 14 10 250.0%
Yamhill 6 10 4 66.7%
Unincorporated
Yamhill County2 286 157 -129 -45.1%
1Births are allocated by Census block and include urban growth boundaries (UGBs)
and urban reserve areas (URAs) where applicable; current boundaries supplied by
Yamhill County are used in the calculations.
2The unincorporated figures exclude current city limits, UGBs, and URAs as
supplied by Yamhill County.
The shares of County births in the cities coincide fairly well with the shares of population,
with some exceptions. The share of Yamhill County births captured by McMinnville and
Newberg in 2010 was 64%, although their populations only make up 56% of the total
county population. The shares of births and population in the smaller cities tend to be fairly
close to one another. The unincorporated area, though, accounts for 23% of the county
Page 21
population but only 14% of the 2010 births. This variation means that either the fertility
rate, or the percentage of households that are families, or both, is lower in unincorporated
areas than the whole county; and conversely for McMinnville and Newberg, that the
fertility rate, or percentage of family households, or both, is higher.
Yamhill County Fertility
The total fertility rate is the average number of children a woman bears throughout her
fertile years. In 2010, the total fertility rate in Yamhill County was 1.82. This rate declined
from 2.12 in 2000, and is now below the replacement rate, which is the average number of
children a woman needs to bear in order to avoid population losses barring net migration.
The total fertility rate in Yamhill County is slightly higher than the State average which
was 1.79 children per woman in 2010 and 1.98 in 2000. In general, the total fertility rates
have declined during the past three decades nationwide and in Oregon. A potentially larger
decrease in fertility rates has been offset by the increase of the female Hispanic population,
which is associated with higher fertility rates than the majority population of white non-
Hispanics.
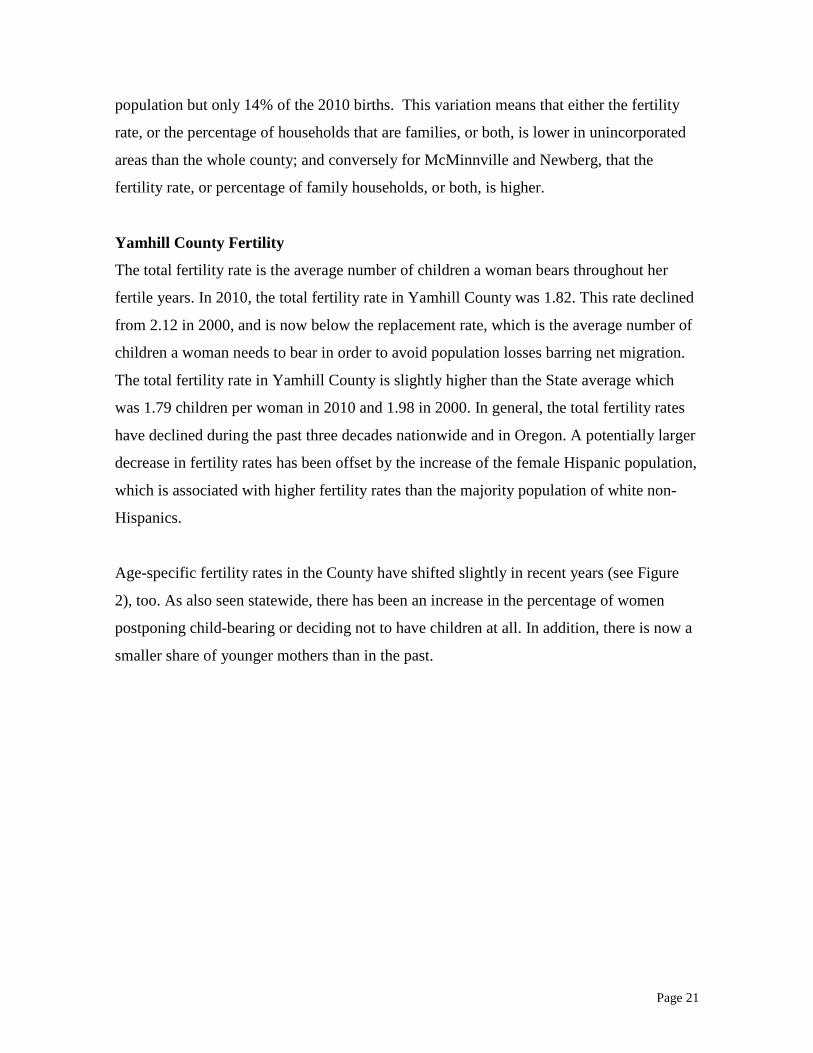
Age-specific fertility rates in the County have shifted slightly in recent years (see Figure
2), too. As also seen statewide, there has been an increase in the percentage of women
postponing child-bearing or deciding not to have children at all. In addition, there is now a
smaller share of younger mothers than in the past.

Page 22
Figure 2. Yamhill County Fertility
In the 2008-2010 time period, 71 percent of all births in Yamhill County were to white
non-Hispanics, 24 percent were to Hispanics, and 5 percent were to either Asians/Pacific
Islanders, blacks, Native Americans, or to women of other or multiple races. The share of
Hispanic births in Yamhill County is larger than the state percentage, which was 2
percentage points lower during the same time period. Since 2000 and earlier, the
percentage of births to Hispanics in the County and statewide has increased while the
percentage of births to white non-Hispanics has decreased.
HOUSING AND HOUSEHOLDS
Carlton, Dundee, and Lafayette have UGBs that are either identical or nearly identical, to
their city boundaries. Yamhill has a UGB very close to its city boundary as well, though
the UGB area is primarily for industrial uses. In general, the number of housing units in
the UGB areas outside city limits is very small or negligible. Amity, for example, had 575
housing units as of the 2010 Census, while its unincorporated UGB area had 1. Only
Dayton has a significant percentage of its housing stock in its unincorporated UGB area,
with 7.4%, or 67 units, outside the city limits (see methodology for details on how this is
0.000
0.020
0.040
0.060
0.080
0.100
0.120
0.140
0.160
10-14 15-19 20-24 25-29 30-34 35-39 40-44 45-49
Yamhill County Age -specific Fertility Rates
2000
2010

Page 23
estimated).McMinnville and Newberg had 195 and 173 units in their UGBs, respectively,
but the percentages were only around 2 percent.
The rates of increase in the number of housing units are generally similar to the
corresponding population growth rates. For example, Carlton’s population increased by
26.9% from 2000-2010, while the number of housing units increased 27.3%. The largest
discrepancy between these rates occurred in Yamhill, whose population grew by 27.2% in
population but by 40% in the number of housing units. The growth rates for housing may
differ from those for population because of demographic changes: the city has experienced
changes in the average number of persons per household or in occupancy rates.
From 2000 to 2010, an average of 684 additional units has been added to Yamhill
County’s housing stock every year. In terms of percentage growth, Lafayette (48%) and
Yamhill (40%) experienced the most dramatic increases in housing stock. In terms of raw
numbers, the county’s two largest cities had the biggest increases in housing units, with
McMinnville adding 2,830 units and Newberg adding 1,805. Together, these two cities
account for 68% of all new housing units during the decade.

Page 24
Table 5. Housing Unit Change, 2000-2010
City + UGB Housing Units,
2000
Housing Units,
2010
New Housing
Units 2000-
2010
Percent
Increase
Yamhill County 30,270 37,110 6,840 22.6%
Amity 497 576 79 15.9%
Carlton 577 768 190 33.0%
Dayton 699 904 205 29.3%
Dundee 963 1,175 212 22.0%
Lafayette 888 1,317 429 48.3%
McMinnville 9,743 12,573 2,830 29.0%
Newberg 6,604 8,409 1,805 27.3%
Sheridan 1,392 1,684 292 21.0%
Willamina (full) 718 786 68 9.5%
Willamina (Yamhill County portion only)
438 439 1 0.2%
Yamhill 268 375 107 39.9%
Unincorporated Yamhill County2
8,203 8,944 741 9.0%
1Populations are allocated by Census block and include urban growth boundaries (UGBs) where applicable; current boundaries
supplied by Yamhill County are used in the calculations.
2The unincorporated figures exclude current city limits and UGBs as supplied by Yamhill County.
Housing Occupancy
According to the Census 2010 data, Yamhill County’s housing occupancy rate was about
93.6 percent, which is higher than the rate for Oregon (about 90.7 percent). Although the
occupancy rate for the County, all its ten cities, and unincorporated area has slightly
declined since 2000, the occupancy rate did not fluctuate much from 2000 to 2010 for most
cities, except for Dayton and Willamina. In these two cities, a change of over just over
three percentage point was observed. Since the share of seasonal or vacation homes within
the County and its cities is relatively small compared to places with more tourism
activities, the housing occupancy rate has been about 90 percent or above for all
jurisdictions within the County. Places with the highest occupancy rates – above 94
percent - are Dayton, Dundee, McMinnville, and Yamhill. Cities with lowest occupancy
rates – below 92 percent - are Carlton, Lafayette, and Willamina.

Page 25
Average Household Size
In 2010, about 94 percent of Yamhill County’s population resided in households. The
average number of persons that occupy a household (PPH), or household size, is
influenced by several factors. The age and racial/ethnic composition of a population
provides some indication of the size of the area’s PPH. A high share of elderly population
versus the share of married couples and growing families yields a smaller PPH due to the
propensity of elderly to live alone; whereas higher PPH may be attributed to the tendency
to have larger families or share housing by some racial/ethnic groups than others. Changes
in an area’s fertility rates and school enrollment also have a bearing on changes in PPH.
An increase in PPH is supported by higher fertility rates and increasing school enrollment.
A stable PPH could mean the population composition, and the number of births are stable;
but it could also mean that an increase in the number of births, married couples and
growing families is being offset by an increase in the number of elderly.
As revealed in Census 2010, the PPH in Yamhill County is around 2.70 and is somewhat
higher than it is statewide (2.47). The County’s PPH declined slightly from 2.78 in 2000.
The highest PPHs observed in 2010 were in Amity, Dayton, and Lafayette, where the
PPHs were 3.00, 3.17, and 3.09, respectively. The cities with the lowest PPHs in Yamhill
County are McMinnville and Newberg, with averages of 2.61 and 2.66 persons residing in
each household in 2010.
In general, the PPH in single-family units (SFR) is typically higher than in multi-family
residences (MFR), or mobile homes. Analysis of American Community Survey (ACS) data
for 2006-2010 reflects that the PPH varies by housing type in Yamhill County and most
cities, similar to the pattern observed elsewhere in general. In Lafayette and Yamhill,
however, the PPH is higher in multi-family and mobile homes respectively than in other
housing unit types.
Group Quarters Facilities’ Population
In 2010, 6 percent of Yamhill County’s population, or 5,461 persons, resided in group
quarters facilities such as nursing homes, college dormitories, or jails and prison. This
Page 26
percentage decreased very slightly (by a fraction of a percent) from 2000, however, the
actual number residing in group quarters facilities increased by 437. Together the cities of
McMinnville, Newberg, and Sheridan are home to about 92 percent of the County’s group
quarters population with their college dorms and the prison. The remaining 8 percent of the
group quarter populations is distributed among Dundee, Willamina, Yamhill, and the
unincorporated area of Yamhill County. The group quarters facilities in these areas are
mostly care homes for the elderly.
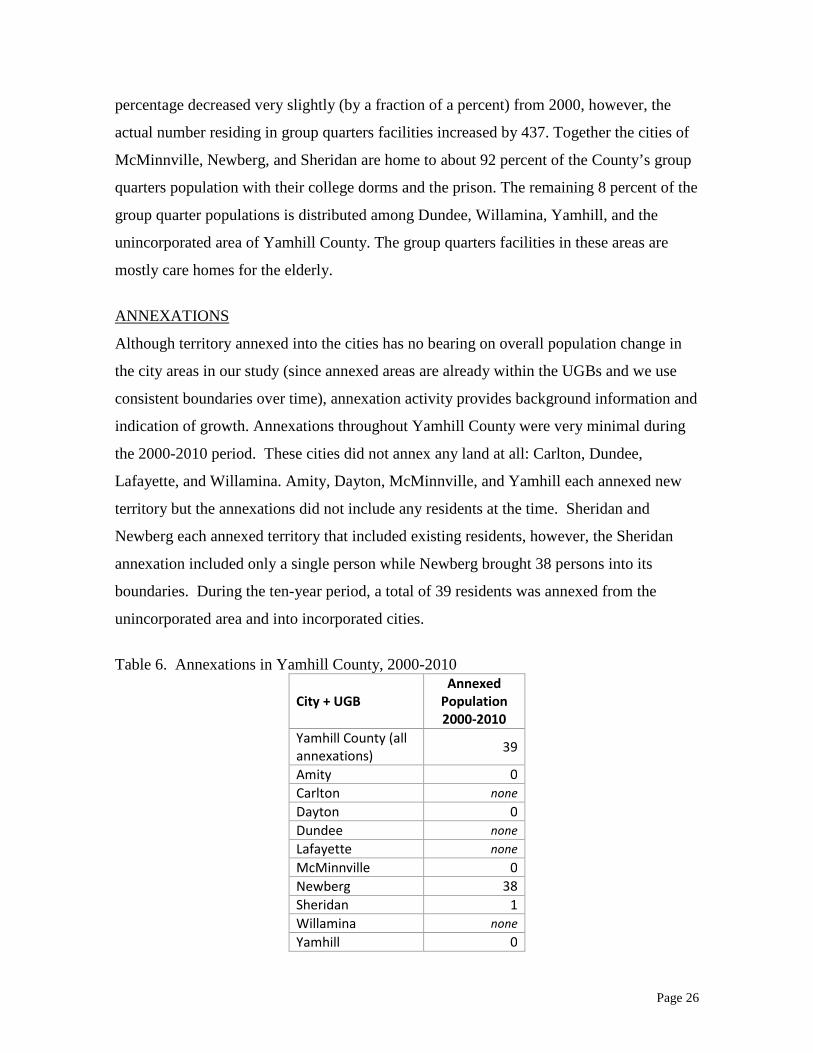
ANNEXATIONS
Although territory annexed into the cities has no bearing on overall population change in
the city areas in our study (since annexed areas are already within the UGBs and we use
consistent boundaries over time), annexation activity provides background information and
indication of growth. Annexations throughout Yamhill County were very minimal during
the 2000-2010 period. These cities did not annex any land at all: Carlton, Dundee,
Lafayette, and Willamina. Amity, Dayton, McMinnville, and Yamhill each annexed new
territory but the annexations did not include any residents at the time. Sheridan and
Newberg each annexed territory that included existing residents, however, the Sheridan
annexation included only a single person while Newberg brought 38 persons into its
boundaries. During the ten-year period, a total of 39 residents was annexed from the
unincorporated area and into incorporated cities.
Table 6. Annexations in Yamhill County, 2000-2010
City + UGB
Annexed
Population
2000-2010
Yamhill County (all
annexations) 39
Amity 0
Carlton none
Dayton 0
Dundee none
Lafayette none
McMinnville 0
Newberg 38
Sheridan 1
Willamina none
Yamhill 0
Page 27
MIGRATION
Sixty-five percent of Yamhill County’s population increase from 2000 to 2011 was
accounted for by net-migration (movers in minus movers out). An average of around 920
more persons moved into Yamhill County than moved out annually during this period.
Migration rates are estimated to be highest among older middle-age persons with their
children, and retirees. Migration rates overall are estimated to be a little lower in the 2000s
through 2012 than were experienced during the 1990s.
In 2010, about 15 percent of Yamhill County’s population had moved within the previous
12 months. Of the movers, 58 percent stayed within the County. Of those who moved into
Yamhill County from somewhere else, 67 percent came from another county within
Oregon, and 33 percent came from out of state.
EMPLOYMENT
According to unemployment data from the State of Oregon Employment Department, the
2011 unemployment rate in Yamhill County was around 9.2 percent, which was slightly
lower than for Oregon (9.5 percent). Since at least 2000, the rates have been similar.
ACS data for 2006-2010, (the most recent year for which we have data for cities), report
that the lowest unemployment rates in the County were in Dundee, Yamhill, and Newberg.
The areas with unemployment rates significantly higher than the County rate were Dayton
and Willamina.
Data on commuting patterns obtained from the Census Bureau (Local Employment
Dynamics data, or LED) reveal that in 2010 about 45 percent of workers residing in
Yamhill County are employed in jobs located within the County. About 21 percent work in
McMinnville and 11 percent in Newberg. About 8 percent of all workers residing in
Yamhill County commute to Portland and 5 percent, to Salem. Cities with the smallest
percentage of workers commuting outside the county for work – under 50 percent – are

Page 28
Dayton and McMinnville. The largest percentage of its workers commuting to their jobs
outside Yamhill County resides in Newberg, Lafayette, and Dundee (over 60 percent).

Page 29
DEMOGRAPHIC ASSUMPTIONS
FOR THE COUNTYWIDE AND SUB-AREA POPULATION FORECAST S
An area’s demographic characteristics affect the rate at which its population changes over
time. These characteristics include the age and gender structure, propensity to have
children, and race/ethnicity. The gender and age structure of the population influences
household size and mortality rates; the age structure and ethnicity of the female population
influences fertility rates. Additionally, the economy, employment opportunities, and
housing availability also influence population change. When the local economy is
struggling and unemployment rates and inflation are high, the rate of in-migration
decelerates. When the economy is strong, job growth increases, goods and services are
more affordable to a higher percentage of population, and in-migration increases to areas
that are accessible to jobs and housing, while out-migration decreases. The demographic
characteristics of in and out-migrants influence how local populations change as well. For
example, the net in-migration of young families has a different effect on a population
growth versus the net in-migration of elderly single householders as the number of births
and household size amongst these two population groups are at opposite ends of the scale.
In short, the population of an area is determined by the number of births and deaths that
occur in that area, and the number of people moving in or out (net migrants). Of the
demographic rates that influence population growth in Oregon, mortality rates change very
little; and fertility rates, while they do vary more than mortality, change fairly slowly over
time. Migration rates are more volatile as they are influenced by more dynamic factors
such as job and housing availability, and the economy.
Regardless of how the economy performs, however, the very fast population growth during
1990s and most of the last decade across Oregon will likely not occur in the future at
similar levels. First, the population in Yamhill County (and most other areas in Oregon) is
aging. An aging population means that the share of population in the older age groups is
becoming larger. While mortality rates decline minimally and the probability of dying is
declining over time a bit, the number of deaths that occurs does become greater in an aging
population and has a significant negative effect on population growth. Secondly, fertility

Page 30
rates in Yamhill County are below replacement levels, and so together with the aging
population, natural increase (births minus deaths) has a weaker effect on increasing annual
population numbers. Positive population growth then becomes more and more dependent
on net in-migration.
Assumptions about fertility, mortality, and migration for the population forecasts were
developed for Yamhill County’s population forecast and for the forecasts of McMinnville
and Newberg. The assumptions for population growth are based on predictions of
countywide and local demographic trends, and how robust the economy will be during the
next twenty-four years. The population forecasts produced for Yamhill County’s eight
smaller city areas and the non-UGB unincorporated area are based on housing growth that
is informed by current population composition and recent demographic trends.
A listing of the demographic rates assumed for future change for Yamhill County,
McMinnville, and Newberg is presented in Appendix 3, and for all cities, in Appendix 5.
SPECIFIC ASSUMPTIONS FOR DEMOGRAPHIC COMPONENTS:
Mortality
Mortality and life expectancy rates used in our study are those developed for Oregon. The
change in future mortality rates and life expectancies in Yamhill County are assumed to
follow the same pattern as Oregon and as seen in the national projections developed by the
U.S. Census Bureau. Mortality is projected to consistently decline ever so slightly over the
forecast period, and life expectancy and survival rates are projected to improve slightly.
For Oregon, the life expectancy for males in 2008 (the most recent year for which we have
the data) was 76.9 years, and for females was 81.5 years. By 2040, life expectancy is
projected to be 81.1 years for males and 85.2 years for females.
Although life expectancy increases, the magnitude of change in the survival rates in each
5-year period of our population forecast is very small. Despite this slight increase in

Page 31
survival rates, the aging population and the larger number of persons in the older age
groups will produce an increase in the number of annual deaths over the forecast period.
Fertility
Our study assumes that fertility rates will vary slightly during the forecast period. We
predict that current fertility rates will continue to decline slightly over the next few years,
and then stabilize. The stabilization of fertility rates will occur due to increasing diversity
and an increase in immigrant population. However, the total fertility rate (TFR, the average
number of children each female bears during her lifetime) in the County, McMinnville and
Newberg will continue to remain at or above state-level fertility rates, but below the
replacement level TFR of 2.1 during the entire forecast period. Our assumptions for the
total fertility rates in Yamhill County follow similar national trends predicted by the
Census Bureau.
Figure 4 Total Fertility Rates: Yamhill County, McMinnville, and Newberg, 2000-2035.
Migration
Migration is the most volatile and difficult component of population change to predict.
Both economic and social factors in and outside of an area affect the volume and flow of
1.60
1.70
1.80
1.90
2.00
2.10
2.20
2000 2010 2015 2020 2025 2030 2035
Total Fertility Rates (2015-2035 forecast)
Yamhill County
McMinnville
Newberg
Page 32
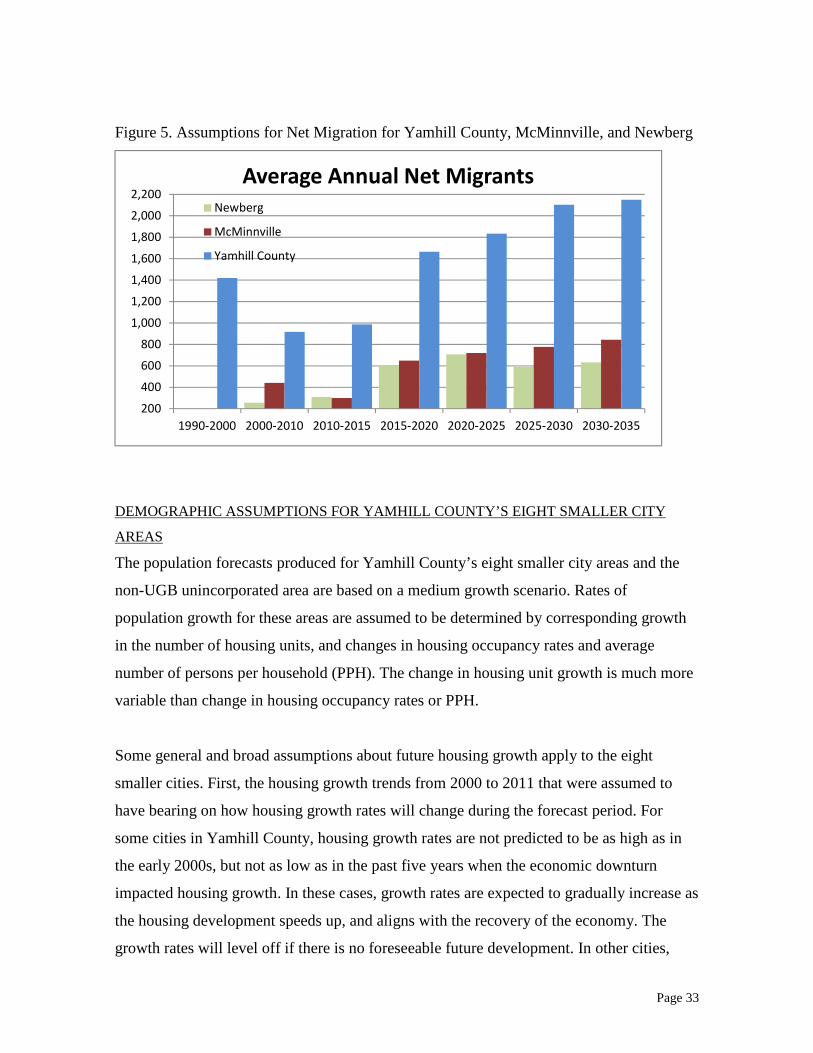
migration. Given the recent recession and current fairly stagnant economy in the state and
the study area, population growth in Yamhill County is not expected to rebound greatly
during the 2012 to 2015 period. This slump is assumed to be followed by a bump in
growth in the next 5 to 10 years and then taper off in the long run. However, population
growth will continually remain positive in Yamhill County, McMinnville and Newberg
during the next twenty-four years and net migration will have more and more influence on
annual increases.
Migration will remain the major component of growth throughout the forecast period in all
three geographic areas. The majority of annual increases in the near term will be attributed
to net in-migration rather than natural increase. Moreover, by the end of the forecast
horizon, net in-migration will account for all of the increases in population and will be
needed to offset a natural decrease caused by the aging population in Yamhill County,
McMinnville, and Newberg. The net migration rates in Yamhill County and McMinnville
(the number of net migrants per 100 persons) is assumed to accelerate in the near term and
then stabilize after the year 2020. In Newberg, the rates will increase more sharply over the
next 10-15 years and then decline a bit. In all three areas, though, net migration rates at the
end of the forecast period will be higher than currently.
While no forecast can predict the exact timing of economic cycles, the population forecast
assumes that there will be both downturns and upswings as there have been in the past, and
that net migration will continue to be a strong factor in contributing to the County’s
population growth over the long run. Specifically, though, for Yamhill County and
Newberg, we assume that net migration rates will be higher during 2012-2015 than it was
during 2005-2010, but lower than in the 1990s and early 2000s. In McMinnville, our
assumption is that net migration rates during 2012-2015 will be closer to those experienced
during 2005-2010. We expect the economy to recover eventually, and net in-migration to
regain renewed vitality in all three areas after 2015. In the periods after 2015, levels of
annual net migrants to the County will exceed those experienced during the 1990s. Net in-
migration will accelerate some and will gain momentum until around 2030 when the
magnitude lessens a bit.
Page 33
Figure 5. Assumptions for Net Migration for Yamhill County, McMinnville, and Newberg
DEMOGRAPHIC ASSUMPTIONS FOR YAMHILL COUNTY’S EIGHT SMALLER CITY
AREAS
The population forecasts produced for Yamhill County’s eight smaller city areas and the
non-UGB unincorporated area are based on a medium growth scenario. Rates of
population growth for these areas are assumed to be determined by corresponding growth
in the number of housing units, and changes in housing occupancy rates and average
number of persons per household (PPH). The change in housing unit growth is much more
variable than change in housing occupancy rates or PPH.
Some general and broad assumptions about future housing growth apply to the eight
smaller cities. First, the housing growth trends from 2000 to 2011 that were assumed to
have bearing on how housing growth rates will change during the forecast period. For
some cities in Yamhill County, housing growth rates are not predicted to be as high as in
the early 2000s, but not as low as in the past five years when the economic downturn
impacted housing growth. In these cases, growth rates are expected to gradually increase as
the housing development speeds up, and aligns with the recovery of the economy. The
growth rates will level off if there is no foreseeable future development. In other cities,
200
400
600
800
1,000
1,200
1,400
1,600
1,800
2,000
2,200
1990-2000 2000-2010 2010-2015 2015-2020 2020-2025 2025-2030 2030-2035
Average Annual Net Migrants
Newberg
McMinnville
Yamhill County

Page 34
where events or circumstances that may have limited the housing development in the past,
special consideration was given to adjust the growth rates up because the past trend would
not be an appropriate scenario for future growth. Our second assumption is that generally
for all city areas, as the availability of buildable lands approaches capacity, housing growth
rates tend to decelerate. If boundaries expand, and additional housing growth can be
accommodated, then rates rebound. Our study is not a land capacity study, but changing
growth rates can be partially attributed to a shrinking amount of available buildable land
over time. Third, the expected future changes in the County have at least some influence
on what is predicted to occur in the cities. However, individual or specific situations
unique to each city, such as planned development or transportation plans, would have
greater influence on the cities’ population forecasts than on the expected countywide
trends.
Making assumptions about housing occupancy and PPH is also necessary when forecasting
household population by the housing unit method. In the eight smaller cities, housing
occupancy rates are not assumed to change drastically during the forecast period. The
occupancy rates for all cities are predicted to either remain fairly stable or undergo only
slight changes.
The PPH is not assumed to change substantially throughout the forecast period, but is
expected to decline slightly and gradually. Some of the explanation for a general decline in
PPH can be attributed to smaller household size associated with an aging population and a
growing share of multi-family housing residences, which tend to house fewer persons per
housing unit than in single family residences. These patterns that contribute to a smaller
household size can be observed in Yamhill County and its sub-areas as younger members
of the households move away for education or for work, or when the elderly members age
in place. In cities where the Hispanic share of population is high or is increasing
significantly, such as Amity, Dayton, Lafayette, McMinnville, and Sheridan, the PPH is
anticipated to undergo less decline than in other areas. The higher PPH and higher fertility
associated with the Hispanic ethnic group helps to offset the smaller PPH of the elderly
population and multi-family housing.
Page 35
The number of persons residing in group quarters is a component of population that is
added to the number of persons residing in households to arrive at the total population. In
our forecasts produced by the housing unit method, the number of persons residing in
group quarters facilities is assumed to remain fairly stable during the forecast period except
where there are known plans for development of group quarters facilities (such as the
potential Federal Correction facility expansion in Sheridan). Since 2000, there has not been
much change overall in group quarters population and its share to the County’s population.
This situation is expected to remain about the same throughout the forecast period.
The assumptions regarding future housing growth that were used to develop the forecasts
for the individual city areas other than McMinnville and Newberg are summarized below.
For additional supporting information, considerations, and assumed rates for each of the
forecasts see Appendices 4 and 5.
Amity: Housing growth rates are assumed to increase slightly and gradually in the next 10
years as the economy recovers and growth stabilizes from 2025-2035. This is due to some
availability of buildable land, but limited long term development plans. Housing
occupancy rates will experience slight fluctuations over time, and PPH remains one of the
highest in the County with a slight decline over the forecast period.
Carlton: Housing growth rates are assumed to increase in the next 10 years as the economy
recovers and previously planned and approved housing construction resumes. Housing
growth is anticipated to peak in 2025 and housing growth rates will remain steady towards
the end of the forecast period, accounting for expanded infrastructure and planned housing
development. Housing occupancy rate will experience slight fluctuations over time, and
PPH is relatively stable with a gradual and slight decrease.
Dayton: Housing growth rates are assumed to increase in the next 10 years as the
economy recovers and as previously planned and approved housing resume construction.
The housing growth rates are expected to remain stable from 2025 to 2035, partly due to
potential development associated with the completion of the Newberg-Dundee By-pass

Page 36
project, since Dayton is located at the end of the transportation project. Housing occupancy
rates will experience slight fluctuations over time, and PPH remains one of the highest in
the County with only a slight decline over the forecast period. High Hispanic population
partially offsets some of the impact from decreasing household size due to aging
population and changes in housing types.
Dundee: Dundee is expected to have steady housing growth during the forecast period
with the pace of growth picking up fully by around 2020. Planned future housing from the
Riverside District Master plan and potential growth associated with the completion of the
Newberg Dundee By-pass project will be the main driving force for growth during the
forecast period. The occupancy rates and PPH are forecast to have little change.
Lafayette: Housing growth rates are assumed to increase slightly and gradually in the next
10 years as the economy recovers. Housing growth rates will stabilize from 2020-2035.
Growth is expected to continue due to completion of previously platted subdivision and
some availability of buildable land. There is also some potential growth associated with the
completion of the Newberg-Dundee By-pass project expected since Lafayette is located
toward the end of the transportation project. Housing occupancy rates and PPH are
assumed to remain stable throughout the forecast period.
Sheridan: Few subdivisions are expected and housing growth is expected to be limited over
the forecast period but there is some availability of buildable land. Overall, some
population growth is anticipated from both housing growth and potential expansion of the
group quarters facility. There may be some additional jobs created from the new group
quarters facility expansion, and the metal fabrication industry will increase the demand for
new housing. The occupancy rates and PPH are forecast to have little change.
Willamina: Housing and population growth is assumed to increase in Willamina over the
forecast horizon due to the existence of platted residential tax lots ready for development.
Population growth rates are anticipated to increase more rapidly over the nearer term and
then become less pronounced toward the end of the forecast period. The majority of

Page 37
housing and population growth is expected to occur in the Yamhill County portion of the
city. The occupancy rates and PPH are forecast to have little change over the forecast
period.
Yamhill: Planned housing development will increase population and housing growth rates
in the short run, however, the growth is forecast to slow slightly after 2030 due to limited
future planned development. The occupancy rates and PPH are forecast to have little
change over the forecast period.
Non-UGB Unincorporated Area: As cities grow, the amount of population and housing
growth in the unincorporated area will be limited. We assume that the rural to urban shift
of population seen in Yamhill County, Oregon and nationwide will continue. Also, any
small increases to the housing base will cause little addition of persons due to the aging
population and smaller PPH. Occupancy rates are assumed to remain stable throughout the
forecast period, which historically are slightly lower than in the county overall.

Page 38
POPULATION FORECASTS FOR YAMHILL COUNTY AND ITS SUB -AREAS
In our population growth scenario, one which will extend into the future similar
demographic trends as those recently seen in Yamhill County, countywide population and
populations in all of its cities and unincorporated area are expected to increase from 2011
to 2035. Average annual growth rates for most cities will be lower in the beginning of the
forecast period than at the end. Average annual rates will rise after 2015, and continue for
around a decade, then decline a bit before 2035. Yamhill County will undergo an increase
of almost 43,000 persons from 99,851 in 2011 and population will reach almost 142,830
by 2035.
Most of the countywide population growth will occur in McMinnville and Newberg. These
city areas will account for just under 77 percent of the population increase in Yamhill
County during 2011-2035. The average annual growth rate for each of these cities over the
forecast period is predicted to be around 2 percent and their shares of County population
increases continuously, though slightly.
Yamhill County’s eight smaller cities will experience population increases so that by 2035,
the sum of their populations will capture around 22 percent of the countywide population,
almost the same as in 2011. The number of persons added to these smaller cities combined
is predicted to be 9,217 during the forecast period, with an average rate of increase of 1.5
percent per year.
Population in the non-UGB unincorporated area of the County is foreseen to not
experience much change in population size. From 2011 to 2035, fewer than 1,000
additional persons are expected to reside in the unincorporated area. The share of county
population however, is presumed to steadily decline from 22 percent at the beginning of
the 24-year forecast period to 16 percent at the end.

Page 39
Figure 6 below shows historical and forecast populations for Yamhill County, each of the
combined city areas, and the non-UGB unincorporated area. Figure 7 displays the County
share of the historical and forecast population captured by each area.
Figure 6. Historical and Forecast Populations for Cities Combined and for Yamhill
County
Figure 7. Historical and Forecast Shares of Population, Larger Cities, Smaller Cities, and Unincorporated Area
0
20,000
40,000
60,000
80,000
100,000
120,000
140,000
160,000
2000 2010 2011 2015 2020 2025 2030 2035
Historical and Forecast Population
Yamhill County
McMInnville and Newberg
Eight Smaller Cities
Unincorporated Area
0%
10%
20%
30%
40%
50%
60%
70%
80%
90%
100%
2000 2010 2011 2015 2020 2025 2030 2035
Historical and Forecast
Share of County Population
Unincorporated Area
Eight Smaller Cities
McMinnville and Newberg
Page 40
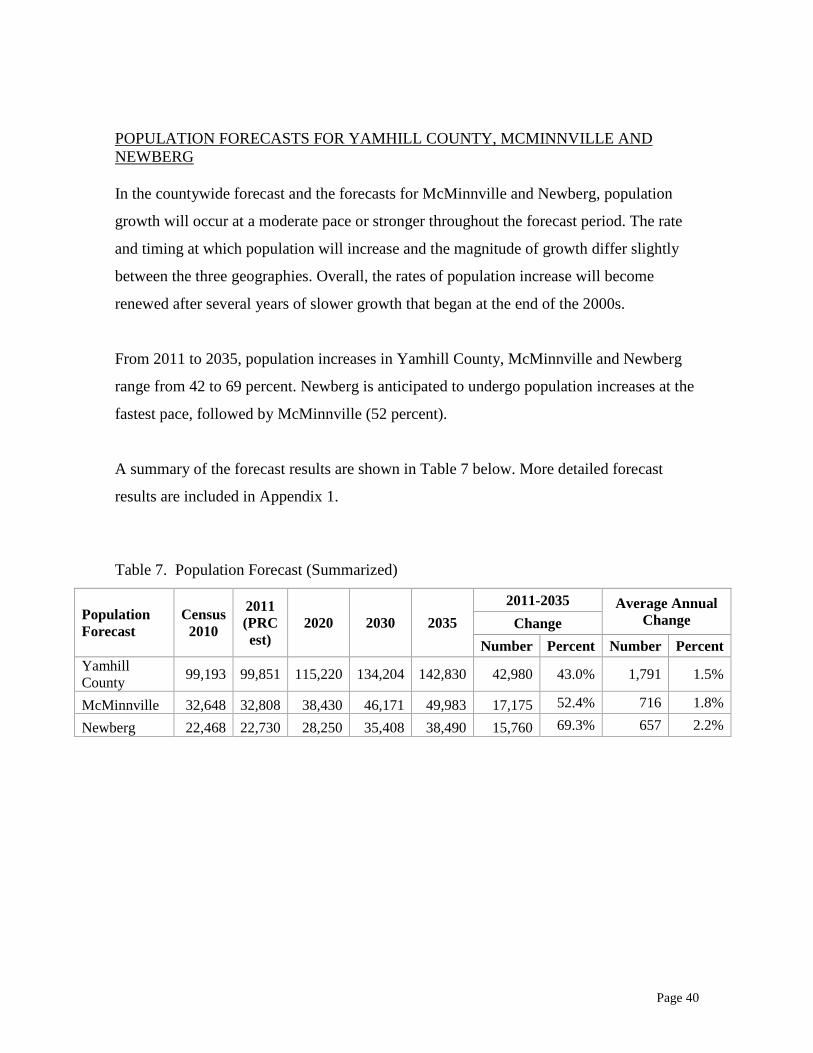
POPULATION FORECASTS FOR YAMHILL COUNTY, MCMINNVILLE AND NEWBERG In the countywide forecast and the forecasts for McMinnville and Newberg, population
growth will occur at a moderate pace or stronger throughout the forecast period. The rate
and timing at which population will increase and the magnitude of growth differ slightly
between the three geographies. Overall, the rates of population increase will become
renewed after several years of slower growth that began at the end of the 2000s.
From 2011 to 2035, population increases in Yamhill County, McMinnville and Newberg
range from 42 to 69 percent. Newberg is anticipated to undergo population increases at the
fastest pace, followed by McMinnville (52 percent).
A summary of the forecast results are shown in Table 7 below. More detailed forecast
results are included in Appendix 1.
Table 7. Population Forecast (Summarized)
Population Forecast
Census 2010
2011 (PRC est)
2020 2030 2035
2011-2035 Average Annual Change Change
Number Percent Number Percent Yamhill County
99,193 99,851 115,220 134,204 142,830 42,980 43.0% 1,791 1.5%
McMinnville 32,648 32,808 38,430 46,171 49,983 17,175 52.4% 716 1.8%
Newberg 22,468 22,730 28,250 35,408 38,490 15,760 69.3% 657 2.2%
Page 41
POPULATION FORECASTS FOR YAMHILL COUNTY’S EIGHT SMALLER CITY
AREAS AND THE NON-UGB UNINCORPORATED AREA
Based on our forecast, four of Yamhill County’s eight smaller city areas are expected to
experience population increases of over 1,000 persons from 2011 to 2035. They are:
Dayton, Dundee, Lafayette, and Sheridan. During the forecast period, Dundee and
Lafayette are forecast to increase their population by over 50 percent, which amounts to an
addition of an average of about 74 and 86 persons per year, respectively. Populations in
Amity, Carlton, Dayton, Sheridan, and Yamhill are forecast to increase by 25-50 percent
between 2011 and 2035, adding an average of 19, 36, 43, 101, and 15 persons per year,
respectively. Willamina will undergo much slower growth over the same period, with a
population increase of only 15 percent, and adding an average of 13 persons per year.
The unincorporated area (excluding all 10 cities and their corresponding UGB areas) in
Yamhill County is anticipated to experience an increase of almost 4 percent, or 828
persons, during the forecast period. At this rate, an average of 34 persons will be added
annually for the area. The population in the unincorporated area is expected to be 23,338
by 2035.
Table 10 below shows the population forecasts for Yamhill County’s eight smaller cities
beginning with population in 2010. For more detailed results of the smaller city areas and
non-UGB unincorporated area forecasts, see Appendix 2.

Page 42
Table 10. Population Forecasts for Yamhill County’s Smaller Cities and Unincorporated Area (Summarized)
Population Forecast
Census 2010
2011 (PRC est)
2020 2030 2035 2011-2035 Average Annual
Change Change Number Percent Number Percent
Amity 1,623 1,635 1,779 1,984 2,097 462 28.3% 19 1.0% Carlton 2,007 2,036 2,247 2,669 2,890 854 41.9% 36 1.5% Dayton 2,708 2,731 3,021 3,520 3,765 1,034 37.9% 43 1.3% Dundee 3,162 3,210 3,772 4,592 4,985 1,774 55.3% 74 1.8% Lafayette 3,742 3,745 4,394 5,349 5,797 2,053 54.8% 86 1.8% Sheridan 6,164 6,228 7,276 8,366 8,657 2,429 39.0% 101 1.4%
Willamina (Yamhill County portion only)
1,180 1,180 1,285 1,375 1,426 246 20.8% 10 0.8%
Willamina (full)
2,046 2,055 2,179 2,295 2,361 307 14.9% 13 0.6%
Yamhill 1,024 1,037 1,217 1,352 1,403 366 35.3% 15 1.3%
Unincorporated Yamhill County1
22,467 22,510 23,436 23,418 23,338 828 3.7% 34 0.2%
1The unincorporated figures exclude current city limits and UGBs as supplied by Yamhill County.

Page 43
METHODS AND DATA FOR POPULATION FORECASTS Consistent boundaries for the geographic parts of the study area (such as those for cities
and UGBs), which are those defined in 2011, were used to compile population, birth,
housing, and land use data. Historical and recent demographic statistics and rates were
calculated for these areas so that any boundary changes that occurred during the time span
covered in this study would not skew demographic trends.
Developing long-term population forecasts for the County and its sub-areas (its cities and
unincorporated area), requires these main stages: 1) compiling and evaluating historical
and recent data to ascertain demographic characteristics and trends in the study area and to
obtain a population base from which the forecasts may be launched; 2) making
assumptions about the future and adjusting the data or rates in the forecasting models
(calibrating the models) to incorporate predicted rates or trends; and 3) reconciling, or
controlling the sum of the sub-area forecasts to the countywide forecast.
We first develop population projections, then we make adjustments to the projections to
produce the forecasts. Population projections are developed by extending historical and
current demographic and housing trends into the future. Forecasting population requires
that assumptions be made about the future and adjusting the projection models to account
for circumstances that perhaps skewed past trends or that with near certainty will affect
future change. Such circumstances in the past could be a building moratorium or the
opening of a new group quarters facility. Events affecting future change would be, for
example, planned future housing development that is higher than usual, a foreseen change
in an area’s physical ability to accommodate growth (available buildable land is
approaching capacity, or improvements to infrastructure that are underway), anticipated
changes in the economy (the location of a new employer, the closing of an industry, or the
upswing or downturn of the economy in general), or an expected change in the local
population and household composition (age, ethnicity, average household size).

Page 44
Two different types of primary demographic models were utilized to develop the
population forecasts for Yamhill County and its sub-areas. For Yamhill County,
McMinnville and Newberg, cohort-component models were used. For each of eight
smaller city areas and the non-UGB unincorporated area, housing unit model models were
relied upon. The cohort-component model best predicts population over the long-term for
areas with larger populations. The housing unit model is better suited for smaller
populations and incorporates recent annual housing data that account for more variability
in population growth over the forecasting period. The forecasting models are described in
more detail below.
COHORT-COMPONENT MODEL
A demographic projection model called the cohort-component model was used to forecast
the population residing in Yamhill County and in its larger sub-areas. Separate cohort-
component models were developed for the County, McMinnville, and Newberg. These
forecasts are 2010-based projections. However, adjustments were made to the model to
incorporate into the forecasts the 2011 PRC certified population estimates and capture
information from the most recent data available.
The cohort-component model predicts future populations as outcomes of the life events
that occur over time. These events are comprised of births, deaths, and migrations. Thus,
an area’s population grows when births outnumber deaths and when more people move
into the area than leave it. These events occur more often in certain age groups, or cohorts,
than in others. For example, people tend to move around the most when they are in their
20s, and the elderly have lower chances than people in their 40s to survive over the next
five years. Applying appropriate age- and gender-specific rates of birth, death and
migration to the existing population cohorts of the County produce its future population.
The cohort-component method of forecasting population depends on the availability of
accurate data on the age and gender composition of an area’s population. The most precise
information about population age structure in an area is usually provided by the most
recent U.S. Census of Population. Rates of life events are applied to the known population
Page 45
cohorts and are usually derived from data such as those provided by the U.S. Census and
the Oregon Center for Health Statistics. These rates are then modified to account for the
most recent trends as well as for future ones. Examples of such trends that may affect the
future population of an area include the recent tendency among women of childbearing
ages to delay having their first child, or a predisposition of young men (ages 20 to 29) to be
more mobile than women in the same age cohort. A set of assumptions must be developed
to address likely changes in the initial rates of life events and are based on judgment about
how the trends might evolve in the study area. The existing population structure mostly
determines the future population composition of the area, but it may change slightly
depending on age-specific migration rates predicted for the future. Trends detected in
historical and recent data, such as housing, land use, employment, and school enrollment
data help to determine these future migration rates.
The population and housing data came from the 2000 and 2010 Censuses of Population
and Housing and from PRC’s 2001-2011 annual population estimates; additional housing
information and land use data were obtained from the Yamhill County GIS Department;
the Oregon Center for Health Statistics provided information on fertility and mortality; the
Oregon Department of Education furnished school enrollment data; and labor force and
employment data are from the Oregon Employment Department.
The 2000 and 2010 population and housing data from the Censuses were available at the
census-block level of geography by age group and gender. The census blocks were
allocated into jurisdictional boundaries, obtained from Yamhill County GIS and defined in
2011, using Geographic Information Systems (GIS). The 2000 population data were then
organized into five-year age cohorts, such as 0 to 4 years, 5 to 9 years, and so on. Each of
these cohorts was then “survived”, or aged into the next cohort to the year 2010.
“Surviving” the cohorts is accomplished by applying age- and sex-specific survival rates.
These rates represent the proportion of population in each younger cohort that would
survive during a given time period (such as the five years between 2000 and 2005) to
become the next older cohort. This process is repeated for each five-year age group and
five-year time interval between 2010 and 2035. Forecasting a known population (the 2010
Page 46
Census population) and its age distribution enables appropriate adjustments to be made to
the model so that the forecasted population becomes aligned with the actual population and
ensures the accuracy of the model’s projections.
During each five-year interval, a certain number of live births occur to the women in
childbearing ages. To calculate the number of newly born residents of the County and its
larger sub-areas, age-specific fertility rates were applied to the numbers of women in
childbearing cohorts (under age 20, 20 to 24, and so on up to 45-49 years). Fertility rates
indicate how many children women in a given age group are likely to give birth to during
each five-year period. Once born, children become subject to survival rates and are
“moved”, or “aged”, through the system like all the other cohorts.
The most difficult part of forecasting population is to estimate the in- and out-migration of
an area. Since little reliable data are available to study in- and out-migration, it’s best to
use net migration rates, which is the balance between in- and out-migration. Net migration
can be calculated if the population is known at the beginning and the end of a previous
time period, as well as the number of births and deaths that occurred during the same time.
Net migration is positive when more people move into the area than leave it; it is negative
if the opposite is true. Net migration rates used in the cohort-component model can be
interpreted as the number of people who are added to (or subtracted from) a given cohort
due to migration over a given period of time (in this case, five years) per each 100 persons.
The initial net migration rates for the cohort-component model were derived from the 2000
and 2010 population cohorts for the census blocks that are located within the County and
larger jurisdictional boundaries (as defined in 2011), as well as from births and deaths that
occurred in the same area during 2000-2010. The rates were adjusted so that the “forecast”
population for the year 2010 from Census 2000 fit the actual population obtained from the
2010 Census. The net migration rates used to forecast the population in the County and in
its larger sub-areas from 2010 to 2035 were further modified to reflect the most likely
future migration patterns. Demographic trends identified in post-2000 data from PRC’s
annual population estimates had some bearing on the adjustments made to the model in the
initial, 2000-2010, forecast period. In addition, migration patterns are greatly influenced by

Page 47
the local economy and by housing growth in the area, both current and assumed. When
making the final adjustments to the net migration rates, consideration also was given to
plans for future development in the region.
The development of the forecasts of population residing in McMinnville and Newberg
utilized the same methodology as the countywide forecasting described in the preceding
section. A unique set of demographic data was used for each of the cities, and trends
specific to each of them were considered when making adjustments to their cohort
component models.
HOUSING UNIT METHOD AND MODEL
A Housing Unit model was created to prepare the forecasts for each of eight smaller city
areas in Yamhill County and for the non-UGB unincorporated area. This method requires
that a current housing inventory for each area be compiled and that past and recent rates of
change in each inventory be known. Additional housing and population data needed as the
components of the housing unit model besides housing units are occupancy rates, the
average number of persons per household (PPH), and group quarters population. In this
method, the number of housing units in an area is first projected or forecast, and then
assumptions about housing occupancy and average household size are made to forecast
household population. Persons residing in group quarters, (such as in college dormitories,
prisons, and nursing homes) are also projected and then added to the household population
to obtain the total population forecast. An area’s total population is calculated in the
housing unit method by multiplying the number of forecasted housing units by the
assumed occupancy rate and PPH, and then adding to that product, the group quarters
population. This process is carried out for five-year intervals throughout the forecast
period.
Data used in the housing unit models are from the 2000 and 2010 Census of Population
and Housing, and from recent and historical building permit and taxlot data that were
obtained from the Census Bureau and the Yamhill County GIS Department. Other housing
data and group quarters population data were collected from the local jurisdictions
Page 48
themselves by PRC’s Population Estimates Program (we send a housing and population
questionnaire to Oregon’s cities and counties and request that they complete and return the
form to us each year). In a few cases, data were not available from cities. In this situation,
adjustments were made to account for recent changes estimated to have occurred in the
city’s housing unit inventory detected from the countywide land use data obtained from
Yamhill County.
Population and housing data from 2000 and 2010 Censuses were compiled for each
geographic part in the study area. An allocation of data was made to the 2011 jurisdictional
boundaries using the same GIS methods as described previously in the cohort-component
model section. Housing inventories were created from the 2000 and 2010 Census data. The
inventories were updated to 2011 with the recent housing data from Yamhill County and
PRC. Housing growth trends were analyzed and gleaned from the Census data, the tax lot
data, and PRC’s housing data.
The number of housing units is projected based on past housing growth trends. Housing
growth rates were calculated using the housing inventories and the amount of annual or
periodic change they experienced. The housing trends were extrapolated into the future and
applied to the 2011 housing inventory to predict the numbers of housing units in the future.
Adjustments were made to the models to accelerate or curb growth based on current
conditions compared to the past, or plans for future change. For example, in the case of the
city of Dayton, the low annual growth rates observed in recent years (2000-2011) were
adjusted up a bit to account for plans for potential housing development in the future,
although details are not known at this time. Based on information provided by staff from
each individual city, consideration was given to account for plans for housing
development, as well as for the readiness of infrastructure to accommodate housing
increases, and the inclination of the city to promote growth. (See Appendix 4 for
consideration given to individual cities and the unincorporated area for adjusting the
forecast models).
Page 49
Specific adjustments were made to the model to account for known planned future
housing. The numbers of housing units scheduled to be constructed and completed during
the forecast period were accounted for in the model by factoring in planned housing units
in the 5-year time period that construction is planned to be completed.
Census data from 2000 and 2010 were also used to calculate average household sizes
(PPH) and housing occupancy rates. Data from the Census Bureau’s American Community
Survey (ACS) are available as an additional data source for checking for reasonableness
and variability by housing type. ACS data for less populous areas such as the eight smaller
cities in Yamhill County are multi-year 5-year average data, for 2006-2010.
Occupancy rates for the County’s sub-areas were predicted for 2012-2035 based on the
most recent Census data (2010), and adjusted according to past occupancy trends detected
from the 2000 and 2010 data and investigation of the housing market conditions. In
addition, population and housing composition, and the rural or urban classification of cities
were considered to predict changes the occupancy rates will undergo in the future. Minor
adjustments were made to the occupancy rates for some cities based on a relationship to
the predicted County rates.
The 2011 PPHs were estimated based on past trends in the 2000 and 2010 data. The 2011
PPHs were assumed for the future using the rationale that the increase of the Hispanic
population, aging populations, and smaller household size in areas with more multiple
family housing units would lead to a slight gradual decline or balanced PPH (the PPH for
Hispanics is higher than the average, the PPH for persons ages 65 years and older is lower,
and the PPH for multiple family residences is lower than single family units). However,
after reconciliation of the sum of the sub-area forecasts to equal the County forecast
(discussed later on page 51), the PPHs were slightly adjusted to exactly coincide with the
final forecasted populations and households.
Demographic factors that influence the PPH include age and racial composition of
population, fertility rates, and changes in school enrollment. Additional data that are recent

Page 50
and available for the sub-county areas, such as the number of annual births and school
enrollments, along with historical trends, are used to help predict future PPH.
The number of persons residing in group quarters is a component of population that is
added to the number of persons residing in households to arrive at the total population.
After the population residing in housing units was forecasted for each city and for the
unincorporated area, the group quarters population was projected for the same areas. The
prediction of future group quarters populations was based on historic and recent trends of
the share of the total population that reside in group quarters facilities in each sub-area and
planned future group quarters developments (in actuality, the group quarters population
does not significantly change much unless a facility closes or a new one is built). The
projected group quarters populations were then added to the forecasted housing unit
populations to obtain total population forecasts.
BIRTH DATA
Births for each year from 2000 to 2011 were assigned to current city area boundaries using
individual birth records obtained through a confidential data sharing agreement with the
Oregon Center for Health Statistics. Birth data for earlier years were obtained from
published data for Yamhill County. Annual births from 2012 to 2035 were forecast as part
of the cohort-component model by applying the fertility rates described earlier in the
discussion of the cohort-component model to the forecast female population by age group.
RECONCILIATION OF THE FORECASTS
For our study, we developed separate population forecasts for each of the County’s sub-
areas. For consistency, the sum of the parts must equal the whole, which means here that
the sum of the individual forecasts of the County’s sub-areas should add to the County-
level forecast. The countywide forecast served as the control total to which the sum of the
individual forecasts for the cities and the unincorporated area were reconciled. Some minor
adjustments were made to the sub-area forecasts so that when added together, the result is
the same as the forecast for the County.

Page 51
The adjustments were made to the sub-area forecasts using control factors that were
calculated based on the relationship between the control total and the sum of the parts. The
actual difference between the control forecast and the sum of the forecasts for the parts was
proportionately distributed to each of the individual sub-area forecasts by multiplying each
individual sub-area forecast by the control factor.
Please note that in some instances, fluctuations in the forecast growth rates are at least
partially attributed to the reconciliation of the sum of the sub-areas to the County, or the
control process.
SUPPORTING DATA AND PROJECTIONS PRODUCED FROM OTHER
DEMOGRAPHIC MODELS
In addition to evaluating demographic trends detected from the data used in our forecasting
models, we reviewed other data and information to obtain a better understanding of the
dynamics of population change specific to the study areas. This supporting information
helps us to make better, or more realistic, assumptions about future population growth and
helps us to use better judgment when making adjustments to our demographic models.
Most of the supporting data and information were available either at the County level of
geography, or for other large geographic areas. Still, the information is valuable for
forecasting the County and sub-area populations. The sources include labor force data and
economic profiles from the Oregon Employment Department, school enrollment data for
school districts in Yamhill County from the Oregon Department of Education, and
demographic and socioeconomic data from the 2006-2010 ACS. Also, preliminary revised
population projections for 2010 to 2040 from the Oregon Office of Economic Analysis
(OEA), and employment projections from the Oregon Employment Department were used
to gauge our countywide results and for comparison.
Also, to help make our forecasts more accurate, we developed additional sets of population
projections from demographic models other than the primary models employed in this
study. Secondary sets of projections were produced to serve as an evaluation tool to verify
that the numbers forecast from the primary models are reasonable. The additional

Page 52
projections were used to detect and evaluate, and adjust if necessary, any inconsistencies
that those primary forecasts may have had.
Population trends models were developed for each of Yamhill County’s cities. These
models are used for projecting total population size for County sub-areas. They provide
projections, by five years intervals, from 2010 to 2035.
One population trends model is based on a ratio method. The basic idea of the ratio method
is that local city populations are under the same influences of change as the surrounding
county population. In particular, we assume here that the influences of population change
(fertility, mortality, and migration) are similar in Yamhill County’s cities and
unincorporated area, and that there is a link between population changes in Yamhill
County and those in its cities and unincorporated area. In this model, we note that the
proportion of Yamhill County's population that resides in each of the 10 cities has changed
over time, however slight that may be.
For the County projection in this population trends model, we relied on a preliminary
revised 2010-2040 population forecast for Yamhill County prepared by Oregon’s Office of
Economic Analysis (OEA). OEA's forecast assumes that annual population growth rate for
the county increases from its recent level of about 1.5 percent (for the 2000-2010 period) to
reach 1.8 percent during 2010-2015, and then to continually diminish back down to 1.4
percent by 2035. The pattern of change seen in OEA’s preliminary revised forecast is
similar to the forecast produced by our countywide cohort-component model.
Another population trends model projects future populations based on historical average
annual change in each individual city. We trended populations from 1970 to 2010 for each
city in our study to arrive at 2015-2035 populations.
We developed a simple economic model to produce an additional population forecast for
Yamhill County. The model projects net-migration based on an assumed relationship
between population change and economic patterns. We used employment projections for

Page 53
Yamhill County (Oregon Economic Region 3) developed by the Oregon Employment
Department as a basis for building our economic model. However, the future number of
jobs, or number of workers, is available for only part of our forecast period. The
employment projections are prepared for one ten-year period, 2010-2020, but they were
still useful to compare to our forecasts for 2015 and 2020, and to determine if the two sets
of projections are within a reasonable range of one another.
The employment projections provide a predicted demand for workers to fill future jobs.
The forecast from our cohort-component model provides the supply of workers available
to fill those jobs. We compare the difference between the projected additional number of
workers (the projected number of jobs from the employment projections) and the forecast
number of persons ages 15-64 in the cohort-component model to see if they are in a
reasonable range.
Additional housing unit models were developed for all geographic sub-areas in this study,
not only for the smaller city areas and non-UGB unincorporated area. For areas where a
cohort-component model was created to produce its population forecast, the forecast
results generated from the two models were checked and compared.
GENERAL COMMENTS ABOUT POPULATION FORECASTS
The longer the time-span of the forecast, the more likely it is that conditions change, and
thus the uncertainty in rates and assumptions increase. It is crucial to have recent data that
allows testing, or calibrating, the assumptions used in the forecasting models. The study
area’s historical population helps to calibrate and adjust original migration rates and
growth rates in the forecast models so that a better fit between actual and predicted number
of persons can be achieved. In the long-run, however, the local economy and conditions
affecting populations are likely to change in ways not currently anticipated.
All population forecasts are based on a combination of a beginning population; various
known, estimated, and predicted rates; and the forecasters’ judgment about future trends.
The forecasts may err through imprecise data or unexpected shifts in demographic trends.

Page 54
Generally, forecasts for larger geographical areas, such as the entire county are more
reliable than those for small areas, such as for a small city with fewer than one or two
thousand persons. These forecasts may be used as a guide to population growth over the
next few years. However, changes in local areas will surely affect populations in some
cities and actual populations will deviate from those shown here. The differences between
the forecast and actual populations will vary in magnitude and perhaps direction at some
points during the forecast period.
The historical, recent, and predicted demographic rates and other statistics affecting
population change in our study area (Yamhill County and each of its geographic sub-areas)
are summarized and shown in Appendix 5. Also included in these summary tables are the
population forecasts so that they may be viewed alongside their supporting information.
In the forecast tables accompanying this report, the original calculations for the population
forecasts use decimal fractions. Because the fractions are rounded to show whole
numbers, the numbers may not add exactly to the totals.

Page 55
APPENDIX 1
Detailed Population Forecasts for
Yamhill County, McMinnville and Newberg
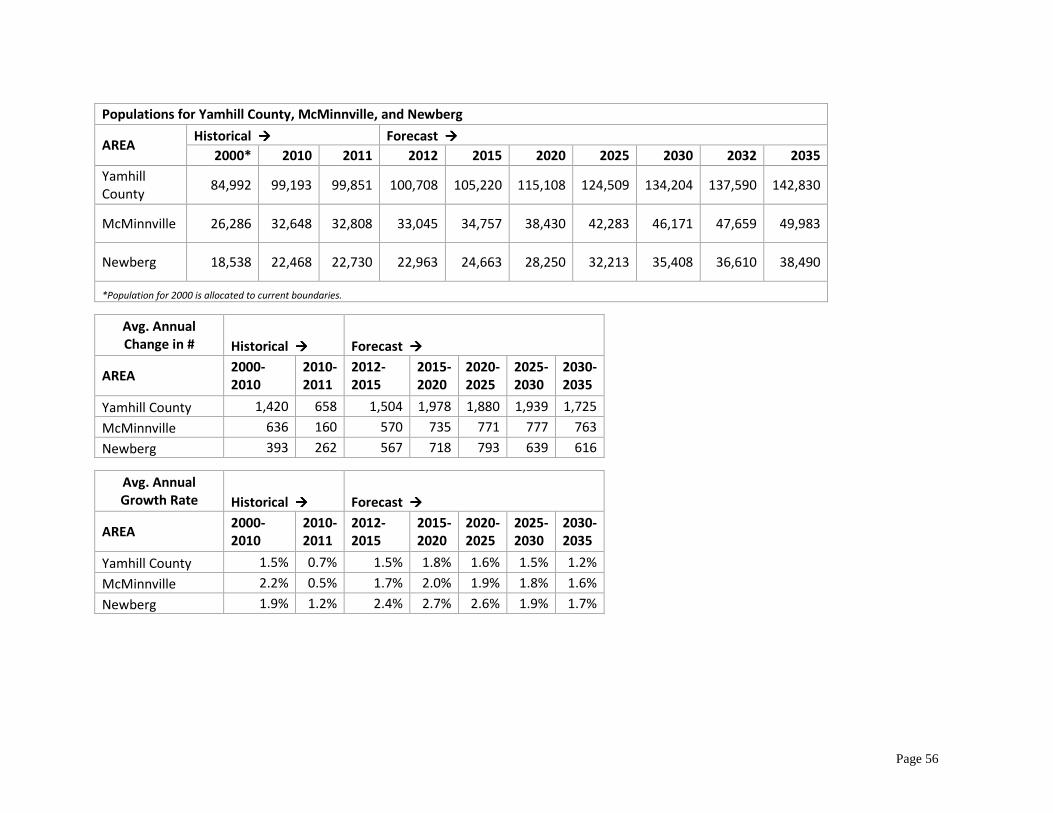
Page 56
Populations for Yamhill County, McMinnville, and Newberg
AREA Historical ���� Forecast ����
2000* 2010 2011 2012 2015 2020 2025 2030 2032 2035
Yamhill
County 84,992 99,193 99,851 100,708 105,220 115,108 124,509 134,204 137,590 142,830
McMinnville 26,286 32,648 32,808 33,045 34,757 38,430 42,283 46,171 47,659 49,983
Newberg 18,538 22,468 22,730 22,963 24,663 28,250 32,213 35,408 36,610 38,490
*Population for 2000 is allocated to current boundaries.
Avg. Annual
Change in # Historical ���� Forecast ����
AREA 2000-
2010
2010-
2011
2012-
2015
2015-
2020
2020-
2025
2025-
2030
2030-
2035
Yamhill County 1,420 658 1,504 1,978 1,880 1,939 1,725
McMinnville 636 160 570 735 771 777 763
Newberg 393 262 567 718 793 639 616
Avg. Annual
Growth Rate Historical ���� Forecast ����
AREA 2000-
2010
2010-
2011
2012-
2015
2015-
2020
2020-
2025
2025-
2030
2030-
2035
Yamhill County 1.5% 0.7% 1.5% 1.8% 1.6% 1.5% 1.2%
McMinnville 2.2% 0.5% 1.7% 2.0% 1.9% 1.8% 1.6%
Newberg 1.9% 1.2% 2.4% 2.7% 2.6% 1.9% 1.7%

Page 57
APPENDIX 2
Detailed Population Forecasts for
Yamhill County’s Eight Smaller City Areas and Non-UGB Unincorporated Area

Page 58
Populations for Yamhill County, its Cities, and Unincorporated Area
AREA Historical ���� Forecast ����
2000* 2010 2011 2012 2015 2020 2025 2030 2032 2035
Amity 1,481 1,623 1,635 1,650 1,719 1,779 1,879 1,984 2,026 2,097
Carlton 1,514 2,007 2,036 2,065 2,080 2,247 2,465 2,669 2,757 2,890
Dayton 2,244 2,708 2,731 2,762 2,835 3,021 3,266 3,520 3,625 3,765
Dundee 2,642 3,162 3,210 3,259 3,437 3,772 4,185 4,592 4,764 4,985
Lafayette 2,586 3,742 3,745 3,802 4,018 4,394 4,874 5,349 5,552 5,797
Sheridan 5,581 6,164 6,228 6,296 6,417 7,276 7,573 8,366 8,488 8,657
Willamina (Yamhill
County portion
only)
1,128 1,180 1,180 1,182 1,223 1,285 1,336 1,375 1,395 1,426
Willamina (full) 1,859 2,046 2,055 2,063 2,112 2,179 2,243 2,295 2,321 2,361
Yamhill 805 1,024 1,037 1,050 1,150 1,217 1,285 1,352 1,377 1,403
Unincorporated
Yamhill County2
22,187 22,467 22,510 22,630 22,919 23,436 23,150 23,418 23,336 23,338
*Population for 2000 is allocated to current boundaries.
1Populations are allocated by Census block and include urban growth boundaries (UGBs) where applicable; current boundaries supplied by Yamhill County are used in the
calculations.
2The unincorporated figures exclude current city limits and UGBs as supplied by Yamhill County.
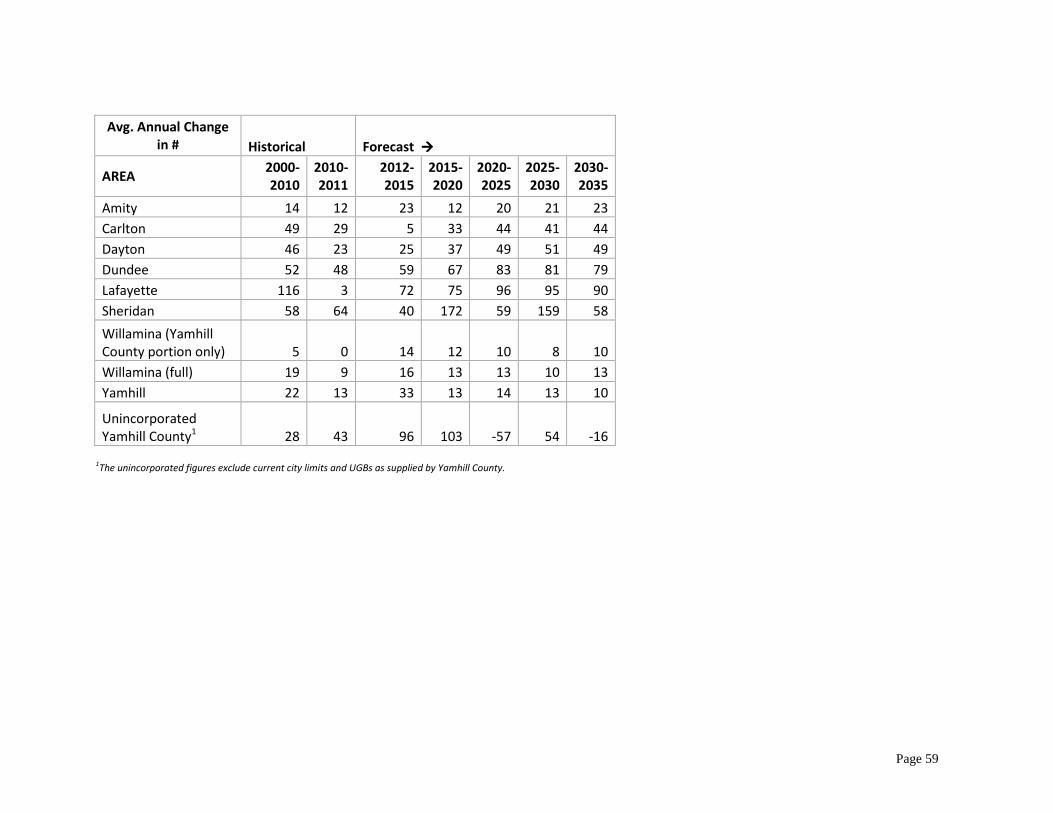
Page 59
Avg. Annual Change
in # Historical Forecast ����
AREA 2000-
2010
2010-
2011
2012-
2015
2015-
2020
2020-
2025
2025-
2030
2030-
2035
Amity 14 12 23 12 20 21 23
Carlton 49 29 5 33 44 41 44
Dayton 46 23 25 37 49 51 49
Dundee 52 48 59 67 83 81 79
Lafayette 116 3 72 75 96 95 90
Sheridan 58 64 40 172 59 159 58
Willamina (Yamhill
County portion only) 5 0 14 12 10 8 10
Willamina (full) 19 9 16 13 13 10 13
Yamhill 22 13 33 13 14 13 10
Unincorporated
Yamhill County1 28 43 96 103 -57 54 -16
1The unincorporated figures exclude current city limits and UGBs as supplied by Yamhill County.
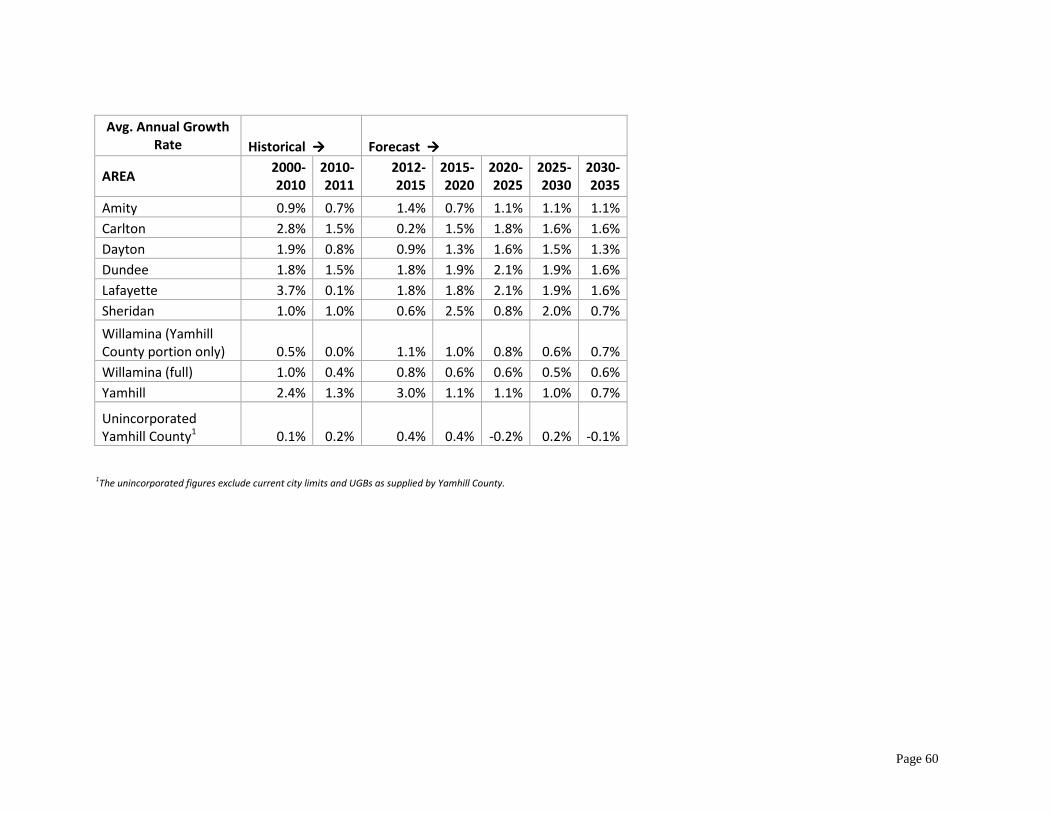
Page 60
Avg. Annual Growth
Rate Historical ���� Forecast ����
AREA 2000-
2010
2010-
2011
2012-
2015
2015-
2020
2020-
2025
2025-
2030
2030-
2035
Amity 0.9% 0.7% 1.4% 0.7% 1.1% 1.1% 1.1%
Carlton 2.8% 1.5% 0.2% 1.5% 1.8% 1.6% 1.6%
Dayton 1.9% 0.8% 0.9% 1.3% 1.6% 1.5% 1.3%
Dundee 1.8% 1.5% 1.8% 1.9% 2.1% 1.9% 1.6%
Lafayette 3.7% 0.1% 1.8% 1.8% 2.1% 1.9% 1.6%
Sheridan 1.0% 1.0% 0.6% 2.5% 0.8% 2.0% 0.7%
Willamina (Yamhill
County portion only) 0.5% 0.0% 1.1% 1.0% 0.8% 0.6% 0.7%
Willamina (full) 1.0% 0.4% 0.8% 0.6% 0.6% 0.5% 0.6%
Yamhill 2.4% 1.3% 3.0% 1.1% 1.1% 1.0% 0.7%
Unincorporated
Yamhill County1 0.1% 0.2% 0.4% 0.4% -0.2% 0.2% -0.1%
1The unincorporated figures exclude current city limits and UGBs as supplied by Yamhill County.

Page 61
APPENDIX 3
Demographic Assumptions for
Yamhill County, the Cities of McMinnville and Newberg

Page 62
Survival Rates, Oregon
Female
Age 1990 1995 2000 2005 2010 2015 2020 2025 2030 2035 0 0.99898 0.99902 0.99906 0.99911 0.99915 0.99916 0.99916 0.99916 0.99916 0.99916 5 0.99940 0.99942 0.99943 0.99945 0.99947 0.99947 0.99947 0.99947 0.99947 0.99947
10 0.99851 0.99862 0.99874 0.99885 0.99897 0.99899 0.99899 0.99899 0.99899 0.99899 15 0.99793 0.99797 0.99801 0.99806 0.99810 0.99811 0.99811 0.99811 0.99811 0.99811
20 0.99788 0.99785 0.99783 0.99780 0.99777 0.99776 0.99776 0.99776 0.99776 0.99776
25 0.99709 0.99726 0.99743 0.99760 0.99777 0.99780 0.99780 0.99780 0.99780 0.99780
30 0.99617 0.99623 0.99629 0.99636 0.99642 0.99643 0.99643 0.99643 0.99643 0.99643
35 0.99500 0.99475 0.99450 0.99426 0.99401 0.99396 0.99396 0.99396 0.99396 0.99396
40 0.99242 0.99187 0.99132 0.99078 0.99023 0.99012 0.99012 0.99012 0.99012 0.99012
45 0.98720 0.98667 0.98613 0.98560 0.98507 0.98496 0.98496 0.98496 0.98496 0.98496
50 0.97781 0.97805 0.97829 0.97854 0.97878 0.97883 0.97883 0.97883 0.97883 0.97883
55 0.96276 0.96417 0.96558 0.96699 0.96840 0.96868 0.96868 0.96868 0.96868 0.96868
60 0.94261 0.94486 0.94712 0.94939 0.95166 0.95211 0.95211 0.95211 0.95211 0.95211
65 0.91381 0.91633 0.91885 0.92138 0.92392 0.92443 0.92443 0.92443 0.92443 0.92443
70 0.86922 0.87241 0.87561 0.87882 0.88205 0.88270 0.88270 0.88270 0.88270 0.88270
75 0.79919 0.80055 0.80191 0.80327 0.80464 0.80491 0.80491 0.80491 0.80491 0.80491
80+ 0.55294 0.55494 0.55695 0.55896 0.56098 0.56138 0.56138 0.56138 0.56138 0.56138
Male
Age 1990 1995 2000 2005 2010 2015 2020 2025 2030 2035 0 0.99866 0.99871 0.99877 0.99882 0.99888 0.99889 0.99889 0.99889 0.99889 0.99889 5 0.99917 0.99919 0.99921 0.99924 0.99926 0.99926 0.99926 0.99926 0.99926 0.99926
10 0.99681 0.99721 0.99761 0.99801 0.99841 0.99849 0.99849 0.99849 0.99849 0.99849 15 0.99344 0.99391 0.99437 0.99484 0.99531 0.99540 0.99540 0.99540 0.99540 0.99540
20 0.99235 0.99285 0.99335 0.99386 0.99436 0.99446 0.99446 0.99446 0.99446 0.99446
25 0.98968 0.99071 0.99174 0.99278 0.99381 0.99402 0.99402 0.99402 0.99402 0.99402
30 0.98511 0.98717 0.98923 0.99129 0.99336 0.99377 0.99377 0.99377 0.99377 0.99377
35 0.98335 0.98489 0.98644 0.98799 0.98954 0.98985 0.98985 0.98985 0.98985 0.98985
40 0.98219 0.98259 0.98298 0.98338 0.98378 0.98386 0.98386 0.98386 0.98386 0.98386
45 0.97737 0.97684 0.97630 0.97577 0.97524 0.97513 0.97513 0.97513 0.97513 0.97513
50 0.96530 0.96509 0.96488 0.96468 0.96447 0.96443 0.96443 0.96443 0.96443 0.96443
55 0.94279 0.94455 0.94632 0.94809 0.94987 0.95022 0.95022 0.95022 0.95022 0.95022
60 0.91304 0.91682 0.92061 0.92442 0.92825 0.92902 0.92902 0.92902 0.92902 0.92902
65 0.87098 0.87655 0.88215 0.88779 0.89347 0.89461 0.89461 0.89461 0.89461 0.89461
70 0.79940 0.80839 0.81749 0.82669 0.83599 0.83786 0.83786 0.83786 0.83786 0.83786
75 0.69154 0.70434 0.71738 0.73066 0.74419 0.74692 0.74692 0.74692 0.74692 0.74692
80+ 0.46846 0.47840 0.48855 0.49892 0.50951 0.51165 0.51165 0.51165 0.51165 0.51165

Page 63
Historical and Forecast Total Fertility Rates Yamhill County, McMinnville and Newberg
Year
Yam
hill
Cou
nty
McM
innv
ille
New
berg
2000 (known) 2.12 2.09 1.85
2005 (estimated) 1.95 1.98 1.79
2010 (known) 1.82 1.84 1.79
2015 1.82 1.84 1.79
2020 1.82 1.84 1.77
2025 1.79 1.82 1.77
2030 1.79 1.82 1.76
2035 1.79 1.82 1.76

Page 64
Historical and Forecast Annual Net Migrants in Yamhill County, 1990-2035
Historical and Forecast Annual Net Migrants in McMinnville, 2000-2035
Historical and Forecast Annual Net Migrants in McMinnville, 2000-2035
0
500
1,000
1,500
2,000
2,500Yamhill County
0
200
400
600
800
1,000McMinnville
0
200
400
600
800Newberg

Page 65
APPENDIX 4
Information Considered When Developing Forecasts for
Yamhill County’s Sub-Areas
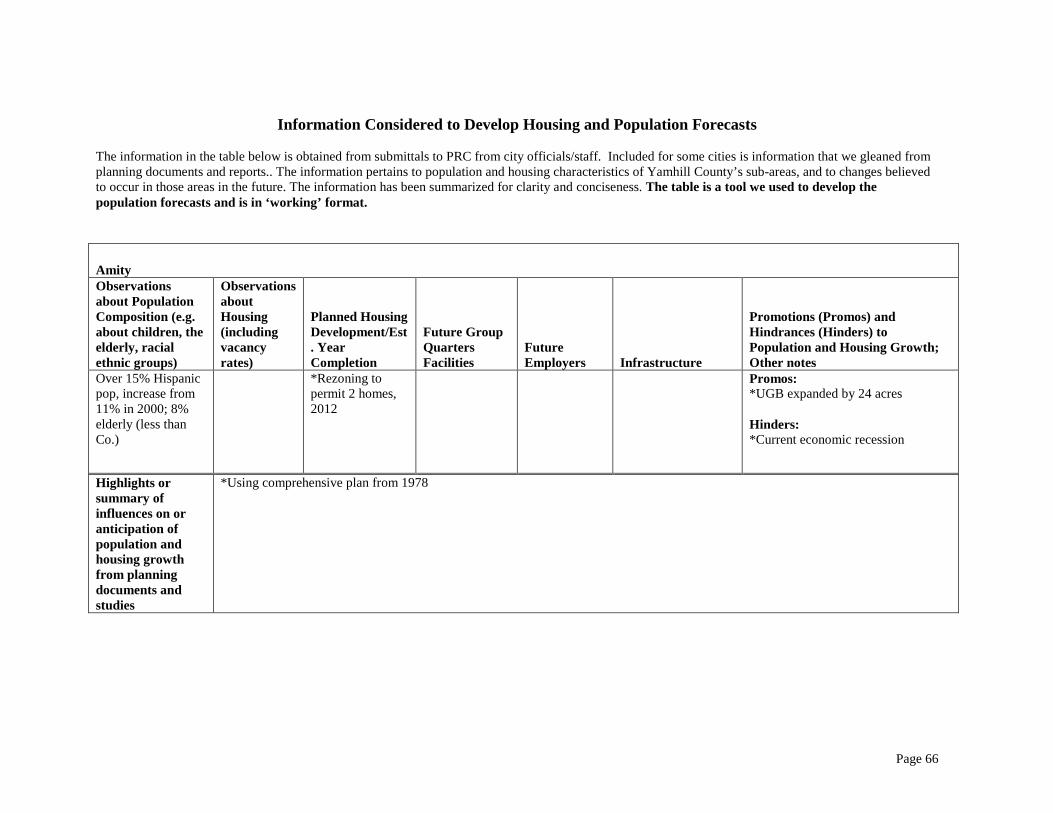
Page 66
Information Considered to Develop Housing and Population Forecasts The information in the table below is obtained from submittals to PRC from city officials/staff. Included for some cities is information that we gleaned from planning documents and reports.. The information pertains to population and housing characteristics of Yamhill County’s sub-areas, and to changes believed to occur in those areas in the future. The information has been summarized for clarity and conciseness. The table is a tool we used to develop the population forecasts and is in ‘working’ format.
Amity Observations about Population Composition (e.g. about children, the elderly, racial ethnic groups)
Observations about Housing (including vacancy rates)
Planned Housing Development/Est. Year Completion
Future Group Quarters Facilities
Future Employers Infrastructure
Promotions (Promos) and Hindrances (Hinders) to Population and Housing Growth; Other notes
Over 15% Hispanic pop, increase from 11% in 2000; 8% elderly (less than Co.)
*Rezoning to permit 2 homes, 2012
Promos: *UGB expanded by 24 acres Hinders: *Current economic recession
Highlights or summary of influences on or anticipation of population and housing growth from planning documents and studies
*Using comprehensive plan from 1978
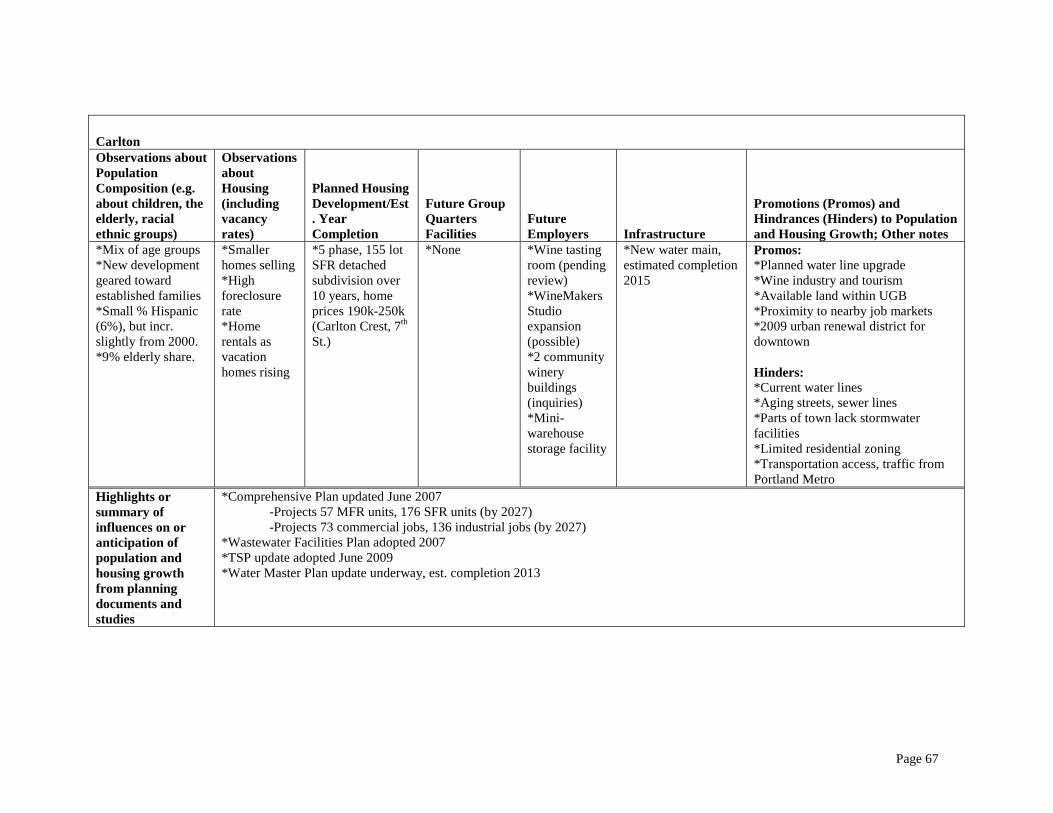
Page 67
Carlton Observations about Population Composition (e.g. about children, the elderly, racial ethnic groups)
Observations about Housing (including vacancy rates)
Planned Housing Development/Est. Year Completion
Future Group Quarters Facilities
Future Employers Infrastructure
Promotions (Promos) and Hindrances (Hinders) to Population and Housing Growth; Other notes
*Mix of age groups *New development geared toward established families *Small % Hispanic (6%), but incr. slightly from 2000. *9% elderly share.
*Smaller homes selling *High foreclosure rate *Home rentals as vacation homes rising
*5 phase, 155 lot SFR detached subdivision over 10 years, home prices 190k-250k (Carlton Crest, 7th St.)
*None *Wine tasting room (pending review) *WineMakers Studio expansion (possible) *2 community winery buildings (inquiries) *Mini-warehouse storage facility
*New water main, estimated completion 2015
Promos: *Planned water line upgrade *Wine industry and tourism *Available land within UGB *Proximity to nearby job markets *2009 urban renewal district for downtown Hinders: *Current water lines *Aging streets, sewer lines *Parts of town lack stormwater facilities *Limited residential zoning *Transportation access, traffic from Portland Metro
Highlights or summary of influences on or anticipation of population and housing growth from planning documents and studies
*Comprehensive Plan updated June 2007 -Projects 57 MFR units, 176 SFR units (by 2027) -Projects 73 commercial jobs, 136 industrial jobs (by 2027)
*Wastewater Facilities Plan adopted 2007 *TSP update adopted June 2009 *Water Master Plan update underway, est. completion 2013

Page 68
Dayton Observations about Population Composition (e.g. about children, the elderly, racial ethnic groups)
Observations about Housing (including vacancy rates)
Planned Housing Development/Est. Year Completion
Future Group Quarters Facilities
Future Employers Infrastructure
Promotions (Promos) and Hindrances (Hinders) to Population and Housing Growth; Other notes
*~30% Hispanic, incr from 25% in 2000. *~10% senior citizens
*835 residential utility connections; 24 vacant (3%)
*17 of 36 SFR units built in Country Heritage subdivision; Phase II not started; project approved 2005
*None *Small entrepreneurial-type business
*$900k in water improvements scheduled in 2013-2014 *$12 million needed for water improvements, $19 million needed for sewer improvements
Promos: *Close to large population centers *Bedroom community to Portland, Salem Hinders: *Lack of economic opportunities *Lack of large commercial or industrial zoned parcels
Highlights or summary of influences on or anticipation of population and housing growth from planning documents and studies
*Projected growth of 2.25% unmet

Page 69
Dundee Observations about Population Composition (e.g. about children, the elderly, racial ethnic groups)
Observations about Housing (including vacancy rates)
Planned Housing Development/Est. Year Completion
Future Group Quarters Facilities
Future Employers Infrastructure
Promotions (Promos) and Hindrances (Hinders) to Population and Housing Growth; Other notes
*Median age, income increasing *Aging population with more resources, fewer young families.
*Generally stable tenure; rental vacancy rate at 1.4% while homes at 2.1%
*1 SFR unit, 2012 *Riverside District Master Plan, June 2011, 970 residential units on 360 acres, no est. completion date
*None *Continued employment in retail, tourism, local manufacturing
*Severe constraints on water availability *New wastewater treatment plant under construction, est. completion 2012 *New fire station planned, construction begins 2013 *School district interested in expanding or remodeling elementary school or building new one *Newberg-Dundee Bypass construction begins 2013
Promos: *Land available for development, including 29 residential acres outside Riverside Master Plan *Riverside District Master Plan adopted *Updating Transportation System Plan Hinders: *Lack of water capacity *Current traffic on 99W deters visits
Highlights or summary of influences on or anticipation of population and housing growth from planning documents and studies
*Riverside District Master Plan envisions 970 dwelling units, plus commercial and industrial development on 360 acres -Current development limited due to lack of water capacity -Development assumed to begin once water capacity issue resolved -Expected to cater to mix of incomes and diverse population
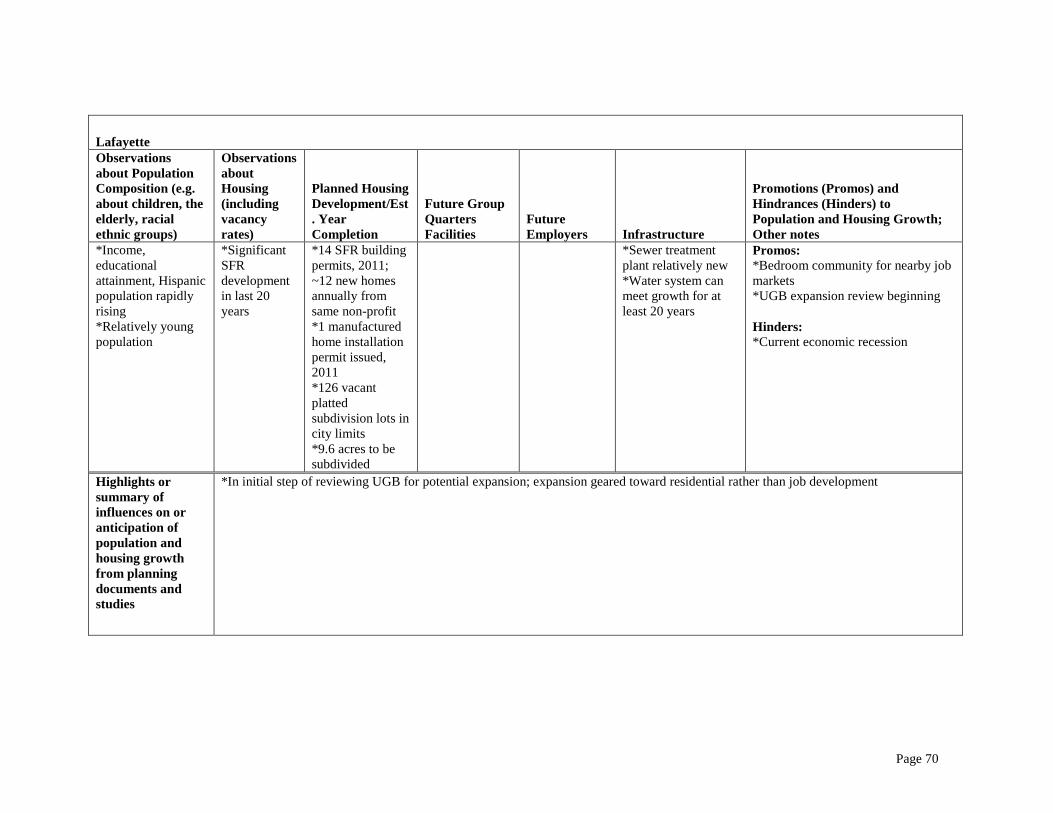
Page 70
Lafayette Observations about Population Composition (e.g. about children, the elderly, racial ethnic groups)
Observations about Housing (including vacancy rates)
Planned Housing Development/Est. Year Completion
Future Group Quarters Facilities
Future Employers Infrastructure
Promotions (Promos) and Hindrances (Hinders) to Population and Housing Growth; Other notes
*Income, educational attainment, Hispanic population rapidly rising *Relatively young population
*Significant SFR development in last 20 years
*14 SFR building permits, 2011; ~12 new homes annually from same non-profit *1 manufactured home installation permit issued, 2011 *126 vacant platted subdivision lots in city limits *9.6 acres to be subdivided
*Sewer treatment plant relatively new *Water system can meet growth for at least 20 years
Promos: *Bedroom community for nearby job markets *UGB expansion review beginning Hinders: *Current economic recession
Highlights or summary of influences on or anticipation of population and housing growth from planning documents and studies
*In initial step of reviewing UGB for potential expansion; expansion geared toward residential rather than job development

Page 71
McMinnville Observations about Population Composition (e.g. about children, the elderly, racial ethnic groups)
Observations about Housing (including vacancy rates)
Planned Housing Development/Est. Year Completion
Future Group Quarters Facilities
Future Employers Infrastructure
Promotions (Promos) and Hindrances (Hinders) to Population and Housing Growth; Other notes
*~35% rentals, 8% residential vacancy *Housing starts slightly up
*Habitat for Humanity: 35 SFR, 2013 (pending) *21 lot SFR subdivision, 2013 *36 unit MFR complex, 2012 *24 SFR lots, 2013 *99 SFR lots, unplatted, unknown completion
*44-bed memory care facility (pending)
*Continued expansion of Evergreen Museum Campus
*Continued upgrading of sanitary, storm sewer lines *Newly adopted TSP
Promos: *Wastewater facility to double capacity in near-term *Newberg-Dundee Bypass will enhance access *Local/regional hospital *Evergreen Museum Campus *Linfield College Hinders: *No direct access to Interstate 5 *Bioanalytical Services closed in 2012; 20 jobs lost
Highlights or summary of influences on or anticipation of population and housing growth from planning documents and studies
*LCDC acknowledged 2023 population projection of 44,055 *Projected rate of 2.54 persons per dwelling unit *Projected 6,014 new dwelling units 2003-2023

Page 72
Newberg Observations about Population Composition (e.g. about children, the elderly, racial ethnic groups)
Observations about Housing (including vacancy rates)
Planned Housing Development/Est. Year Completion
Future Group Quarters Facilities
Future Employers Infrastructure
Promotions (Promos) and Hindrances (Hinders) to Population and Housing Growth; Other notes
*George Fox University growing, though rate likely to slow *Rising median age; some housing projects for the elderly *% Hispanic population rising *Attracts families with children
*Vacancy rate up due to recession *Housing costs dropped *Static housing stock for low-income residents; most construction geared toward higher-end
*Springbrook Master Plan accommodates 1,345 dwelling units over ~10 years *Multiple other projects; 178 SFR and 182 MFR units
*Friendsview Manor retirement community planning 165 unit expansion *New skilled nursing facility *George Fox University seeking additional dorm space
*Strong manufacturing *Wine/tourism growth *Providence expansion, other health facilities on rise *Schools and higher-education expansion *Potential retail growth
*Good water, wastewater infrastructure *Newberg-Dundee Bypass begins construction 2013 *Good electricity, natural gas infrastructure *Consistent expansion, upgrading of schools
Promos: *Planning for growth, urban reserve area, expanded industrial area *Proximity to Portland Metro without being under Metro’s jurisdiction *Quality of life *Plentiful supply of residential land Hinders: *Land-use laws *Traffic expected to remain heavy after Newberg-Dundee Bypass Phase I *Lack of MFR, affordable housing
Highlights or summary of influences on or anticipation of population and housing growth from planning documents and studies
*Advisory committees recommend medium rather than high or low growth forecast *Adopted 2005 PSU forecast of 2035 UGB population of 48,316; forecasted 2010 population at 24,497 though 2010 Census showed 22,674 in city and 564 in UGB area *Promoting economic growth; June 2012 forecast 2.5% AAGR in employment *Updating Transportation System Plan based on AAGR rate; expected 2035 population 41,228
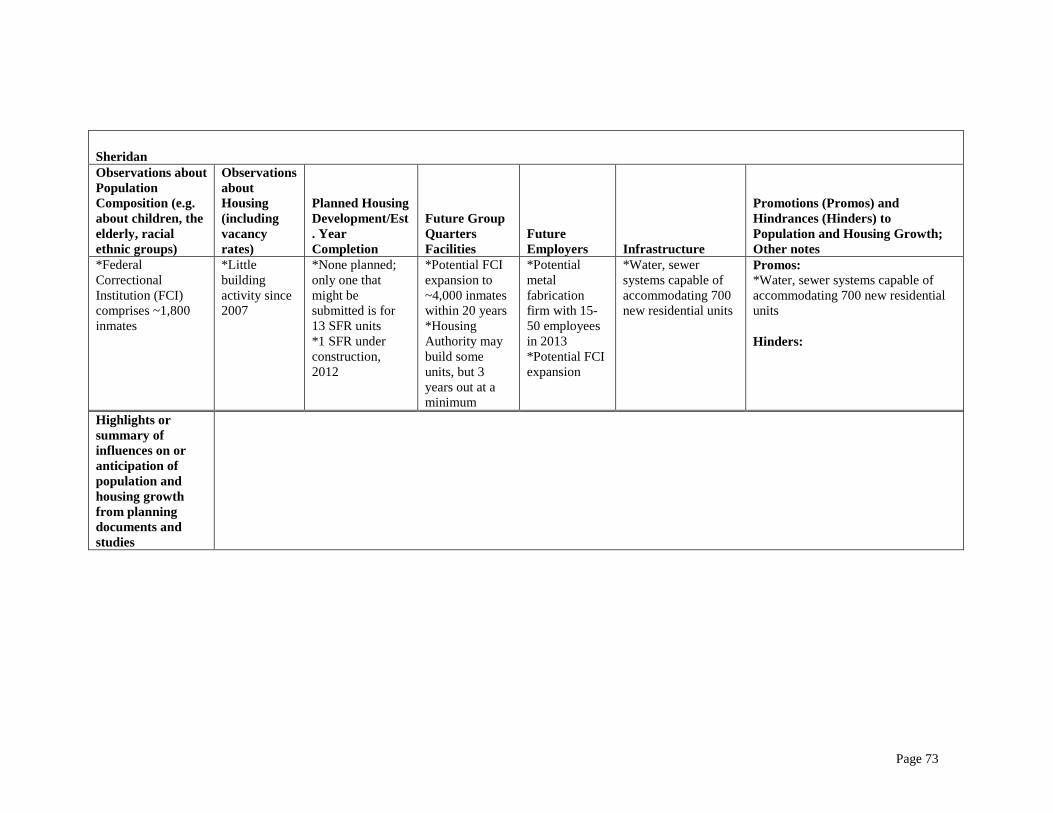
Page 73
Sheridan Observations about Population Composition (e.g. about children, the elderly, racial ethnic groups)
Observations about Housing (including vacancy rates)
Planned Housing Development/Est. Year Completion
Future Group Quarters Facilities
Future Employers Infrastructure
Promotions (Promos) and Hindrances (Hinders) to Population and Housing Growth; Other notes
*Federal Correctional Institution (FCI) comprises ~1,800 inmates
*Little building activity since 2007
*None planned; only one that might be submitted is for 13 SFR units *1 SFR under construction, 2012
*Potential FCI expansion to ~4,000 inmates within 20 years *Housing Authority may build some units, but 3 years out at a minimum
*Potential metal fabrication firm with 15-50 employees in 2013 *Potential FCI expansion
*Water, sewer systems capable of accommodating 700 new residential units
Promos: *Water, sewer systems capable of accommodating 700 new residential units Hinders:
Highlights or summary of influences on or anticipation of population and housing growth from planning documents and studies

Page 74
Willamina Observations about Population Composition (e.g. about children, the elderly, racial ethnic groups)
Observations about Housing (including vacancy rates)
Planned Housing Development/Est. Year Completion
Future Group Quarters Facilities
Future Employers Infrastructure
Promotions (Promos) and Hindrances (Hinders) to Population and Housing Growth; Other notes
Diversity reflected in Census data
*Recent building permits for rehabilitation and remodeling of existing structures
*Several subdivisions approved: 1 platted, 1 expired, 1 granted extension *Largest MFR development (24 units) recently renovated
None *Growth of Hampton Lumber, Grand Ronde, prison in Sheridan *New convenience store *Possible equestrian center, cultural/business center at former high school
*Awarded funding to update master plan for water and sewer services, work could be complete by September 2014 *Consolidated school facilities undergoing improvements
Promos: *Vacant lots platted *Completed first phase of code assistance program emphasizing downtown development Hinders: *None mentioned
Highlights or summary of influences on or anticipation of population and housing growth from planning documents and studies
*Strategic community plan in progress *Energy focused on creating additional facilities and connectivity between parks, trails, and open spaces

Page 75
Yamhill Observations about Population Composition (e.g. about children, the elderly, racial ethnic groups)
Observations about Housing (including vacancy rates)
Planned Housing Development/Est. Year Completion
Future Group Quarters Facilities
Future Employers Infrastructure
Promotions (Promos) and Hindrances (Hinders) to Population and Housing Growth; Other notes
*Stable population *All SFR (no apartments), many families *White with some Latino
*No new construction; currently 2 foreclosures
*30 vacant lots for mid-market SFR units but no new subdivisions proposed
*None *None *Adequate for existing development, some capacity for growth
Promos: *Vacant lots *Good infrastructure *Good schools Hinders: *None
Highlights or summary of influences on or anticipation of population and housing growth from planning documents and studies
*Additional vacant residential areas available for housing expansion beyond existing vacant lots *Vacant industrial property of ~25 acres within UGB; no current plans for its development

Page 76
APPENDIX 5
Supporting Data and Forecast Summary Tables

Page 77
Supporting Data and Forecast Summary Tables
These tables hold a summary of supporting data that were used to develop the population forecasts. They include recent historic data (including populations) that are known or were estimated. The data are grouped by geographic area. There is a table for Yamhill County and one for each of its city areas and non-UGB, non-URA unincorporated area. Population and housing data and rates for 1990, 2000, and 2010 are from decennial censuses using block-level geography and Yamhill-County-supplied city, UGB, and URA boundaries; 2000-2010 birth data and 2000-2010 enrollment data are from administrative records; All numbers for years 2015-2035 are predicted. Abbreviated column headings key: Pop = population; #Ave Ann Pop Growth = number average annual population growth; %Ave Ann Pop Growth = percent average annual population growth; %Pop 65+ = percentage population ages 65 and over; % Pop Hisp = percentage population that are Hispanic; HH = households; Hsg Units = housing units; Ocpncy = occupancy; Average HH Size = average number of persons per household; GQ pop = group quarters population; Schl Enrl = school enrollment.
Yamhill
County Pop
# Ave
Ann Pop
Growth
% Ave
Ann Pop
Growth
% Pop
65+
% Pop
Hisp HH
Hsg
Units
# Ave
Ann
Hsg
Growth
% Ave
Ann
Hsg
Growth
Ocpncy
Rate
Average
HH Size
GQ
pop Births
Schl
Enrl*
2000 84,992 11.70% 10.60% 28,732 30,270 94.90% 2.78 5,024 1,191 15,473
2010 99,193 1,420 1.50% 13.40% 14.70% 34,726 37,110 684 2.04% 93.60% 2.7 5,461 1,127 16,531
2011 99,851 658 0.70% 34,965 37,366 256 0.07% 93.60% 2.7 5,472
2012 100,708 858 0.90% 35,273 37,684 318 0.08% 93.60% 2.7 5,472
2015 105,220 1,504 1.50% 15.50% 36,342 38,580 299 0.23% 94.20% 2.74 5,642
2020 115,108 1,978 1.80% 19.00% 40,187 42,661 816 1.01% 94.20% 2.71 6,202
2025 124,509 1,880 1.60% 22.40% 43,980 46,688 805 0.90% 94.20% 2.69 6,202
2030 134,204 1,939 1.50% 24.70% 47,933 50,884 839 0.86% 94.20% 2.66 6,702
2032 137,590 1,693 1.20% 49,579 52,631 874 0.34% 94.20% 2.64 6,702
2035 142,830 1,747 1.20% 26.10% 51,957 55,156 842 0.47% 94.20% 2.62 6,702
*Total public school enrollment in school district(s) in which area is located.

Page 78
Amity
(+UGB) Pop
# Ave
Ann Pop
Growth
% Ave
Ann Pop
Growth
% Pop
65+
% Pop
Hisp HH
Hsg
Units
# Ave
Ann
Hsg
Growth
% Ave
Ann
Hsg
Growth
Ocpncy
Rate
Average
HH Size
GQ
pop Births
Schl
Enrl*
2000 1,481 8.7% 11.5% 473 497 95.2% 3.13 0 10 876
2010 1,623 14 0.9% 7.9% 15.4% 540 576 8 1.48% 93.8% 3.01 0 17 840
2011 1,635 12 0.7% 540 576 0 0.00% 93.7% 3.03 0
2012 1,650 15 0.9% 545 581 5 0.91% 93.7% 3.03 0
2015 1,719 23 1.4% 564 597 5 0.89% 94.4% 3.05 0
2020 1,779 12 0.7% 587 621 5 0.81% 94.4% 3.03 0
2025 1,879 20 1.1% 623 660 8 1.20% 94.4% 3.01 0
2030 1,984 21 1.1% 662 701 8 1.21% 94.4% 3.00 0
2032 2,026 21 1.1% 678 718 9 1.21% 94.4% 2.99 0
2035 2,097 24 1.1% 704 746 9 1.24% 94.4% 2.98 0
*Total public school enrollment in school district(s) in which area is located (Amity 4J).
Carlton Pop
# Ave
Ann Pop
Growth
% Ave
Ann Pop
Growth
% Pop
65+
% Pop
Hisp HH
Hsg
Units
# Ave
Ann
Hsg
Growth
% Ave
Ann
Hsg
Growth
Ocpncy
Rate
Average
HH Size
GQ
pop Births
Schl
Enrl*
2000 1,514 9.2% 4.6% 537 577 93.4% 2.81 0 5 1,309
2010 2,007 49 2.8% 9.1% 6.0% 669 768 19 2.86% 91.4% 2.86 0 15 1,144
2011 2,036 29 1.5% 697 742 -26 -3.39% 93.9% 2.92 0
2012 2,065 29 1.4% 707 753 11 1.41% 93.9% 2.92 0
2015 2,080 5 0.2% 734 786 11 1.42% 93.4% 2.83 0
2020 2,247 33 1.5% 800 857 14 1.73% 93.4% 2.81 0
2025 2,465 44 1.8% 883 945 18 1.97% 93.4% 2.79 0
2030 2,669 41 1.6% 969 1,037 18 1.85% 93.4% 2.76 0
2032 2,757 44 1.6% 1,005 1,077 20 1.86% 93.4% 2.74 0
2035 2,890 44 1.6% 1,059 1,134 19 1.73% 93.4% 2.73 0
*Total public school enrollment in school district(s) in which area is located (Yamhill-Carlton 1).
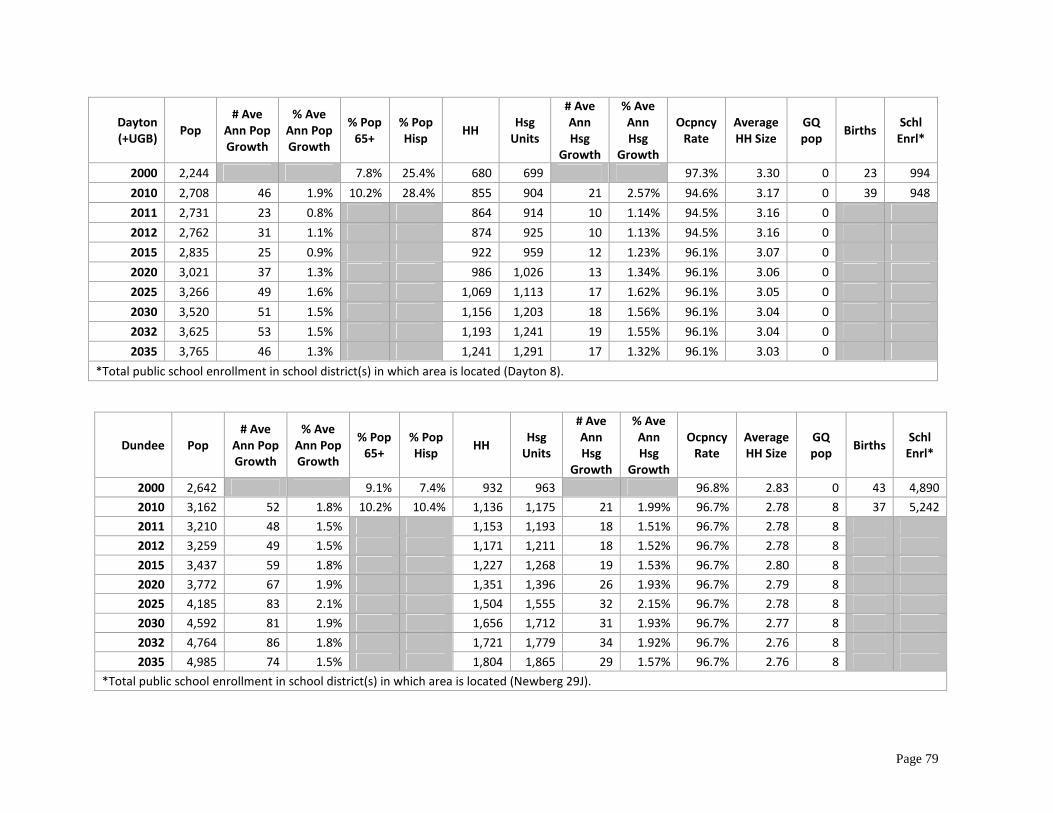
Page 79
Dundee Pop
# Ave
Ann Pop
Growth
% Ave
Ann Pop
Growth
% Pop
65+
% Pop
Hisp HH
Hsg
Units
# Ave
Ann
Hsg
Growth
% Ave
Ann
Hsg
Growth
Ocpncy
Rate
Average
HH Size
GQ
pop Births
Schl
Enrl*
2000 2,642 9.1% 7.4% 932 963 96.8% 2.83 0 43 4,890
2010 3,162 52 1.8% 10.2% 10.4% 1,136 1,175 21 1.99% 96.7% 2.78 8 37 5,242
2011 3,210 48 1.5% 1,153 1,193 18 1.51% 96.7% 2.78 8
2012 3,259 49 1.5% 1,171 1,211 18 1.52% 96.7% 2.78 8
2015 3,437 59 1.8% 1,227 1,268 19 1.53% 96.7% 2.80 8
2020 3,772 67 1.9% 1,351 1,396 26 1.93% 96.7% 2.79 8
2025 4,185 83 2.1% 1,504 1,555 32 2.15% 96.7% 2.78 8
2030 4,592 81 1.9% 1,656 1,712 31 1.93% 96.7% 2.77 8
2032 4,764 86 1.8% 1,721 1,779 34 1.92% 96.7% 2.76 8
2035 4,985 74 1.5% 1,804 1,865 29 1.57% 96.7% 2.76 8
*Total public school enrollment in school district(s) in which area is located (Newberg 29J).
Dayton
(+UGB) Pop
# Ave
Ann Pop
Growth
% Ave
Ann Pop
Growth
% Pop
65+
% Pop
Hisp HH
Hsg
Units
# Ave
Ann
Hsg
Growth
% Ave
Ann
Hsg
Growth
Ocpncy
Rate
Average
HH Size
GQ
pop Births
Schl
Enrl*
2000 2,244 7.8% 25.4% 680 699 97.3% 3.30 0 23 994
2010 2,708 46 1.9% 10.2% 28.4% 855 904 21 2.57% 94.6% 3.17 0 39 948
2011 2,731 23 0.8% 864 914 10 1.14% 94.5% 3.16 0
2012 2,762 31 1.1% 874 925 10 1.13% 94.5% 3.16 0
2015 2,835 25 0.9% 922 959 12 1.23% 96.1% 3.07 0
2020 3,021 37 1.3% 986 1,026 13 1.34% 96.1% 3.06 0
2025 3,266 49 1.6% 1,069 1,113 17 1.62% 96.1% 3.05 0
2030 3,520 51 1.5% 1,156 1,203 18 1.56% 96.1% 3.04 0
2032 3,625 53 1.5% 1,193 1,241 19 1.55% 96.1% 3.04 0
2035 3,765 46 1.3% 1,241 1,291 17 1.32% 96.1% 3.03 0
*Total public school enrollment in school district(s) in which area is located (Dayton 8).

Page 80
McMinnville
(+UGB) Pop
# Ave
Ann
Pop
Growth
% Ave
Ann
Pop
Growth
%
Pop
65+
% Pop
Hisp HH
Hsg
Units
# Ave
Ann
Hsg
Growth
% Ave
Ann
Hsg
Growth
Ocpncy
Rate
Average
HH Size
GQ
pop Births
Schl
Enrl*
2000 26,286 14.2% 14.6% 9,285 9,743 95.3% 2.66 1,602 416 5,505
2010 32,648 636 2.2% 14.6% 20.5% 11,849 12,573 283 2.55% 94.2% 2.61 1,716 417 6,460
2011 32,808 160 0.5% 11,822 12,549 -24 -0.19% 94.2% 2.63 1,716
2012 33,045 237 0.7% 11,912 12,645 96 0.76% 94.2% 2.63 1,716
2015 34,757 570 1.7% 16.5% 12,563 13,259 205 1.58% 94.8% 2.63 1,716
2020 38,430 735 2.0% 19.4% 13,960 14,733 295 2.11% 94.8% 2.63 1,716
2025 42,283 771 1.9% 22.4% 15,484 16,341 322 2.07% 94.8% 2.62 1,716
2030 46,171 777 1.8% 24.7% 16,968 17,908 313 1.83% 94.8% 2.62 1,716
2032 47,659 744 1.6% 17,535 18,507 300 1.65% 94.8% 2.62 1,716
2035 49,983 775 1.6% 26.4% 18,493 19,518 337 1.77% 94.8% 2.61 1,716
*Total public school enrollment in school district(s) in which area is located (McMinnville 40).
Lafayette Pop
# Ave
Ann Pop
Growth
% Ave
Ann Pop
Growth
% Pop
65+
% Pop
Hisp HH
Hsg
Units
# Ave
Ann
Hsg
Growth
% Ave
Ann
Hsg
Growth
Ocpncy
Rate
Average
HH Size
GQ
pop Births
Schl
Enrl*
2000 2,586 7.8% 20.2% 841 888 94.7% 3.07 0 57 6,499
2010 3,742 116 3.7% 8.0% 22.1% 1,193 1,317 43 3.94% 91.8% 3.09 0 57 7,408
2011 3,745 3 0.1% 1,218 1,319 2 0.15% 92.3% 3.07 0
2012 3,802 57 1.5% 1,236 1,339 20 1.51% 92.3% 3.07 0
2015 4,018 72 1.8% 1,307 1,401 21 1.51% 93.3% 3.07 0
2020 4,394 75 1.8% 1,429 1,532 26 1.79% 93.3% 3.07 0
2025 4,874 96 2.1% 1,585 1,699 33 2.07% 93.3% 3.07 0
2030 5,349 95 1.9% 1,740 1,865 33 1.86% 93.3% 3.07 0
2032 5,552 101 1.9% 1,806 1,936 35 1.86% 93.3% 3.07 0
2035 5,797 82 1.4% 1,885 2,021 28 1.44% 93.3% 3.07 0
*Total public school enrollment in school district(s) in which area is located (Dayton 8 and McMinnville 40).

Page 81
Newberg
(+UGB, not
URA)
Pop
# Ave
Ann Pop
Growth
% Ave
Ann Pop
Growth
% Pop
65+
% Pop
Hisp HH
Hsg
Units
# Ave
Ann
Hsg
Growth
% Ave
Ann
Hsg
Growth
Ocpncy
Rate
Average
HH Size
GQ
pop Births
Schl
Enrl*
2000 18,538 10.7% 10.4% 6,265 6,604 94.9% 2.76 1,241 276 4,890
2010 22,468 393 1.9% 12.0% 13.3% 7,876 8,409 181 2.42% 93.7% 2.66 1,502 304 5,242
2011 22,730 262 1.2% 7,980 8,527 118 1.39% 93.6% 2.66 1,502
2012 22,963 233 1.0% 8,068 8,621 94 1.09% 93.6% 2.66 1,502
2015 24,663 567 2.4% 13.5% 8,643 9,176 185 2.08% 94.2% 2.66 1,672
2020 28,250 718 2.7% 15.9% 10,029 10,648 294 2.97% 94.2% 2.65 1,672
2025 32,213 793 2.6% 18.8% 11,568 12,282 327 2.86% 94.2% 2.64 1,672
2030 35,408 639 1.9% 21.4% 12,827 13,618 267 2.07% 94.2% 2.63 1,672
2032 36,610 601 1.7% 13,335 14,157 270 1.94% 94.2% 2.62 1,672
2035 38,490 627 1.7% 23.2% 14,053 14,919 254 1.75% 94.2% 2.62 1,672
*Total public school enrollment in school district(s) in which area is located (Newberg 29J).
Sheridan
(+UGB) Pop
# Ave
Ann Pop
Growth
% Ave
Ann Pop
Growth
% Pop
65+
% Pop
Hisp HH
Hsg
Units
# Ave
Ann
Hsg
Growth
% Ave
Ann
Hsg
Growth
Ocpncy
Rate
Average
HH Size
GQ
pop Births
Schl
Enrl*
2000 5,581 8.1% 8.9% 1,290 1,392 92.7% 2.76 2,024 64 1,899
2010 6,164 58 1.0% 8.9% 16.6% 1,555 1,684 29 1.90% 92.3% 2.78 1,846 59 1,897
2011 6,228 64 1.0% 1,559 1,672 -12 -0.74% 93.3% 2.81 1,846
2012 6,296 68 1.1% 1,584 1,697 26 1.54% 93.3% 2.81 1,846
2015 6,417 40 0.6% 1,644 1,778 27 1.54% 92.5% 2.78 1,846
2020 7,276 172 2.5% 1,752 1,894 23 1.27% 92.5% 2.78 2,406
2025 7,573 59 0.8% 1,859 2,010 23 1.18% 92.5% 2.78 2,406
2030 8,366 159 2.0% 1,964 2,124 23 1.10% 92.5% 2.78 2,906
2032 8,488 61 0.7% 2,008 2,171 24 1.10% 92.5% 2.78 2,906
2035 8,657 56 0.7% 2,069 2,237 22 0.99% 92.5% 2.78 2,906
*Total public school enrollment in school district(s) in which area is located (Sheridan 48J with small piece in Willamina 30J).

Page 82
Willamina
(whole city
+UGB)
Pop
# Ave
Ann Pop
Growth
% Ave
Ann Pop
Growth
% Pop
65+
% Pop
Hisp HH
Hsg
Units
# Ave
Ann Hsg
Growth
% Ave
Ann Hsg
Growth
Ocpncy
Rate
Average
HH Size
GQ
pop Births
Schl
Enrl*
2000 1,859 10.30% 3.90% 669 718 93.20% 2.78 0 7 989
2010 2,046 19 1.00% 9.70% 5.90% 706 786 7 0.90% 89.80% 2.88 11 27 859
2011 2,055 9 0.40% 708 788 2 0.03% 89.80% 2.89 11
2012 2,063 9 0.40% 710 791 3 0.03% 89.80% 2.89 11
2015 2,112 16 0.80% 742 811 7 0.26% 91.50% 2.83 11
2020 2,179 13 0.60% 769 840 6 0.35% 91.50% 2.82 11
2025 2,243 13 0.60% 794 868 6 0.33% 91.50% 2.81 11
2030 2,295 10 0.50% 819 895 5 0.30% 91.50% 2.79 11
2032 2,321 13 0.60% 828 905 5 0.11% 91.50% 2.79 11
2035 2,361 13 0.60% 845 924 6 0.21% 91.50% 2.78 11
*Total public school enrollment in school district(s) in which area is located (Willamina 30J).
Willamina
+UGB
(Yamhill
County
portion
only)
Pop
# Ave
Ann Pop
Growth
% Ave
Ann Pop
Growth
% Pop
65+
% Pop
Hisp HH
Hsg
Units
# Ave
Ann
Hsg
Growth
% Ave
Ann
Hsg
Growth
Ocpncy
Rate
Average
HH Size
GQ
pop Births
Schl
Enrl*
2000 1,128 9.80% 4.40% 405 438 92.50% 2.79 0 4 989
2010 1,180 5 0.50% 10.10% 6.40% 395 439 0 0.02% 90.00% 2.96 11 14 859
2011 1,180 0 0.00% 395 439 0 0.00% 90.00% 2.96 11
2012 1,182 2 0.20% 396 440 1 0.01% 90.00% 2.96 11
2015 1,223 14 1.10% 422 463 8 0.52% 91.20% 2.87 11
2020 1,285 12 1.00% 447 490 5 0.57% 91.20% 2.85 11
2025 1,336 10 0.80% 470 515 5 0.50% 91.20% 2.82 11
2030 1,375 8 0.60% 489 536 4 0.40% 91.20% 2.79 11
2032 1,395 10 0.70% 496 544 4 0.15% 91.20% 2.79 11
2035 1,426 10 0.70% 509 558 5 0.26% 91.20% 2.78 11
*Total public school enrollment in school district(s) in which area is located (Willamina 30J).
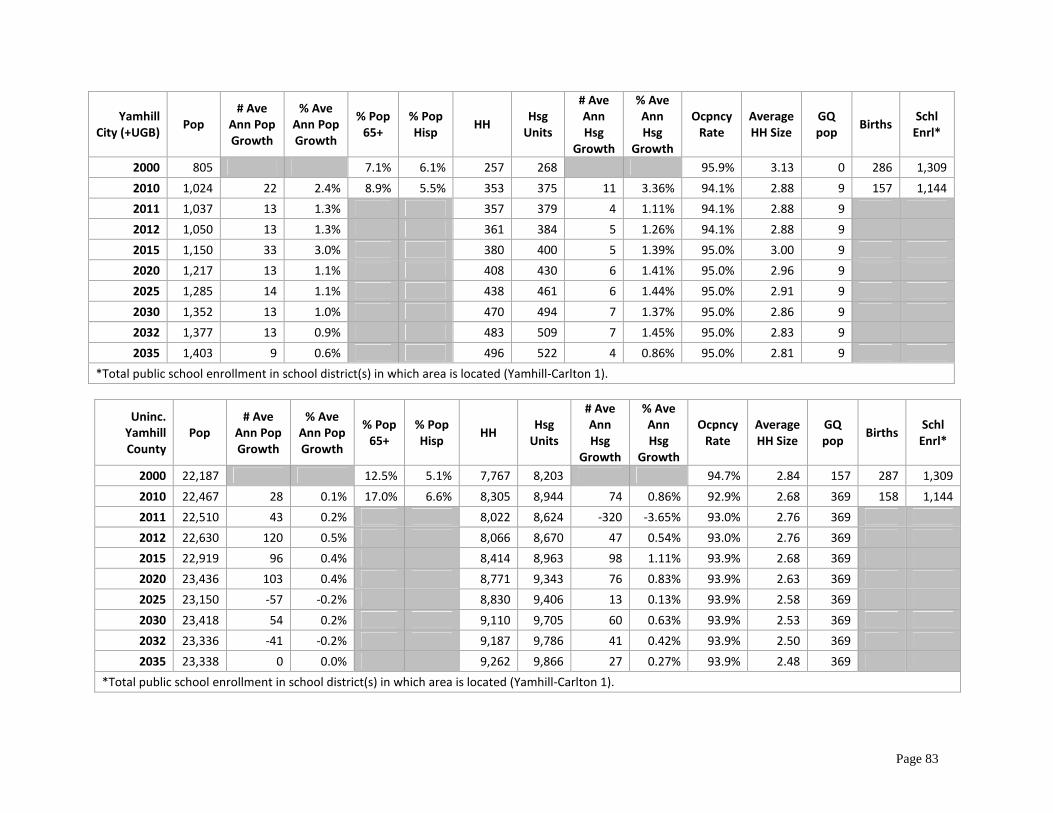
Page 83
Uninc.
Yamhill
County
Pop
# Ave
Ann Pop
Growth
% Ave
Ann Pop
Growth
% Pop
65+
% Pop
Hisp HH
Hsg
Units
# Ave
Ann
Hsg
Growth
% Ave
Ann
Hsg
Growth
Ocpncy
Rate
Average
HH Size
GQ
pop Births
Schl
Enrl*
2000 22,187 12.5% 5.1% 7,767 8,203 94.7% 2.84 157 287 1,309
2010 22,467 28 0.1% 17.0% 6.6% 8,305 8,944 74 0.86% 92.9% 2.68 369 158 1,144
2011 22,510 43 0.2% 8,022 8,624 -320 -3.65% 93.0% 2.76 369
2012 22,630 120 0.5% 8,066 8,670 47 0.54% 93.0% 2.76 369
2015 22,919 96 0.4% 8,414 8,963 98 1.11% 93.9% 2.68 369
2020 23,436 103 0.4% 8,771 9,343 76 0.83% 93.9% 2.63 369
2025 23,150 -57 -0.2% 8,830 9,406 13 0.13% 93.9% 2.58 369
2030 23,418 54 0.2% 9,110 9,705 60 0.63% 93.9% 2.53 369
2032 23,336 -41 -0.2% 9,187 9,786 41 0.42% 93.9% 2.50 369
2035 23,338 0 0.0% 9,262 9,866 27 0.27% 93.9% 2.48 369
*Total public school enrollment in school district(s) in which area is located (Yamhill-Carlton 1).
Yamhill
City (+UGB) Pop
# Ave
Ann Pop
Growth
% Ave
Ann Pop
Growth
% Pop
65+
% Pop
Hisp HH
Hsg
Units
# Ave
Ann
Hsg
Growth
% Ave
Ann
Hsg
Growth
Ocpncy
Rate
Average
HH Size
GQ
pop Births
Schl
Enrl*
2000 805 7.1% 6.1% 257 268 95.9% 3.13 0 286 1,309
2010 1,024 22 2.4% 8.9% 5.5% 353 375 11 3.36% 94.1% 2.88 9 157 1,144
2011 1,037 13 1.3% 357 379 4 1.11% 94.1% 2.88 9
2012 1,050 13 1.3% 361 384 5 1.26% 94.1% 2.88 9
2015 1,150 33 3.0% 380 400 5 1.39% 95.0% 3.00 9
2020 1,217 13 1.1% 408 430 6 1.41% 95.0% 2.96 9
2025 1,285 14 1.1% 438 461 6 1.44% 95.0% 2.91 9
2030 1,352 13 1.0% 470 494 7 1.37% 95.0% 2.86 9
2032 1,377 13 0.9% 483 509 7 1.45% 95.0% 2.83 9
2035 1,403 9 0.6% 496 522 4 0.86% 95.0% 2.81 9
*Total public school enrollment in school district(s) in which area is located (Yamhill-Carlton 1).

Page 84
APPENDIX 6
Maps of Housing Unit Density in Yamhill County
and its Sub-areas
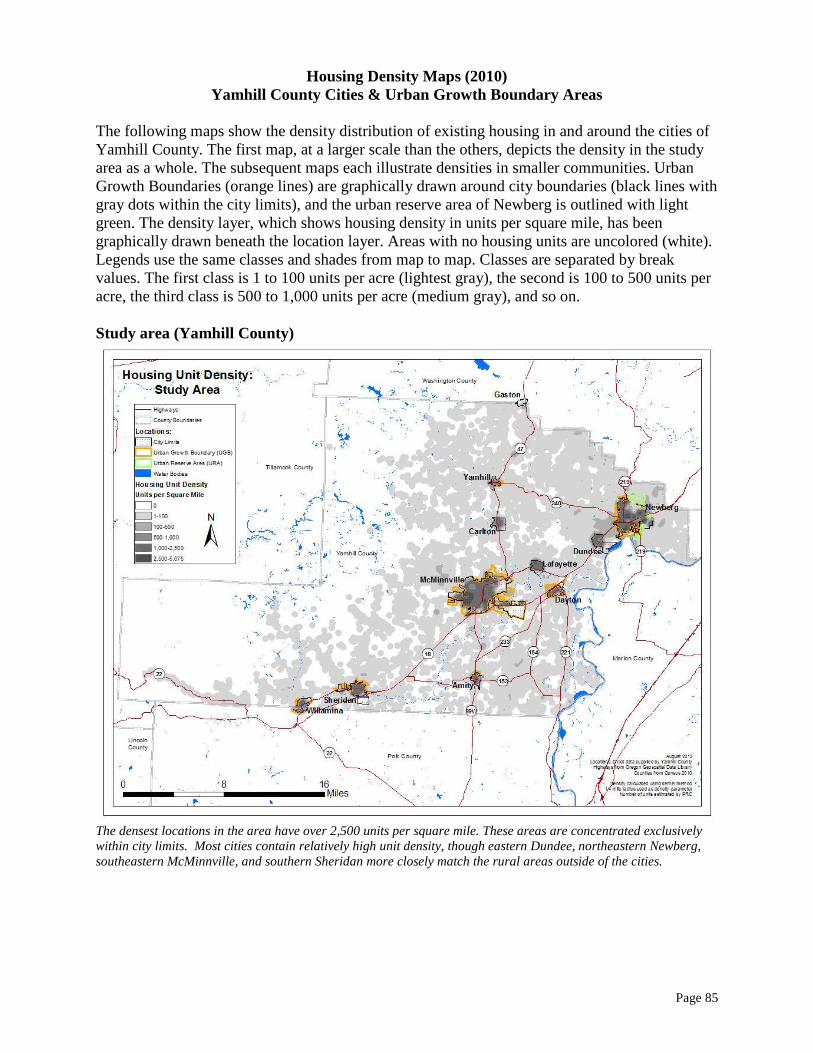
Page 85
Housing Density Maps (2010) Yamhill County Cities & Urban Growth Boundary Areas
The following maps show the density distribution of existing housing in and around the cities of Yamhill County. The first map, at a larger scale than the others, depicts the density in the study area as a whole. The subsequent maps each illustrate densities in smaller communities. Urban Growth Boundaries (orange lines) are graphically drawn around city boundaries (black lines with gray dots within the city limits), and the urban reserve area of Newberg is outlined with light green. The density layer, which shows housing density in units per square mile, has been graphically drawn beneath the location layer. Areas with no housing units are uncolored (white). Legends use the same classes and shades from map to map. Classes are separated by break values. The first class is 1 to 100 units per acre (lightest gray), the second is 100 to 500 units per acre, the third class is 500 to 1,000 units per acre (medium gray), and so on. Study area (Yamhill County)
The densest locations in the area have over 2,500 units per square mile. These areas are concentrated exclusively within city limits. Most cities contain relatively high unit density, though eastern Dundee, northeastern Newberg, southeastern McMinnville, and southern Sheridan more closely match the rural areas outside of the cities.

Page 86
Western Cities
The bulk of housing units in Sheridan and Willamina lie along Route 18-Business within the city limits. Much of Willamina’s city limits have moderate density, though the western and southern sections of Sheridan more closely match the rural areas outside the city limits. Density in both locations decreases toward the urban growth boundaries.

Page 87
Central Areas
McMinnville, the county seat of Yamhill County, exhibits higher housing unit density than most areas in the county, and it also has a notably more diverse range of density than other areas as well. Its western section is quite dense, while its southeastern area is unpopulated. Unusual for most areas of the county is a relatively higher-density area within the urban growth boundary but outside the city limits (directly south of the junction between Highways 47 and 99W). Lafayette and Dayton are both smaller towns with their housing units clustered within the city limits. Lafayette’s units lie north of Hwy. 99W while Dayton’s are clustered south of Hwy. 18 in its older core area. North of 18 in Dayton is an area within the urban growth boundary that already exhibits moderate density.

Page 88
Dundee and Newberg
Newberg, like McMinnville, has a number of areas in the highest housing unit density category. Most of its population is clustered within the city limits. Although the city has sizeable land area in its urban growth boundary and urban reserve area, these areas tend be relatively unpopulated. Dundee’s population is also clustered within the city limits along Highway 99W. Of note is the relative lack of housing in Dundee’s eastern section and Newberg’s southern area; the planned Newberg-Dundee Bypass is expected to be constructed through these areas. It is possible these areas will give rise to non-residential development as a result, though existing land use in the vicinity currently remains residential.

Page 89
Rural Towns
Amity, Carlton, and Yamhill are smaller towns; each has its population concentrated along the rural highways in the area and within their respective city limits. Each is surrounded predominantly by agricultural land, and although Amity and Yamhill have urban growth boundaries, they do not have a noticeable effect on the cities’ density patterns.

Page 90
APPENDIX 7
Data Sources and Description

Page 91
Data Sources and Description This population forecast report is based on data obtained from several sources. Much of the
data were aggregated to the county or city level of geography by PRC staff. The data
sources include:
• Decennial Census. The U. S. Census Bureau’s decennial Census is the only source of
data collected for small areas across the nation. We used 1990, 2000, and 2010 census
data to obtain the population by age and sex residing in the County, its cities, and
unincorporated area. We compared the changes from 2000 to 2010 to develop an
initial estimate of the age-sex profile for net migrants in the cohort-component models.
Female population ages 15-44 were used with birth data to calculate fertility rates. In
addition, data for population by race/ethnicity, group quarters, and housing were
obtained from the censuses.
• American Community Survey. The American Community Survey (ACS) is a U.S.
Census Bureau survey that includes estimated figures for areas with populations above
certain thresholds. The ACS asks the same or similar questions to the 1990 and 2000
censuses that were not included in the 2010 Census. We used the 2000 and 2010
Censuses and 2006-2010 American Community Survey data to develop estimates of
housing and population change.
• Annual Population Estimates. Annual population estimates for cities and counties of
Oregon are prepared by the Population Research Center at Portland State University as
part of its Population Estimates Program. Data on state income tax returns, births,
deaths, Medicare and school enrollment, and information about changes in housing
stock and group quarters population are utilized in developing the population estimates.
We used population estimates of Yamhill County, its cities, and its unincorporated area
from 2000 to 2011 in this study to help to approximate growth trends throughout the
County.

Page 92
• Area Boundary Files. In spring 2012, Yamhill County’s Geographic Information
Systems Department provided the boundary files for cities, UGBs, and Newberg’s
URA within our study area. These files were used for mapping and aggregating
demographic and other data unique to each geographic location in our study area.
• Building Permit Data. Building permit data were obtained from two different sources:
PRC’s Population Estimates Program annual questionnaires, U.S. Census Bureau
Residential Construction Division. Building permit data were used, along with taxlot
data, to estimate the number of housing units constructed after the 2000 Census and
create a current housing inventory for each geographic part in our study area.
• Land Use Data. Taxlot data were provided by the Polk and Yamhill County
Geographic Information Systems Departments. Taxlot data were used to create current
housing unit inventories for the geographic parts in our study area. Taxlot and zoning
data were both used to identify housing units and to obtain an overall assessment of the
availability of buildable lands.
• Birth and Death Data. Information on births and deaths reported for the Yamhill
County area were obtained from the Oregon Center for Health Statistics 2000 to 2010.
The data were used for two purposes. One use was for calculating overall fertility and
mortality rates for the County. These rates were used in the demographic models. The
second use was to note the number of births in order to examine birth trends and the
correspondence between births and population change.
• School Enrollment Data. These data were obtained from the Oregon Department of
Education for school districts in Yamhill County for years 2000-2011. Changes in the
levels of school enrollment suggest changes in population and households, such as
increasing or decreasing net migration or average household size.
• Local Employment Dynamics Data. These data for 2002-2010 from the U.S. Census
Bureau and the Oregon Employment Department provide background information
about commuting patterns of workers. The percentage of workers that reside in
Page 93
Yamhill County and have jobs in the County was evaluated. Where these workers have
jobs within the County, was also identified. An area’s availability of employment or
draw of workers, influences population and housing changes. These data were
evaluated to detect changes in commuting patterns.
• Oregon Labor Force Data and Employment Projections. Labor force data from the
Oregon Employment Department for 2000-2010 were evaluated to determine trends
and their relation to population change. The employment projections, also from the
Employment Department, were available for the economic region in which Yamhill
County is located (Region 3) are available for 2010 to 2020. We then related and
compared our population projections to the employment projections. We developed a
simple economic model to forecast countywide net migration based on the projected
demand for additional workers in the employment projections. The projected net
migration was compared to the net migration forecasted in our model.
• Regional Economic Profiles and Reports. Background and current economic
information for Yamhill County and Economic Region 3 were obtained from the
Oregon Employment Department. The information was used to provide us with an
understanding of historical and recent economic trends and the general economic
climate in our study area. Ultimately, the information enabled us to make more rational
assumptions when developing Yamhill County’s future population.
• Other Background Information. Carlton Comprehensive Downtown Plan (2010); City
of Dayton Planning Atlas and Comprehensive Plan (2011 revision); Dundee
Transportation System Plan Update (2012); Comprehensive Plan: Dundee, Oregon
(1977), City of Lafayette Comprehensive Plan (2001), McMinnville Residential Land
Needs Analysis (2001), City of McMinnville Transportation System Plan (2010),
McMinnville Urban Renewal Feasibility Study (2012), City of Newberg
Comprehensive Plan (2010), City of Dundee Vision Statement (2012), Yamhill County
Transportation System Plan (1996), Yamhill County Comprehensive Land Use Plan
(1996). Additional information that city officials and staff thought might have bearing
on the population forecasts were collected from most cities in Yamhill County.

Page 94
Appendix 8
Historical City and County Populations for Yamhill County
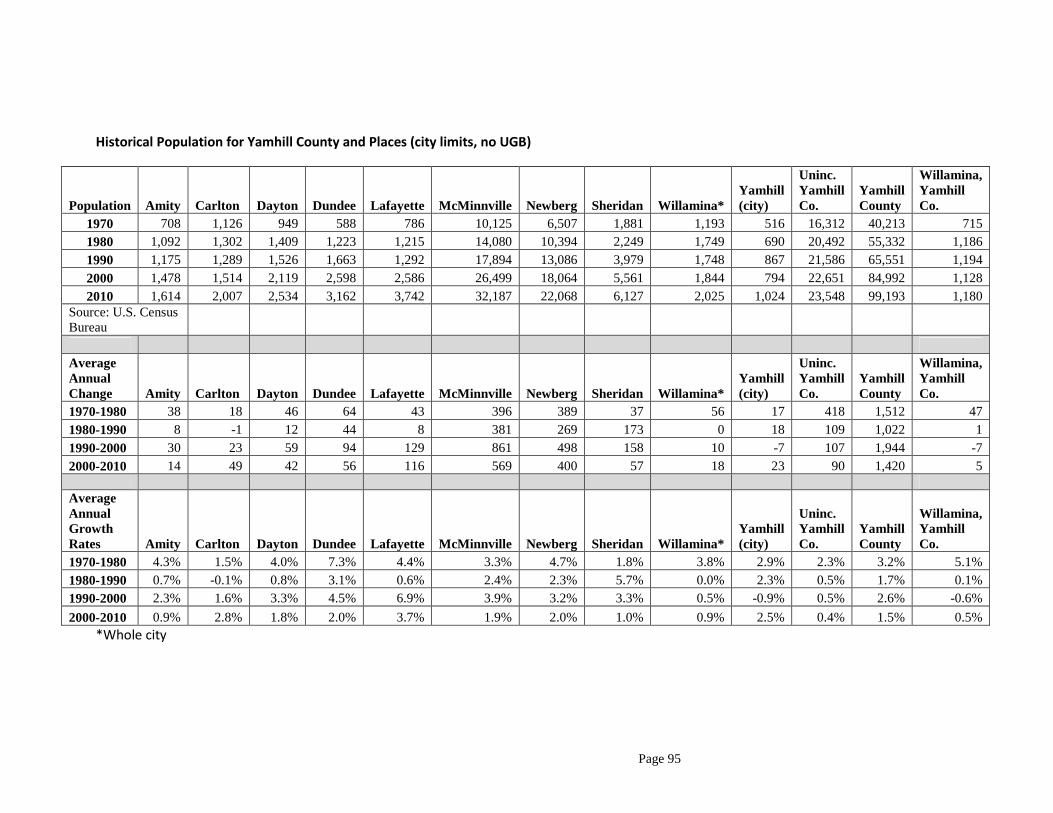
Page 95
Historical Population for Yamhill County and Places (city limits, no UGB)
Population Amity Carlton Dayton Dundee Lafayette McMinnville Newberg Sheridan Willamina* Yamhill (city)
Uninc. Yamhill Co.
Yamhill County
Willamina, Yamhill Co.
1970 708 1,126 949 588 786 10,125 6,507 1,881 1,193 516 16,312 40,213 715 1980 1,092 1,302 1,409 1,223 1,215 14,080 10,394 2,249 1,749 690 20,492 55,332 1,186
1990 1,175 1,289 1,526 1,663 1,292 17,894 13,086 3,979 1,748 867 21,586 65,551 1,194
2000 1,478 1,514 2,119 2,598 2,586 26,499 18,064 5,561 1,844 794 22,651 84,992 1,128
2010 1,614 2,007 2,534 3,162 3,742 32,187 22,068 6,127 2,025 1,024 23,548 99,193 1,180 Source: U.S. Census Bureau
Average Annual Change Amity Carlton Dayton Dundee Lafayette McMinnville Newberg Sheridan Willamina*
Yamhill (city)
Uninc. Yamhill Co.
Yamhill County
Willamina, Yamhill Co.
1970-1980 38 18 46 64 43 396 389 37 56 17 418 1,512 47
1980-1990 8 -1 12 44 8 381 269 173 0 18 109 1,022 1
1990-2000 30 23 59 94 129 861 498 158 10 -7 107 1,944 -7
2000-2010 14 49 42 56 116 569 400 57 18 23 90 1,420 5 Average Annual Growth Rates Amity Carlton Dayton Dundee Lafayette McMinnville Newberg Sheridan Willamina*
Yamhill (city)
Uninc. Yamhill Co.
Yamhill County
Willamina, Yamhill Co.
1970-1980 4.3% 1.5% 4.0% 7.3% 4.4% 3.3% 4.7% 1.8% 3.8% 2.9% 2.3% 3.2% 5.1%
1980-1990 0.7% -0.1% 0.8% 3.1% 0.6% 2.4% 2.3% 5.7% 0.0% 2.3% 0.5% 1.7% 0.1% 1990-2000 2.3% 1.6% 3.3% 4.5% 6.9% 3.9% 3.2% 3.3% 0.5% -0.9% 0.5% 2.6% -0.6%
2000-2010 0.9% 2.8% 1.8% 2.0% 3.7% 1.9% 2.0% 1.0% 0.9% 2.5% 0.4% 1.5% 0.5% *Whole city

Page 96
Appendix 9
Email Comments about the Preliminary Population Forecasts
(The preliminary population forecasts and a draft report were made available to the public on September 5, 2012. The following comments were received via email regarding the
forecast results. Feedback about the forecasts were received from four sources.)
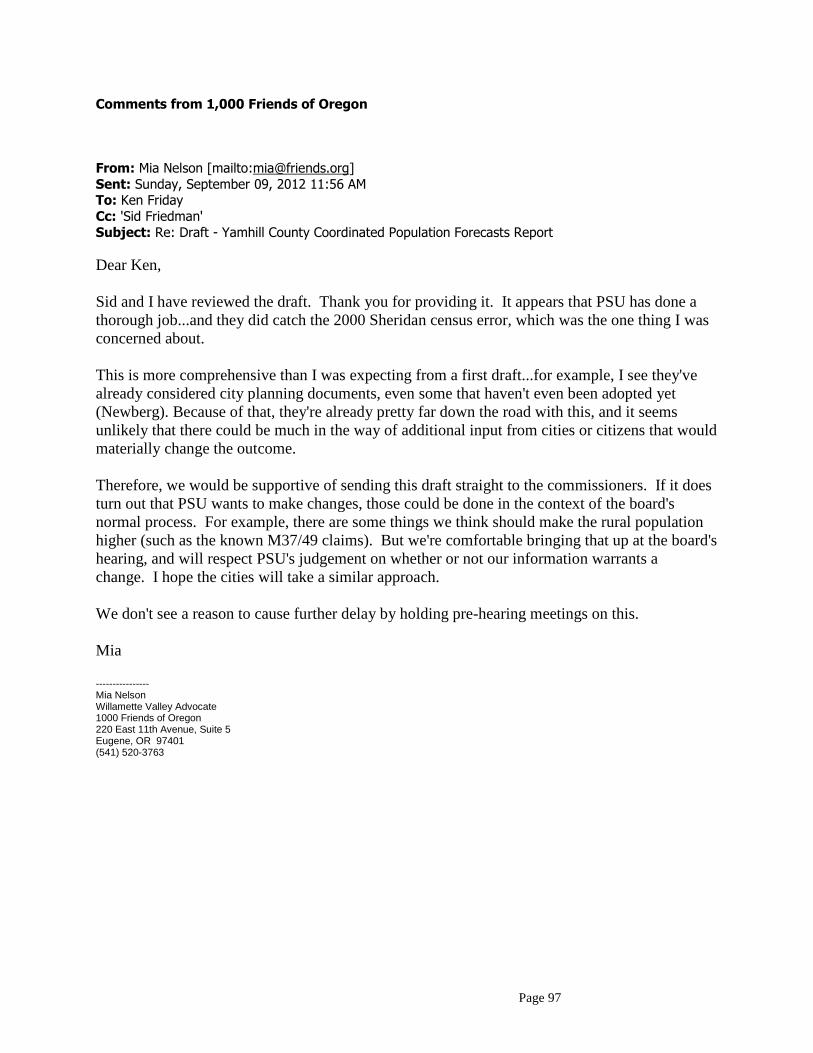
Page 97
Comments from 1,000 Friends of Oregon
From: Mia Nelson [mailto:[email protected]]
Sent: Sunday, September 09, 2012 11:56 AM To: Ken Friday
Cc: 'Sid Friedman'
Subject: Re: Draft - Yamhill County Coordinated Population Forecasts Report
Dear Ken, Sid and I have reviewed the draft. Thank you for providing it. It appears that PSU has done a thorough job...and they did catch the 2000 Sheridan census error, which was the one thing I was concerned about. This is more comprehensive than I was expecting from a first draft...for example, I see they've already considered city planning documents, even some that haven't even been adopted yet (Newberg). Because of that, they're already pretty far down the road with this, and it seems unlikely that there could be much in the way of additional input from cities or citizens that would materially change the outcome. Therefore, we would be supportive of sending this draft straight to the commissioners. If it does turn out that PSU wants to make changes, those could be done in the context of the board's normal process. For example, there are some things we think should make the rural population higher (such as the known M37/49 claims). But we're comfortable bringing that up at the board's hearing, and will respect PSU's judgement on whether or not our information warrants a change. I hope the cities will take a similar approach. We don't see a reason to cause further delay by holding pre-hearing meetings on this. Mia ---------------- Mia Nelson Willamette Valley Advocate 1000 Friends of Oregon 220 East 11th Avenue, Suite 5 Eugene, OR 97401 (541) 520-3763

Page 98
Comments regarding Willamina’s forecast The Portland State University responses to these questions and comments are in CAPS directly following each item.
From: Mattson, Marjorie [mailto:[email protected]] Sent: Thursday, September 13, 2012 3:56 PM To: Ken Friday Cc: Hollis, Sue; Debbie Bernard Subject: Draft pop rpt - general and Willamina comments
Ken - I read through the PSU population document.
First, I will start with some general comments. The Unemployment figure listed on Page 26 does not include a date. One could assume that it is 2011 after reading the comparison to 2000. However, I wondered if the opening sentence needs to include a year. YES, INCLUDING THE YEAR IS IMPORTANT - WE ADDED '2011' TO THE SENTENCE.
And, the next paragraph—unless I missed it, the acronym ACS does not appear to be noted earlier in the text. I realize that it is listed at the end of the document. ON PAGE TWENTY-FOUR THERE WAS ALSO THE ACRONYM, 'ACS'. WE ADDED THE COMPLETE NAME AT THIS REFERENCE.
Page 31, 2nd paragraph, 5th line, aging is misspelled—no “e”. AGEING IS A PROPER ALTERNATE SPELLING OF AGING. THANK YOU FOR POINTING OUT THE INCONSISTENCY - I CHANGED THE SPELLING TO MATCH THE OTHER REFERENCES TO THIS ADJECTIVE IN THE REPORT.
Again—unless I missed it, I did not gather why the expectation is that the economy will recover but notes a year of 2015. Is it only assuming there will be such a change based a net migration? (example on page 31) THIS IS AN ASSUMPTION MADE BASED ON ECONOMIC INDICATORS AND THE GENERAL OPINION OF SOME ECONOMISTS AND OTHERS THAT THE ECONOMY IS STARTING TO IMPROVE A BIT (THOUGH IT IS MUCH MORE SLUGGISH THAN ANTICIPATED OR HOPED FOR IN THE LAST COUPLE OF YEARS) AND THAT IT WILL PICK UP MOMENTUM IN THE NEAR TERM (WITHIN A

Page 99
FEW YEARS) RATHER THAN NOW OR IN THE LONG TERM (IT WONT TAKE 15-20 YEARS TO RECOVER).
If the document is not printed in color (page 38)—the charts are hard to read. I AGREE IT IS, AND THE LEGENDS ARE IN THE SAME ORDER AS THE SERIES APPEAR IN THE GRAPHS TO HELP WITH THE INTERPRETATION.
Page 47, first line—is data plural or should the text read “data WAS not available” or “data SETS were not available.” TECHNICALLY THE WORD 'DATA' IS PLURAL; HOWEVER, IT HAS BECOME ACCEPTED TO SINGULARIZE IT IN GRAMMAR BECAUSE SO MANY PEOPLE DO IT. MOST OF US WHO WORK WITH DATA HERE AT THE CENTER USUALLY KEEP IT PLURAL, THOUGH.
Only 5 cities are listed on pages 35-36. I know that Dayton is mentioned on page 34 but so was Lafayette. No separate “call outs” for the other three or an explanation as to why they are not assessed—Amity, Carlton, Dayton? ALL 8 SMALLER CITIES ARE LISTED ON PAGES 34-36; AMITY, CARLTON, AND DAYTON ARE LISTED ON PAGE 34; DUNDEE, LAFAYETTE, SHERIDAN, WILLAMINA ARE LISTED ON PAGE 35; AND YAMHILL (ALONG WITH THE NON-UGB UNINCORPORATED AREA) IS LISTED ON PAGE 36.
And then responses more specific to the City of Willamina . . .
There was a delay in the City of Willamina returning the requested information/form to PSU/PRC. On page 35 there is an assessment of the City with the date on the draft document as August 2012 and would therefore not include additional details sent last week. Will PSU/PRC change this paragraph based upon more details? One concern I am raise is that a statement included notes lack of “planned development” and the City has several subdivisions that were earlier approved but no housing has been constructed and they are located in the Yamhill County portion of the City. WE WILL LIKELY REVISE THE PARAGRAPH PERTAINING TO WILLAMINA AFTER WE REVISE WILLAMINA'S FORECAST. THE REVISION WILL BE BASED ON DATA SUBMITTED BY WILLAMINA AFTER THE PRELIMINARY FORECASTS AND DRAFT REPORT WERE CIRCULATED. FOR NOW, IN THE LATEST REVISION, WE ADDED THE WORD, 'MUCH' REFERRING TO NOT MUCH PLANNED DEVELOPMENT.
Page 100
Okay, and then I would like to know WHAT happened to the Willamina numbers—an increase of 13 people in 23 years in the Yamhill County portion—really (page 58)? And Average Annual Growth Rates of .2%, .3%, and .4% over the years between 2012 and 2035 (page 59)? Please see the attached email regarding the discussions when the City of Newberg was working on the calculations. THE INCREASE LISTED ON PAGE 58 ADDS UP TO 61 PERSONS OVER THE 23 OR 24 YEARS, NOT 13. THE NUMBERS SHOWN IN THE TABLE ON PAGE 58 SHOW AVERAGE ANNUAL CHANGE: 3 TIMES 3 YEARS, PLUS 2 TIMES 5 YEARS, PLUS 2 TIMES 5 YEARS, PLUS 2 TIMES 5 YEARS, PLUS 4 TIMES 5 YEARS = 59; WITHOUT ROUNDING THE NUMBERS ADD TO 61, WHICH IS THE NUMBER WE REPORT FOR THE 2011-2035 PERIOD CHANGE (PAGE 41, TABLE 10).
THE AVERAGE NUMBER OF PERSONS ADDED DURING THE WHOLE 24 YEAR PERIOD IS 3 AND IS ALSO SHOWN ON PAGE 41, TABLE 10 (ACTUALLY 2.5 PER YEAR WITHOUT ROUNDING). IN THE ATTACHMENT YOU INCLUDED WITH YOUR EMAIL COMMENTS ABOUT THE 2031 POPULATION PROJECTION FOR WILLAMINA IN YAMHILL CO., THE AVERAGE NUMBER OF PERSONS ADDED DURING THE FORECAST PERIOD CALCULATES TO BE 27 PER YEAR (1,752 IN 2031 MINUS 1,180 IN 2010 = 572; 572 DIVIDED BY 21 YEARS = 27.2 PERSONS PER YEAR). ACCORDING TO HISTORICAL CENSUSES, DURING THE LAST THREE DECADES (FROM 1980-2010) THE AVERAGE NUMBER OF PERSONS ADDED PER YEAR TO WILLAMINA'S POPULATION IN YAMHILL COUNTY WAS 0 (ACTUALLY -0.2). IN THE 1970S, THERE WAS A BOON WHEN AN AVERAGE OF 47 PERSONS WERE ADDED YEARLY. WE SURMISED THIS INCREASE IN THE 1970S WAS DUE TO AN INCREASE IN ACTIVITY OF THE TIMBER INDUSTRY, WHICH LEVELED OFF OR DECLINED AFTERWARD SINCE POPULATION GROWTH HALTED, AND DURING THE 1990S, THERE WAS A DECREASE IN POPULATION BY AN AVERAGE OF 7 FEWER PERSONS RESIDING IN WILLAMINA YAMHILL CO. EACH YEAR (-7 PERSONS PER YEAR FROM 1990 TO 2000).
WE DID NOT HAVE ANY INFORMATION FROM WHICH TO BASE ACCELERATED FUTURE HOUSING OR POPULATION GROWTH WHEN WE PREPARED THE PRELIMINARY FORECASTS. AS YOU KNOW, WE SINCE HAVE RECEIVED SOME HOUSING DEVELOPMENT INFORMATION FROM WILLAMINA, AND WE ARE WAITING FOR A RESPONSE TO OUR INQUIRY ABOUT SUBDIVISION DETAILS. WE ARE CONSIDERING REVISING WILLAMINA'S FORECAST UP A BIT BASED ON NEW INFORMATION ON THE NUMBER OF PLATTED VACANT RESIDENTIAL TAX LOTS, HOWEVER, WE HAVE NO RATIONALE OR EVIDENCE ON WHICH TO BASE A FORECAST AS HIGH AS THE ONE FOR 2031 IN THE ATTACHEMENT YOU SENT.

Page 101
Unless there is not a correlation between the charts—the math does not work.
Page 57 – Willamina – YC County portion 2011 =’s 1,180 plus 13 (page 58) equals 1,193 and the PSU 2035 forecast is 1,241 (page 57)
Page 57 – Willamina – full City 2011 =’s 2,057 plus 27 (page 58) equals 2,084 and the PSU 2035 forecast is 2,200 (page 57) PLEASE SEE MY EXPLANATION FOR THE ITEM DIRECTLY ABOVE. THE SAME EXPLANATION FOR READING THE TABLE ON PERTAINS TO WILLAMINA FULL CITY AND ALL OF THE OTHER FORECASTS.
I read in the draft document mention of “rounding” numbers but the above seems like too much of a discrepancy. Please help if I am not reading charts correctly. PLEASE SEE MY EXPLANATION FOR THE ITEM ABOVE.
Larger areas available for residential development are within the Yamhill County portion so more likely the area that will grow. WE ARE TAKING THIS SITUATION INTO CONSIDERATION. PLEASE SEE MY COMMENTS ABOVE ABOUT REVISING WILLAMINA'S FORECAST.
There is no Willamina “sheet” entitled “Information Considered to Develop Housing and Population Forecasts” and may be a factor in the development of the above numbers. I do believe that Risa at PSU/PRC has since received the information this month. YES, WE RECENTLY RECEIVED INFORMATION SO THAT WE WILL INCLUDE A WILLAMINA "SHEET' IN APPENDIX 4 FO THE REPORT.
The school district numbers need to be reconsidered because the listed source is incorrect. They City is not part of the Sheridan School District. Willamina District consolidated its elementary, middle, and high school facilities to one campus last year and are now located in the northeast corner and within City limits. WE CORRECTED THE NOTE BENEATH THE TABLE FOR WILLAMINA YAMHILL COUNTY IN APPENDIX 5. THIS WAS A CASE OF COPY AND PASTING THE WRONG NOTE UNDER THE TABLE FOR WILLAMINA YAMHILL COUNTY. IT NOW READS THE SAME AS THE NOTE FOR WILLAMINA FULL CITY. THE NUMBERS ARE CORRECT.
Thanks for your help in sharing the above comments and adding any explanations that are available to you. Please let me know if I need to clarify any of the above comments. I am in the
Page 102
office until about 4:30 today and then back on part of Monday following an a.m. appointment and I also have an afternoon meeting. I also plan to here Tuesday and Thursday—18th and 20th. AGAIN THANKS FOR YOUR FEEDBACK.
My direct line is 503-540-1617 if it is easier to have a discussion by telephone. MM
Willamina email YC pop discussion.pdf
842K View Download The printed attachment begins on the next page.

Page 103
Willamina email attachment: YC pop discussion.pdf

Page 104

Page 105
Page 106
Comments from Newberg
From: Barton Brierley [mailto:[email protected]]
Sent: Monday, September 24, 2012 9:19 AM To: Ken Friday
Subject: RE: PSU Population Report - Draft 4
I had one small comment:
On page 4, it says, “In general, a small percentage of population resides in any UGB in Yamhill
County.” This is a confusing statement, as about 77% of the population of the County lives inside
UGBs. I think the statement meant to refer to the unincorporated portion of the UGBs.
Barton Brierley, AICP
Planning and Building Director
City of Newberg
P.O. Box 970, Newberg, OR 97132
503-537-1212 Fax 503-537-1272
PSU response: We made the clarification on page 4 of the report.

Page 107
Comments regarding McMinnville’s forecast
From: Doug Montgomery [mailto:[email protected]]
Sent: Thursday, September 20, 2012 4:36 PM To: Ken Friday
Cc: Ron Pomeroy Subject: RE: PSU Population Report - Draft 4
Good afternoon, Ken,
My apologies for not getting comments to you sooner on this draft. I am headed out of town tomorrow
and won’t be back until after the September 24th
deadline, but have asked Ron to review this draft and
provide comment(s) for you in the next day or two. In looking through this briefly this afternoon I do
note that the maps used in the analysis for McMinnville depict an incorrect urban growth boundary (the
boundary that was challenged by 1000 Friends and subsequently remanded by the Courts). This error is
compounded through the draft analysis in that the population figures are based upon this
geography. We would ask PSU to make this correction to the maps and the corresponding population
counts and estimates that appear in the report.
Thanks.
Doug
Doug Montgomery, AICP
Planning Director
City of McMinnville
ph 503.434.7311
fx 503.474.4955
Response from Ken Friday, Yamhill County:
The initial application for the Yamhill County population projection was started on May 12, 2011. At
that time the 2003 McMinnville UGB was used in the analysis. This 2003 UGB amendment was litigated
until March of 2012 when the city decided to drop pursuit of the 2003 UGB amendments. The 2003
UGB was provided to PSU when they started their report in 2012, and the error was not discovered until
the August 2012 draft of the population forecast. Since the area taken out of the UGB was
undeveloped, only a small number of households were removed from the McMinnville UGB. Due to
the negligible difference , and the significant expense of redoing the entire report, the report will not be
amended but the use of the 2003 UGB will simply be noted.
Page 108
PSU response:
To clarify, the UGB used in the McMinnville study area is the proposed UGB that was withdrawn in spring 2012. The proposed UGB is smaller than the actual UGB.
Based on the tax lot data we received from Yamhill County at the onset of this study, we estimate that 30 housing units are affected by the difference in UGBs. Applying the occupancy rate and the average household size that we estimated for McMinnville in 2011, 74 persons were omitted from the McMinnville study area. Including the additional 74 persons in our study might have changed our forecast (likely would have increased the forecast numbers), but by a relatively insignificant amount, as this difference represents less than a fraction of one percent of the base population in McMinnville’s UGB.
We added a footnote in the body of the report (page 2) where we mention the use of UGBs in this study. The footnote says, " The UGB used for McMinnville and its study area was a proposed amended UGB that was withdrawn in spring 2012; all references to the McMinnville UGB in this report pertain to this proposed UGB. See Appendix 9 for additional information about the McMinnville’s UGB."

Page 109
Appendix 10
Adjustments to Preliminary Forecasts

Page 110
Adjustments to Preliminary Forecasts We made an adjustment to Willamina’s forecast based on feedback we received from MWVCOG on behalf of Willamina, and based on our estimate of the number platted tax lots in a few different locations in the Yamhill County portion of the city. We increased Willamina’s forecast and transferred a bit of the forecast population growth from the Polk County portion of the city to the Yamhill County portion. The 2035 forecast population in the Yamhill County portion of Willamina is 185 persons higher than in the preliminary forecast, and 161 higher than the preliminary forecast for Willamina as a whole. The amount of increase in Willamina’s forecast (only the Yamhill County portion of the city) was added to the County forecast. The County’s forecast was insignificantly impacted, and the forecasts for the other cities and the unincorporated area were not affected by this revision.

Page 111
This page is intentionally left blank.