population element - lasvegasnevada.govedisp/tst002673.pdf · 6. population by age ... some of the...
TRANSCRIPT


Po
pu
lati
on
Ele
me
nt
Population Element;MPlans;indd;rs 02/17/10
The City of Las Vegas Population Element
of the Las Vegas 2020 Master Plan
was adopted by City Council
on February 17, 2010 (Ordinance #6078)

Ta
ble
of
Co
nte
nts
Population Element;MPlans;indd;rs 02/17/10 page i
CITY OF LAS VEGAS POPULATIONTABLE OF CONTENTS
EXECUTIVE SUMMARY ............................................................................................................. 1
Implementation ..........................................................................................................................2
INTRODUCTION ......................................................................................................................... 3
Purpose ..........................................................................................................................................3
Enabling Legislation ..................................................................................................................3
Planning Context ........................................................................................................................4
Relationship to Master Plan ....................................................................................................4
Goals, Objectives and Policies ................................................................................................5
POPULATION ANALYSIS .......................................................................................................... 9
Population Growth .....................................................................................................................9
Population Change: Migration and Natural Increase ..................................................10
Population Estimates ..............................................................................................................12
Population Density ..................................................................................................................15
Age .................................................................................................................................................17
Race and Ethnicity ....................................................................................................................20
Housing ........................................................................................................................................21
Education ....................................................................................................................................25
Income and Employment ......................................................................................................26
Transportation ...........................................................................................................................29
PROJECTIONS FOR FUTURE CHANGE .............................................................................33
Regional Forecast .....................................................................................................................33
City of Las Vegas Forecast ......................................................................................................34
Vacant Land, Institutional Constraints and Build-Out .................................................36
Potential for Natural Resource Constraints .....................................................................41
IMPLEMENTATION ...................................................................................................................45
Recommendations ...................................................................................................................45
PLANNING AREAS ...................................................................................................................47
Downtown Reurbanization Area ........................................................................................47
Neighborhood Revitalization Area.....................................................................................49
Newly Developing Areas ........................................................................................................51
City of Las Vegas........................................................................................................................53
APPENDIX ...................................................................................................................................55

Ta
ble
of
Co
nte
nts
Population Element;MPlans;indd;rs 02/17/10page ii
TABLES
1. Population Change ....................................................................................................9
2. Components of Population Change, 2000 – 2007,
Clark County, Nevada ..............................................................................................11
3. Clark County Population Estimates ....................................................................13
4. City of Las Vegas Historical Population Estimates.........................................14
5. Population by Age by Census Year .....................................................................17
6. Comparable Size Cities ...........................................................................................17
7. Person Per Household .............................................................................................22
8. Household Type ........................................................................................................23
9. Homeownership by Age ........................................................................................23
10. Homeownership by Race and Ethnicity ...........................................................24
11. Education by Race and Ethnicity .........................................................................25
12. Clark County Grade School Enrollment by Race and Ethnicity ................26
13. Employment by Industry – Las Vegas ...............................................................27
14. Employment by Occupation .................................................................................27
15. Unemployment Rate by Race ...............................................................................28
16. Median Household Income by Age ...................................................................28
17. Median Household Income by Race and Ethnicity.......................................29
18. Mean travel Time to Work ......................................................................................30
19. Private Vehicle Occupancy ....................................................................................30
20. Place of Work ..............................................................................................................31
21. Historical and Projected Clark County Population .......................................33
22. City of Las Vegas Population Projections Using Share Method ...............35
23. Projected Population on Vacant Land – Planned for
Residential Development ......................................................................................41
24. Reurbanization Demographics ............................................................................48
25 Neighborhood Revitalization Demographics ................................................50
26. Newly Developing Area Demographics ...........................................................52
27. City of Las Vegas Demographics .........................................................................54
FIGURES
1. Change in Population and Employment ..........................................................10
2. Comparison of Population Estimates in Clark County ................................13
3. City of Las Vegas Historical Population Estimates.........................................14
4. Population Density ...................................................................................................16
5. Age Pyramid ...............................................................................................................18
6. Population by Age ....................................................................................................19
7. Race and Ethnicity by Age by Census Year ......................................................20
8. Housing Units by Type ............................................................................................21
9. Home Ownership Rates by Year ..........................................................................24
10. Institutional Constraints to Physical Expansion .............................................40

Ex
ecu
tiv
e S
um
ma
ry
Population Element;MPlans;indd;rs 02/17/10 page 1
EXECUTIVE SUMMARYThe purpose of this document is to meet the require-
ments of state statute, and to provide an understanding of the people who live in Las Vegas. The story of the people of Las Vegas is one of stability within a dynamic, rapidly changing environment. Stability comes from those who live in Las Vegas. According to Census 2000, 68 percent of the population has lived in the same county since 1995. However, adjusting for new residents between 1995 and 2000 reveals that 87% of the population who lived in Las Vegas in 1995, were still there in 2000. On average, approximately 25,000 changes in house-holds (new resident or moved to different home within Clark County) per year occurred between 1995 and 2000. Between 2000 and 2007 the average was approximately 22,000 per year.
Change comes from those moving to Las Vegas. The City added 83,952 to its population between 2000 and 2007. This change adds to the excitement of living in one of America’s most dynamic, culturally diverse Cities. Some of the highlights of the people who live in Las Vegas, and the change that is oc-curring, are mentioned below.
• Between 1990 and 2000, Las Vegas went from being the 63rd largest city in the United States to being the 32nd largest city. Among the cities Las Vegas vaulted past dur-ing the ten-year span were Atlanta, GA, Minneapolis, MN, Cleveland, OH and St. Louis, MO. Since 2000, Las Vegas passed Louisville, KY, Oklahoma City, OK, Portland, OR, and Tucson, AZ on its way to becoming the 28th largest city in the United States.
• The influx of new residents has created a more diverse city. Greater than 80 percent of the population increase between 1990 and 2000 was due to migration from out-side Clark County. That figure decreased to approximately 76 percent since 2000. The growing population has not meant a loss of stability in the City’s neighborhoods, how-ever, as the percentage of people who have been in the community (their home or another home within Clark County) for five years or more increased between 1990 and 2000.
• The rate of home ownership increased steadily between 2000 and 2006 but declined in 2007 due in large part to the increase in foreclosures. Overall, the number of people who own their home increased by 16 percent between 2000 and 2007.
Ex
ecu
tiv
e S
um
ma
ry
Population Element;MPlans;indd;rs 02/17/10page 2
• Education levels of residents have increased, particularly levels of higher education. The number of Las Vegas resi-dents with high school diplomas increased by 23 percent, while the number of residents with college degrees in-creased by 41 percent since 2000.
• Median Household Income has increased by 23 percent between 2000 and 2007. When adjusted for inflation, Las Vegas residents’ buying power increased by 2.4 percent during the seven year span. Income increased for each race/ethnicity and for residents in every age group.
• For Las Vegas residents who drive to work, the commute time remained under 30 minutes. Private vehicle use to commute to work increased by three percent between 2000 and 2007. At the same time, the rate of people who use Public Transportation to get to work increased nominal-ly (0.2 percent) but their numbers increased by 27 percent.
IMPLEMENTATION
RECOMMENDATION 1: Estimate the City’s population on an annual basis.
• An annual estimate of the City’s population as of July 1st of each year is required by Nevada Administrative Code (NAC) 360.364.
• The annual population estimate determines the number of dwelling units, households, and people within the City limits and assists in determining adequate service provision levels.
• The CLV annual estimate is a component in the formula used by the Nevada State Demographer in determining the annual Governor Certified Population Estimate.
• The annual estimate is a component in determining the City’s share of the Basic City County Relief Tax (BCCRT) and the Supplemental City County Relief Tax (SCCRT) which apportions millions of dollars in revenue to entities within Nevada.
RECOMMENDATION 2: Continue to lead and participate in regional annual population projection programs.
• Participate in the development of the Regional Economic Modeling Inc. population projection model. The REMI model is funded and approved by the SNRPC and is used to deter-mine countywide population projections through 2050. The model output is used as a baseline for population projections at lower levels of geography such as Traffic Analysis Zones (TAZ), ZIP Codes, and individual cities.

Ex
ecu
tiv
e S
um
ma
ry
Population Element;MPlans;indd;rs 02/17/10 page 3
• Continue to lead and participate in the development of the Land Use Work Group (LUWG) model. The LUWG uses cur-rently vacant land to determine future population in Clark County and the cities within by applying a “land use” to parcels that will determine the future population level and offers the ability to determine population at sub-county levels. The LUWG model also determines non-residential uses which allows for the estimation of traffic volume levels and future public and private service provision.
• Aside from uses in planning by various entities, including the city of Las Vegas, the projections are used to determine avail-ability of resources by entities such as the Southern Nevada Water Authority (SNWA) and the Regional Transportation Commission (RTC). The projections also play a major role in demonstrating the Las Vegas Valley’s ability to comply with air quality standards in the coming years which determines future funding from the federal government.
RECOMMENDATION 3: Lead and coordinate local Census programs.
• The decennial Census determines the level of funding Nevada and its municipalities receive from the Federal government for ten years.
• The Census determines a states numbers in the House of Representatives and the number of electoral votes for presi-dential elections.
• Census information is invaluable to planners, and helps to establish the identity of a community.
• Inter-censal estimates – annual updates of population conduct-ed by the U.S. Census Bureau – determine the level of fund-ing for local social and community oriented programs such as CDBG and other grant reliant programs. Entities have the abil-ity to appeal these estimates if they are felt to be inaccurate.
Recommendation 4: Annually monitor “outside” sources of population and demographic data that can impact the City.
• Monitor U.S. Census data, specifically the American Community Survey for changes in characteristics of the City’s population such as Race and Ethnicity, Age, and Language Spoken at Home that can impact service provision.
• Evaluate sources of population estimates and projections such as the Nevada State Demographer for changes that impact the City. The locally developed estimate, mentioned in Recommendation 1, comprises half of the formula used to develop the State Demographer’s population estimate which is a component of the formula used to determine funding levels throughout the state.

Ex
ecu
tiv
e S
um
ma
ry
Population Element;MPlans;indd;rs 02/17/10page 4
RECOMMENDATION 5: Establish population/service level database.
• Develop databases with historical and current population figures and historical and current infrastructure levels that will allow for analysis of future needs:
• Per the Public Safety Element, build a new police substa-tion to equal one (1) per 125,000 population
• Per the Transportation Trails Element, develop between 3.75 and 5.68 miles of trails per 100,000 population
• Per the Parks & Recreation Element: • develop 2.5 acres of park space per 1,000 popula-
tion • build one (1) Neighborhood Center per 10,000
population • build one (1) Community Center per 25,000 popula-
tion • build one (1) Regional Center per 75,000 population

page 5
Intr
od
uct
ion
Population Element;MPlans;indd;rs 02/17/10
INTRODUCTION
PURPOSE
The purpose of the Population Element is twofold. First, this document is intended to fulfill the requirements of state law, as set forth in the Nevada Revised Statutes (NRS) 278.150 through 278.160, and second, to recommend strategies and actions to facilitate the implementation of the goals, objec-tives, and policies contained in the Las Vegas 2020 Master Plan related to population growth.
The Population Plan must accomplish the following:
• Identify future availability of resources vital to supporting population.
• Identify demographic characteristics that impact popula-tion growth.
• Identify population thresholds based on future land use.
• Prepare a table of potential population scenarios.
ENABLING LEGISLATION
The Nevada Revised Statutes (NRS) adopted by the Nevada State Legislature in 2001, made effective in 2002, gov-ern the subject matter of the master plan. Subsection 4 of NRS 278.150 (4) states
In counties whose population is 400,000 or more, the governing body of the city or county shall adopt a master plan for all of the city or county that must address each of the sub-jects set forth in subsection (1) of NRS 278.160.
The subject matter of the master plan in NRS 278.160 states:
Except as otherwise provided in Subsection 4 of NRS 278.150 and Subsection 3 of NRS 278.170, the master plan, with the accompanying charts, drawings, diagrams, schedules and reports, may include such of the following subject mat-ter or portions thereof as are appropriate to the city, county or region, and as may be made the basis for the physical develop-ment thereof.

page 6
Intr
od
uct
ion
Population Element;MPlans;indd;rs 02/17/10
Among the elements to be included in the master plan as required by NRS is a Population Plan, adopted by the Nevada Legislature in 1991:
(g) “An estimate of the total population which the natural resources of the city, county or region will support on a con-tinuing basis without unreasonable impairment.”
Preparation and adoption of this Population Element ful-fills the City’s statutory obligation to include a population plan in its Master Plan.
PLANNING CONTEXT
The Population Element will replace the Population Plan in the 1992 Las Vegas General Plan. The Population Plan updates the existing plan and addresses current legislation, specifi-cally, NRS 278.150, the requirements of which pertaining to the Population Element are shown in the Enabling Legislation section. In addition, the downturn in the Las Vegas economy requires reassessing future population growth.
The Population Element is a portion of the Master Plan, adopted in September 2000, which represents Phase I of the Master Plan project, forming the framework for the contents of Phase II: a series of elements; special area plans; and long-term land use designations, including a revised future land use map. The Population Element is among those identified for comple-tion during Phase II of the Master Plan project.
RELATIONSHIP TO THE LAS
VEGAS 2020 MASTER PLAN
The Master Plan contains numerous goals, objectives, and policies pertaining directly and indirectly to Population Planning. As a component of the Master Plan, the Population Element is intended to not only satisfy NRS requirements, but also to provide a comprehensive document that will assist with the long-range planning of the future growth to meet the needs of the city as it continues to grow. This element provides a baseline of detailed information that will aid in the decision making processes that determine the city’s ability to continue to grow without undue strain on available natural resources. The Population Element links the broad policies of the Master Plan with growth and resource programming and ultimately assists in the decision making process.

page 7
Intr
od
uct
ion
Population Element;MPlans;indd;rs 02/17/10
GOALS, OBJECTIVES AND POLICIES
The Master Plan outlines broad policies, while each individual ele-ment builds on those policies and provides the specific direction as to how the city should accommodate particular Population issues. The Master Plan policies are organized into seven themes developed by the Master Plan Steering Committee. Realization of these policies requires long-term planning commitments integrated with the strategic plan.
The following goals, objectives and policies from the Las Vegas 2020 Master Plan provide the policy framework and direction for this element.
REURBANIZATION
GOAL 1: The Downtown area will emerge as the preeminent hub of business, residential, govern-ment, tourism and gaming activities in the city of Las Vegas and as a major hub of such activities in the Las Vegas Valley.
OBJECTIVE 1.8: To ensure that the needs of the homeless are addressed in a manner which is compatible with the other long range objectives for the Downtown.
POLICY 1.8.3: That the City identify and evaluate the core issues that create a home-less population, and attempt to address those issues to the extent possible.
NEWLY DEVELOPING AREAS
GOAL 3: Newly developing areas of the city will contain adequate educational facilities and rec-reational and open space and be linked to major employment centers by mass transit, including buses, and by trails.
OBJECTIVE 3.1: To ensure that new residential subdivisions , with the exception of areas currently designated as rural preservation neighborhoods by Nevada statute, are developed into walkable communities, where reliance on auto trips for convenience shopping and access to education and recreation is minimized, and where development densi-ties support transit.
POLICY 3.1.2: That new residential neighborhoods emphasize pedestrian linkages within the neighborhood, ready access to transit routes, linkages to schools, integration to local service commercial activities within a neighborhood center that is within walking distance of homes in the neighborhood.
REGIONAL COORDINATION
GOAL 7: Issues of regional planning significance, requiring the city of Las Vegas to coordinate with other government entities and agencies within the Valley, will be addressed in a timely fashion.
OBJECTIVE 7.1: To ensure that the natural resources of the City, particularly those that directly support and enhanced quality of life for its residents, are protected.

page 8
Intr
od
uct
ion
Population Element;MPlans;indd;rs 02/17/10
POLICY 7.1.1: That air quality throughout the City be improved through the reduction of carbon monoxide from automotive emissions and through the reduction of dust particulates.
POLICY 7.1.3: That the City work with the Las Vegas Valley Water District to ensure that the quality of the City’s drinking water remains high, while maintaining an adequate water supply at reasonable cost.
POLICY 7.1.5: That the City takes the necessary steps to monitor and evaluate the quality of stormwater discharge, and ensure measures are taken to improve the quality where appropriate.
POLICY 7.1.8: That the City encourage water conservation.

Po
pu
lati
on
An
aly
sis
Population Element;MPlans;indd;rs 02/17/10 page 9
POPULATION ANALYSIS
POPULATION GROWTH
Census 2000 revealed a population of 478,630 in Las Vegas. The City’s population increased by more than 93,000 in the 1980s, and added another 220,000 between 1990 and 2000 for an increase of 85% during the decade. The numeric popula-tion change was fourth highest in the nation among all cities; the top three were New York, Phoenix and Houston. According to the U.S. Census Bureau, the City’s percentage increase was 10th highest among cities with over 100,000 people. In fact, Las Vegas climbed the ranks of large cities in the U.S. growing from 63rd largest in 1990 to 32nd by 2000. Since Census 2000, the City has continued to add population and climb the ranks of U.S. cities. According to the Census Bureau’s American Community Survey (ACS), Las Vegas had a population of 562,582, an increase of 17.5%, making it the 28th largest city in the U.S in 2007.
Table 1
Population Change
2000
Population
2007
Population
Numeric Change
2000 - 2007
Percent
Change
2000 - 2007
Rate of
Change
2000 - 2007
United States 281,421,906 301,621,159 20,199,253 7.2% 1.00%
Nevada 1,998,257 2,718,337 720,080 36.0% 4.49%
Clark County 1,375,765 1,996,654 620,889 45.1% 5.47%
Las Vegas 478,630 603,093 124,463 26.0% 3.23%
Reurbanization Area 12,932 8,517 (4,415) -34.1% -5.79%
Neighborhood Revitalization Area 204,376 216,192 11,816 5.8% 0.81%
Newly Developing Area 83,511 171,500 87,989 105.4% 10.83%
Source: Year 2000 population and year 2007 U.S. population is from the U.S. Census BureauYear 2007 Nevada population is from the Nevada State DemographerThe remaining year 2007 population figures are from the Southern Nevada Consensus Population Estimate
Historically, more than 80 percent of the County’s total pop-ulation growth has come from net migration (in-migration minus out-migration) as the economy produces jobs that attract workers and as retirees continue to find Las Vegas attractive. Migration to Clark County is shown in Figure 1, which also shows employment changes. Migration appears to be closely related to changes in employment. However, the influx of Seniors, many of whom are retired and not seeking employment, continues to be strong.

Po
pu
lati
on
An
aly
sis
Population Element;MPlans;indd;rs 02/17/10page 10
Figure 1
Change in Population and Employment
POPULATION CHANGE: MIGRATION
AND NATURAL INCREASE
The ratio of births to deaths is much higher for the Hispanic, Black and Asian populations, indicative of a generally younger popu-lation for these race and ethnic groups. As such, changes in jobs/em-ployment may affect these segments of the population more strongly. The birth/death ratio may be indicative of disproportionately high in-migration of White retirees moving to the area. Migration of White retirees to Las Vegas is not tied to employment, at least not as strong-ly, as it is with minorities of all ages. This would suggest that as long as the amenities retirees seek (quality of life, cost of living, etc.) remain favorable, they will continue to move to Las Vegas.
The natural increase in population, that is births minus deaths, accounted for 16 percent of the total population increase in Clark County between 1990 and 2000. Between 2000 and 2007, natural increase accounted for nearly 24 percent of the population increase. Las Vegas is likely to continue to become more diverse in the future. Among Blacks and Hispanics the rate is 36 percent and 26 percent respectively. Perhaps more telling is the ratio of births to deaths. For the population in general the ratio was 2.1 to 1. For Hispanics there were nearly 13 births for each death. Among Whites the ratio was 1.1 to 1, among Blacks it was 2.5 to 1, and among Asians it was 5.1 to 1. Currently, 39.4 percent of the population less than 20 years of age is

Po
pu
lati
on
An
aly
sis
Population Element;MPlans;indd;rs 02/17/10 page 11
Hispanic. Conversely, 72.5 percent of the population 65 years of age and greater are White.
During the three decades 1970 to 2000, the rate of population growth has been approximately 5 to 1 in favor of migrants. While mi-gration to Clark County continued to be the greatest contributor to the areas population increase, accounting for 76 percent of the growth between 2000 and 2007, natural increase saw substantial growth dur-ing that time. In spite of the influx of immigrants to Clark County, nat-ural increase rose substantially between 2000 and 2007, going from 16 percent to nearly 24 percent. Nearly 66 percent of those migrating to Clark County since 2000 were minorities. These data suggest that the minority population is younger and therefore likely to continue to experience a high rate of natural increase in the future. Trends indicate that within the next few years the rate of natural increase for Whites could be flat, meaning that there will be an equal number of births and deaths, perhaps even slightly more deaths than births.
Table 2
Components of Population Change 2000 - 2007, Clark County, Nevada
White Black HispanicAmerican
IndianAsian Other Total
Census 2000 828,669 121,401 302,143 7,761 71,226 44,565 1,375,765
Census 2007 958,018 170,373 511,145 10,174 130,671 55,951 1,836,333
Population Increase 129,349 48,972 209,002 2,413 59,445 11,386 460,568
Percent of Increase 28.1% 10.6% 45.4% 0.5% 12.9% 2.5%
Percent Increase 15.6% 40.3% 69.2% 31.1% 83.5% 25.5% 33.5%
Births 2000 - 2007 84,397 21,272 81,413 1,405 16,607 2,639 209,996
Deaths 2000 - 2007 75,153 8,563 6,310 340 3,278 415 101,133
Natural Increase 9,244 12,709 75,103 1,065 13,329 2,224 108,863
Increase by Migration 120,105 36,263 133,899 1,348 46,116 8,747 351,705
% Natural Increase 7.1% 26.0% 35.9% 44.1% 22.4% 23.2% 23.6%
% Increase by Migrants 92.9% 74.0% 64.1% 55.9% 77.6% 76.8% 76.4%
Sources: State of Nevada Bureau of Health, Planning and Statistics and U.S. Census Bureau, 2007Notes:*Asian includes Native Hawaiian and Pacific Islander (new categories from Census 2000).**”Other” is used to categorize “Unknown” Births and Deaths according to State Health Statistics, and doesn’t necessarily equate with Census “Other”. Also “Two or More Races” is a new category for Census 2000 and has no recorded statistics on births and deaths to date.***Increase of Migrants is the increase in population that is not due to natural causes (births and deaths). The total number of Migrants will not match the breakdown by race due to the problems with the “Other” and “Two or More Races” categories (see notes above).

Po
pu
lati
on
An
aly
sis
Population Element;MPlans;indd;rs 02/17/10page 12
POPULATION ESTIMATES
The six government entities in Clark County (the incorporated cities and the county) are required by Nevada Administrative Code (NAC) Section 360.364 to conduct an annual population estimate. The methodology for the estimate, as agreed upon by the enti-ties and the Southern Nevada Regional Planning Coalition, is the Housing Unit Method (HUM). Under this method, housing units are counted and compared to the Clark County Assessors July 1st closed roll file. As set forth in NAC 360.365.2, the entities are then allowed to make adjustments to the preliminary closed roll housing unit counts. At that point vacancy rates by ZIP Code supplied by NV Energy are applied, giving the number of occupied housing units. The occupied households are then multiplied by the Census 2000 number of Persons Per Household (PPH) by Census Tract, giving the total non-institutionalized population. Group Quarters, Nellis Air Force Base and Tribal populations are then added, yielding the total population.
The Housing Unit method has proven to be an accurate pro-cedure for determining population as evidenced by Table 3. The table shows the U.S. Census Bureau’s unadjusted estimate for Clark County between 1990 and 2007 and the annual locally produced estimate for Clark County and the Nevada State Demographer’s population estimate for the same time. In 1990, the difference between the locally generated population estimate and the Census Bureau was just over 15,000. Over time, as shown in Figure 2, the two estimates diverged. By 1999 there was a difference of more than 100,000 between them. Census 2000 brought the estimates closer as the difference closed to approximately 50,000. Some of the difference, about 18,000 residents, was due to the timing of the estimates. The Census is a count “as of” April 1st, whereas the Clark County estimate is “as of” July 1st. The Census Bureau also produces annual population estimates that are as of July 1st of each year. For 2000 the population as of July 1st was 1,393,340.
The scenario is similar when comparing the Nevada State Demographer’s estimates to the Census Bureau estimates be-tween 1990 and 2007. Only a substantial adjustment in 2000 produces a Census Bureau population in line with Clark County or State Demographer estimates, which until the 2001 estimate displayed little variation. The adjustment by the Census Bureau in 2000 brought the July 1, 2000 population figure to within 35,000 of the Clark County local estimate and within 32,000 of the State Demographer’s estimate. The divergence seen in the 1990’s has surfaced again between 2000 and 2007, growing to a difference of more than 160,000.
Table 4 and Figure 3 show historical population estimates for the City that were generated using the Housing Unit method.

Po
pu
lati
on
An
aly
sis
Population Element;MPlans;indd;rs 02/17/10 page 13
Table 3
Clark County Population Estimates
YearCensus
Bureau
Clark
County
State
Demographer
1990 754,581 770,280 770,280
1991 807,425 820,840 820,840
1992 841,113 856,350 856,350
1993 877,917 898,020 898,020
1994 938,611 971,680 971,680
1995 991,401 1,036,180 1,036,180
1996 1,044,023 1,119,708 1,115,940
1997 1,105,005 1,173,090 1,192,200
1998 1,161,259 1,233,733 1,255,200
1999 1,217,155 1,321,319 1,343,540
2000 1,375,765 1,428,690 1,425,723
2001 1,445,237 1,498,279 1,485,855
2002 1,502,789 1,584,944 1,549,657
2003 1,557,174 1,641,529 1,620,748
2004 1,631,340 1,747,025 1,715,337
2005 1,691,213 1,815,700 1,796,380
2006 1,777,539 1,912,654 1,874,837
2007 1,836,333 1,996,643 1,954,319Sources: U.S. Census Bureau, Clark County Comprehensive Planning, Nevada State Demographer, 2007
Figure 2
Comparison of Population Estimates in Clark County

Po
pu
lati
on
An
aly
sis
Population Element;MPlans;indd;rs 02/17/10page 14
Figure 3
City of Las Vegas Historical Population Estimates
Table 4
City of Las Vegas Historical Population Estimates
Population Percent Change
1960 64,405
1965 107,616 67.1%
1970 125,787 16.9%
1975 149,750 19.1%
1980 164,674 10.0%
1985 197,148 19.7%
1990 275,636 39.8%
1995 374,239 35.8%
2000 482,874 29.0%
2005 575,973 19.3%
2007 603,093 4.7%
Sources: U.S. Census Bureau, Clark CountyComprehensive Planning, 2007

Po
pu
lati
on
An
aly
sis
Population Element;MPlans;indd;rs 02/17/10 page 15
POPULATION DENSITY
The population is distributed across the City at varying densities (Figure 4). The most densely populated areas are in the central downtown and along the Highway 95 corridor to the west and northwest. It is important to note that twice as many people live west of Decatur Boulevard as live east of Decatur Boulevard, and over 96 percent of population growth over the next twenty years is projected to occur in the west and north-west portions of the City.
The increasing densities along U.S. 95 and development throughout the northwest portion of the City indicate a shift in Las Vegas’ population center. Since 1950, the center of popula-tion for the city of Las Vegas has gradually moved in a west-northwesterly direction. By 1960, the center of population had moved only about a quarter of a mile west from its original position in the downtown area. During the next two decades the center of population continued its westward march, moving nearly one and one-half miles. Master planned communities in the west and northwest portions of the city during the 1980s and 1990s proved a powerful force in pulling the population cen-ter another 3 and one-half miles to the west and slightly north. By 2000, the population center was near the Rainbow curve, at Torrey Pines Drive and Washington Avenue, having migrated over 5 miles from its origin. The population has shifted little since 2000 due primarily to residential development in Summerlin offsetting population in the northwest and increased residential development in the City’s downtown area.

Po
pu
lati
on
An
aly
sis
Population Element;MPlans;indd;rs 02/17/10page 16
Figure 4
Population Density
Po
pu
lati
on
An
aly
sis
Population Element;MPlans;indd;rs 02/17/10 page 17
AGE
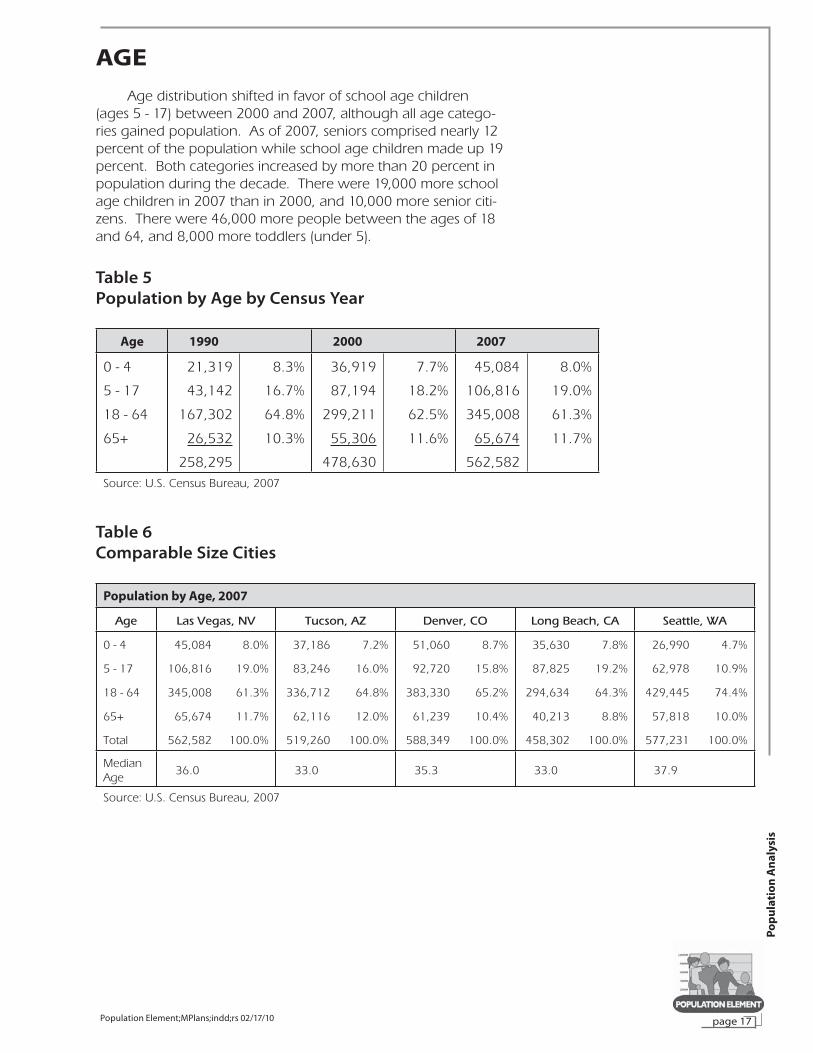
Age distribution shifted in favor of school age children (ages 5 - 17) between 2000 and 2007, although all age catego-ries gained population. As of 2007, seniors comprised nearly 12 percent of the population while school age children made up 19 percent. Both categories increased by more than 20 percent in population during the decade. There were 19,000 more school age children in 2007 than in 2000, and 10,000 more senior citi-zens. There were 46,000 more people between the ages of 18 and 64, and 8,000 more toddlers (under 5).
Table 5
Population by Age by Census Year
Age 1990 2000 2007
0 - 4 21,319 8.3% 36,919 7.7% 45,084 8.0%
5 - 17 43,142 16.7% 87,194 18.2% 106,816 19.0%
18 - 64 167,302 64.8% 299,211 62.5% 345,008 61.3%
65+ 26,532 10.3% 55,306 11.6% 65,674 11.7%
258,295 478,630 562,582 Source: U.S. Census Bureau, 2007
Table 6
Comparable Size Cities
Population by Age, 2007
Age Las Vegas, NV Tucson, AZ Denver, CO Long Beach, CA Seattle, WA
0 - 4 45,084 8.0% 37,186 7.2% 51,060 8.7% 35,630 7.8% 26,990 4.7%
5 - 17 106,816 19.0% 83,246 16.0% 92,720 15.8% 87,825 19.2% 62,978 10.9%
18 - 64 345,008 61.3% 336,712 64.8% 383,330 65.2% 294,634 64.3% 429,445 74.4%
65+ 65,674 11.7% 62,116 12.0% 61,239 10.4% 40,213 8.8% 57,818 10.0%
Total 562,582 100.0% 519,260 100.0% 588,349 100.0% 458,302 100.0% 577,231 100.0%
MedianAge
36.0 33.0 35.3 33.0 37.9
Source: U.S. Census Bureau, 2007

Po
pu
lati
on
An
aly
sis
Population Element;MPlans;indd;rs 02/17/10page 18
Figure 5
Age Pyramid
Figure’s 5 and 6 show the largest age groups are thirty to thirty-nine and the under ten group. The aging baby boomers and retirement-age migrants contribute to an aging Las Vegas population. In 1990 the most populous age category was the upper twenty’s to lower thirties, by 2000 it had advanced to the mid to upper thirties and in 2007 it had advanced to the upper thirties to lower forties. Along with the aging population, it is also important to note that the under 10 category represents a large portion of the population, which will define the future demographics of the City. The decreases in population the City experiences for age groups 20 to 24 and 30 to 34 are a bit of a mystery. It is thought that the decrease at 20 to 24 could be due to people leaving to seek educational and/or job oppor-tunities elsewhere. While the Las Vegas economy is becoming more diversified, it is still intensely service and construction ori-ented. These are often jobs that require less education but offer

Po
pu
lati
on
An
aly
sis
Population Element;MPlans;indd;rs 02/17/10 page 19
limited growth opportunities. The decrease at 30 to 34 could actually be more a function of the increase at 25 to 29 years of age where new residents are joined by people returning to Las Vegas who left for educational and/or other opportunities. In addition, the higher birth rate of those relocating to Las Vegas since the late 1990’s, primarily Hispanics, is likely beginning to be reflected in the population, driving the under 18 years of age population up relative to other age groups. As stated in the Population Growth section of this document, the rate of natural increase in Clark County increased from 16 percent to 24 percent between 2000 and 2007. That wave of population increase may be reflected by an increase in the portion of the population 20 to 24 years of age in the coming years.
Figure 6
Population by Age

Po
pu
lati
on
An
aly
sis
Population Element;MPlans;indd;rs 02/17/10page 20
Figure 7
Race and Ethnicity by Age by Census Year
RACE AND ETHNICITY
A major component of Las Vegas’ population growth since the early 1990’s was the nearly exponential increase in the minority population. Lead by the increase in Hispanics (414%) and Asians (215%) the minority population went from comprising 24 percent of Las Vegas’ popula-tion in 1990 to making up nearly 49 percent of the City’s 2007 total. Traditionally, the Black and Hispanic populations in Las Vegas have been younger. The Black population skewed slightly to-wards younger age groups, the Hispanic population skewed a bit more heavily in that direction. For people under the age of 30 years, nearly 40 percent are Hispanic. The same is true amongst children school age or less (under 18 years of age). Conversely, Las Vegas’ population over the age of 50 years remains predominately White.

Po
pu
lati
on
An
aly
sis
Population Element;MPlans;indd;rs 02/17/10 page 21
HOUSING
As of July 2007 the City of Las Vegas had 232,931hous-ing units. There were 40,252 more housing units in the City than in 2000, for an over-all increase of 20.9 percent. During the 1990’s, the City increased its housing inventory by 60 percent. Some of the reason for the lower rate of increase is that fewer new units are being built. Between 1991 and 2000, the City averaged 8,093 new housing units per year, while from 2000 through 2007 the average was 5,750 new units per year. Another factor in the lower rates is that the City is getting larger, therefore it takes a greater change to cause a signifi-cant difference. For example, had Las Vegas added the same average number of units in the 1990’s as it had between 2000 and 2007, its growth rate would only have decreased from 60 percent to 43 percent.
In 2007, 60.6 percent of the units were single family, reflecting a trend that has seen a larger share of single- fam-ily units being constructed in the City. In 1991, for example, the mix of single family to multi-family units was 51 percent to 46 percent (the remaining 3 percent are mobile homes). By 2000, 57.4 percent of the housing units were single family. The upward trend in single family units is expected to continue, as the majority of units will be constructed in the northwest and southwest where the single family to multi family mix is 80/20 and 60/40, respectively.
Figure 8
Housing Units by Type

Po
pu
lati
on
An
aly
sis
Population Element;MPlans;indd;rs 02/17/10page 22
The overall number of Persons Per Household (PPH) has changed little during the past twenty years and not at all since Census 2000. However, slight changes in the PPH can result in dramatic changes to final Census population and to the City’s annual population estimates for the subsequent ten-year span. The city of Las Vegas and the other entities within Clark County, through an inter-local agreement, use the PPH from the most re-cent Census for their annual population estimates. PPH for sin-gle-family dwelling units has decreased slightly since 1980. Rental households have experienced fairly high increases to PPH during the past twenty years. However, since their relative share of hous-ing units is decreasing, their impact on overall PPH is becoming less significant over time.
Table 7
Persons Per Household
1990 2000 2007
Own 2.72 2.76 2.68
Rent 2.37 2.52 2.63
Total 2.55 2.66 2.66
Source: U.S. Census Bureau, 2007
The number of Persons Per Household has changed, how-ever, within certain areas of the City between 1990 and 2000. In the area east of Downtown PPH has risen. A number of census tracts saw increases of more than 0.5 PPH. While this may not seem significant, an increase of 0.5 PPH for one census tract spread over 2,000 households increases the population by 1,000 without adding any housing units. Conversely, on the west side of town PPH decreased slightly during the ten-year span. In most cases the decrease was less than 0.2 PPH. Again, this would ap-pear to be an insignificant figure. But considering the City added more than 132,000 housing units since 1990 and that more than 90% of those new units are in the west, the change in PPH be-tween 1990 and 2000 becomes a significant factor. A change of between -0.1 PPH and -0.2 PPH would result in 12,540 to 25,080 fewer residents in the area. Overall, the City’s PPH changed by 0.11 between 1990 and 2000. Given the total number of house-holds in the City, a population increase of more than 24,000 can be directly attributed to the overall increase in PPH.
Between 1990 and 2007, household composition in Las Vegas underwent some changes. The percentage of married couple households has declined while single parent headed households, particularly male-headed households, has increased. The percentage of male-headed households has increased by nearly two percent since 1990. Non-family households have maintained their share of about one-third of the total households.

Po
pu
lati
on
An
aly
sis
Population Element;MPlans;indd;rs 02/17/10 page 23
Table 8
Household Type
1990 2000 2007
% % %
Married Couple 49.4 48.3 46.9With children under 18 22.2 21.6 21.9No children under 18 27.2 26.7 25.0
Male head of household 5.0 5.9 6.7With children under 18 2.3 3.0 3.1No children under 18 2. 2.9 3.6
Female head of household 11.6 12.2 12.8With children under 18 7.0 7.3 8.0No children under 18 4.6 4.9 4.8
Non-Family household 34.1 33.5 33.6Total 100.0 100.0 100.0
Total Number of Households 99,944 176,750 209,189
Source: U.S. Census Bureau, 2007
The overall rate of home ownership declined but in-creased for those 65 years of age and over. This may be due in great part to the age restricted community (55+) Sun City where there is no multi-family housing which would lead to few if any rental properties. Home ownership rates increased steadily between 2000 and 2006. The decline in home owner-ship rates since 2006 is due to the economic downturn which caused an increase in the number of foreclosures. The eco-nomic downturn also caused the lending market to tighten restrictions on loans, making home ownership more difficult.
Table 9
Homeownership by Age
Age 1990 2000 2007
15 to 24 13.7% 18.2% 13.7%
25 to 34 37.2% 44.9% 33.5%
35 to 44 52.4% 58.2% 60.2%
45 to 54 58.6% 64.7% 64.1%
55 to 64 64.7% 70.1% 68.0%
65 to 74 62.7% 74.1% 77.3%
75 and over 54.0% 68.0% 66.1%
Total 50.4% 59.1% 57.8%Source: U.S. Census Bureau, 2007

Po
pu
lati
on
An
aly
sis
Population Element;MPlans;indd;rs 02/17/10page 24
Figure 9
Home Ownership Rates by Year
Between 2000 and 2007 the number of homeowners increased by more than 20,000 in Las Vegas. At the same time, the rate of home ownership went from approximately 59 percent to just under 58 percent. The rate of home owner-ship increased among Whites and Asians during the span. The rate of home ownership among Blacks decreased slightly and remained about the same as in 2000 for Hispanics.
Table 10
Homeownership by Race and Ethnicity
2000 2007
Own Rent Own Rent
White 63.7% 36.3% 66.1% 33.9%
Black 38.0% 62.0% 34.9% 65.1%
American Indian 42.9% 57.1% 57.1% 42.9%
Asian 62.4% 37.6% 65.9% 34.1%
Pacific Islander* - - - -
More than one race 49.0% 51.0% 49.0% 51.0%
Hispanic** 46.6% 53.4% 46.6% 53.4%
Total 59.1% 40.9% 57.8% 42.2%
* Insufficient observations** Hispanic is an ethnicity and can be of any race.Source: U.S. Census Bureau, 2007
Po
pu
lati
on
An
aly
sis
Population Element;MPlans;indd;rs 02/17/10 page 25
EDUCATION
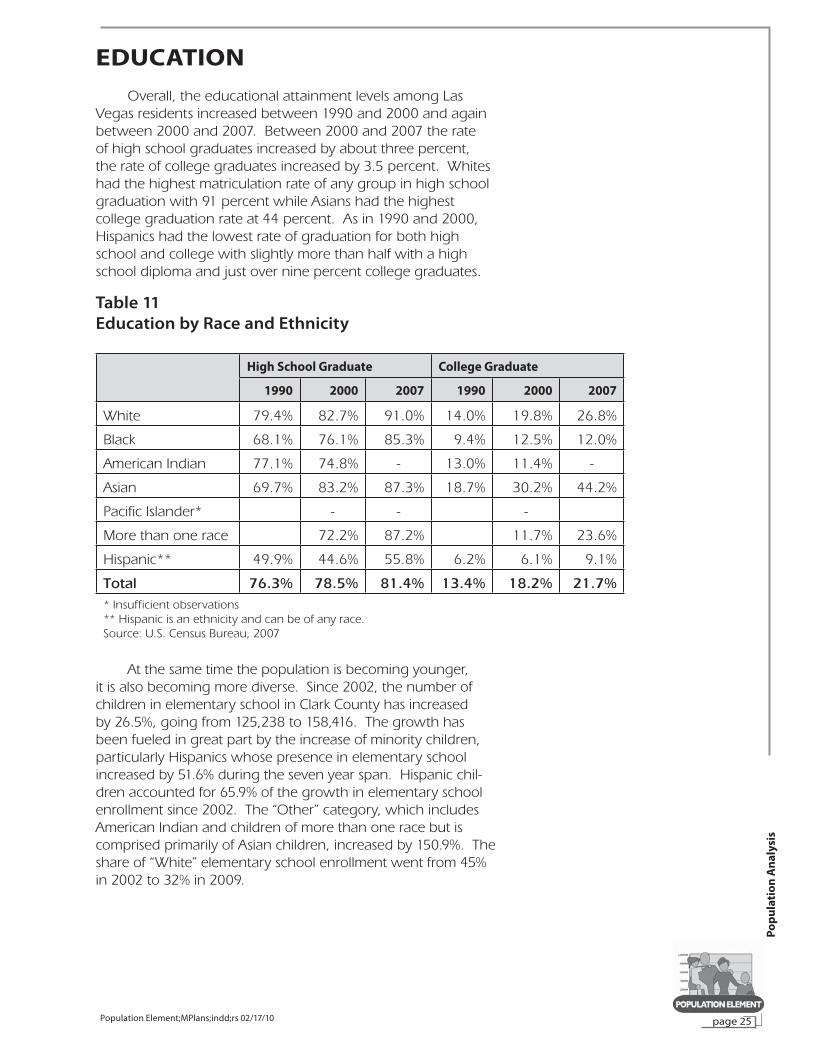
Overall, the educational attainment levels among Las Vegas residents increased between 1990 and 2000 and again between 2000 and 2007. Between 2000 and 2007 the rate of high school graduates increased by about three percent, the rate of college graduates increased by 3.5 percent. Whites had the highest matriculation rate of any group in high school graduation with 91 percent while Asians had the highest college graduation rate at 44 percent. As in 1990 and 2000, Hispanics had the lowest rate of graduation for both high school and college with slightly more than half with a high school diploma and just over nine percent college graduates.
Table 11
Education by Race and Ethnicity
High School Graduate College Graduate
1990 2000 2007 1990 2000 2007
White 79.4% 82.7% 91.0% 14.0% 19.8% 26.8%
Black 68.1% 76.1% 85.3% 9.4% 12.5% 12.0%
American Indian 77.1% 74.8% - 13.0% 11.4% -
Asian 69.7% 83.2% 87.3% 18.7% 30.2% 44.2%
Pacific Islander* - - -
More than one race 72.2% 87.2% 11.7% 23.6%
Hispanic** 49.9% 44.6% 55.8% 6.2% 6.1% 9.1%
Total 76.3% 78.5% 81.4% 13.4% 18.2% 21.7%* Insufficient observations** Hispanic is an ethnicity and can be of any race.Source: U.S. Census Bureau, 2007
At the same time the population is becoming younger, it is also becoming more diverse. Since 2002, the number of children in elementary school in Clark County has increased by 26.5%, going from 125,238 to 158,416. The growth has been fueled in great part by the increase of minority children, particularly Hispanics whose presence in elementary school increased by 51.6% during the seven year span. Hispanic chil-dren accounted for 65.9% of the growth in elementary school enrollment since 2002. The “Other” category, which includes American Indian and children of more than one race but is comprised primarily of Asian children, increased by 150.9%. The share of “White” elementary school enrollment went from 45% in 2002 to 32% in 2009.

Po
pu
lati
on
An
aly
sis
Population Element;MPlans;indd;rs 02/17/10page 26
Table 12
Clark County Grade School Enrollment by Race and Ethnicity
White %African
American% Hispanic % Other % Total
Enrollment2001 - 02
56,158 44.8% 17,208 13.7% 42,372 33.8% 9,500 7.6% 125,238
Enrollment2008 - 09
50,835 32.1% 19,501 12.3% 64,245 40.6% 23,835 15.0% 158,416
Total Change2002 - 09
(5,323) -16.0% 2,293 6.9% 21,873 65.9% 14,335 43.2% 33,178
% Change2002 - 09
-9.5% 13.3% 51.6% 150.9% 26.5%
Source: Clark County School District, 2008 – 2009 School Year
INCOME AND EMPLOYMENT
Overall employment increased by nearly 23 percent between 2000 and 2007 going from 214,301 to 262,895. Leading the increase was Finance, Insurance and Real Estate (FIRE) Services, which increased by approximately 33 percent during the seven-year span. Construction related jobs and Health, Social and Educational Services grew by 36 percent and 26 percent, respectively between 2000 and 2007. Service related jobs grew at approximately the same rate as overall job growth. Public Administration jobs and Transportation, Communications and Public Facilities (TCPU) grew at a substan-tially slower rate than the overall average. Agriculture, Forestry, and Mining, though small segments, decreased sharply be-tween 1990 and 2000 and continued to decrease through 2007. This may be due to the City and surrounding areas continuing to become more urbanized.

Po
pu
lati
on
An
aly
sis
Population Element;MPlans;indd;rs 02/17/10 page 27
Table 13
Employment by Industry – Las Vegas
1990 2000 2007
Agriculture, Forrestry, Mining 1,811 1.4% 666 0.3% 366 0.1%
Construction 13,355 10.2% 21,567 10.1% 29,314 11.2%
Manufacturing 5,601 4.3% 7,047 3.3% 7,989 3.0%
Transportation, Communications,Public Utilities
8,209 6.3% 14,814 6.9% 16,378 6.2%
Wholesale Trade 4,162 3.2% 4,836 2.3% 5,398 2.1%
Retail Trade 20,302 15.5% 24,118 11.3% 28,239 10.7%
Finance, Insurance, Real Estate 8,529 6.5% 16,335 7.6% 23,567 9.0%
Services - Entertainment, Recreation, Personal, Professional
50,863 38.8% 90,143 42.1% 109,266 41.6%
Health, Social, Education Services 12,758 9.7% 26,773 12.5% 33,831 12.9%
Public Administration 5,411 4.1% 8,002 3.7% 8,547 3.3%
Total 131,001 214,301 262,895
Source: U.S. Census Bureau, 2007
The 23 percent increase in jobs between 2000 and 2007 was driven by strong job growth in the Management, Technical and Professional occupations. Service related occupations, includ-ing those in the gaming industry, grew at a slower pace than the overall increase in occupation. Production, Transportation, Trades, and Laborers kept pace with the overall growth in occupation. Table 14 shows employment by occupation.
Table 14
Employment by Occupation
1990 2000 2007
Management, Professional,Technical
30,823 23.5% 54,748 25.5% 72,742 27.7%
Sales and Office Occupations 35,428 27.0% 56,240 26.2% 67,929 25.8%
Service Occupations 34,531 26.4% 58,953 27.5% 68,999 26.2%
Farming, Fishing, Forrestry 1,586 1.2% 453 0.2% - 0.0%
Production, Transportation, Trades, Laborers
28,633 21.9% 43,907 20.5% 53,225 20.2%
Total 131,001 214,301 262,895
Source: U.S. Census Bureau, 2007

Po
pu
lati
on
An
aly
sis
Population Element;MPlans;indd;rs 02/17/10page 28
Unemployment increased slightly between 1990 and 2000 going from 6.6 percent to 7.0 percent. Between 2000 and 2007, unemployment decreased somewhat, going to 5.7%. The unemployment rate was highest among blacks in 2007 with nearly 10 percent being unemployed. The rate among Whites declined from 5.9 to 4.7 percent and for Hispanics the unemployment rate decreased from 9.0 percent to 5.7 percent. The recent economic downturn has caused unemployment to increase dramatically with the rate more than doubling between 2007 and 2009. Clark County’s un-employment rate is higher that the State of Nevada’s, which is approximately one-percent higher than the national rate of 9.5 percent.
Table 15
Unemployment Rate by Race
1990 2000 2007 2008 2009
White 6.0% 5.9% 4.7% NA NA
Black 11.4% 13.7% 9.7% NA NA
Other 6.1% 6.5% 7.5% NA NA
Hispanic* 7.3% 9.0% 5.7% NA NA
Total 6.6% 7.0% 5.7% 6.3% 12.3%* Hispanic is an ethnicity and can be of any race.Sources: U.S. Census Bureau 1990 – 2007,Department of Employment, Training, and Rehabilitation (DETR) as of June 2008 and 2009
The median household income increased for Las Vegas residents by 23 percent between 2000 and 2007. In real terms, that is, keeping income in constant dollars, income declined by 0.68 percent. For age groups 25 years of age to 64 years of age, income increased at more or less the same rate as the overall average. However, for age groups 25 years and under and 65 years and over, income in real terms, decreased during the seven year span.
Table 16
Median Household Income by Age
2000 2007
Year 2000
Infl ation
Adjusted
Diff erence
Median Household Income $ 44,069 $ 54,357 $ 54,729 -0.68%
Householder under 25 years $ 30,043 $ 35,093 $ 42,255 -16.95%
Householder 25 to 44 years $ 46,911 $ 58,046 $ 56,484 2.77%
Householder 45 to 64 Years $ 51,601 $ 63,329 $ 62,132 1.93%
Householder 65 years and over $ 32,205 $ 36,731 $ 38,777 -5.28%Source: U.S. Census Bureau, 2007Adjusted Income: Bureau of Labor Statistics, 2009

Po
pu
lati
on
An
aly
sis
Population Element;MPlans;indd;rs 02/17/10 page 29
During the past ten years the greatest increase in Median Household Income occurred among persons of More Than One Race, Whites and Asians. Income among Hispanics increased at about the same pace as the overall increase in Median Income. Amongst Blacks income remained the lowest among any race, and did not keep pace with the overall increase in income.
Table 17
Median Household Income by Race and Ethnicity
1990 2000 2007
Median Household Income $ 30,560 $ 44,069 $ 54,357
White $ 32,139 $ 48,656 $ 62,543
Black $ 20,989 $ 30,340 $ 32,083
American Indian* $ 29,752 $ 37,500 $ -
Asian $ 30,864 $ 47,069 $ 55,725
Pacific Islander $ - $ 41,833 $ 42,405
More than one race $ - $ 39,169 $ 56,694
Hispanic** $ 27,217 $ 37,122 $ 45,194 * Insufficient observations in 2007** Hispanic is an ethnicity and can be of any raceSource: U.S. Census Bureau, 2007
TRANSPORTATION
The mean travel time to work for City residents decreased slightly between 2000 and 2007, going from 25.4 minutes to 25.1 minutes. During this time period, population increased by 17.5 percent. The decrease in commute times may be due to the completion of the US-95 widening project which included the addition of High Occupancy Vehicle (HOV) lanes. In addi-tion, the number and percent of Las Vegas residents who also worked in the City increased during the seven year span as did commuters who use Public Transportation to get to work.

Po
pu
lati
on
An
aly
sis
Population Element;MPlans;indd;rs 02/17/10page 30
Table 18
Mean Travel Time to Work
2000 2007
Commute Time (minutes) 25.4 24.8
- by means of transportation
Less than 30 minutes 134,944 185,630
Public Transportation 2,092 1.6% 3,233 1.7%
Other means 132,852 98.4% 182,397 98.3%
30 to 44 minutes 50,379 75,213
Public Transportation 2,500 5.0% 2,857 3.8%
Other means 47,879 95.0% 72,356 96.2%
45 to 59 minutes 9,522 15,174
Public Transportation 1,399 14.7% 790 5.2%
Other means 8,123 85.3% 14,384 94.8%
60 or more minutes 10,826 16,032
Public Transportation 4,078 37.7% 5,276 32.9%
Other means 6,748 62.3% 10,756 67.1%Source: U.S. Census Bureau, 2007
Commute Time decreased slightly in conjunction with a small decrease in the use of a private vehicle to get to work. Private vehicle use decreased by 0.7 percent while the use of Public Transportation to get to work increased slightly, going from 4.8 percent to 5.0 percent. The greater the time it took to get to work, the more likely Public Transportation was used. Similar scenarios occurred in other western cities including Phoenix, Seattle, Denver and Long Beach.
Table 19
Private Vehicle Occupancy
2000 2007
Number Percent Number Percent
TOTAL 210,806 292,049
Car, Truck or Van 187,311 88.9% 267,846 91.7%
Drove Alone 155,575 73.8% 231,996 79.4%
Carpooled 31,736 15.1% 35,850 12.3%Source: U.S. Census Bureau, 2007

Po
pu
lati
on
An
aly
sis
Population Element;MPlans;indd;rs 02/17/10 page 31
Some of the decrease in commute time may have been due to the fact that the percent of people living in Las Vegas who also worked in the City increased. In 2000, approximately 48 percent of Las Vegas residents in the labor force worked for a company located within the City limits compared to just over 49 percent in 2007. Another contributing factor is likely the widen-ing of US-95, providing additional lanes for commuters driving alone or carpooling.
Table 20
Place of Work
2000 2007
number percent number percent
Worked within the City 101,780 48.3% 126,561 49.2%
Did not work within the City 109,026 51.7% 130,452 50.8%
Total 210,806 257,013 Source: U.S. Census Bureau, 2007

Po
pu
lati
on
An
aly
sis
Population Element;MPlans;indd;rs 02/17/10page 32

page 33 Population Element;MPlans;indd;rs 02/17/10
Pro
ject
ion
s F
or
Fu
ture
Ch
an
ge
PROJECTIONS FOR FUTURE CHANGE
REGIONAL FORECAST
The most widely used population forecasts in Clark County are developed by the Center for Business and Economic Research (CBER) at the University of Nevada, Las Vegas. The CBER population fore-casts are prepared annually, and are jointly funded by: the Southern Nevada Water Authority (SNWA), the Regional Transportation Commission (RTC), and the Southern Nevada Regional Planning Coalition (SNRPC). The SNRPC adopted the Southern Nevada Regional Policy Plan, establishing a policy to continue this process as part of its work program. The City has participated in the process of preparing these forecasts, and will continue participating in the future as a member of the SNRPC. The latest forecasts, reported in Table 21, were released in June 2009.
Table 21
Historical and Projected Clark County Population
Year PopulationAverage Annual
Numeric Change
Average Annual
Growth Rate
1990 741,459
2000 1,375,765 63,431 6.4%
2005 1,815,700 87,987 5.7%
2007 1,996,643 90,472 4.9%
2010 2,122,000 41,786 2.1%
2015 2,446,000 64,800 2.9%
2020 2,715,000 53,800 2.1%
2025 2,933,000 43,600 1.6%
2030 3,126,000 38,600 1.3%Source: Clark County REMI Population Forecast, 2008 – 2050,years 1990 and 2000 are U.S. Census Bureau, years 2005 and 2007are Clark County Comprehensive Planning
According to these forecasts, population growth in Clark County is predicted to slow considerably. These forecasts may predict a re-turn to more realistic, consistent rates of growth than that which oc-curred in the 1990s and continued through 2007. However, others might argue that the forecasted growth may be unreasonably low, especially when compared to other sunbelt communities. Phoenix is expected to grow by 1.1 million people (27.4% increase) over the next 12 years,1 and southern California communities (Los Angeles and San
1 Maricopa Association of Governments (MAG) Regional Report, January 2005 & Regional Transportation Plan, 2006

Pro
ject
ion
s F
or
Fu
ture
Ch
an
ge
page 34 Population Element;MPlans;indd;rs 02/17/10
Diego metro areas combined) are projected to add another 3.8 million people (17.7% increase) by 2020.2
The southwestern states will continue to absorb newcomers as people migrate from rustbelt communities and international migrants arrive from Mexico. Many of the migrants to sunbelt states will land in the Valley. Some will be retirees, others will come for jobs, and some will look to improve their quality of life. In the near-term, jobs will not be the primary reason for people to relocated to Las Vegas. The economic downturn has caused a loss of jobs in the Las Vegas Metropolitan Area of 5.9 percent as of April 2009. Unemployment is at 10.8 percent for the area. Even with the rate of job loss incurred during the past year, people continue to relocate to the Las Vegas area. Housing costs have returned to levels seen before the Housing Boom that began in 2004. In addition, the inventory of existing homes is at its lowest point since April of 2006. The inventory has decreased by more than 4,400 units since January, 2009 alone. April of 2009 saw the fewest foreclosures in sixteen months and was the third consecutive month they dropped. The continued activity should help stimulate the local economy, creating opportunities for businesses to provide goods and services to the growing population as well as servicing new industries locating in the region. The continued movement of people into the Valley, combined with a natural growth rate (births minus deaths) that is projected to exceed 20,000 per year by 2010, makes certain that the future population of Clark County will, at a mini-mum, equal the conservative forecasts.
CITY OF LAS VEGAS FORECAST
A number of factors enter into the equation when determining the rate and location of growth at the sub-regional level, including: price of land, local zoning regulations, consumer preferences, soil quality, prox-imity to public amenities, quality and capacity of infrastructure, crime rates, cost of housing, and proximity to jobs. The Regional Transportation Commission, through the SNRPC, created the Land Use Work Group (LUWG) to develop forecasts in five-year increments through 2035. The LUWG is comprised of staff from the various government entities within the Las Vegas Valley. The methodology used by the LUWG to allocate land use, and subsequently population, was intentionally straightforward and simple and is as follows:
• Determine the amount of existing vacant land • Evaluate the zoning of and land use in proximity to vacant
parcels • Assign a future land use and year of development to the va-
cant parcels • Assign capacities to residential parcels • Determine the population
2 Southern California Association of Governments (SCAG) 2008 RTP Growth Forecast & San Diego Association of Governments (SANDAG) 2008 Population Estimates & Forecasts
page 35 Population Element;MPlans;indd;rs 02/17/10
Pro
ject
ion
s F
or
Fu
ture
Ch
an
ge
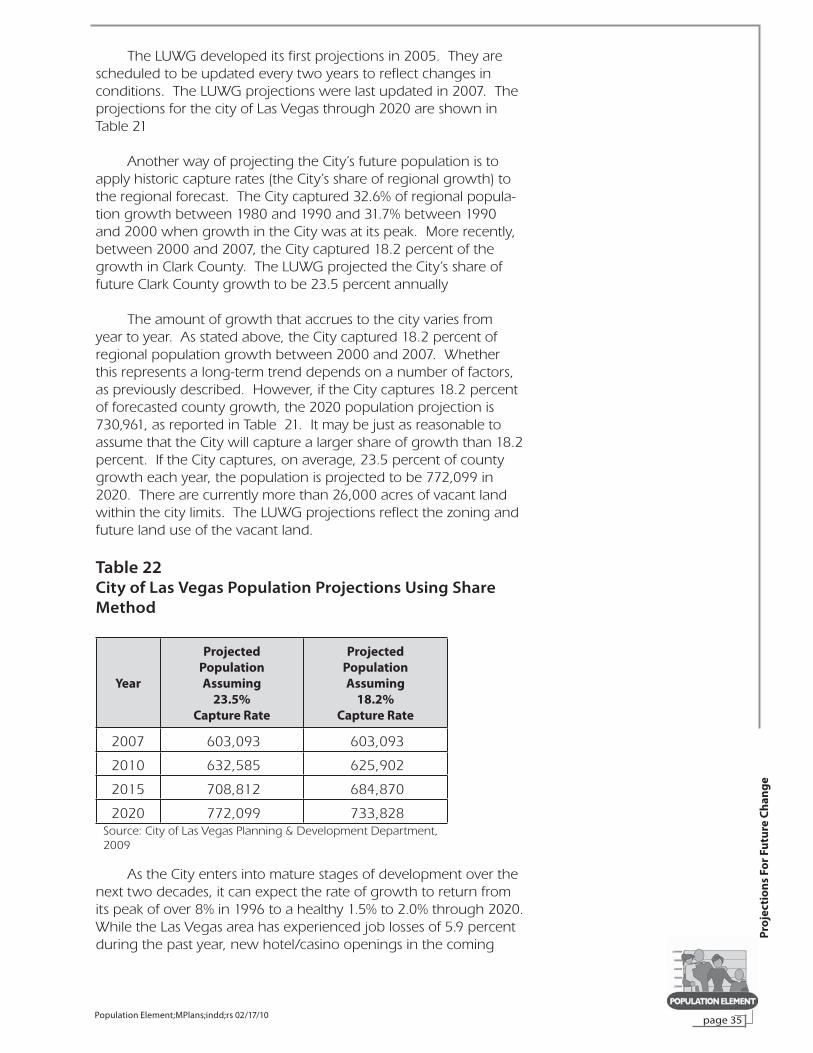
The LUWG developed its first projections in 2005. They are scheduled to be updated every two years to reflect changes in conditions. The LUWG projections were last updated in 2007. The projections for the city of Las Vegas through 2020 are shown in Table 21
Another way of projecting the City’s future population is to apply historic capture rates (the City’s share of regional growth) to the regional forecast. The City captured 32.6% of regional popula-tion growth between 1980 and 1990 and 31.7% between 1990 and 2000 when growth in the City was at its peak. More recently, between 2000 and 2007, the City captured 18.2 percent of the growth in Clark County. The LUWG projected the City’s share of future Clark County growth to be 23.5 percent annually
The amount of growth that accrues to the city varies from year to year. As stated above, the City captured 18.2 percent of regional population growth between 2000 and 2007. Whether this represents a long-term trend depends on a number of factors, as previously described. However, if the City captures 18.2 percent of forecasted county growth, the 2020 population projection is 730,961, as reported in Table 21. It may be just as reasonable to assume that the City will capture a larger share of growth than 18.2 percent. If the City captures, on average, 23.5 percent of county growth each year, the population is projected to be 772,099 in 2020. There are currently more than 26,000 acres of vacant land within the city limits. The LUWG projections reflect the zoning and future land use of the vacant land.
Table 22City of Las Vegas Population Projections Using Share
Method
Year
Projected
Population
Assuming
23.5%
Capture Rate
Projected
Population
Assuming
18.2%
Capture Rate
2007 603,093 603,093
2010 632,585 625,902
2015 708,812 684,870
2020 772,099 733,828Source: City of Las Vegas Planning & Development Department, 2009
As the City enters into mature stages of development over the next two decades, it can expect the rate of growth to return from its peak of over 8% in 1996 to a healthy 1.5% to 2.0% through 2020. While the Las Vegas area has experienced job losses of 5.9 percent during the past year, new hotel/casino openings in the coming

Pro
ject
ion
s F
or
Fu
ture
Ch
an
ge
page 36 Population Element;MPlans;indd;rs 02/17/10
year will add 12,563 rooms to the room inventory by the end of 2009. An additional 3,604 rooms will be added in 2010. The CBER forecast assumption for hotel room additions is that they create approximately 1.3 jobs within the hotel and 0.3 jobs in the community for an overall job creation of 1.6 per new room. Certainly a number of the jobs created by these new properties will be taken by people currently residing in Clark County who lost their job during the past year, but many will be available to newcomers to the area.
Within the city of Las Vegas, Symphony Park, the 61 acres at the intersection of I-15 and US-95, will infuse a mixture of com-mercial and residential development along with cultural ameni-ties into the City’s downtown area. Symphony Park will consist of nearly 1.5 million square feet of office space, 357,000 square feet of retail, 1,500 hotel rooms, a 586,000 square foot perform-ing arts center, approximately 3,100 residential units, and more than 16,000 parking spaces, allowing access for residents and visitors alike. The building of Symphony Park will require 3,800 construction related jobs. Once complete, Symphony Park will support more than 14,000 new, full-time jobs. Already on site is the Lou Ruvo Center for Brain Health. Although construction will not be complete until fall 2009, the center started treating its first patients in July of 2009. The Ruvo Center will be a leader in the treatment and research of brain disorders that affect memory.
The combination of the additional employment opportuni-ties with the previously mentioned return of affordability to the housing market should sustain the City’s growth in the near-term. Projections beyond the next five years will depend greatly upon the speed with which the economy recovers and, in part, on state and local policies that address annexations and preserva-tion of rural neighborhoods that are being eclipsed by urbanized growth patterns.
VACANT LAND, INSTITUTIONAL
CONSTRAINTS AND BUILD-OUT
VACANT LAND
The density of development and number of annexations of vacant land play major roles in determining the potential build-out population in the City. Another factor is the amount of redevelopment that occurs within mature areas. There are limits to the amount of land that the City can annex, as discussed later. These limits are set by public policy, which is subject to change. For the purposes of this analysis, it is assumed that build-out population will be reached when all vacant land within the exist-ing city limits is developed and no future annexations will occur.

page 37 Population Element;MPlans;indd;rs 02/17/10
Pro
ject
ion
s F
or
Fu
ture
Ch
an
ge
Whereas the CBER forecast of countywide population helps predict the timing of regional growth, the amount and location of vacant land, along with the planned land use, provides information as to the location, density, and limit to growth in the City. There are currently 26,187 vacant acres within the city limits. The amount of vacant land depends on two factors: development decreases vacant land, and annexa-tions increase vacant land (the majority of land annexed into the city is vacant). Between 2000 and 2007, the city annexed 14,146 acres, expanding its boundary to cover an area of 131 square miles, and absorbed 11,629 acres through develop-ment.
INSTITUTIONAL CONSTRAINTS
BLM Disposal Boundary The BLM disposal boundary presents a constraint to fur-
ther expansion currently, although as vacant lands within the boundary are developed, pressure to release more land may prompt Congress to change the boundary. However, as the ultimate disposal and annexation into the City of this land is unknown at this time, any potential ex-pansion will not be factored in to this analysis. There are other disposal areas nearby the Valley and limited private land holdings that will supply some of the future demand for development. Figure 9 shows the institutional con-straints to expansion facing the City: to the west the City is restricted by the Red Rock National Conservation Area; to the north by the BLM disposal boundary and the Las Vegas Paiute Indian Community; to the east by the City of North Las Vegas and the unincorporated town of Sunrise Manor; and to the south by the unincorporated towns of Winchester, Spring Valley and Summerlin South.
Multiple Species Habitat Conservation Plan (MSHCP) The MSHCP provides for the long-term conservation and
recovery of native species of plants and animals while allowing for orderly and beneficial land use within Clark County. The plan allows the Secretary of the Interior, through the U.S. Fish and Wildlife Service, to issue permits to “take,” – make available for development – federal lands that are home to federally listed endangered/ threatened species if activities are otherwise legal. The existing permit allows for 145,000 acres of “take” for 30 years by the enti-ties within Clark County, starting in 2001. To date, entities have consumed more than half of the allotted acreage. “Take” within the city of Las Vegas has amounted to ap-proximately 9,500 acres and yielded nearly $5 million in fees from developers since the plan’s inception. Of the total acreage, “fee exempt” accounted for 217 acres. Fee

Pro
ject
ion
s F
or
Fu
ture
Ch
an
ge
page 38 Population Element;MPlans;indd;rs 02/17/10
exempt takes are those that will be dedicated to a public use, such as a park or trail. The non-exempt “take” within the City limits is sufficient to allow Las Vegas’ future popula-tion to increase by 105,000 by year 2035.
Entities are currently working on a permit amendment to increase the acreage of “take” countywide by approxi-mately 210,000 acres. For the city of Las Vegas, lands most likely available for “take” are those classified as Multiple Use Managed Areas (MUMA) and Less Intensively Managed Areas (LIMA). In general, these areas are in proximity to US-95 north of the current City limit. The majority of the LIMA and MUMA land is located on the west-southwest side of US-95. Further expansion by the city of Las Vegas would likely occur in close proximity to US-95 due to the amount of Intensively Managed Areas (IMA) present, particularly north of the freeway within the Sheep Mountain Range.
Sustainability Initiatives The City of Las Vegas passed a resolution on September
3, 2008 adopting a comprehensive energy plan, the Sustainable Energy Strategy, to manage the City’s and com-munity’s energy needs. This, along with the Sustainability Strategic Business Plan and the Urban Forest Management Plan will have impacts on population growth. Sustainability encourages greater densities for residential development, particularly in more “urban” areas, meaning greater popu-lation on less land. Given the City’s current inventory of vacant, developable residential acreage, an increase of one (1) unit per acre would result in an additional 13,000 dwell-ing units, or approximately 32,000 more residents.
Staff from the Planning & Development Department is currently producing a draft form-based sustainability zon-ing code by combining elements of the Title 19 Zoning Code and Title 18 Subdivision Regulations Code in order to improve walkability and connectivity standards. In addition, the Planning & Development Department is working with Public Works to coordinate a “Complete Streets” chapter and will address storm water and other sustainability measures. A draft document is under development and will be pre-pared for review in late 2009. A form based code will be a tool that will help reduce sprawling development by mak-ing more land uses more compact, lead to higher densi-ties, and make more efficient use of land. These measures should, in turn, reduce the number of Vehicle Miles Traveled (VMT). Fewer VMT will reduce air born pollutants such as carbon monoxide, ozone, and particulate matter, all of which Las Vegas has been found to be in non-compliance with in the past.

page 39 Population Element;MPlans;indd;rs 02/17/10
Pro
ject
ion
s F
or
Fu
ture
Ch
an
ge
With new redevelopment efforts and a form based code, Las Vegas’ urban heat island will be mitigated. The Urban Forestry Initiative, adopted by Council on May 7th, 2008 calls for doubling the average tree canopy coverage to 20% by 2035 and calls for an urban forestry management plan, which will contribute to urban heat island reduction. Additional trees will absorb sunlight which would other-wise heat asphalt and concrete. However, with greater population growth and further urban footprint expansion, the urban heat island effect could also increase.

Pro
ject
ion
s F
or
Fu
ture
Ch
an
ge
page 40 Population Element;MPlans;indd;rs 02/17/10
Figure 10
Institutional Constraints to Physical Expansion

page 41 Population Element;MPlans;indd;rs 02/17/10
Pro
ject
ion
s F
or
Fu
ture
Ch
an
ge
Build Out Given these city limits, a long-range projection of the pop-
ulation at build-out can be made. Of the 26,187 vacant acres, 12,753 are planned for residential uses. Table 23 reports vacant acres by planned residential land use, and total additional dwelling units and population that can be expected given the planned densities.
Table 23
Projected Population on Vacant Land Planned for Residential Development
Rural Low Medium Low Medium High Total
Acres 3,185 4,604 3,096 1,400 469 12,753
Dwelling Units 11,147 23,019 24,776 34,991 16,351 110,284
Population 29,863 61,666 66,374 61,412 28,695 248,010 Sources: City of Las Vegas Planning & Development Department, 2009Land Use Work Group (LUWG), 2007
Adding the total additional population that can be expect-ed on remaining vacant land to the population estimate of 603,093 yields a build-out population estimate of 851,103.
POTENTIAL FOR NATURAL
RESOURCE CONSTRAINTS
The natural resource issues that could potentially affect the con-tinued development of Las Vegas are regional in nature and impact every government entity in the County. The continued supply of potable water, air that is in compliance with Federal standards, and the disposal of solid waste are addressed at the regional level while the City of Las Vegas treats its own wastewater.
It is believed that due to allocation and conservation measures that have been implemented and those that have been proposed, the projected build-out population can be supported on a continu-ing basis without unreasonable impairment to the natural resources of the City.
• Wastewater Treatment – The City of Las Vegas Water Pollution Control Facility Plan was implemented in 1996 and updated in 2007. The plan addresses the treatment of wastewater beyond the year 2020, and will support a population of approximately 888,885.
• Water Supply – According to the Water Resource Plan prepared by the Southern Nevada Water Authority (SNWA), based on

Pro
ject
ion
s F
or
Fu
ture
Ch
an
ge
page 42 Population Element;MPlans;indd;rs 02/17/10
current conditions there are sufficient resources available or under development to meet water demands for the ser-vice area through the year 2060. Beyond continued con-servation, Nevada’s basic apportionment, and Las Vegas Valley groundwater rights, the highest priority resources to meet demands will be the development of Intentionally Created Surplus (ICS), in-state groundwater and non-Col-orado River resources. When necessary, banked reserves and other temporary resources will be used to bridge demands while the SNWA brings other permanent in-state groundwater resources on-line.
• Solid Waste – The APEX Regional landfill started accept-ing waste in October 1993 with the closure of the Sunrise landfill. The 1,202-acre landfill was designed with a refuse capacity of approximately 784 million cubic yards and a service life of 85 years.
• Air Quality – the Clark County Department of Air Quality Management does Air quality planning. The Las Vegas Valley is currently classified as non-attainment for carbon monoxide (CO) and particulate matter ten microns or less in size (PM10) and ozone (O3). A State Implementation Plan (SIP) for CO was submitted in August 2000 and the United States Environmental Protection Agency (EPA) pub-lished its final approval on September 21, 2004, with an effective date of October 21, 2004. On June 1, 2005 the EPA published its finding that the Las Vegas Valley non-attainment area had attained the National Ambient Air Quality Standard for carbon monoxide by the applicable attainment date. The County has prepared and submitted a CO Maintenance Plan and Re-designation Request to the EPA for approval.
Clark County finalized and submitted a SIP to address PM10 (dust) nonattainment in the Las Vegas Valley on June 19, 2001. On May 3, 2004 the EPA published its final approval of the Clark County Serious Nonattainment Area Particulate Matter (PM10) Plan in the Federal Register. Clark County at-tained the National Ambient Air Quality Standard for PM10 on December 31, 2006, and submitted the final Milestone Achievement Report (MAR) on June 25, 2007 as required. Clark County is working on a PM10 Maintenance SIP and re-designa-tion request for submission to EPA so that Clark County can be reclassified as attainment for PM10.
On April 30, 2004, the U.S. EPA published nonattain-ment designations for the 1997 8-hour ozone standard in the Federal Register, classifying Clark County as a Subpart 1 ozone nonattainment area. The classification required the County to attain the 8-hour ozone standard no later then 2009. In
page 43 Population Element;MPlans;indd;rs 02/17/10
Pro
ject
ion
s F
or
Fu
ture
Ch
an
ge
December 2006, the District of Columbia Circuit Court va-cated EPA’s Phase I implementation rule, which contained the standards for Subpart 1 designated areas. The court’s action remanded the rule back to EPA for further action. On January 9, 2009, the EPA proposed a revised rule to resolve the issues with the previous rule. Clark County will submit an appropriate plan in accordance with the revised rule once that rule is final. However, the County is currently in attainment with the 1997 ozone standard for the latest three-year average of the 4th highest reading (2006, 2007, and 2008) and can demonstrate attainment through 2018. In March 2008, EPA promulgated a more stringent ozone standard. The State of Nevada submitted a recommendation to the EPA that Clark County be designated in nonattainment of that 2008 standard. Designations are ex-pected to be issued by EPA in March of 2010.
Due to the combined efforts of the public, government entities and the private sector, air quality in the Las Vegas Valley has improved even as the population has increased.

Pro
ject
ion
s F
or
Fu
ture
Ch
an
ge
page 44 Population Element;MPlans;indd;rs 02/17/10

page 45 Population Element;MPlans;indd;rs 02/17/10
Imp
lem
en
tati
on
IMPLEMENTATIONRECOMMENDATIONS
RECOMMENDATION 1: Estimate the City’s population on an annual basis.
• An annual estimate of the City’s population as of July 1st of each year is required by Nevada Revised Statutes (NRS) section 360.364.
• The annual population estimate determines the number of dwelling units, households, and people within the City limits and assists in determining adequate service provision levels.
• • The CLV annual estimate is a component in the formula used by the Nevada State Demographer in determining the annual Governor Certified Population Estimate.
• The annual estimate is a component in determining the City’s share of the Basic City County Relief Tax (BCCRT) and the Supplemental City County Relief Tax (SCCRT) which apportions millions of dollars in revenue to entities within Nevada.
RECOMMENDATION 2: Continue to lead and participate in regional annual population projection programs.
• Participate in the development of the Regional Economic Modeling Inc. population projection model. The REMI model is funded and approved by the SNRPC and is used to deter-mine countywide population projections through 2050. The model output is used as a baseline for population projections at lower levels of geography such as Traffic Analysis Zones (TAZ), ZIP Codes, and individual cities.
• Continue to lead and participate in the development of the Land Use Work Group (LUWG) model. The LUWG uses cur-rently vacant land to determine future population in Clark County and the cities within by applying a “land use” to parcels that will determine the future population level and offers the ability to determine population at sub-county levels. The LUWG model also determines non-residential uses which allows for the estimation of traffic volume levels and future public and private service provision.
• Aside from uses in planning by various entities, including the city of Las Vegas, the projections are used to determine avail-ability of resources by entities such as the Southern Nevada Water Authority (SNWA) and the Regional Transportation Commission (RTC). The projections also play a major role in demonstrating the Las Vegas Valley’s ability to comply with air quality standards in the coming years which determines future funding from the federal government.

Pro
ject
ion
s F
or
Fu
ture
Ch
an
ge
page 46 Population Element;MPlans;indd;rs 02/17/10
RECOMMENDATION 3: Lead and coordinate local Census programs.
• The decennial Census determines the level of funding Nevada and its municipalities receive from the Federal government for ten years.
• The Census determines a states numbers in the House of Representatives and the number of electoral votes for presi-dential elections.
• Census information is invaluable to planners, and helps to establish the identity of a community.
• Inter-censal estimates – annual updates of population conduct-ed by the U.S. Census Bureau – determine the level of fund-ing for local social and community oriented programs such as CDBG and other grant reliant programs. Entities have the abil-ity to appeal these estimates if they are felt to be inaccurate.
Recommendation 4: Annually monitor “outside” sources of population and demographic data that can impact the City.
• Monitor U.S. Census data, specifically the American Community Survey for changes in characteristics of the City’s population such as Race and Ethnicity, Age, and Language Spoken at Home that can impact service provision.
• Evaluate sources of population estimates and projections such as the Nevada State Demographer for changes that impact the City. The locally developed estimate, mentioned in Recommendation 1, comprises half of the formula used to develop the State Demographer’s population estimate which is a component of the formula used to determine funding levels throughout the state.
RECOMMENDATION 5: Establish population/service level database.
• Develop databases with historical and current population figures and historical and current infrastructure levels that will allow for analysis of future needs:
• Per the Public Safety Element, build a new police substa-tion to equal one (1) per 125,000 population
• Per the Transportation Trails Element, develop between 3.75 and 5.68 miles of trails per 100,000 population
• Per the Parks & Recreation Element: • develop 2.5 acres of park space per 1,000 population • build one (1) Neighborhood Center per 10,000
population • build one (1) Community Center per 25,000 popula-
tion • build one (1) Regional Center per 75,000 population

Pla
nn
ing
Are
as
Population Element;MPlans;indd;rs 02/17/10 page 47
PLANNING AREAS
DOWNTOWN REURBANIZATION
AREA
Population increased steadily between 1980 and 2000 in spite of fluctuations in housing units. The changes in the housing unit stock include losses due to demolitions near the Stratosphere Tower and conversion of residential units to office space, which occurred primarily in the Las Vegas High School area. The population increases that have occurred since 1980 are due primarily to the continual migration of males to the area. During the 20-year span about 76 percent of the areas new residents were male. The high male presence may be due to: 1) the numerous multi-family rental units as approximately 95 percent of the housing units in the Reurbanization Area are multi-family and 89 percent are rentals 2) the preponderance of facilities for the homeless are in the area (approximately 40 percent of the City’s group quarter facilities are within the Reurbanization areas boundaries, another 40 percent of the City’s group quarters are within one mile of the areas boundar-ies) and 3) a high number of Hispanic males residing and work-ing in Las Vegas whose families live outside of Clark County. According to Census 2000, 67 percent of the Reurbanization Area’s total population is male.
Another significant change to the areas population includes an influx of Hispanics. The Hispanic population in-creased by 215 percent between 1980 and 2000. The average annual growth rate was 5.9 percent during the 20-year span. Household composition has changed significantly also. In 1980 and 1990, non-family households comprised nearly 75 percent. However, with the population increase of the 1990s came an increase in family households, which increased from 28.5 percent in 1990 to 36.1 percent in 2000. With the increase in families came an upswing in the rate of home ownership. In 1990, just over one percent of the areas residents owned their home. By 2000 that figure had risen to nearly 11 percent.

Pla
nn
ing
Are
as
Population Element;MPlans;indd;rs 02/17/10page 48
Table 24
Reurbanization Demographics
1980 1990 2000
Population 8,536 10,184 12,932
GenderMale 5,328 62.4% 6,698 65.8% 8,663 67.0%
Female 3,208 37.6% 3,486 34.2% 4,269 33.0%
Age< 18 965 11.3% 1,454 14.3% 1,791 13.8%18 - 64 6,404 75.0% 7,630 74.9% 10,090 78.0%> 65 1,167 13.7% 1,100 10.8% 1,051 8.1%
RaceWhite 5,706 66.8% 5,201 51.1% 5,466 42.3%Black 868 10.2% 1,372 13.5% 1,853 14.3%
Hispanic 1,413 16.6% 2,947 28.9% 4,446 34.4%American Indian 79 0.9% 51 0.5% 106 0.8%
Asian 385 4.5% 557 5.5% 663 5.1%Pacific Islander 0.0% N/A 0.0% 54 0.4%
Other 85 1.0% 56 0.5% 14 0.1%More than one race N/A 0.0% N/A 0.0% 330 2.6%
Education Persons 25+ yrs. of age 5,994 7,477 11,001 High School Graduate 3,578 59.7% 3,574 47.8% 6,484 58.9%Bachelors Degree or Greater 462 7.7% 479 6.4% 704 6.4%
Median Household Income $ 10,061 $ 15,711 $ 18,891
Poverty Level IncomePersons for whom povertystatus is determined 8,504 9,355 11,538 Persons below poverty level 1,658 19.5% 2,329 24.9% 3,574 31.0%
Unemployment Labor Force 5,150 5,388 5,886 Unemployed 541 10.5% 717 13.3% 923 15.7%
Household TypeFamily Households:
Married Couple 1,071 20.9% 947 19.9% 1,235 22.5%Male Head 125 2.4% 175 3.7% 350 6.4%
Female Head 263 5.1% 234 4.9% 394 7.2%Non-Family Households 3,677 71.6% 3,408 71.5% 3,504 63.9%
Total Households 5,136 4,764 5,483
Housing UnitsOwn 124 2.4% 57 1.2% 591 10.8%Rent 5,012 97.6% 4,707 98.8% 4,892 89.2%
Source: U.S. Census Bureau, 2000

Pla
nn
ing
Are
as
Population Element;MPlans;indd;rs 02/17/10 page 49
NEIGHBORHOOD
REVITALIZATION AREA
Population growth in the Neighborhood Revitalization Area was steady between 1980 and 2000. The average annu-al growth rate was just over 2 percent. The growth rate varied little during the two decades. The population aged somewhat between 1980 and 1990. However, since 1990 the popula-tion has started to become younger with the number less than 18 years of age approaching 30 percent. In spite of this, the number of non-family households increased from 35 percent to 38 percent between 1990 and 2000. While the areas overall population has seen steady growth, the Hispanic population has exploded. Since 1990 the areas Hispanic population has in-creased by 242 percent and is approximately equal to the areas White population.
The composition of households has changed. In 1980, over 53 percent of all Neighborhood Revitalization Area house-holds were married couples. By 2000, 40 percent of the households were married couples. The shift may be due to the change in housing stock. In 1980, 70 percent of the housing units were single-family, with about 55 percent of all types owner occupied. By 2000, 45 percent of the housing units were single-family, and just under one-half (47%) of all housing types were occupied by the owner.

Pla
nn
ing
Are
as
Population Element;MPlans;indd;rs 02/17/10page 50
Table 25
Neighborhood Revitalization Demographics
1980 1990 2000
Population 136,992 169,539 204,376
GenderMale 67,705 49.4% 85,122 50.2% 104,027 50.9%
Female 69,287 50.6% 84,417 49.8% 100,349 49.1%
Age< 18 38,201 27.9% 42,803 25.2% 58,315 28.5%18 - 64 86,847 63.4% 107,057 63.1% 124,046 60.7%> 65 11,944 8.7% 19,679 11.6% 22,015 10.8%
RaceWhite 103,380 75.5% 113,832 67.1% 81,183 39.7%Black 19,312 14.1% 23,829 14.1% 27,420 13.4%
Hispanic 10,372 7.6% 23,626 13.9% 80,680 39.5%Am .Indian 872 0.6% 1,520 0.9% 1,090 0.5%
Asian 2,624 1.9% 6,480 3.8% 8,577 4.2%Pacific Islander N/A 0.0% N/A 0.0% 741 0.4%
Other 437 0.3% 251 0.1% 252 0.1%More than one race N/A 0.0% N/A 0.0% 4,433 2.2%
EducationPersons 25+ yrs. of age 79,810 106,853 122,934 High School Graduate 57,407 71.9% 74,314 69.5% 79,756 64.9%Bachelors Degree or Greater 9,299 11.7% 12,217 11.4% 11,322 9.2%
Median Household Income $ 18,431 $ 28,240 $ 34,930
Poverty Level IncomePersons for whom poverty status is determined 135,075 162,731 200,294 Persons below poverty level 14,281 10.6% 22,298 13.7% 37,066 18.5%
Unemployment Labor Force 70,277 87,932 88,254 Unemployed 4,618 6.6% 6,275 7.1% 8,733 9.9%
Household TypeFamily Households:
Married Couple 27,333 53.4% 30,251 46.2% 27,733 40.0%Male Head 1,839 3.6% 3,648 5.6% 5,097 7.4%
Female Head 6,421 12.5% 8,855 13.5% 9,889 14.3%Non-Family Households: 15,634 30.5% 22,722 34.7% 26,531 38.3%
Total Households 51,227 65,476 69,250
Housing UnitsOwn 27,940 54.5% 29,464 45.0% 32,548 47.0%Rent 23,287 45.5% 36,012 55.0% 36,703 53.0%
Source: U.S. Census Bureau, 2000

Pla
nn
ing
Are
as
Population Element;MPlans;indd;rs 02/17/10 page 51
NEWLY DEVELOPING AREAS
The population of the area of the City north of Cheyenne Avenue increased at an average annual rate of 15.8 percent be-tween 1980 and 2000. This translates to a population that, on average, doubled every 53 months. The areas population has aged, with the share of residents under the age of 18 decreas-ing by about five percent between 1980 and 2000. The share of residents 65 years of age and over nearly tripled during the twenty-year span.
While the areas population growth has been explosive since 1980, the traits of the residents have only recently begun to change. The population remained about 90 percent White between 1980 and 1990. By 2000, just over 75 percent of the population was White. Hispanics comprised about 10 per-cent of the areas population in 2000. Household composition changed little during the 20-year span, as family households remained steady at 77 percent. Currently, 80 percent of the dwelling units in this area are single-family and over 84 percent of all households are owner occupied compared to the 75 per-cent home ownership rate in 1980.

Pla
nn
ing
Are
as
Population Element;MPlans;indd;rs 02/17/10page 52
Table 26
Newly Developing Area Demographics
1980 1990 2000
Population 4,451 22,502 83,511
GenderMale 2,188 49.2% 10,973 48.8% 41,254 49.4%
Female 2,263 50.8% 11,529 51.2% 42,257 50.6%
Age< 18 1,415 31.8% 6,222 27.7% 22,437 26.9%18 - 64 2,863 64.3% 14,712 65.4% 53,414 64.0%> 65 174 3.9% 1,568 7.0% 7,660 9.2%
RaceWhite 3,987 89.6% 19,900 88.4% 62,984 75.4%Black 152 3.4% 842 3.7% 5,650 6.8%
Hispanic 225 5.1% 1,197 5.3% 8,501 10.2%Am .Indian 21 0.5% 170 0.8% 394 0.5%
Asian 59 1.3% 383 1.7% 3,344 4.0%Pacific Islander N/A 0.0% N/A 0.0% 267 0.3%
Other 7 0.2% - 0.0% 143 0.2%More than one race N/A 0.0% N/A 0.0% 2,228 2.7%
EducationPersons 25+ yrs. of age 2,473 14,352 56,256 High School Graduate 1,120 81.9% 12,435 86.6% 50,531 89.8%Bachelors Degree or Greater 651 10.3% 2,652 18.5% 12,753 21.5%
Median Household Income $ 23,500 $ 46,966 $ 62,895
Poverty Level IncomePersons for whom poverty status is determined 4,334 21,660 83,373 Persons below poverty level 180 4.2% 899 4.2% 4,063 4.9%
Unemployment Labor Force 2,338 12,387 45,040 Unemployed 114 4.9% 391 3.2% 2,389 5.3%
Household TypeFamily Households:
Married Couple 1,004 66.2% 5,485 67.9% 19,094 63.4%Male Head 43 2.8% 332 4.1% 1,201 4.0%
Female Head 132 8.7% 511 6.3% 2,630 8.7%Non-Family Households: 338 22.3% 1,746 21.6% 7,186 23.9%
Total Households 1,517 8,074 30,111
Housing UnitsOwn 1,138 75.0% 6,257 77.5% 25,642 84.3%Rent 379 25.0% 1,817 22.5% 4,790 15.7%
Source: U.S. Census Bureau, 2000
Pla
nn
ing
Are
as
Population Element;MPlans;indd;rs 02/17/10 page 53
CITY OF LAS VEGAS
The City’s population grew by 190 percent between 1980 and 2000, an average annual rate of 5.5 percent. At that rate population doubles every 13 years. Between 2000 and 2007, the City’s population grew by 17.5 percent with average an-nual growth of 2.34 percent. Some of the reason for lower growth rates for Las Vegas is due obviously to population growth slowing. But Las Vegas is also becoming a large city and as a population becomes larger changes in population have less impact.
Population in each age category more than doubled during the 20-year span, but the rate of growth was great-est among those 65 years of age and older. Their population increased by more than 300 percent between 1980 and 2000. Amongst Racial and Ethnic groups, the Hispanic population experienced the greatest growth. Between 1980 and 2000 the Hispanic population increased by 783 percent. Asians ex-perienced similar growth with an increase of 627 percent over the same time. Since 2000 their populations continue to grow faster than any other group with increases of 47.2 percent and 13.2 percent respectively.
The education level of City residents continues to increase. The rate of college graduation increased from 13.4 percent to 18.2 percent between 1990 and 2000. That represents an increase in the number of people with college degrees of 150 percent. The number of people with college degrees contin-ued to increase since 2000, going to 21.7 percent. Between 1990 and 2000, median household income increased by 50 percent. Even when adjusted for inflation Las Vegas residents income increased by 20 percent. Since 2000, median house-hold income increased by 23 percent. When adjusted for infla-tion, income increased by 2.4 percent during the past seven years. The increase in income may be one of the reasons for the rise in home ownership rates during the 1990’s, which in-creased from 47 percent in 1990 to 59 percent in 2000. Home ownership rates have increased steadily since 2000, reaching a high of 61.8 percent in 2006, but the economic downturn has seen a sharp increase in foreclosures and a corresponding de-cline in home ownership rates. The type of household’s people live in changed slightly between 2000 and 2007. The change occurred within family households with a decrease in the num-ber of married couple households and increases to male and female headed households.

Pla
nn
ing
Are
as
Population Element;MPlans;indd;rs 02/17/10page 54
Table 27
City of Las Vegas Demographics
1990 2000 2007
# % # % # %
Population 258,295 478,630 562,582 Gender Male 130,539 50.5% 243,174 50.8% 287,184 51.0% Female 127,756 49.5% 235,456 49.2% 275,398 49.0%Age Less than 18 64,461 25.0% 124,113 25.9% 151,900 27.0% 18 – 64 167,302 64.8% 299,193 62.5% 345,008 61.3% 65 Years and over 26,532 10.3% 55,324 11.6% 65,674 11.7%Race White 186,716 72.3% 277,858 58.1% 288,350 51.3% Black 28,897 11.2% 48,391 10.1% 59,231 10.5% American Indian 2,056 0.8% 2,405 0.5% 3,372 0.6% Asian 9,022 3.5% 22,413 4.7% 25,378 4.5% Pacific Islander 1,935 0.4% 2,176 0.4% Hispanic 31,249 12.1% 112,981 23.6% 166,269 29.6% Other 355 0.1% 650 0.1% 995 0.2% More than one race 11,997 2.5% 16,811 3.0%Education 25+ Yrs of age 168,724 313,205 370,243 High School Graduate 128,736 76.3% 245,804 78.5% 301,479 81.4% College Graduate 22,564 13.4% 56,989 18.2% 80,285 21.7%Median Household Income $ 30,590 $ 44,069 $ 54,357 Poverty Level Income Persons for whom poverty status is determined 253,617 471,034 553,155 Persons below poverty level
29,084 11.5% 56,053 11.9% 65,825 11.9%
Unemployment Labor Force 140,298 230,477 278,757 Unemployment 9,297 6.6% 16,176 7.0% 15,890 5.7%Household Type Family Households: Married Couple 49,350 49.4% 85,359 48.3% 98,098 46.9% Male Head of Household
4,954 5.0% 10,470 5.9% 13,950 6.7%
Female Head of Household
11,579 11.6% 21,637 12.2% 26,866 12.8%
Non-Family Households 34,066 34.1% 59,284 33.5% 70,275 33.6% Total Households 99,949 176,750 209,159 Housing Units Own 47,604 47.6% 104,481 59.1% 120,816 57.8% Rent 52,345 52.4% 72,269 40.9% 88,373 42.2%Source: U.S. Census Bureau, 2007

Pla
nn
ing
Are
as
Population Element;MPlans;indd;rs 02/17/10 page 55
APPENDIX A: PUBLIC PARTICIPATION
The Planning and Development Department facili-tated the following neighborhood meetings to present the Population Element and to receive public input:
Monday November 2, 20096:30 p.m.Rafael Rivera Community Center2900 Stewart AvenueLas Vegas, NV 89101
Tuesday, November 3, 20096:30 p.m.Centennial Hills Community Center 6601 North Buffalo DriveLas Vegas, NV 89131
Wednesday, November 4, 20096:30 p.m.Mirabelli Community Center6200 Hargrove AvenueLas Vegas, Nevada 89107
Presentation of the draft Population Element to the Planning Commission was made on December 17, 2009.
Presentation of the draft Population Element was made to the City Council on January 20, 2010.
The City Council adopted the element on February 17, 2010.

Ap
pe
nd
ix
Population Element;MPlans;indd;rs 02/17/10page 56