population ecology how do populations grow? growth = birth rates > death rates decline = birth...
TRANSCRIPT
Population Ecology
• How do populations grow?
Growth = birth rates > death rates
Decline = birth rates < death rates
Zero Growth = birth rates = death rates
Population Growth Models
• Exponential Growth
• Logistic Growth

Exponential Growth Model
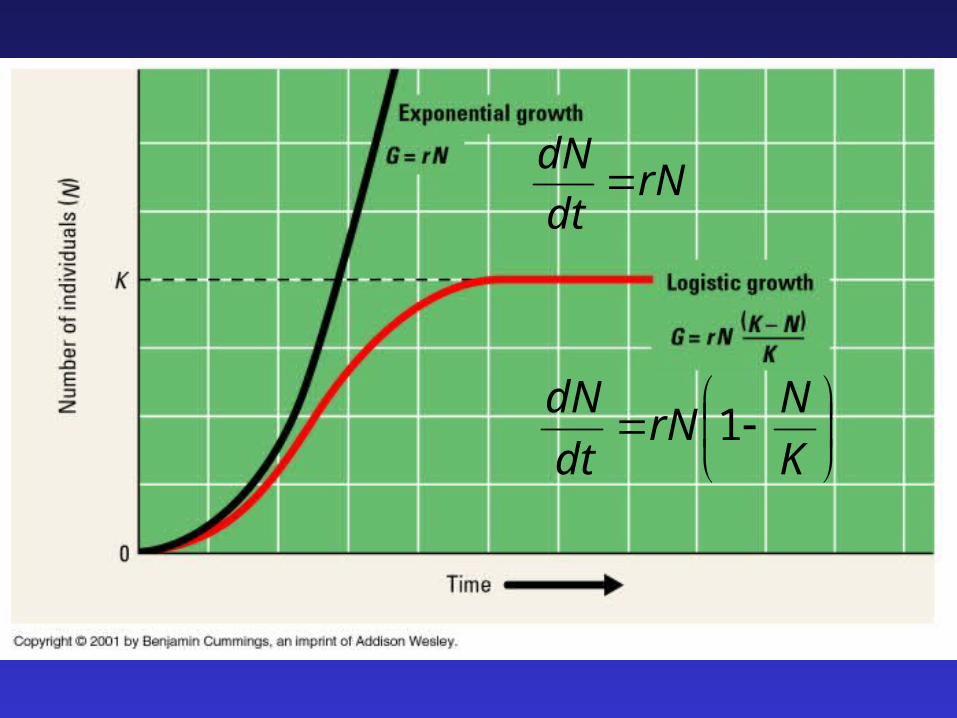
• J-shaped curve
• If conditions perfect, then population grows by constant factor over time = unchecked growth
Ex: You count 2 deer in 1995
1996 = 4 deer
1997 = 8 deer
1998 = 16 deer,……..
rNdt
dN
K
NrN
dt
dN1

Exponential Growth Model
• Does Exponential Growth occur in the real world?
Yes & No …. Can only occur over short-time period…..something always regulates growth (Finite resources!)

Logistic Growth Model
• S-shaped curve
• Population grows exponentially for short time & then growth is checked by a limiting factor
• carrying capacity (K): # of individuals that the environment can maintain

rNdt
dN
K
NrN
dt
dN1

Logistic Growth Model
• Does Logistic Growth occur in the real world?
Yes & No …. Population growth is limited & populations do grow to near a K … but population dynamics do not end at K

initial carrying capacity
new carrying capacity
Logistic Growth Graph

Overshooting Capacity
• Population may temporarily increase above carrying capacity
• Overshoot is usually followed by a crash; dramatic increase in deaths Reindeer on St. Matthew’s Island

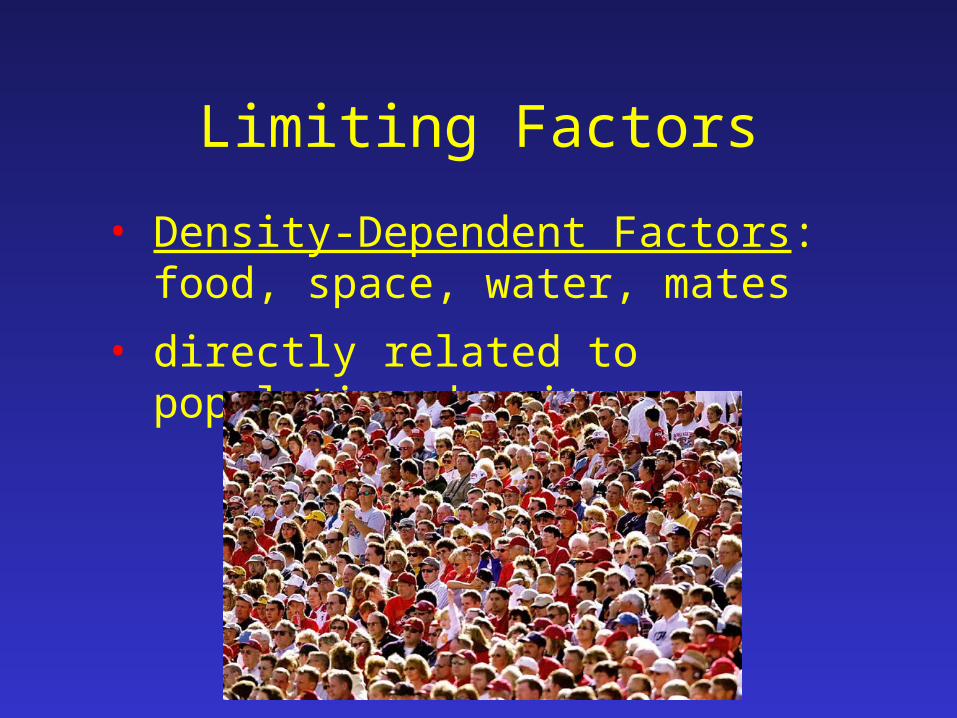
Limiting Factors
• Density-Dependent Factors: food, space, water, mates
• directly related to population density

Density-dependent Effects
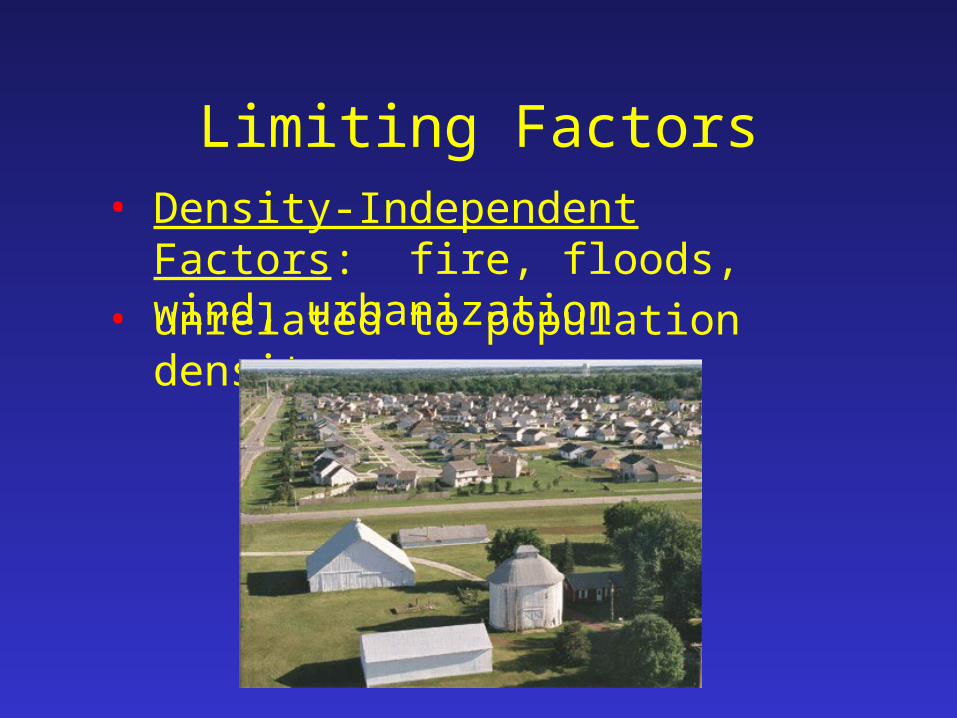
Limiting Factors• Density-Independent Factors: fire,
floods, wind, urbanization• unrelated to population density

Resource Consumption• United States has 4.6% of
the world’s population• Americans have a
disproportionately large effect on the world’s resources (30% of consumption)
• Per capita, Americans consume more resources and create more pollution than citizens of less developed nations– 1 American = 20-40
persons from less developed nation

Human Population Problems• Over 6 billion people alive
• About 2 billion live in poverty
• Most resources are consumed by the relatively few people in developed countries
Community Ecology
Community: grouping of all species living & interacting in the same area, includes populations of different species

Properties of Communities
1) Species Richness = # species in a comm.
2) Species Evenness = relative abundance of different species
3) Species Diversity = richness & evenness
e.g., Four species (A,B,C,D) in 2 different communities
Comm 1 – 25A 25B 25C 25D
Comm 2 – 97A 1B 1C 1D

RichnessEvennessDiversity
Properties of Communities (cont)
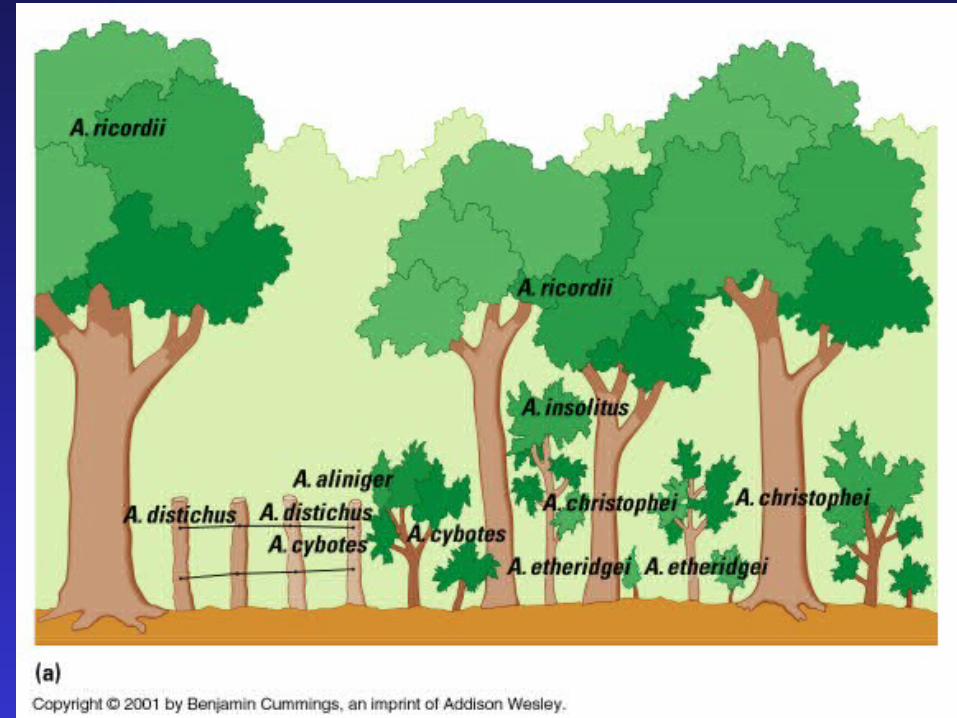
4) Prevalent vegetation form
- vertical profile (trees, shrubs, grasses)- determine other organisms that are present

Properties of Communities (cont)
5) Trophic Structure (feeding structure)
- who eats whom?- determine energy flow in community- determine community structure

Energy Flow in Communities
food chain: sequence of organisms linked by energy & nutrient flow
trophic level: feeding level/position of organism in food chain
Trophic Levels Producer: (autotrophs) anchor of chain;
produce all organic matter for other organisms
Primary consumer: directly consume producers = herbivores
Heterotrophs (consumers)
Secondary consumer: consume herbivores
Tertiary & Quaternary consumers: consume secondary & tertiary consumers, respectively

Trophic Levels Decomposers: (detritus feeder) consume
and convert dead material for use by producers

Food Webs food web: interconnected food chains; all
trophic interactions in community

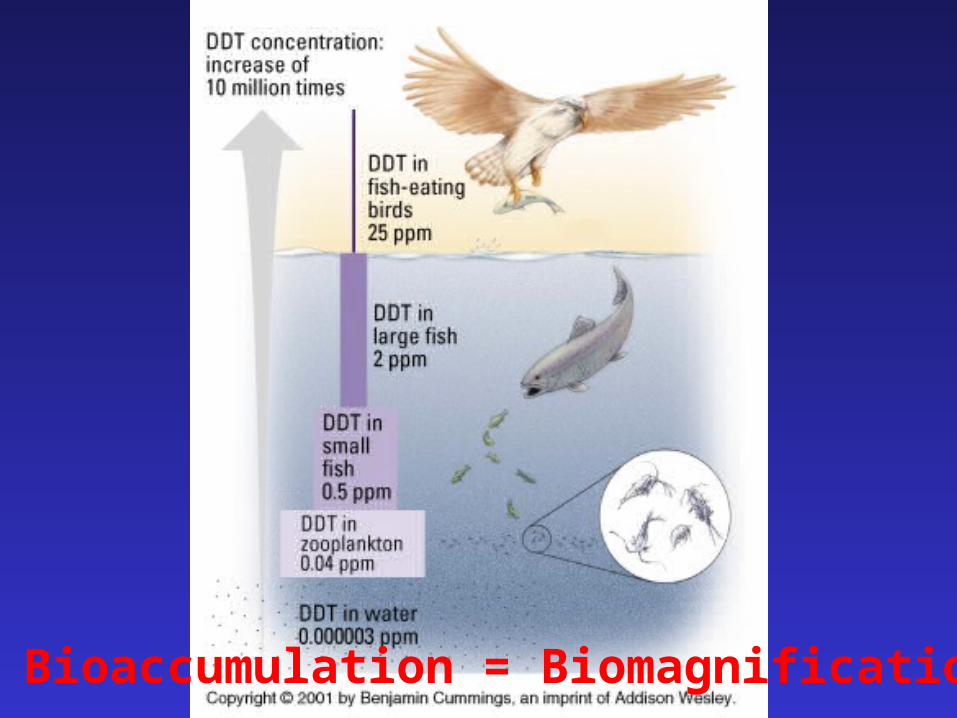
Bioaccumulation = Biomagnification
Properties of Communities (cont)
6) Stability
- recovery from disturbance (e.g., fire)
- depends on type of community & type of disturbance
What Happens in a Community?
1) Competition: individuals contest over a resource (food, space, water, mates…) – major factor determining structure

What Happens in a Community?
Types of CompetitionA) Interspecific: competition between
different species, e.g., blue jay & chickadee compete for sunflower seed at feeder
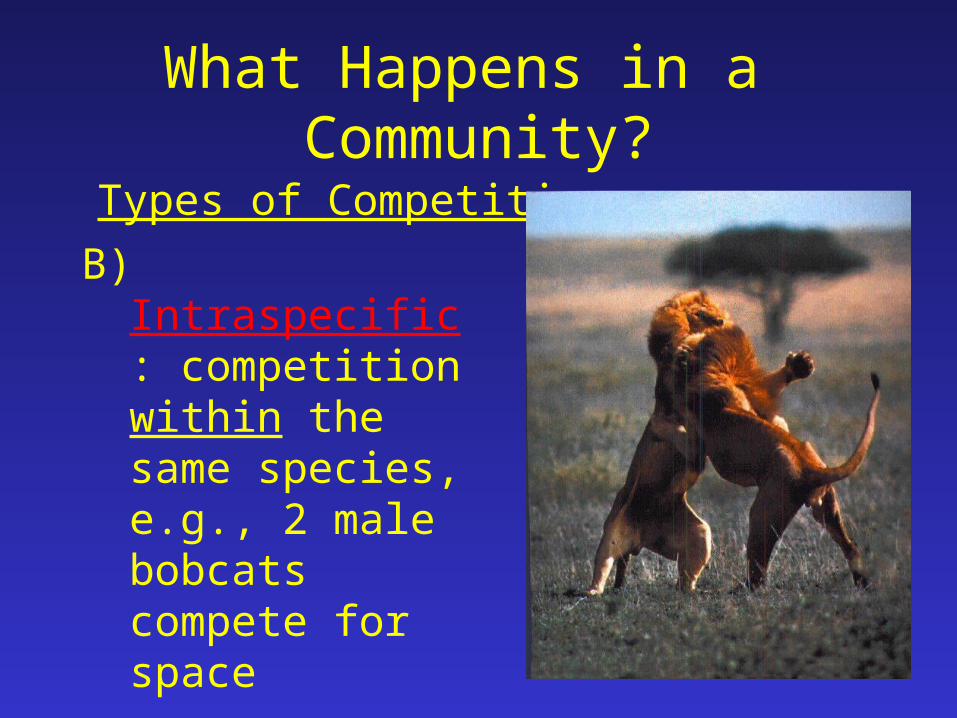
What Happens in a Community?
Types of Competition
B) Intraspecific: competition within the same species, e.g., 2 male bobcats compete for space

Principle of Competitive Exclusion (Gause’s experiments)• Two species
which compete for same resource cannot coexist in same place at same time
• Implications = different locations or different times
• Relates directly to niche concept

Niche Concept
Niche: functional role (“occupation”) & position (spatial & temporal) of a species in its community
• Principle of Competitive Exclusion = 2 species cannot occupy the same niche
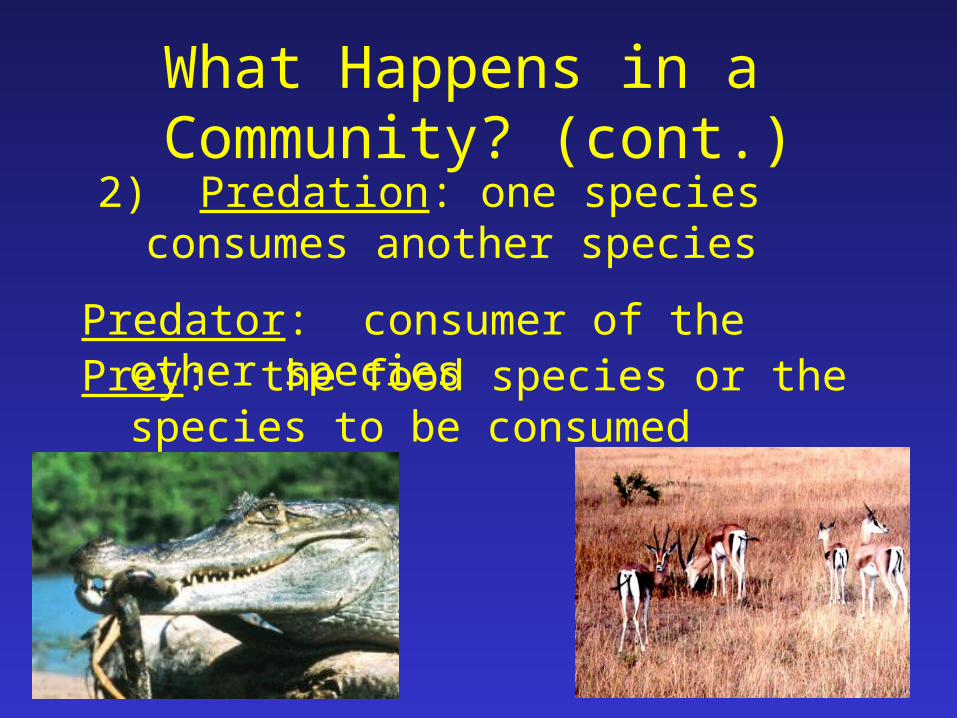
What Happens in a Community? (cont.)
2) Predation: one species consumes another species
Predator: consumer of the other speciesPrey: the food species or the species to be
consumed
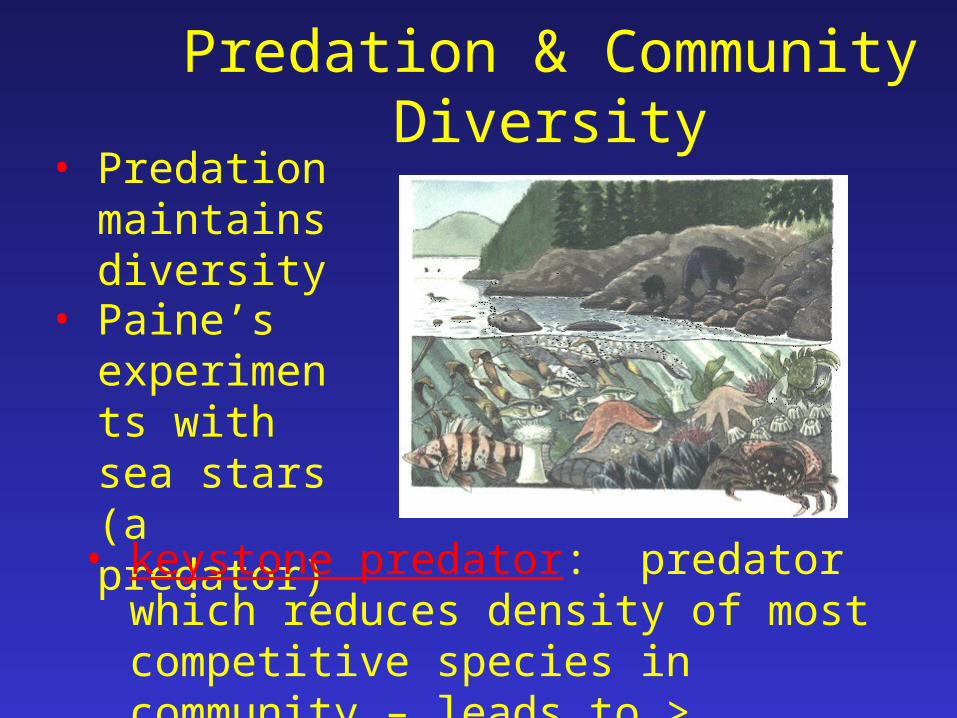
Predation & Community Diversity
• Predation maintains diversity
• Paine’s experiments with sea stars (a predator)
• keystone predator: predator which reduces density of most competitive species in community – leads to > diversity
What Happens in a Community? (cont.)
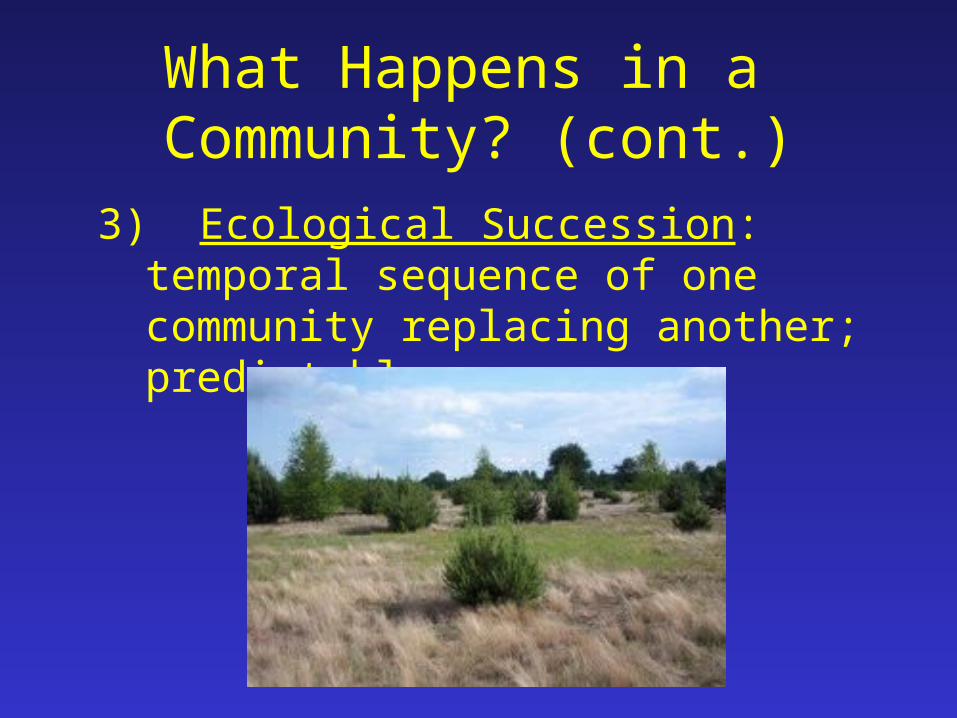
3) Ecological Succession: temporal sequence of one community replacing another; predictable

Major Ecosystem Processes
1) Energy Flow = energy moves through system
2) Nutrient Cycling = chemical elements recycled in system

Energy Flow
• Solar energy – primary energy source
Of incoming solar radiation:
66% absorbed
34% reflected (albedo)

Solar Energy
• Of solar radiation absorbed:
- ~22% water cycle
- nearly all transform to heat & radiates
emissivity: relative ability of Earth to release energy (e.g., radiate heat into space; link to global warming)

Solar Energy
• Tiny amount of solar energy into photosynthesis (~1%)
photosynthesis (PNS): use solar energy to convert CO2 & H2O into sugar; by-product = O2primary production: all organic matter resulting from PNS; raw material for other organisms (gross production vs. net production)

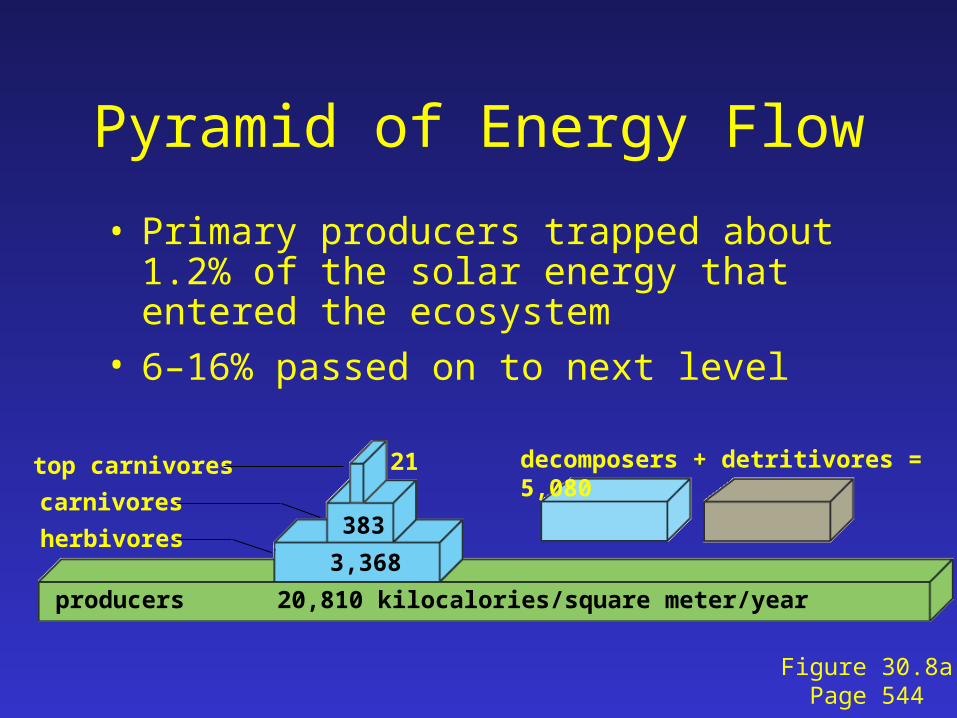
Pyramid of Energy Flow
• Primary producers trapped about 1.2% of the solar energy that entered the ecosystem
• 6–16% passed on to next level
21
383
3,368
20,810 kilocalories/square meter/year
top carnivores
carnivores
herbivores
producers
decomposers + detritivores = 5,080
Figure 30.8aPage 544

Nutrient Cycles
What does the Law of Conservation of Matter state?
• circular flow of chemicals = recycling• Inputs & relationship to energy flow?
• Water, Carbon (C), Nitrogen (N), Phosphorus (P), Sulfur (S)

Hydrologic Cycleatmosphere
ocean land
evaporation from ocean
425,000
precipitation into ocean 385,000
evaporation from land plants (evapotranspiration)
71,000
precipitation onto land 111,000
wind-driven water vapor40,000
surface and groundwater flow 40,000

Hubbard Brook Experiment
• A watershed was experimentally stripped of vegetation
• All surface water draining from watershed was measured
• Removal of vegetation caused a six-fold increase in the calcium content of the runoff water
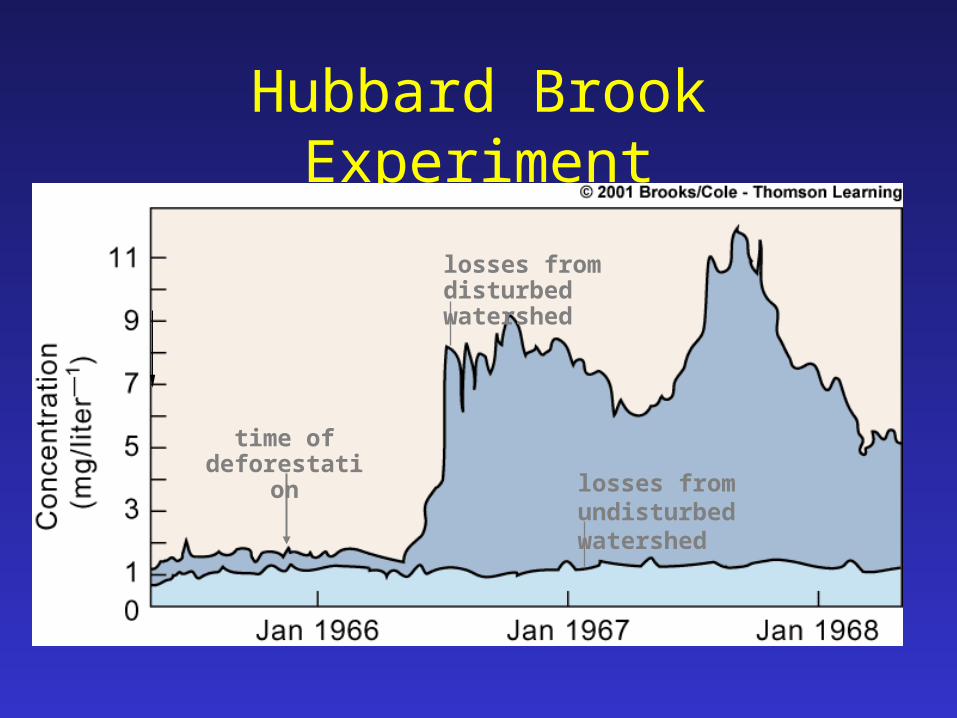
Hubbard Brook Experiment
losses fromdisturbed watershed
time ofdeforestation
losses fromundisturbed watershed
Global Water Crisis
• Limited amount of fresh water• Desalinization is expensive and requires large
amounts of energy• Aquifers are being depleted• Groundwater is contaminated• Sewage, agricultural runoff, and industrial
chemicals pollute rivers

Carbon Cycle
• Carbon moves through the atmosphere and food webs on its way to and from the ocean, sediments, and rocks
• Sediments and rocks are the main reservoir
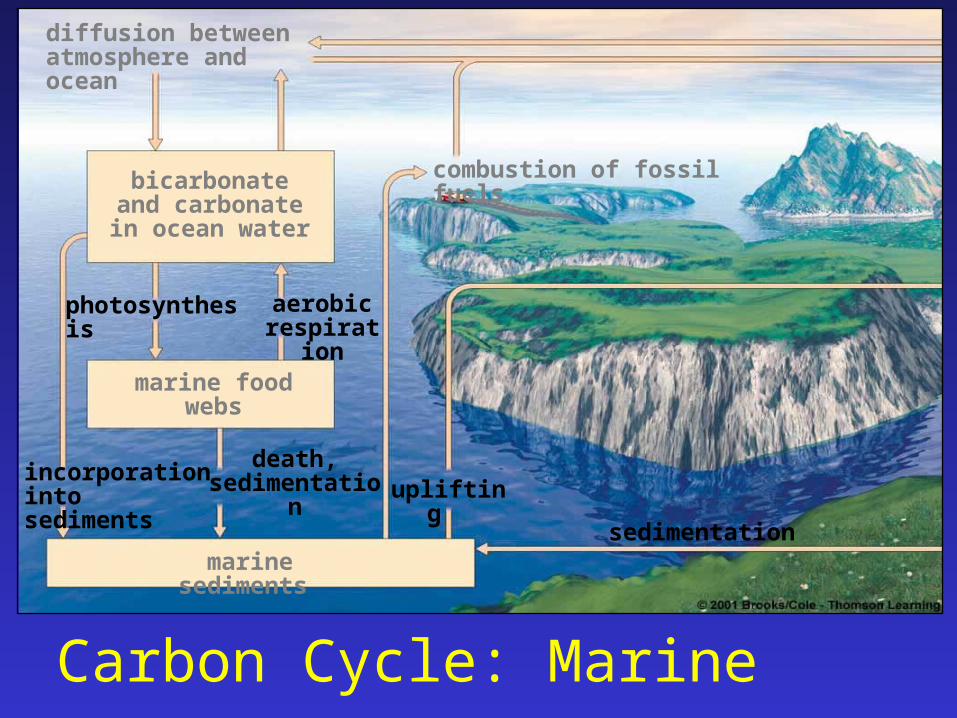
diffusion between atmosphere and ocean
bicarbonate and carbonate in ocean water
marine food webs
marine sediments
combustion of fossil fuels
incorporation into sediments
death, sedimentation uplifting
sedimentation
photosynthesis aerobic respiration
Carbon Cycle: Marine

Carbon Cycle: Land
photosynthesis aerobic respirationterrestrial
rocks
soil water
land food webs
atmosphere
peat, fossil fuels
combustion of wood
deforestation
volcanic action
death, burial, compaction over geologic time
leaching, runoff
weathering
combustion of fossil fuels

Carbon in the Oceans
• Most carbon in the ocean is dissolved carbonate and bicarbonate
• Ocean currents carry dissolved carbon

Carbon in Atmosphere
• Atmospheric carbon is mainly carbon dioxide
• Carbon dioxide is added to atmosphere– Aerobic respiration, volcanic action, burning
fossil fuels
• Removed by photosynthesis
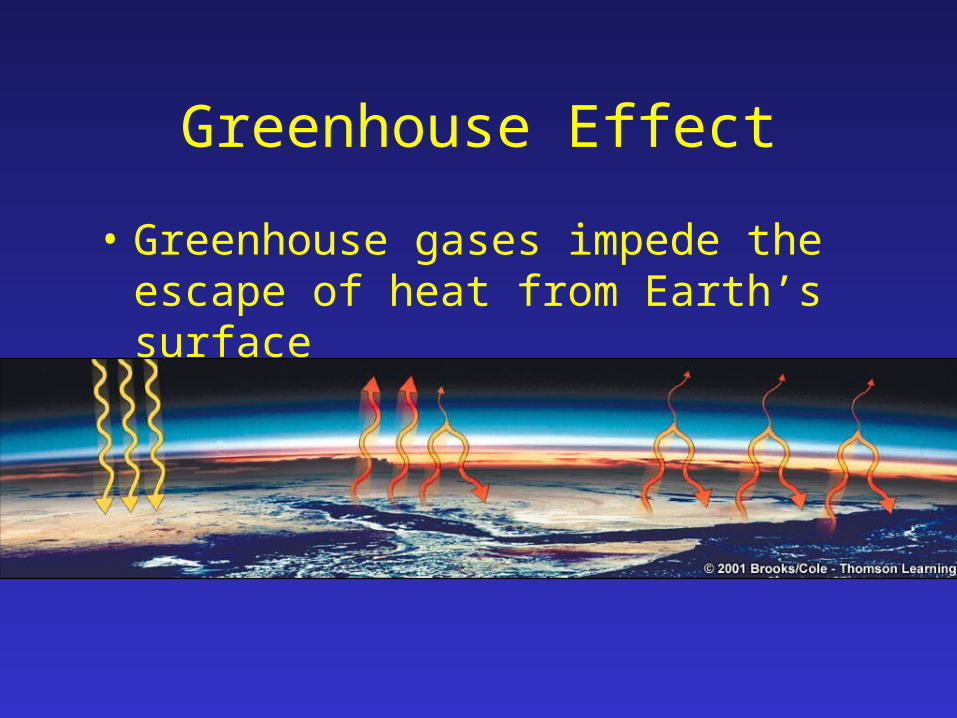
Greenhouse Effect
• Greenhouse gases impede the escape of heat from Earth’s surface

Carbon Dioxide Increase
• Carbon dioxide levels fluctuate seasonally
• The average level is steadily increasing
• Burning of fossil fuels and deforestation are contributing to the increase

Other Greenhouse Gases
• CFCs: synthetic gases used in plastics and in refrigeration
• Methane: released by natural gas production, livestock
• Nitrous oxide: released by bacteria, fertilizers, and animal wastes
Nitrogen Cycle
• Nitrogen is used in amino acids and nucleic acids
• Main reservoir is nitrogen gas in the atmosphere
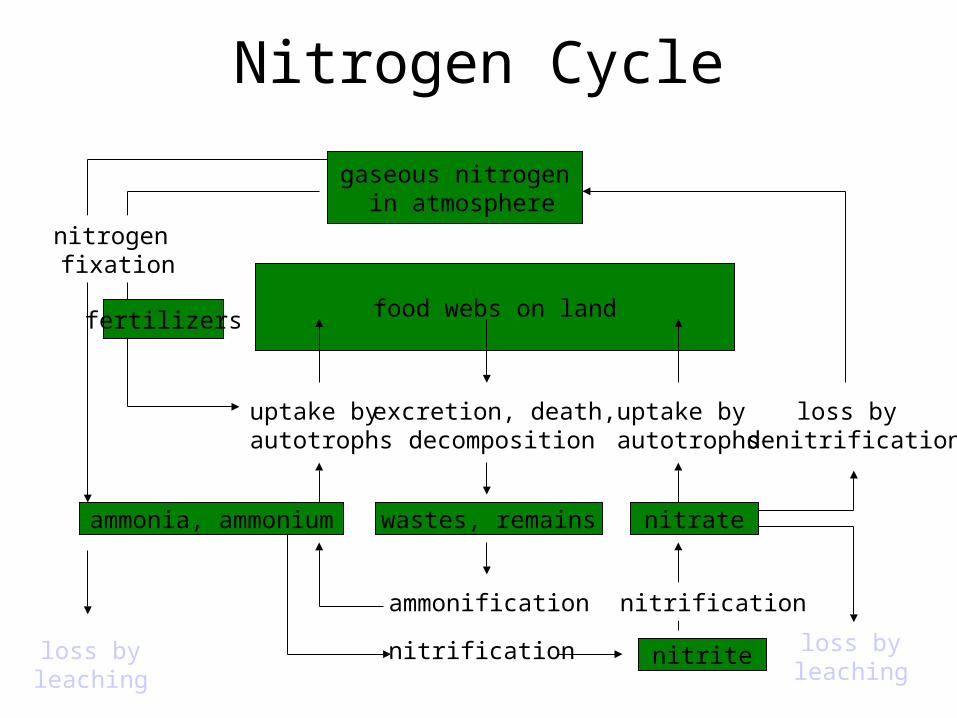
Nitrogen Cycle
gaseous nitrogen in atmosphere
food webs on land
ammonia, ammonium wastes, remains nitrate
ammonification
fertilizers
uptake by autotrophs
excretion, death, decomposition
uptake by autotrophs
nitrite
nitrification
nitrificationloss by leaching
loss by denitrification
nitrogen fixation
loss by leaching

Nitrogen Fixation
• Plants cannot use nitrogen gas
• Nitrogen-fixing bacteria convert nitrogen gas into ammonia (NH3)
• Ammonia and ammonium can be taken up by plants
Human Effects
• Humans increase rate of nitrogen loss by clearing forests and grasslands
• Humans increase nitrogen in water and air by using fertilizers and by burning fossil fuels
• Too much or too little nitrogen can compromise plant health

Phosphorus Cycle
• Phosphorus is part of phospholipids and all nucleotides
• It is the most prevalent limiting factor in ecosystems
• Main reservoir is Earth’s crust; no gaseous phase
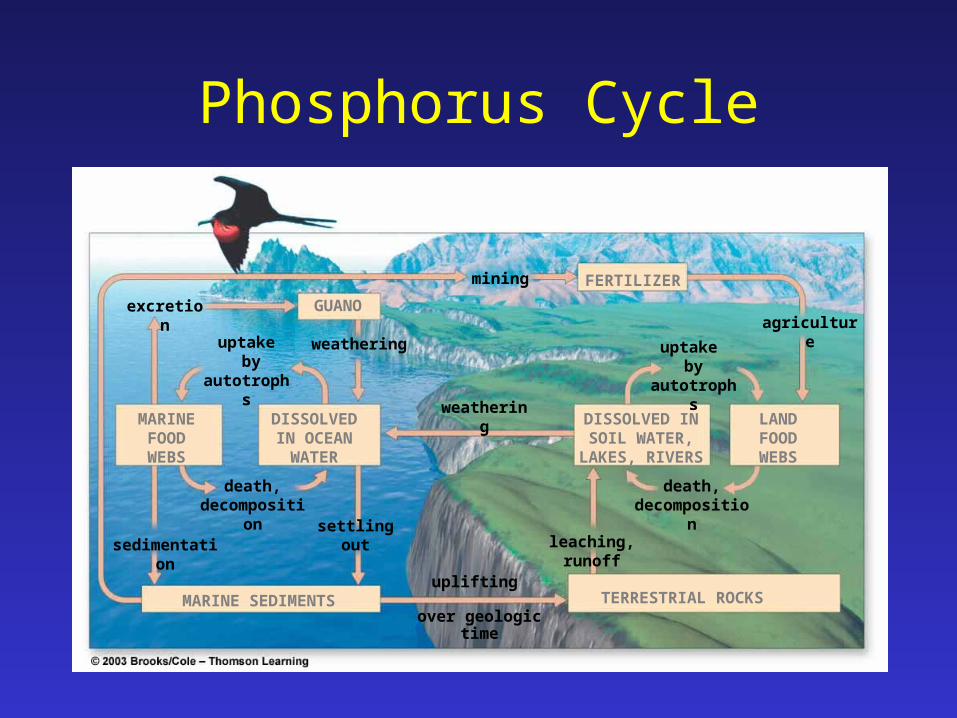
Phosphorus Cycle
GUANO
FERTILIZER
TERRESTRIAL ROCKS
LAND FOOD WEBS
DISSOLVED IN OCEAN
WATER
MARINE FOOD WEBS
MARINE SEDIMENTS
excretion
weathering
mining
agricultureuptake
by autotrophs
death, decomposition
sedimentationsettling
out leaching, runoff
weathering
uplifting
over geologic time
DISSOLVED IN SOIL WATER,
LAKES, RIVERS
uptake by
autotrophs
death, decomposition

Human Effects
• In tropical countries, clearing lands for agriculture may deplete phosphorus-poor soils
• In developed countries, phosphorus runoff is causing eutrophication of waterways


Ecosystem Management
• Optimal level of resource management
• Entire systems vs. pieces
• Goal = minimize human impacts on ecosystems so as to insure their integrity & health & therefore our health
• Manage at larger scale, e.g., Great Lakes Region Ecosystem NOT Michigan only
Biosphere
• Oceans
- cover ¾ of Earth
- Temperature & rainfall patterns (climate)
- Huge oxygen sources -- algae
- estuary: fresh water meets salt water; life-rich area

Biomes Terrestrial community of common climate
& unique species assemblages1) Tundra – permafrost
2) Boreal Forest -- conifers
3) Deciduous Forest – broad-leaves
4) Tropical Rain Forest – 70% of life
5) Tropical Savannah -- fire
6) Grassland -- treeless
7) Desert – low rainfall