population dynamics and carbon emissionserf.org.eg/wp-content/uploads/2016/04/988.pdf · population...
TRANSCRIPT


POPULATION DYNAMICS AND CARBON EMISSIONS IN THE ARAB REGION:
AN EXTENDED STIRPAT II MODEL
Hala Abou-Ali, Yasmine M. Abdelfattah and John Adams
Working Paper 988
April 2016
Send correspondence to: Yasmine Abdelfattah The British University in Egypt [email protected]

1
First published in 2016 by The Economic Research Forum (ERF) 21 Al-Sad Al-Aaly Street Dokki, Giza Egypt www.erf.org.eg Copyright © The Economic Research Forum, 2016 All rights reserved. No part of this publication may be reproduced in any form or by any electronic or mechanical means, including information storage and retrieval systems, without permission in writing from the publisher. The findings, interpretations and conclusions expressed in this publication are entirely those of the author(s) and should not be attributed to the Economic Research Forum, members of its Board of Trustees, or its donors.

2
Abstract
Many Arab countries have been developing at a fast pace in the past 20 years and this is now seen as putting considerable pressure on the natural environment through population growth, ecosystem stress and resource extraction. The potential for climate change arising from increasing carbon dioxide emissions threatens the likelihood of a more sustainable development model being achieved in many of these countries. The paper deals with Arab countries’ population-environment nexus with respect to climate change interactions. The paper adopts the STIRPAT II model, which measures the influence of population, affluence and technology on the environment. The environmental impact is measured through carbon dioxide (CO2) emissions. The version of the model is extended in the paper to include specific elements that, a priori, can be expected to be of particular relevance to these countries. These include Governance indicators, energy consumption and energy production indices. The results supports the endogeneity of Governance as well as Arab countries need effective governments to minimize carbon emissions.
JEL Classification: Q5, O4
Keywords: Arab countries, Population, Environment, CO2 emissions, Climate change, Governance, STIRPAT model, Panel IV estimation
ملخص ھ���ذا اآلن ض���غطا كبی���را عل���ى البیئ���ة یش���كل الماض���یة، و 20العدی���د م���ن ال���دول العربی���ة ب���وتیرة س���ریعة ف���ي الس���نوات ال تط���ورت
الطبیعی���ة م���ن خ���الل النم���و الس���كاني، واإلجھ���اد البیئ���ي واس���تخراج الم���وارد. احتم���االت تغی���ر المن���اخ الناجم���ة ع���ن زی���ادة انبعاث���ات
تتحق��ق ف��ي كثی��ر م��ن ھ��ذه البل��دان. تتن��اول ھ��ذه والت��ى كث��ر اس��تدامةاألث��اني أكس��ید الكرب��ون یھ��دد احتم��ال وج��ود نم��وذج التنمی��ة
STIRPATتغی���ر المن���اخ. تعتم���د ورق���ة نم���وذج لالتف���اعالت بب���ین الس���كان والبیئ���ة فیم���ا یتعل���ق وال���رابط الورق���ة ال���دول العربی���ة
الس���كان، الث���راء والتكنولوجی���ا عل���ى البیئ���ة. ی���تم قی���اس األث���ر البیئ���ي م���ن خ���الل انبعاث���ات ث���اني زی���ادة الث���اني، وال���ذي یق���یس ت���أثیر
ورق���ة لتش���مل عناص���ر مح���ددة، بداھ���ة، م���ن المتوق���ع أن تك���ون ذات الص���دار نم���وذج ف���ي ). ت���م تمدی���د إCO2أكس���ید الكرب���ون (
وج���ود ت���دعم أھمی���ة خاص���ة لھ���ذه ال���دول. وتش���مل ھ���ذه المؤش���رات الحك���م، واس���تھالك الطاق���ة ومؤش���رات إنت���اج الطاق���ة. النت���ائج
الكربون. حكومات فعالة للحد من انبعاثاتلوجود ، فضال عن حاجة الدول العربیةباطنیا الحكمعامل

3
1. Introduction Awareness of the potentially harmful effects of climate change was accelerated after the alarming signals from the club of Rome.1 Pollution today is common to all countries, developed and developing, and is mainly attributed to expanding industrialization, urbanization and new income patterns which have led to mass consumption (Rostow, 1990). The result has been a clear shift in climate patterns driven by accelerating greenhouse gases emissions. Parallel to this many developing countries have been experiencing very high levels of population growth. The population of the less developed world represents around 83 percent of World population estimated at around 7 billion in 2014. Accelerating CO2 emissions coupled with rapid population growth present a twin threat to sustainable economic and social development because the interactions of these are not fully understood. In particular, their effect on environmental degradation (water and air pollution, desertification and human health) is still not clear.2 Rapid population growth puts numerous pressures on many developing countries. It requires more job opportunities and greater infrastructure projects such as housing, electricity, roads, education and health care to name just a few. Moreover, population dynamics and changes in the modes of economic production are major factors contributing to greenhouse gas emissions (e.g., O’Neill et al. 2001). These factors in turn, bear the major responsibility for the observed increase in average global temperatures over the last few decades (IPCC 2007). In addition, climate change is transforming ecosystems, threatening plant and animal species and causing several other effects on human societies. It is generally recognized that human pressures on the ecosystems due to economic growth and growing population pressures (Jorgenson and Clark, 2010) produce potential environmental and climate change threats. This is manifested in increasing demand for water, food, energy, and land. Population dynamics, specifically population growth, is commonly cited as one of the major drivers of increasing emissions (see Raupach, 2007). The growth in population has also been accompanied by significant changes in population distributions and age structures and the former has manifested itself most prominently in accelerating rural – urban migration. Many scientists also see the rapid urbanization in developing countries as another ‘driver’ of environmental problems. However the debate over the role of demographic, economic and technological factors in the explanation of environmental impact has evolved since the 1970 has led to the formulation of models, such as the IPAT equation (Ehrlish and Holdren, 1971), which represents general tools for the analysis of human-driven climate change. This model has further evolved into the STIRPAT through the work of Dietz and Rosa (1994,1997), Engleman (1994), Cole et al. (1997), Meyerson (1998), Schmalensee et al. (1998), Shi (2003), York et al. (2003b) and Fan et al. (2006). The STIRPAT model is crucial for estimating carbon emissions elasticities of income and population. These elasticities are highly important to obtain carbon emissions projections for climate change policies/agreements (Liddle, 2015). The Arab region is not exempt from the implications of such models. Indeed the region has been experiencing climate effects, population growth and urbanization growth at a very fast pace over the last forty years. In addition, The Gulf countries are in the top 25 countries of carbon dioxide emissions per capita. This will continue to affect economic development and the quality of life in the region. The purpose of this paper is to examine the interaction between 1 In 1972, the Club of Rome's infamous report “The Limits to Growth” [Meadows, D.H., Meadows, D.L., Randers, J., Behrens_III, W. W. (1972). The Limits to Growth: A Report for the Club of Rome's Project on the Predicament of Mankind. Universe Books, New York] presented some challenging scenarios for global sustainability, based on a system dynamics computer model to simulate the interactions of five global economic subsystems, namely: population, food production, industrial production, pollution, and consumption of non-renewable natural resources. 2 The authors are currently working on a separate paper focusing on these specific elements in the context of Arab countries.

4
population dynamics and climate change in the region and to present possible policy solutions to what appears to be a potentially serious threat to continued economic development. The paper adopts the STIRPAT II model, which measures the influence of population, affluence and technology on the environment. The environmental impact is measured through carbon dioxide (CO2) emissions. The version of the model is extended in the paper to include specific elements that, a priori, can be expected to be of particular relevance to these countries. These include Governance indicators, energy consumption and production indices. The remainder of the paper is organized in the following way. Section 2 offers a background on the demographic characteristics of the Arab world. Population dynamics and sustainable development is sketched in Section 3. Section 4 reviews the impact of climate in terms of sea level rise on population, land and urbanization together with the trends of CO2 emissions with population across the region. The methodology for studying the impact of population on climate in terms of CO2 emissions together with the estimation results and their discussion are depicted in Section 5. Finally, some policy recommendations and conclusions are provided in Section 6.
2. Population Characteristics of Arab Countries All Arab countries are included in this study, except Somalia, which is omitted in some of the analysis due to lack of data.3 In order to understand some underlying characteristics, the countries could be grouped into more homogenous subgroups such as the Gulf Cooperation Council (GCC) and non-GCC countries, high to low income groups and by degree of environmental degradation.
2.1 Population size and density In 2014, the total population of the Arab countries was 377.04 million people. Egypt is the largest with about 83 million inhabitants while Comoros has the smallest number of around 752 thousand. The countries are grouped as shown in Table 2.1. It can be seen from the table that two countries have a population of less than one million. Seven countries have populations ranging between one and five million. Only Tunisia lies in the category of ten and less than twenty million, Sudan is in the category of forty and less than fifty million. This shows the wide differences between Arab countries by population size. Population density ranges between 3.55 to 1,769 inhabitants/km2 for Libya and Bahrain, respectively. The Arab world and World population densities are about 27.68 and 55.56 inhabitants per km2, respectively. The density in almost half of the Arab countries is less than the world average. Density in Bahrain, Comoros, Egypt, Iraq, Jordan, Kuwait, Lebanon, Morocco, Palestine, Qatar, Syria, Tunisia and UAE is higher than the world average.
2.2 Degree of urbanization The percentage of population living in urban areas exceeds 50% of total population in 17 countries (see Figure 1). It is more than 90% in Kuwait and Qatar. This ratio declines to a minimum of 28% in Comoros and 34% in Yemen. Egypt’s urban population is estimated to be around 36 million, which amounts to about 17% of the total Arab world’s urban population. Cities, or urbanization in general, are frequently blamed for human-induced greenhouse gas (GHG) emissions and hence for climate change. This applies to most Arab cities. Figure 1 also illustrates that CO2 per capita emissions is highest in the GCC countries, followed by Libya as an oil producing country. In general, Arab per capita emissions are slightly lower than the World’s emission level (5.06 mt). This applies to all Arab countries with the exception of the
3 The twenty-one Arab countries included in the study are Algeria, Bahrain, Comoros, Djibouti, Egypt, Iraq, Jordan, Kuwait, Lebanon, Libya, Mauritania, Morocco, Occupied Palestine, Oman, Qatar, Saudi Arabia (SA), Sudan, Somalia, Syria, Tunisia, United Arab Emirates (UAE) and Yemen.
5
GCC and Libya, which are superiorly higher than world’s emission level as seen in Figure 1. This accelerates the rate of climate change in the region as a whole.
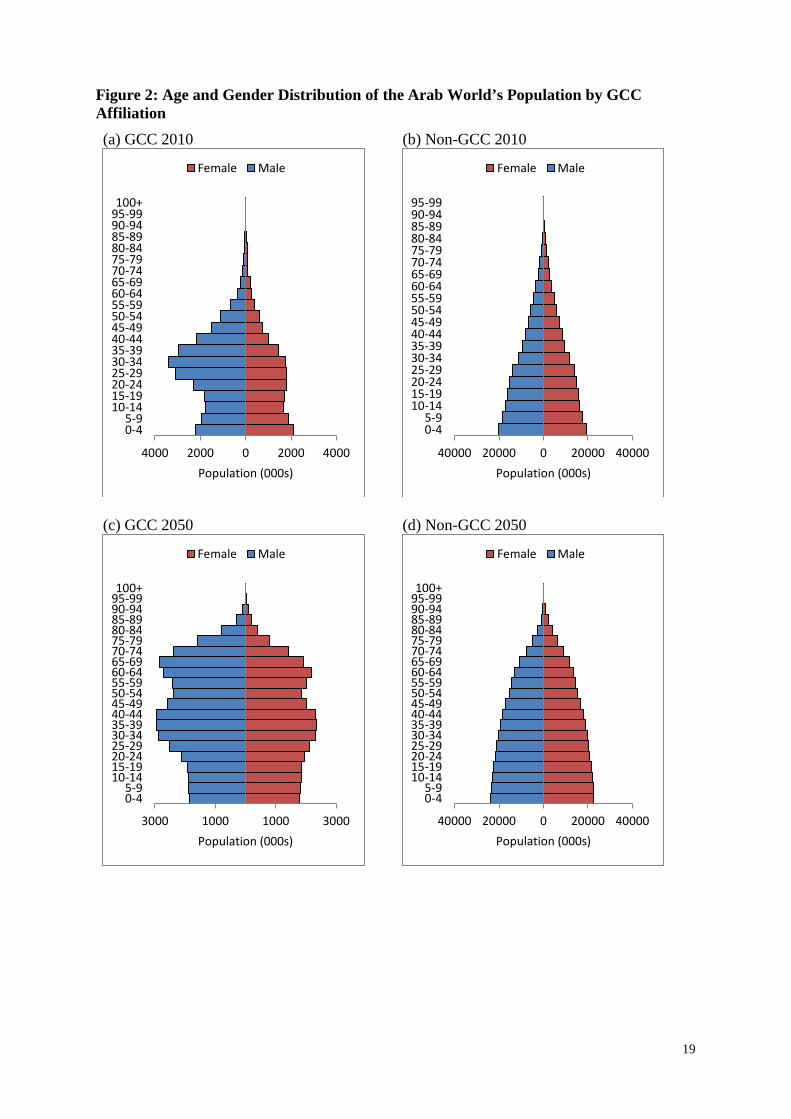
2.3 Gender and age distribution Gender distribution of Arab populations is homogeneous and conforms to World indicators. The exception is in Bahrain, Kuwait, Oman, Qatar, SA and UAE, where male percentage significantly exceeds 50% of their total population. The main reason for this phenomenon is the high percentage of expatriate workers residing in these countries. Due to high population growth, the Arab countries have a large and rapidly expanding youth population. The large and growing youth population of the Arab region could be one of their most significant productive resources. As young people enter working age, they enter the period of their lives when they contribute most to economic development, provided that they benefit from good health, adequate education and employment (UNFPA, 2011). However, an expanding young population makes it difficult for countries to maintain or increase per-capita spending on youth. It requires a pattern of economic development that creates more employment opportunities. Despite the rapid decline in fertility over recent decades, which has occurred in most Arab countries, a very high proportion of the population in these countries still consists of children and adolescents (Figure 2). This ratio is closer to half the population in many of the non-GCC countries, which are most exposed and most vulnerable to climate change. It is 41 percent in Egypt, 47 percent in Djibouti, 51 percent in Sudan and 56 percent in Yemen. In GCC countries, people under 19 make up about 35 percent of the population. This relatively small percentage is caused by expatriate workers who are not allowed to accompany their children. This is reflected by the bulge in the population pyramid with age groups of between 30 and 40 years old. Even more pertinent is the proportion of highly vulnerable children under five, which make up between 10 and 18 percent of the population in countries more likely to be seriously affected. This asymmetrical distribution is apparent in both GCC and Non-GCC countries, where over 35 percent of the population is under 19. Within countries, differences in distribution also exist. It is often the poorest communities that have the highest proportion of children. The child population is expected to grow more slowly over coming decades than the population as a whole in GCC countries but in non-GCC countries where the proportions of children are already high, the absolute number of children is expected to continue to grow.
2.4 Population dynamics The Arab world population is projected to be 467.9 million by 2025, and 632.9 million by 2050 (UNPD, 2011). Bahrain, Qatar and UAE have growth rates exceeding 10 percent (Figure 3). The region has the second fastest growing population in the world. Its high population growth rate is largely driven by high total fertility. Although the Arab World’s population growth rate has slowed down to reach 3.69% in 2010 compared to 4.28% in 1970, it is still more than double that of world population growth rate. The fertility rate is about 3.41 children per woman on average and is projected to drop to 2.1 by the year 2050. However, UNDP (2010) projections estimate the region’s population to be 802 million inhabitants in 2100. While population is stabilizing or declining in some countries, its growth is decelerating in others. Contrary to world norms, population growth in high-income Arab countries remains higher than the less developed countries of the region. Projections indicates that most Arab countries will continue to grow in size until year 2060, thereafter some countries will experience decline in total population. Yet, every decade of delay in reaching replacement-level fertility implies continued, significant population growth for decades to come. Lebanon will be the first Arab country to achieve this fertility level and Iraq and Sudan will catch up in population size by year 2080 (see Figure 4).

6
3. Population and Sustainable Development Development means greater choices and better standards of living measured mainly by higher GDP per capita, elimination of poverty, improved access to basic infrastructure such as water and sanitation, enhanced infrastructure (electricity and roads), increased access to health and education and most importantly equitable economic resource distribution. Environmental preservation should also be explicitly taken into consideration in order to achieve sustainable development (Bargaoui et al., 2014). It is well known that more production will entail environmental degradation. The literature attributes the environmental impact of human activity to three principle determinants, namely the rate of economic growth, the rate of technological progress and the rate of population growth (Ehrlich and Holdren, 1971). In this section, poverty and GDP indicators of the Arab countries are summarized. It highlights the main macroeconomic indicators such as GDP, poverty and unemployment and this is done in order to analyze their interaction with population and climate.
3.1 Sustainable development Generally, a higher GDP will be positively associated with CO2 emission, as will be discussed below. Total GDP (constant 2005 US$) in the Arab countries was estimated to be approximately US$ 1,752 billion in 2014 with Saudi Arabia ranked first at US$ 523.35 billion. In general, GDP in oil producing and exporting countries (OPEC) is the highest. Total GDP of the seven Arab OPEC (i.e., Algeria, Iraq, Kuwait, Libya, Qatar, Saudi Arabia and UAE) is US$1,196 billion, which represents around 68% of all countries included in the study. Due to its small population size and low level of development Comoros has the lowest GDP at around US$463.84 million. The share of industry in GDP varies from 8 to about 84 percent around the Arab World which is in the range of the share of services in the region (10% to 82%). However, the share of agriculture ranges between a minimum of 0.3 percent to a maximum of 51 percent. Industry is the main source of GDP in Iraq (74%), Libya (75%), UAE and Kuwait with about 50% for each. Egypt’s industrial sector contributed approximately 40% of GDP. The services sector contributed about 50% of GDP for the whole group with a standard deviation of 15%. Agriculture is the dominant sector in Comoros (35%) and Sudan (30%). It contributed less than 5% of GDP in Bahrain, Djibouti, Kuwait, Libya, Oman and UAE. The relationship between GDP on the one hand and climate change mitigation and adaptation on the other hand, is not uniform. Dao and van Woerden (2009) list GDP as a mitigation variable. This seems to be logical for the Arab World since GDP per capita is directly and linearly linked to greenhouse gas (GHG) emissions, in particular to CO2 emissions (see Figure 5). This might be due to the influence of other significant factors such as available technology, the structure of the economy, the level of imports/exports and the nature of consumption by households. The fact that GDP is not the only relevant driver of GHG emissions is nothing new. It is however, effective in assessing the impact of climate change on the economy, as will be discussed in section 5.
3.2 Poverty, employment and GDP growth Poverty reduction, employment creation and food security depend on rising economic output, which will in turn increase pressures on all natural resources. Countries of the Arab world are increasingly suffering from rapid land degradation, air pollution and water shortages. Climate change further contributes to a rising intensity and frequency of natural disasters, changes in precipitation and droughts. The latter leads to desertification in many areas of the Arab region which negatively affects food security and induces political conflicts between various factions of population. The poor, who most directly depend on natural resources, are most vulnerable to these changes and at the same time the least capable to cope with them. It is often that women and children are most negatively affected (Tarazona and Gallegos, 2011). Discrimination against women, older persons and migrant workers can further exacerbate these challenges.
7
Reducing the poverty levels from current levels (see Figure 6) depends more generally on the speed of lowering greenhouse gas emissions and environmental impact. The transition to the green economy requires fiscal incentives and disincentives, as well as environmental laws and regulations, which encourage the internalization of externalities, and place a more realistic price on essential and finite natural resources. Environmental impact can also be reduced through more rigorous product standards by reducing packaging of products, eliminating plastic bags in supermarkets and setting emission targets for vehicles. This could also be achieved by the promotion of the development of alternative, renewable and clean energy sources, and the use of resource-efficient technologies. Furthermore, more conscientious consumer behavior of resources use such as shutting off appliances that is not in use to save on electricity and use public transport when possible is in order. Abou-Ali and Thomas (2012) studied the potential of reducing atmospheric pollution through traffic regulation in Egypt. Among the Arab countries, Egypt is by far the largest in terms of population. It faces commensurably vast challenges concerning its environment and economic development. With a massive State apparatus and a massive bureaucracy, it is still lagging behind on environmental protection. However, the Environmental Egyptian Affairs Agency (EEAA) has made good progress in terms of reducing air pollution. With regards to vehicle exhaust fumes, the EEAA has embarked on a number of projects to control air pollution resulting from vehicles exhausts such as: banning leaded gasoline, replacement of old taxis projects, testing program for vehicles on roads and in traffic units, promotion of natural gas as an alternative to oil, “garage relocation projects” as well as protection programs from motorbike exhausts. Another instrument to improving air quality and reducing fuel consumption is expected to be brought through by the newly implemented traffic legislation. However, the implementation of some measures remains slower than expected in view of the rapid increase of traffic. However both in Egypt and across the Arab world achieving effective results depends very much on the presence of good governance – this does not simply mean the establishment of new State environmental agencies or of new legislation – it means that these are actually effective through implementation, monitoring and auditing of their effectiveness (or otherwise). The issue of governance will be returned to in the modelling section of the paper. Growth rates in the Arab low-income group are generally low. Therefore, an expanding youth population makes it difficult for countries to undertake the appropriate effort level to maintain or reduce environmental impacts. Unemployment is particularly high amongst the younger generations. It ranged in 2014, from a high of around 51 percent and 43 percent in Libya and Mauritania, respectively to a low of 1.6 in Qatar (see Figure 7). The problem of rapid population growth outstripping GDP growth simply means even more youth unemployment in the future across many of these countries. This is an inefficient allocation of resources which in itself should be of concern in environmental terms since it leads to more poverty which in turn leads to more inefficient use of land, water and other natural resources as well as further impacts on CO2 emissions due to even less choice of energy alternatives in the home.
4. Population and Climate Change This section tries to shed some light on the relationship between population and climate change. The linkages between population growth and emissions involve several multiplicative factors, each of which may vary significantly among population sub-groups within countries, across countries and over time. As Dodman (2009) argues, there is some evidence of the links between urban density and mitigation. Much depends on the initiatives taken by mayors, community and neighborhood organizations and other local leaders in relation to processes of urban growth and urban organization as well as good governance at all levels of administration.

8
Most of the population growth in the region is taking place in urban areas. Thus, a concern for how the growth in the Arab world’s population influences GHG emissions is largely a concern for how the growth in the urban population influences GHG emissions. An assessment of the contribution to climate change of urban centers or the growth in urban populations can be handled in one of two ways. One is the perspective of ‘where GHGs are produced’ by assessing the source of the proportion of GHGs emitted by human activities within the boundaries of urban areas. The other is from the consumption perspective through assessing all the GHGs emitted because of the consumption and waste generation of urban populations no matter where they were originated. The second perspective depicted in Table 3 implies that in order for any individual or household to contribute to global warming, they have to consume the goods and services that generate GHG emissions. Figure 8 illustrates that there is, in the Arab countries, an inverse relationship between poverty and the per capita CO2 emission levels in 2014 with the exception of Palestine. This relation might be because poor people have little access to goods and services that have high levels of GHG emissions. However, as stated above, their access to energy efficient sources is also very low therefore it is possible that this will retard reductions in GHG’s. Table 2 lists the most likely sources of growing GHG emissions for any city or any nation’s urban population from these two perspectives. In addition, when comparisons for GHG emissions are made between rural and urban areas, generally, no consideration is given to emissions from agriculture and land-use changes in rural areas even though the Intergovernmental Panel on Climate Change (IPCC) suggests that the latter accounts for around 31 percent of all human induced GHG emissions.
4.1 Carbon emissions CO2 is the prime pollutant causing greenhouse gases that lead to climate change. The problem in the Arab region is that all the GCC countries are in the top 25 countries of carbon dioxide emissions per capita. These six countries are prominent oil and natural gas producing countries. Population of GCC countries constitute with only 0.6% of the global population, however they produce 2.4% of the global greenhouse gas emissions (Reiche, 2010). The level of CO2 emissions is generally high in small Arab OPEC countries such as Qatar, UAE, Kuwait and Bahrain, which amounts to 40.13, 19.96, 28.89 and 18.88 metric tons (mt) per capita respectively. On the other hand, this level does not exceed one metric ton per capita in countries like Comoros, Djbouti, Mauritania, Palestine, Sudan and Yemen. Average CO2 per capita in the region in 2014 is 4.54 mt. This is only slightly below the world average which is 4.69mt. Figure 9 depicts trends in per capita CO2 emission for the period 1990 to 2014. It reveals increasing CO2 emissions not only over the years but also between income groups. Furthermore, emission levels do differ between countries within the same income group. It is observed that Oman and Saudi Arabia pollute less per capita than the remaining countries of the GCC (Bahrain, Kuwait, and Qatar). However, it should be noted that Arab countries, even with their relatively low level of industrialization, contribute about 4% of CO2 emissions with 5% of global population. Hence, more industrialization is very likely to take these countries into higher emissions per capita than many other countries unless effective policies are developed, implemented and monitored. Many of the most rapidly growing Arab countries have very low levels of CO2 emissions per capita and have experienced slow growth in these emissions. While others with the slowest growing national and urban populations have the highest levels of GHG emissions per person and have had a rapid growth in CO2 emissions per person. Kuwait, Qatar and the United Arab Emirates are three small population, high-income oil producers and had the highest emissions and very high population growth rates (mostly from immigration).

9
4.2 Projected impact of climate change Climate change seems to be inevitable. The current understanding is that ocean warming plays a major role in intensified cyclone activity and heightened storm surges making coastlines most vulnerable. A caveat is in order however. All Arab countries have coastal zones with some major coastal cities such as Alexandria, Egypt, Kuwait City and Casablanca, Morocco. In Alexandria mitigation measures started as early as 1780. The oldest structure of seawall with an elevation of 1.4 meters above mean water level and a length of 10km was built Abu-Quir in 1780. The purpose was to protect low-lying cultivated land. It is still functioning to date. Several projects were completed in Alexandria to mitigate shore erosion (El-Raey et al., 1995 and Fanos et al, 1995). While the emission of greenhouse gases is spatially blind, in that the effects are the same no matter where it takes place, the impacts of climate change tend to be localized. Thus, for example, the climate-related risks for a settlement located on a coastal delta are likely to be very different from those for a settlement in high-elevation drylands. In modeling future climate, Dasgupta et al. (2009) attempts to measure the impact of a one meter sea level rise (SLR) on various countries by overlaying Geographic Information System information with data on land, population density, agriculture, urban extent, major cities, wetlands, and GDP. In the Arab region, Dasgupta et al. (2009) estimate that the percentage increase in surge zones when compared to current ones is largest for Egypt, followed by Mauritania, Algeria and Libya as depicted in Figure 10. The surge zones of the Arab World amounts to about 10274 km2. The area in Egypt would almost double as a result of SLR and intensified storm surges, increasing from 7.4% of the coastal area at present to 13.6%. Egypt, Mauritania, Saudi Arabia, and Libya would also experience large increases in the extent of their respective surge zones, ranging from 1,183 km2 to 2,290 km2, the surge prone area, as a percentage of country coastal zone total, will be highest in Kuwait (81.07%), followed by Yemen (50.20%), Oman (50.06%), Sudan (49.67%), UAE (47.37%) and Tunisia (45.45%) (See Panel (a) Figure 11). The absolute impact of SLR and intensified storm surges on coastal populations will be particularly severe in Egypt with potential inundation risk for an additional 2.67 million people. Relative exposure of coastal populations, on the other hand, will be more than one-half of coastal population in Kuwait (69.86%), Djibouti (60.12), United Arab Emirates (59.89%), Yemen (55.65%) and Tunisia (51.12%). Dasgupta et al. (2009) further indicate that increases in inundation exposure from storm surges translates to a potential loss of 65.27% of coastal generated GDP in Kuwait, 58.08% in United Arab Emirates, 52.58% in Morocco and 51.98% in Yemen (Panel (c) Figure 11) while GDP loss in absolute terms will be highest in Egypt ($4604.69 million). These data imply very serious consequences for the tourist industry as well as coastal agriculture and fisheries. Coastal agriculture, in terms of extent of croplands, will be affected by 86% in Qatar. GDP can thus be seen as a vulnerability proxy since weaker economies might have more difficulties in adapting to climate change and to its related effects. Large and diversified economies have more power to absorb the shocks of disasters than small and single-sector-based economies. The urban extent along the coast will be prone to flooding therefore the highly vulnerable will be in the United Arab Emirates and Djibouti at about 60%, followed by Kuwait (56.42%), Yemen (55.35%) and Sudan (50%). Egypt and Saudi Arabia will experience the highest absolute increase of their coastal urban extent falling within surge zones with SLR and intensified storm surges of about 627km2 and 390km2, respectively. These data are worrying at the very least but need to be properly interpreted as extremely alarming, especially by the authorities. Given the data and likely scenario depicted above it is essential that we better understand the interactions between population changes, urbanization, governance and CO2 emissions in the

10
Arab region in order to design effective policy responses that not only address CO2 emissions but also the underlying drivers and consequential effects that embrace poverty, unemployment and resource distribution. It is however not feasible (in this paper) to capture all of this in the modelling strategy but we can capture what appears to constitute the salient features of the problem using the STIRPAT model. This is done in the next section of the paper.
5. The STIRPAT Model The model applied in this study is the STIRPAT. It is an extension to the IPAT identity first developed by Ehrlish and Holdren (1971). It is an accounting model that is commonly used to analyze the impacts of human behavior on environmental pressure. The equation is derived from the values of three component expressed as I = PAT; where I acts for environmental impact, P denotes population, A measures the affluence or consumption level per capita, usually expressed in terms of GDP per capita, and T represents technology. IPAT has crucial limitations such as hypothesis testing is not admissible because it is a mathematical identities and the functional relationship assumes proportionality between the variables so it is not obvious which factor influence the environmental impact in this model (York et al., 2003). Dietz and Rosa (1994) proposed the STIRPAT model to overcome the limitation of the IPAT. This model was established by reformulating the IPAT identity into stochastic form: I = aPbAcTde; where I, P, A, and T have the same description as in the IPAT identity; a, b, c, and d are coefficients; and e is a residual term. In this reformulation, data on I, P, A, and T can be used to estimate a, b, c, d, and e with statistical regression methods. The reformulated version can convert the IPAT accounting model into a general linear model, in which statistical methods can be applied to test hypotheses and assess the non- proportionate importance of each influencing factor. York et al. (2003) developed an additive regression model in which all variables are in logarithmic form, facilitating estimation and hypothesis testing. The modified STIRPAT model is expressed as follows: lnI = lna+ b lnP +c lnA + e. Coefficient b indicates percentage change in I in response to a 1 percentage change in population, with other factors held constant. In the standard application of the STIRPAT model, T is included in the error term or is measured by share of industry sector in GDP (York et al., 2003; (Shi, 2003). Most studies used carbon emissions as an indicator of the environmental impact (Zhu, and Peng, 2012; Zhang and Lin, 2012; Zagheni, 2011; Puliafito et al., 2008; Poumanyvong and Kaneko, 2010; Martínez-Zarzoso and Maruotti, 2011; Yuan et al., 2015). It can be stated that there are many studies applying the STIRPAT model to carbon emissions in developing countries. However, there are limited studies focusing on Arab countries. The importance of adopting carbon emissions is that it is known for giving rise to higher temperature through greenhouse gas effect which causes global warming (Shi, 2003). Carbon emissions have increased enormously throughout the past decade. History has shown that industry accounts for the largest proportion of carbon emissions in most developed countries (Zhu and Peng, 2012). Carbon emissions are mostly driven by human activities personified in production and consumption behaviors. Thereby population growth is one of the major influential forces behind the massive increase of global carbon dioxide emissions. The STIRPAT model is applied to the Arab countries in order to study the effects of population, affluence and technology on CO2 emissions at different developmental levels. Affluence is measured by GDP per capita (constant 2005 US$). A potential proxy for technology is the share of industry in GDP (York et al., 2003). It could be further measured by energy intensity as suggested by Fan et al. (2006). The less the energy intensity is, the higher the efficiency of economic activities, and the less the CO2 emissions. Ordinarily, the higher the percentages of population and of urbanization, the more energy consumption will be. The data used is compiled from World Development Indicator (2014), International Energy Agency (2014) and World Governance Indicator covering the whole Arab countries for the years 1990 to 2012. The variables adopted are carbon dioxide emissions, population size, GDP per capita,

11
institution quality, energy consumption, in addition to other demographic factors and energy indicators. The analysis is based on panel data regression techniques to estimate STIRPAT model. Instrumental variable technique is adopted to account for endogeneity of institution quality (Abou-Ali and Abdelfattah, 2013). Error component model is also employed to analyse the interlocking relationship between the STIRPAT model and institution quality simultaneously. Furthermore, differentiation between Arab countries according to their affiliation to oil producing countries and according to their income is explored. This is to model the diverse behaviour and its influence on environmental change. Table 3 shows variables’ specification.
5.1 Empirical analysis First, a fixed-effects (within) regression is estimated for a model with the carbon emissions as dependent variable and population size, income per capita, energy intensity, total energy production, total energy consumption and governance indicator, which is government efficiency, as explanatory variables. Urbanization is dropped because it was statistically insignificant and energy consumption reflects the degree of urbanization. Random-effects model is also estimated assuming the intercept is purely random. However, a Hausman test for model selection is applied in order to check the efficiency of the random-effects model. The Hausman results reject the efficiency of random-effects. Afterwards, governance is built-into the within regression as an instrument and within IV is estimated. Within IV estimation solve the problem of endogeneity (Abou-Ali and Abdelfattah, 2013). Therefore, STIRPAT model and Institution quality equation are solved simultaneously. Fertility rate, industrial value added and services value added is added to institution quality equation. Furthermore, Hausman test is utilized to check whether the governance instrument is valid. The results of this test support the hypothesis that Institution quality is endogenous and OLS estimation will yield inconsistency. The three estimation methods are depicted in Table 4. This table gives rise to consistent coefficients and still has the expected signs. All the coefficients’ results in the three models are statistically significant. The overall model portrayed in Table 4 supports the existence of STIRPAT model. The significant positive relationship between carbon emissions as dependent variable and the independent variables which are population size, income per capita, energy intensity, total energy production, total energy consumption and governance indicator is apparent. A direct interpretation of this result is that carbon emissions will change by a 0.610 percentage changes in response to a one-percentage change in population size, citerus paribus. This result is similar to other STIRPAT analyses such as Dietz and Rosa (1997) and Shi (2003). Moreover, approximately 0.104 percentage changes in carbon emissions in response to a one percentage change in income per capita, with other factors remaining constant. The model shows about 0.397 percentage change in carbon emissions in response to a one-percentage change in energy intensity. Furthermore, the results for total energy consumption show that approximately one percentage change in carbon emissions in response to a one-percentage changes in total energy consumption. This is unit elastic relationship between carbon emissions and total consumption of energy. Last, there is a statistically significant negative relationship between CO2 emission and government effectiveness. Approximately 0.780 percentage changes decrease in emissions in response to one percentage change in governance indicator. As concerns the model taking into account the differentiation between the Arab countries according to their affiliation to GCC countries and according to their income level, the straightforward interpretation of the overall model disappeared. Examining Table 5 using the differentiation by affiliation to GCC countries, the STIRPAT relationship is different from the overall model. GCC countries exhibit U shape relationship since the signs population squared and population are is positive and negative, respectively. The GCC countries are oil-exporting countries; this is obvious from the positive relationship between emissions and total energy

12
production. While energy intensity and total energy consumption is insignificant and was dropped from the GCC model. The income per capita in the GCC model has approximately same coefficient estimate as in the overall model. On the other side, the model of STIRPAT for non-GCC countries has a different story. Non-GCC countries exhibits a quadratic function with income per capita not population size as in GCC countries. This model provides an inverted U shape relationship since the signs income per capita and income per capita squared are is positive and negative, respectively. The institution quality for non-GCC countries is insignificant but the sign is compiling with the hypothesis that good institutions care for environmental protections. Total Energy consumption variable yields a unit elasticity in Non-GCC countries while Total Energy production is insignificant. As for the comparison based on income groups, the picture becomes more interesting. First, the model of GCC countries is identical to the one of high-income countries since the group of countries in both classifications is identical. Second, the variables in all the estimated models are significant except for institution quality indicator in upper-middle and low-middle income countries. Third, the shape of the STIRPAT model curve changes with income group where the relation between CO2 emission and income per capita exhibits a quadratic function for upper-middle, low, and low-middle income countries. Both models exhibits the same an inverted U shape relationship as Non-GCC model. The difference between the upper-middle and low and low-middle income countries is that total energy production and consumption in upper-middle is nearly unit elastic while total energy consumption in low-middle countries is the only unit elastic variable in the model. Moreover, an interaction term between GDP per capita and population size is significantly negatively correlated with carbon emissions in the upper-middle income countries. Therefore, if the two curves are drawn; the first curve for low and low-middle income countries, carbon emission will be increasing then decreasing. Then the second curve for the high-income countries, which are GCC countries, carbon emissions decrease then increase. Finally, a linear relationship appears for the overall model for the Arab countries. Therefore, ignoring this classification will not provide an adequate description of the nature of the relationship between carbon emissions and population dynamics. However, in the low and low-middle income countries, urbanization has a significant negative relationship with carbon emissions. When rural rate is used instead of urbanization, the results showed a significant positive relationship.
6. Conclusion and Policy Recommendation One of the foremost challenges in understanding the linkages between population dynamics and climate change is in identifying, collecting and integrating data. United Nations agencies in collaboration with the Arab league and country level actors must advocate for responses that include the characterization of population trends and support the data collection, research and analysis at the regional and country levels necessary to ensure that those responses are evidence-based. Guzmán (2009), shows that census data provide an insufficiently utilized source of information for the analysis that will improve both mitigation and adaptation efforts of climate change. Encouraging and supporting the timely release of census and survey data also plays an important role in this respect. Population dynamics affect not only poverty reduction, human wellbeing and living standards but also have a strong impact on the social, economic and environmental dimensions. Success in sustainable use of resources, ensuring universal access to clean, safe and affordable energy, building sustainable and livable cities and communities and reducing natural and man-made disasters are strongly and inseparably linked to population dynamics (WEF and UNFPA, 2012). Efforts to promote sustainable development cannot succeed as long as these remain disassociated from the knowledge and policy options linked to population dynamics. Regional and local climate change response measures must take into account the composition and vulnerability of the populations they target.

13
In spite of the extended coastal zones in the Arab region, and the potential impacts of SLR no national or regional mitigation or adaptation strategy has been outlined. Some sporadic efforts may be spotted here and there; however, several important decisions are necessary for sustainable development of coastal regions. First, the initiation of a large scale plan for development of coastal zones based on coastal defense strategy. The strategy should focus on protecting and developing natural and artificial protections such as wetlands, floodwalls and gates. Second, identification of capability gaps and needs of the local communities besides building institutional capacities to achieve long-term progress. This will only be possible through monitoring programs to follow and continuously assess ecological, demographic and socio-economic performance of the region. First, to address challenges associated with population dynamics and promote more sustainable pathways of development, countries should adopt instruments that respect and strengthen human rights and freedoms and support human development. Countries must recognize and seize the powerful potential of youth populations. The legitimate ambition of younger generations to raise their living standards and escape poverty today, not tomorrow, appears to leave little space for environmental concerns. However, the immediate interest of younger generations to achieve material wellbeing and independence is juxtaposed by a more long-term interest of younger generations in a sustainable environment. Younger generations determine the future trends in fertility and population growth, they should also be amongst the foremost advocates of more sustainable patterns of consumption and production. To support the empowerment and participation of youth populations is an important and effective instrument to promote the transition to sustainable development and green economies. Second, there are many components of the link between population dynamics and climate change beyond population size and growth. As the issues of health, gender inequality, migration and displacement and urbanization all link population dynamics with climate change and need to be incorporated in planning and implementing country-level responses. These issues are particularly relevant in the development of adaptation plans to climate change. One may think that the easiest way to mitigate environmental problem is by the reduction of population size/ growth. In the broadest and most simplified terms coastal populations are the most vulnerable to the likely challenges posed by climate change this is aggravated by high concentrations of children in need of care, and with the lowest ratio of caretakers and bread winners to children. This reality arguably increases the vulnerability of these populations in a rather dramatic way. Larger numbers of young children add to the burdens simply by virtue of their age and need for care. In addition, in the context of many of the risks posed by climate change, their needs are likely to intensify, since their stage of development leaves them especially vulnerable to many of the hazards. Children who become ill, malnourished, injured or psychologically affected by disasters, famines, displacement or deepening poverty will increase the challenges faced by their families and communities. With appropriate support, children can be extraordinarily resilient to shocks and stresses, but in extreme situations that affect many people, these supports may not be reliably available. Last but not least, institutions, as defined by Young (2003), are systems of rules, decision-making procedures, and programs that give rise to social practices, assign roles to participants in these practices, and guide interactions among the occupants of the relevant roles (Asia-Pacific Network for Global Change Network, 2005). To better manage natural resources and the environment, efficient institutions at all levels, i.e., local, national, regional and global, independent juridical system and good governance are badly needed. The role of institutions in natural resource management and environmental protection is being increasingly recognized in the context of global environmental change. Inefficient institutions are blamed for environmental degradation and effective environmental management may be seriously

14
handicapped by lack of political, civil and economic liberty; lack of an independent judicial system; and an inefficient or corrupt bureaucracy. Hence, institutions matter. Furthermore, studies show that institutions play a role both in causing and in addressing problems arising from human-environment interactions. However, the nature of this role is complex and not easily described. Therefore, the countries should primarily focus on creating and defending institutions for sustainable governance. However, as pointed out by Ostrom, Young and others (in Paavola 2007), there is not a single and simple institutional solution for the large variability of environmental problems (one-size-does-not-fit-all problem). The change of institutions or the design of new institutions must be done after a careful mapping of a particular situation (especially knowing the ecological, economic and social characteristics of the problem) and with the use of open social dialogue. From this description, it is clear that the empirical evidence is crucial to reach scientific conclusions, which are then transformed into political recommendations. In the fields of environment and climate with relation to population perhaps more than in other disciplines, data issues are crucial to deal with, therefore it is needed to implement integrates surveys in order to enable evidence based research to reach better understanding of the topic and hence better recommendations.

15
Reference Abou-Ali, H. and Abdelfattah, Y. (2013), “Integrated paradigm for sustainable development:
A panel data study”, Economic Modelling, 30, pages 334–342. Asia-Pacific Network for Global Change Network (2005), Role of institutions in global
environmental change. 2005-02-CMY-Sonak Final Report submitted to APN. Bargaoui, S., Liouane, N. and Nouri, F. (2014) “Environmental Impact determinants: An
empirical analysis based on the”, Procedia - Social and Behavioral Sciences, 109, pages 449 – 458.
Baum, C. (2001), “Residual diagnostics for cross-section time series regression models“, The Stata Journal, 1, pages 101–104.
Bloom, D., Canning, D. and Fink, G. (2008), “Urbanization and the Wealth of Nations”, PGDA Working Paper No. 30, http://www.hsph.harvard.edu/pgda/working.htm.
Cole, M., Rayner, A. and Bates J. (1997), “The environmental Kuznets curve: an empirical analysis”, Environment and Development Economics, 2, pages 401 –416.
Dabour, N.M., (2002), “The role of irrigation in food production and agricultural development in the Near East region”, Journal of Economic Cooperation, 23, pages 31-70.
Dasgupta, S., B. Laplante, S. Murray and D. Wheeler, (2009), “Sea-level rise and storm surges: a comparative analysis of impacts in developing countries”, World Bank Policy research Series, 4901.
Dietz, T. and Rosa, E. (1994), “Rethinking the environmental impacts of population, affluence, and technology”, Human Ecology Review, 1, pages 277–300.
Dietz, T. and Rosa, E. (1997), “Effects of population and affluence on CO2 emissions”, National Academic Science, 94, pages 175–179.
Ehrlish, P. and Holdren, J. (1971), “Impact of population growth”, Science, 171, pages 1212-1217.
El-Raey, Nasr, Frihy, Desouki and Dewidar (1995), “Potential impacts of accelerated sea level rise on Alexandria governorate, Egypt”, Journal of Coastal Research, special issue, 14, 190-204.
Engleman, R. (1994), “Stabilizing the atmosphere: population, consumption and greenhouse gases.” http://www.cnie.org/pop/CO2/intro.htm.
Fanos, A., A. Khafagy and R. Dean, (1995), “ Protective works on the Nile Delta coast”, Journal of Coastal Research, 11(2), 516-528.
Gueye, L., M. Bzioul and O. Johnson, (2005), “Water and sustainable development in the countries of Northern Africa: coping with challenges and scarcity.” Assessing sustainable development in Africa, Africa’s Sustainable Development Bulletin, Economic Commission for Africa, AddisAbaba, pages 24-28.
Hoyos, R. and Sarafidis, V. (2006), “Testing for cross–sectional dependence in panel–data models “, The Stata Journal, 6, pages 482-496.
IPCC, (2007), Climate Change 2007: Impacts, Adaptation and Vulnerability. Contribution of Working Group II to the Fourth Assessment Report of the Intergovernmental Panel on Climate Change, M.L. Parry, O.F. Canziani, J.P. Palutikof, P.J. van der Linden and C.E. Hanson, Eds., Cambridge University Press, Cambridge, UK, 976pp.

16
Gueye, L., M. Bzioul and O. Johnson, (2005), “Water and sustainable development in the countries of Northern Africa: coping with challenges and scarcity.” Assessing sustainable development in Africa, Africa’s Sustainable Development Bulletin, Economic Commission for Africa, AddisAbaba, 24-28.
Hoyos, R. and Sarafidis, V. (2006), “Testing for cross–sectional dependence in panel–data models “, The Stata Journal, 6, pages 482-496.
IPCC, (2007), Climate Change 2007: Impacts, Adaptation and Vulnerability. Contribution of Working Group II to the Fourth Assessment Report of the Intergovernmental Panel on Climate Change, M.L. Parry, O.F. Canziani, J.P. Palutikof, P.J. van der Linden and C.E. Hanson, Eds., Cambridge University Press, Cambridge, UK, 976pp.
Jorgenson, A. and Clark, B. (2010), “Assessing the temporal stability of the population/ environment relationship in comparative perspective: a cross-national panel study of carbon dioxide emissions, 1960–2005”, Population and Environment, 32, pages 27–41.
Liddle, B. (2015), “What Are the Carbon Emissions Elasticities for Income and Population? Bridging STIRPAT and EKC via robust heterogeneous panel estimates”, Global Environmental Change, 31, pages 62-73.
Martínez-Zarzoso, I. and Maruotti, A. (2011), “The impact of urbanization on CO2 emissions: Evidence from developing countries”, Ecological Economics, 70, pages 1344–1353.
Meyerson, F. (1998), “Population, carbon emissions and global warming: the forgotten relation at Kyoto”, Population Development Review, 24, pages 115– 130.
O’Neill, B. C., MacKellar, F. L., and Lutz, W. (2001). Population and climate change. Cambridge, UK: Cambridge University Press.
Paavola, J. (2007), “Institutions and environmental governance: A reconceptualization”, Ecological Economics, 63, pages 93-103.
PAI (Population Action International), (2013) Mapping Population and Climate Change. http://www.populationaction.org/Publications2/Data_and_Maps/Mapping_Population_and_Climate_Change/Summary.php, visited 15/5/2013.
Poumanyvong, P. and Kaneko, S. (2010), “Does urbanization lead to less energy use and lower CO2 emissions? A cross-country analysis”, Ecological Economics, 70, pages 434–444.
Puliafito, S., Puliafito, J. and Grand, M. (2008), “Modeling population dynamics and economic growth as competing species: An application to CO2 global emissions”, Ecological Economics, 65, pages 602-615.
Raupach, M.R. (2007), “Global and regional drivers of accelerating CO2 emissions”, PNAS, 104, pages 10288 – 10293.
Reiche, D. (2010), “Energy Policies of Gulf Cooperation Council (GCC) countries—possibilities and limitations of ecological modernization in rentier states”, Energy Policy, 38, pages 2395-2403.
Roudi-Fahimi, F., Creel, L. and Souza, R. (2002), “Finding The Balance: Population and Water Scarcity in the Middle Eastand North Africa”, MENA Policy Brief.
Rostow, W. W. (1990). The Stages of Economic Growth: A Non-Communist Manifesto, Cambridge University press.
Roudi-Fahimi, F., Creel, L. and Souza, R. (2002), “Finding The Balance: Population and Water Scarcity in the Middle Eastand North Africa, MENA Policy Brief.

17
Shafik, N. (1994), “Economic Development and Environmental Quality: An Econometric Analysis “, Oxford Economic Papers, New Series, 46, pages 757-773.
Schmalensee R, Stoker TM, Judson RA (1998), “World carbon dioxide emissions: 1950–2050”, The Review of Economics and Statistics, 80, pages15– 27.
Shi, A. (2003), “The impact of population pressure on global carbon dioxide emissions, 1975–1996: evidence from pooled cross-country data”, Ecological Economics, 44, pages 29–42.
Tarazona, M. and J. Gallegos (2011). Recent trends in Disaster Impact on Child Welfare and Development: 1999-2009, background report to UN. Global Assessment Report on Disaster Risk Reduction 2011, Geneva.
UNFPA (2011), Population Dynamics in the Least Developed Countries: Challenges and Opportunities for Development and Poverty Reduction, Report of the United Nations Population Fund for the Fourth Conference on the Least Developed Countries (Istanbul, 9-13 May 2011), New York, NY.
World Bank, 2015. World development indicators 2015. York, R., Rosa, E. and Dietz, T. (2003), “STIRPAT, IPAT and ImPACT: analytic tools for
unpacking the driving forces of environmental impacts”, Ecological Economics, 46, pages 351-365.
Young O. R. (2003), “Environmental Governance: The Role of Institutions in Causing and Confronting Environmental Problems”, International Environmental Agreements, 3, pages 377-393.
Yuan, R., Zhao, T., Xu, X. and Kang, J. (2015), “Regional Characteristics of Impact Factors for Energy-Related CO2 Emissions in China, 1997–2010: Evidence from Tests for Threshold Effects Based on the STIRPAT Model”, Environmental Modeling & Assessment, 20, pages129–144.
Zagheni, E. (2011), “The Leverage of Demographic Dynamics on Carbon Dioxide Emissions: Does Age Structure Matter?”, Demography, 48, pages 371–399.
Zhang, C. and Lin Y. (2012), “Panel estimation for urbanization, energy consumption and CO2 emissions: A regional analysis in China”, Energy Policy, 49, pages 488–498.
Zhu, Q. and Peng, X (2012), “The impacts of population change on carbon emissions in China during 1978–2008”, Environmental Impact Assessment Review, 36, pages 1–8.

18
Figure 1: Urban and Rural disparities and CO2 emissions in the Arab World Year 2014
051015202530354045
0102030405060708090
100
Alge
ria
Bahr
ain
Com
oros
Djib
outi
Egyp
t
Iraq
Jord
an
Kuw
ait
Leba
non
Liby
a
Mau
ritan
ia
Mor
occo
Pal
estin
e
Om
an
Qat
ar
Saud
i Ara
bia
Suda
n
Syria
Tuni
sia UAE
Yem
en
Arab
Wor
ld
Wor
ld
Met
ric to
ns p
er c
apita
Perc
ent
Urban Rural CO2
19
Figure 2: Age and Gender Distribution of the Arab World’s Population by GCC Affiliation (a) GCC 2010 (b) Non-GCC 2010
(c) GCC 2050 (d) Non-GCC 2050
4000 2000 0 2000 4000
0-45-9
10-1415-1920-2425-2930-3435-3940-4445-4950-5455-5960-6465-6970-7475-7980-8485-8990-9495-99100+
Population (000s)
Female Male
40000 20000 0 20000 40000
0-45-9
10-1415-1920-2425-2930-3435-3940-4445-4950-5455-5960-6465-6970-7475-7980-8485-8990-9495-99
Population (000s)
Female Male
3000 1000 1000 3000
0-45-9
10-1415-1920-2425-2930-3435-3940-4445-4950-5455-5960-6465-6970-7475-7980-8485-8990-9495-99100+
Population (000s)
Female Male
40000 20000 0 20000 40000
0-45-9
10-1415-1920-2425-2930-3435-3940-4445-4950-5455-5960-6465-6970-7475-7980-8485-8990-9495-99100+
Population (000s)
Female Male

20
Figure 3: Population Size and Growth for the Arab World by GCC Affiliation (a) GCC (b) non-GCC
Bahrain
Kuwait
Oman
Qatar
Saudi Arabia
UAE
Bahrain
Kuwait
OmanQatar
Saudi ArabiaUAE
-2
0
2
4
6
8
10
12
14
16
0 20 000 40 000 60 000
PERC
ENTA
GE
THOUSAND
2010 2050 2100
Sudan
Iraq
Yemen
Somalia
Egypt
Sudan
Iraq
Lebanon
Yemen
Somalia
Egypt
Sudan
IraqYemen
-1
0
1
2
3
0 50 000 100 000 150 000
PERC
ENTA
GE
THOUSAND2010 2050 2100

21
Figure 4: Population size by Income Groups 1950-2100 in thousands (a)High Income (b) Upper Middle Income
(C) Lower Middle and Low Income
0
5
10
15
20
25
30
35
40
45
5019
5019
6019
7019
8019
9020
0020
1020
2020
3020
4020
5020
6020
7020
8020
9021
00
THO
USA
NDS
Bahrain Kuwait Oman
Qatar SA UAE
0
5
10
15
20
25
30
35
40
45
50
1950
1960
1970
1980
1990
2000
2010
2020
2030
2040
2050
2060
2070
2080
2090
2100
THO
USA
NDS
Algeria LibyaTunisia JordanLebanon
0
20
40
60
80
100
120
140
1950 1960 1970 1980 1990 2000 2010 2020 2030 2040 2050 2060 2070 2080 2090 2100
THO
USA
NDS
Comoros Djibouti Somalia EgyptMorocco Sudan Mauritania IraqPalestinian Syria Yemen

22
Figure 5: GDP and CO2 Emissions in 2014
Figure 6: Arab World Poverty, Population Growth and GDP Growth in 2014
Note: Poverty measures are from various years starting 2004 according to data availability.
Bahrain
Kuwait
Lebanon
Libya
Oman
Qatar
SAUAE
0
5
10
15
20
25
30
35
40
45
50
0 10000 20000 30000 40000 50000 60000 70000
CO
2 em
issi
ons
(met
ric to
ns p
er c
apita
)
GDP per capita, PPP (constant 2005 international $)
-8.00
-6.00
-4.00
-2.00
0.00
2.00
4.00
6.00
8.00
10.00
0
10
20
30
40
50
60
70
Perc
enta
ge
% o
f pop
ulat
ion
Poverty Population growth GDP growth

23
Figure 7: Arab Unemployment, Population Growth and GDP Growth In 2014
Figure 8: Poverty and CO2 Emissions in 2014
Note: Green triangles are middle-income countries and blue diamonds are low-middle and low income countries.
0
1
2
3
4
5
6
7
8
9
10
0
5
10
15
20
25
30
35
40
45
Perc
enta
ge
% o
f lab
or fo
rce
Unemployment, youth total Unemployment, total GDP growth Population growth
ComorosDjibouti
Egypt
Iraq
Jordan
Mauritania
Morocco
Palestine
Sudan
SyriaTunisia,
Yemen
0
1
2
3
4
0 10 20 30 40 50 60 70
Met
ric to
nnes
Population %

24
Figure 9: CO2 emissions Per Capita by Income Groups 1990-2010 (metric tons per capita) (a) High Income Arab Countries (b) Upper Middle Income Arab Countries
(c) Lower Middle and Low Income Arab Countries
010203040506070
19901991
19921993
1994
1995
1996
1997
1998
19992000
20012002 200320042005
2006
2007
2008
2009
2010
2011
20122013
2014
Bahrain Kuwait Oman
Qatar SA UAE
02468
1012
19901991
19921993
1994
1995
1996
1997
1998
19992000
20012002 200320042005
2006
2007
2008
2009
2010
2011
20122013
2014
Algeria Jordan Lebanon
Libya Tunisia
0
1
2
3
4
51990
19911992
1993
1994
1995
1996
1997
1998
1999
20002001
2002 20032004
2005
2006
2007
2008
2009
2010
2011
20122013
2014
Comoros Djibouti Egypt Iraq Mauritania
Morocco Palestine Sudan Syria Yemen

25
Figure 10: Percentage Increase in Storm Surge Zone, Arab World
Data source: Dasgupta et al. (2009)
0102030405060708090
% in
crea
se

26
Figure 11: Projected Impacts of SLR (% impacted as a % of Coastal Total) (a) Land
(b) Population
(c) GDP
(d)Agricultural area
05001000150020002500
020406080
100
Sq k
m
Perc
enta
ge
05001,0001,5002,0002,5003,000
01020304050607080
Thou
sand
Perc
enta
ge
0
1000
2000
3000
4000
5000
010203040506070
Mill
ion
$
Perc
ent
0100200300400500600700800
0102030405060708090
Sqkm
Perc
enta
ge

27
(e) Urban Extent
Data source: Dasgupta et al. (2009)
0100200300400500600700
010203040506070
Sqkm
Perc
enta
ge

28
Table 1: Classification of Arab Countries According to Population Size in 2014 Category Countries Population size in thousand Less than 1 million Comoros, Djibouti, 1,639 1mn - less than 5mn Bahrain, Kuwait, Lebanon, Mauritania, Palestine, Oman, Qatar 23,807 5mn – less than 10mn Libya, Jordan, UAE 22,306 10mn – to less than 20mn Tunisia 10,997 20mn – to less than 30mn Saudi Arabia, Syria, Yemen 77,639 30mn to less than 40mn Algeria, Iraq, Morocco, Sudan 146,464 More than 40mn Egypt 83,387

29
Table 2: Possible Drivers of Growing Greenhouse Gas Emissions of the Urban Population in a City or in a Nation
From the production perspective (PP): From a consumption perspective: Sector What drives growing
GHG emissions in urban areas?
What can moderate, stop or reduce this growth?
What drives growing GHG emissions in urban areas?
What can moderate, stop or reduce this growth?
Energy supply
Largely from fossil fuel power stations, resulting in a growth in electricity provision from high GHG-emitting sources.
A shift to less GHG-emitting power generation; incorporation of electricity-saving devices; an increase in the proportion of electricity generated from renewable energy sources.
GHGs from energy supply/electricity now assigned to consumers, so GHG growth is driven by increasing energy use; consumers are also allocated the GHGs from the energy used to make and deliver the goods and services they consume.
As with the production perspective, but also a greater focus on less consumption among high consumption households; a shift to less GHG intensive consumption.
Industry A shift to less GHG-emitting power generation and distribution; incorporation of electricity-saving devices; an increase in the proportion of electricity generated from renewable energy sources.
A shift away from heavy industries and from industry in general to the service sector; increasing energy efficiency within enterprises.
GHGs from industries no longer allocated to the enterprises that produce them, but rather to the final consumers of the products; so again, GHG growth driven by increased consumption.
As in the PP, but with an extra concern to reduce the GHGs embedded in goods consumed by residents and to discourage consumption with high GHG emissions implications.
Forestry and agriculture
GHGs generated by deforestation and agriculture are assigned to rural areas.
GHGs allocated to the consumers of the products.
Encouraging less fossil-fuel-intensive production and supply chains for food and forestry products.
Transport Growing use of private automobiles; increases in average fuel consumption of private automobiles; increased air travel (although this may not be allocated to urban areas).
Increasing the number of trips made on foot, by bicycle, on public transport; a decrease in the use of private automobiles and/or a decrease in their average fuel consumption; ensuring that urban expansion avoids high levels of private automobile dependence.
As in the PP; GHG emissions from fuel use by people travelling outside the urban areas in which they live are allocated to them, including air travel; also concern for GHG emissions arising from investment in transport infrastructure.
As in the PP, but with a stronger focus on reducing air travel and a concern for lowering the GHG emissions implications of investments in transport infrastructure.
Residential/ commercial buildings
Growth in the use of fossil fuels and/or growth in electricity use from fossil fuels for space heating and/or cooling, lighting and domestic appliances.
Cutting fossil fuel/electricity use, thus cutting GHG emissions from space heating (usually the largest user of fossil fuels in temperate climates) and lighting; much of this is relatively easy and has rapid paybacks.
As in the production perspective, but with the addition of GHG emissions arising from construction and building maintenance (including the materials used to do so).
As in the production perspective, but with an added interest in reducing the CO2 emissions embedded in building materials, fixtures and fittings.
Waste and wastewater
Growing volumes of solid and liquid wastes and of more energy-intensive waste.
Reducing volumes of wastes; waste management that captures GHGs.
Large and often growing volumes of solid and liquid wastes which contribute to GHGs; these are allocated to the consumers who generate the waste, not to the waste or waste dump.
As in the PP, but with a new concern to reduce waste flows that arise from consumption in the city but contribute to GHGs outside its boundaries.
Public sector and governance
Conventional focus of urban governments on attracting new investment, allowing urban sprawl and heavy investment in roads, with little concern for promoting energy efficiency and low GHG emissions.
Governance that encourages and supports all the above remedies; also, a strong focus on lowering GHG emissions through better management of government-owned buildings and public infrastructure and services.
Source: Adapted from Satterthwaite (2009)

30
Table 3: Specification of Variables Variable Specification CO2 emission Ln of CO2 emissions (kt) Population Ln of the total population GDP per capita Ln of GDP per capita, PPP (constant 2005 international $) Fertility Fertility rate, total (births per woman) Energy intensity Ln of energy use per constant 2005 PPP$ GDP (kg of oil equivalent per constant 2005 US$) Industrialization Ln of industries output as a percentage of GDP Urbanization Ln of the proportion of population living in urban areas GE Ln of Government Effectiveness. Energy Prod Ln of Total Primary Energy Production (Quadrillion Btu) Service Ln of services output as a percentage of GDP Energy Cons Ln of Total Primary Energy Consumption (Quadrillion Btu)
Table 4: STIRPAT model estimation for the Arab Countries Dependent Variable: CO2 Random Within Within IV Population 0.604*** 0.636*** 0.610*** (12.208) (11.160) (8.297) GDP per capita 0.160*** 0.121*** 0.104*** (6.994) (5.621) (3.709) Energy intensity 0.388*** 0.302*** 0.397*** (7.255) (5.896) (5.458) Energy Cons 0.934*** 0.926*** 0.956*** (6.557) (6.574) (5.292) Energy Prod 0.444*** 0.367*** 0.411*** (7.544) (6.405) (5.491) GE -0.073* -0.132*** -0.780*** (-1.720) (-3.312) (-3.537) Constant -3.998*** -3.650*** -3.377*** (-4.966) (-4.161) (-2.997) Number of observations 437 437 437 R2_within 0.7087 0.7145 0.5322 R2_between 0.7688 0.7008 0.4869 R2_overall 0.7658 0.7005 0.4888 Note: t-statistics are in parenthesis, *** p<0.01, ** p<0.05, * p<0.1

31
Table 5: STIRPAT Model Estimation by GCC Affiliation and Income Group Dependent Variable: CO2
GCC affiliation Income group GCC Non-GCC High Upper- middle Low-middle
GE -6.145*** -0.050 -6.145*** -0.167 0.089 (-4.517) (-0.482) (-4.517) (-0.602) (0.939) Population -6.908*** 1.064*** -6.908*** 1.086*** 0.948*** (-4.802) (15.285) (-4.802) (9.548) (9.940) Population^2 0.272*** 0.272*** (5.373) (5.373) GDP per capita 0.119** 1.875*** 0.119** 2.906*** 2.231*** (2.199) (5.267) (2.199) (3.751) (4.800) GDP per capita^2 -0.103*** -0.151*** -0.123*** (-5.209) (-3.666) (-4.720) Energy Intensity 0.111** 0.219* 0.204*** (2.119) (1.873) (3.067) Energy Cons 1.175*** 0.879*** 1.220*** (7.153) (2.909) (5.886) Energy Prod 0.797*** 0.025 0.797*** 0.978** 0.251** (5.824) (0.389) (5.824) (2.009) (2.309) GDP per capita* Population -0.123**
(-2.472) Constant 55.953*** -17.443*** 55.953*** -22.466*** -18.191*** (5.249) (-9.347) (5.249) (-6.554) (-7.679) Number of observations 138 299 138 115 184
R2_within 0.5960 0.7742 0.5960 0.8854 0.7601 R2_between 0.8536 0.8166 0.8536 0.6964 0.9531 R2_overall 0.7846 0.8160 0.7846 0.7032 0.9502 Note: t-statistics are in parenthesis, *** p<0.01, ** p<0.05, * p<0.1

32
Appendix A Table A1: Arab Countries Classification According to Income Group and GGC Classification
GCC Non-GCC High income High-middle income Low-middle income Low income Bahrain Algeria Djibouti Comoros Kuwait Jordan Egypt Oman Lebanon Iraq Qatar Libya Mauritania Saudi Arabia (SA) Tunisia Morocco United Arab Emirates (UAE) Occupied Palestine
Sudan Syria Yemen