population distribution within the province distribution within the province health service delivery...
TRANSCRIPT

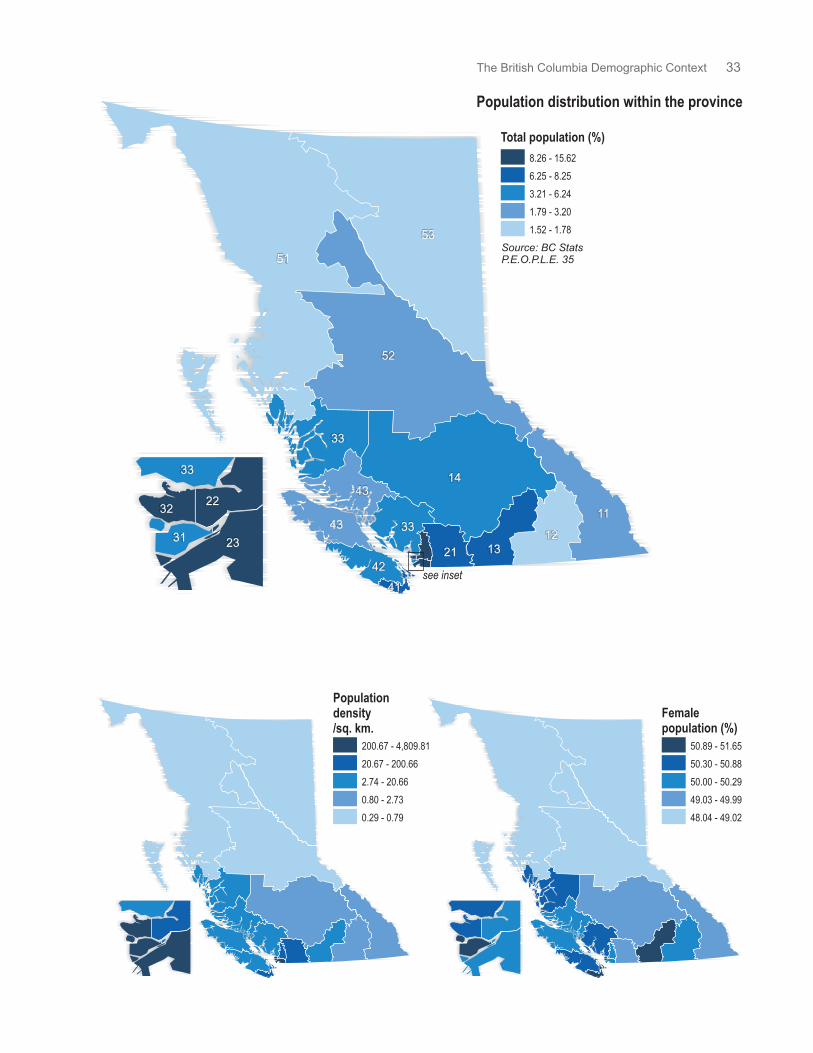
Population distribution within the province
Health Service Delivery Area
Totalpopulation
(%)
Populationdensity/sq. km.
Femalepopulation
(%)
23 Fraser South 15.62 802.29 50.2132 Vancouver 14.44 4,809.81 50.3322 Fraser North 13.39 200.66 50.2941 South Vancouver Island 8.25 155.55 51.6513 Okanagan 7.88 16.42 51.0421 Fraser East 6.28 23.69 49.8333 North Shore/Coast Garibaldi 6.24 5.23 50.8842 Central Vancouver Island 5.87 20.66 50.6414 Thompson Cariboo Shuswap 5.01 1.87 49.9931 Richmond 4.34 1,245.71 51.1752 Northern Interior 3.20 0.79 49.0243 North Vancouver Island 2.70 2.92 50.1011 East Kootenay 1.80 1.76 49.9012 Kootenay Boundary 1.78 2.73 50.0751 Northwest 1.68 0.29 48.7053 Northeast 1.52 0.40 48.04
British Columbia 100.00 4.66 50.39
The maps opposite provide important indicators of the
geographical distribution of the population within BC,
based on HSDA boundaries. The HSDA boundary set was
chosen as it is the dominant administrative unit used in
this When viewed in conjunction with the nighttime
map presented at the end of the chapter, a better
perspective can be provided about the province's
population and the majority of wellness maps that follow.
Data are based on the P.E.O.P.L.E. 35 model population
estimates (BC Stats, 2010b), when BC had an estimated
population of 4,455,210 residents, with an annual 5 year
growth rate of 1.4%.
There are three main population regions in BC. More than
four in every ten (43.45%) people in the province are
found in three HSDAs in the urban lower mainland in the
southwest corner of the province. Fraser South (15.62%),
with a 5 year annual growth rate of 2.0%, and Vancouver
(14.44%) and Fraser North (13.39%), both with an annual
5 year growth rate of 1.5%, clearly dominate the
population distribution within BC. Neighbouring HSDAs,
such as North Shore/Coast Garibaldi, Richmond, and to a
lesser extent Fraser East, also help to make up an ever-
expanding lower mainland region, and when their
populations are included, six in every ten people can be
found in this region, which continues to grow and attract
new residents.
The second major population region is also in the extreme
southwest of the province on the southern tip of Vancouver
Island, where 8.25% of the province's population resides,
and which has been growing at an annual rate of 1.1% for
the last 5 years. Okanagan, in the southern interior of the
province, is the third major population region, with 7.88%
of the province's population. It is the fastest growing HSDA
in the province, with an annual growth rate of 2.2% since
2004.
Provincially, BC had an average population density of 4.66
per square kilometre. Vancouver dominates the province
in terms of population density. As noted in the table, this
HSDA had a population density of approximately 4,810
people per square kilometre. Next in importance was
Richmond, with 1,246 people per square kilometre. Other
lower mainland HSDAs were also prominent, particularly
Fraser South and Fraser North. The only other HSDA with
a relatively high population density was South Vancouver
Island. Generally, population density was high in the
Atlas.
Percent of total population
Population density
southwest of the province, while the whole of the northern
half of BC and much of the interior had very low population
densities. Most of the population in the north and interior
are located in small towns and communities with one or
two notable exceptions.
There are major differences in wellness between genders
(McKee et al., 2010) and women live longer than men (see
life expectancy in Chapter 13), so it is important to view
the relative distribution of genders throughout the
province. Overall, 50.39% of the province's population is
female. The relative figures vary throughout the province,
with a high of 51.65% females in South Vancouver Island
and a low of 48.04% in Northeast. Higher relative
concentrations of females are also found in Richmond and
in Okanagan, while the northern HSDAs have the lowest
concentrations.
Female population
32 BC Atlas of Wellness 2nd Edition
Population distribution within the province
Total population (%)
8.26 - 15.62
6.25 - 8.25
3.21 - 6.24
1.79 - 3.20
1.52 - 1.78
Populationdensity/sq. km.
200.67 - 4,809.81
20.67 - 200.66
2.74 - 20.66
0.80 - 2.73
0.29 - 0.79
Femalepopulation (%)
50.89 - 51.65
50.30 - 50.88
50.00 - 50.29
49.03 - 49.99
48.04 - 49.02
see inset
14
52
53
51
43
43
33
33
21
41
42
1312
11
2331
22
33
32
Source: BC Stats
P.E.O.P.L.E. 35
33The British Columbia Demographic Context