pop rpt 2015 cover arial 12-07-15 - north carolina · financial highlights — fiscal year 2015...
TRANSCRIPT

North Carolina
Financial HighlightsFiscal Year Ended June 30, 2015
North Carolina Offi ce of the State Controller - Linda Combs, Controller
Th e North Carolina Maritime Museum at Southport (top) tells the story of the Cape Fear region and its people. Th e Museum shares tales of pirates and pillage, blockade running, riverfront archaeology, and other nautical adventures.
Th e North Carolina Maritime Museum in Beaufort (middle) refl ects coastal life and interprets lighthouses and lifesaving stations, the seafood industry, motorboats, and more. Th e Museum is the repository for artifacts from Blackbeard’s wrecked fl agship, Queen Anne’s Revenge.
Th e Graveyard of the Atlantic Museum in Hatteras (bottom) is named in honor of thousands of shipwrecks that sank off North Carolina’s coast. Th e Museum preserves and interprets the maritime heritage and shipwrecks of the North Carolina Outer Banks. One historic coast. Th ree unique museums.
Photos courtesy of NC Department of Natural and Cultural Resources

Financial Highlights — Fiscal Year 2015
Page 1
I am pleased to present you with the North Carolina Financial Highlights for the
fiscal year ended June 30, 2015. This popular report represents our continuing com-
mitment to providing the highest standards of financial management and reporting, as
well as fiscal accountability of the resources of the State of North Carolina. We hope
you find this report both informative and beneficial. If you need additional copies or
have questions about this report, please contact either me or our Statewide Accounting
staff at (919) 707-0500.
Thank you for your interest in the State of North Carolina.
Sincerely,
Linda Combs State Controller
December 3, 2015
Introduction
This popular report, North Carolina Financial Highlights, is intended to summarize basic financial information about our
State. This information is supported in more detail in the State’s Comprehensive Annual Financial Report (CAFR). The
CAFR is prepared in accordance with generally accepted accounting principles and is independently audited by the North
Carolina Office of the State Auditor. Much of the information in the CAFR is necessarily technical and complex. As a
result, the full financial statements and note disclosures may not be as useful to the citizens of the State of North Caroli-
na wishing to gain a more general understanding of the State’s finances. Our report provides information at the govern-
ment-wide level in addition to the major fund level, and certain selected statistical information cited in our CAFR. Cover-
age of legally separate but related organizations is limited to universities and community colleges and is at a very high
level.
The popular report is a report for the people. North Carolina Financial Highlights is the product of a coordinated effort
on the part of state and local governments to issue simplified financial reports. It is our intent to provide you with in-
formation about the State’s financial condition without overwhelming detail and technical accounting terminology. This
report contains financial information for the State’s fiscal year ended June 30, 2015. The State’s fiscal year starts July
1, and ends the following June 30. Information is presented in this report on the basis of generally accepted account-
ing principles (GAAP). This popular report and the State’s complete financial statements, known as the CAFR, can be
obtained on the internet at http://www.osc.nc.gov, by telephone at (919) 707-0500, or by writing to the N.C. Office of
the State Controller, 1410 Mail Service Center, Raleigh, N.C. 27699-1410.

Financial Highlights — Fiscal Year 2015
Page 2
State Reporting Entity and Its Services
The State of North Carolina entity as reported in the CAFR includes all fund types of the departments, agencies, boards, commissions and authorities governed and legally controlled by the State's executive, legislative and judicial branches.
In addition, the reporting entity includes legally separate organizations known as component units for which the State is
financially accountable. The component units are discretely presented in the government-wide financial statements. The State's discretely presented major component units are the University of North Carolina System, the State's commu-
nity colleges and the State Health Plan.
The State and its component units provide a
broad range of services to its citizens, including:
K-12 Public Education
Higher Education
Health and Human Services
Economic Development
Environment and Natural Resources
Public Safety, Corrections, and Regulation
Transportation
Agriculture
General Government Services
The Economy During fiscal year 2014-15, the US economy continued to grow at a steady, moderate pace. North Carolina’s economic conditions reflected the same steady improvements experienced by the nation’s economy. Key industries in the State
experienced strong growth during the fiscal year, especially the Professional and Business Services sector, Construction,
and Durable-Goods Manufacturing. Employment improved, although wage growth fell below expectations. The State’s unemployment rate dropped 0.4 percentage points during the year, falling from 6.2% to 5.8%. The State added 97,900
payroll jobs, a significant gain over the 73,600 added the previous year. Wage and salary income grew by 4.2%, which was improved over last year’s 3% but weaker than long-run expectations of 5% to 6%. For the second half of 2015,
economic conditions are expected to contribute to steady employment growth increasing upward pressure on wage growth. In 2016, wages are forecast to approach growth rates closer to the long-range average of 5.1%.
Mile-High Swinging Bridge Photo Courtesy Visit NC Facebook
Financial Highlights — Fiscal Year 2015
Page 3
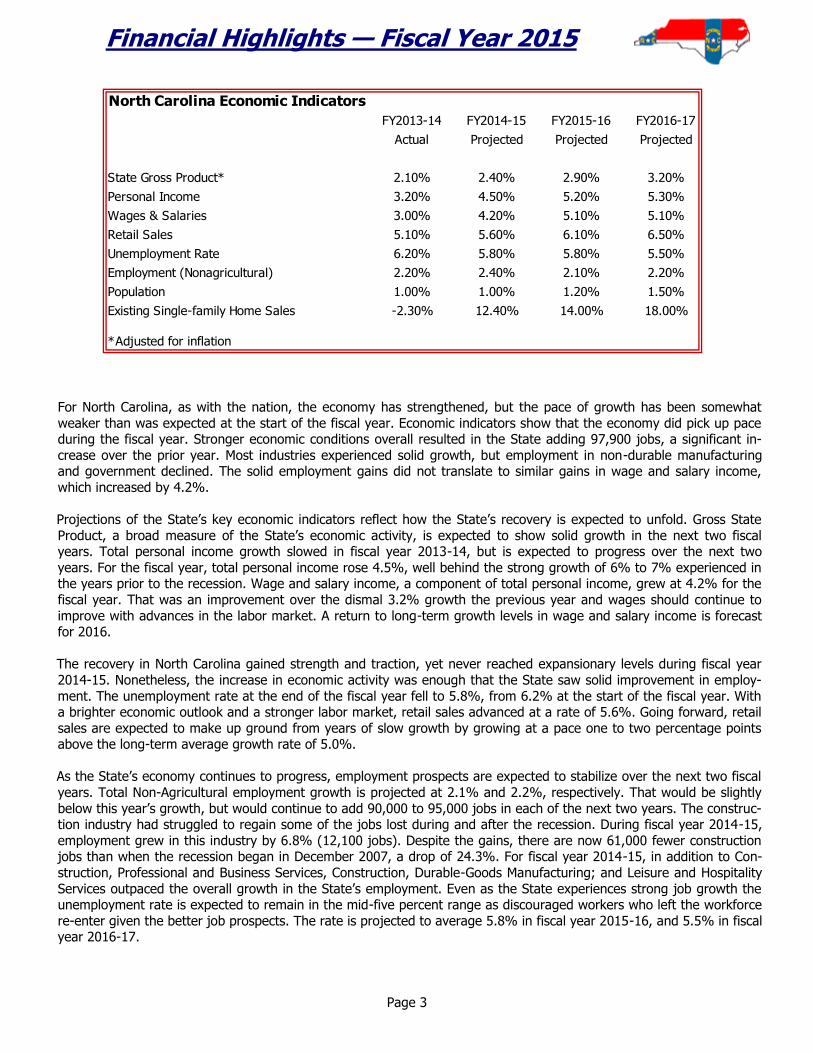
For North Carolina, as with the nation, the economy has strengthened, but the pace of growth has been somewhat
weaker than was expected at the start of the fiscal year. Economic indicators show that the economy did pick up pace during the fiscal year. Stronger economic conditions overall resulted in the State adding 97,900 jobs, a significant in-
crease over the prior year. Most industries experienced solid growth, but employment in non-durable manufacturing and government declined. The solid employment gains did not translate to similar gains in wage and salary income,
which increased by 4.2%.
Projections of the State’s key economic indicators reflect how the State’s recovery is expected to unfold. Gross State
Product, a broad measure of the State’s economic activity, is expected to show solid growth in the next two fiscal years. Total personal income growth slowed in fiscal year 2013-14, but is expected to progress over the next two
years. For the fiscal year, total personal income rose 4.5%, well behind the strong growth of 6% to 7% experienced in the years prior to the recession. Wage and salary income, a component of total personal income, grew at 4.2% for the
fiscal year. That was an improvement over the dismal 3.2% growth the previous year and wages should continue to
improve with advances in the labor market. A return to long-term growth levels in wage and salary income is forecast for 2016.
The recovery in North Carolina gained strength and traction, yet never reached expansionary levels during fiscal year
2014-15. Nonetheless, the increase in economic activity was enough that the State saw solid improvement in employ-
ment. The unemployment rate at the end of the fiscal year fell to 5.8%, from 6.2% at the start of the fiscal year. With a brighter economic outlook and a stronger labor market, retail sales advanced at a rate of 5.6%. Going forward, retail
sales are expected to make up ground from years of slow growth by growing at a pace one to two percentage points above the long-term average growth rate of 5.0%.
As the State’s economy continues to progress, employment prospects are expected to stabilize over the next two fiscal
years. Total Non-Agricultural employment growth is projected at 2.1% and 2.2%, respectively. That would be slightly
below this year’s growth, but would continue to add 90,000 to 95,000 jobs in each of the next two years. The construc-tion industry had struggled to regain some of the jobs lost during and after the recession. During fiscal year 2014-15,
employment grew in this industry by 6.8% (12,100 jobs). Despite the gains, there are now 61,000 fewer construction jobs than when the recession began in December 2007, a drop of 24.3%. For fiscal year 2014-15, in addition to Con-
struction, Professional and Business Services, Construction, Durable-Goods Manufacturing; and Leisure and Hospitality
Services outpaced the overall growth in the State’s employment. Even as the State experiences strong job growth the unemployment rate is expected to remain in the mid-five percent range as discouraged workers who left the workforce
re-enter given the better job prospects. The rate is projected to average 5.8% in fiscal year 2015-16, and 5.5% in fiscal year 2016-17.
North Carolina Economic Indicators
FY2013-14 FY2014-15 FY2015-16 FY2016-17
Actual Projected Projected Projected
State Gross Product* 2.10% 2.40% 2.90% 3.20%
Personal Income 3.20% 4.50% 5.20% 5.30%
Wages & Salaries 3.00% 4.20% 5.10% 5.10%
Retail Sales 5.10% 5.60% 6.10% 6.50%
Unemployment Rate 6.20% 5.80% 5.80% 5.50%
Employment (Nonagricultural) 2.20% 2.40% 2.10% 2.20%
Population 1.00% 1.00% 1.20% 1.50%
Existing Single-family Home Sales -2.30% 12.40% 14.00% 18.00%
*Adjusted for inflation

Financial Highlights — Fiscal Year 2015
Page 4
The housing recession and the subsequent adjustments in the real estate market have taken a long time to unwind. A strong rebound in housing starts (new construction) was underway in 2012, mostly from pent-up demand from the
long housing downturn. In fiscal year 2013-14, housing starts stalled and declined by 2.3%. They took off again in 2014 with yearly growth of 12.4%. Housing starts can provide valuable insight into construction jobs and ripple effects
in other industries such as household furnishing and appliance manufacturing. Additionally, in a healthy economy con-
tractors will be more likely to take risks starting new housing developments. Housing starts are expected to average just below 60,000 per year during the biennium with growth of 14% and 18%, respectively. This would represent near-
ly double the number of housing starts during the recession, but still would be 35,000 less annually when compared to the peak year of 2006.
To summarize, the State’s economic conditions experienced steady improvement during most of the fiscal year. Em-
ployment growth was the strongest since the 2007-2009 recession ended. The State’s economy should track closely
with the national economy the rest of 2015 and into 2016. By 2017, the State’s economy is projected to grow at a pace faster than the national economy. The anticipated strengthening of the economy should increase consumer demand
and solidify employment growth. These projected gains in employment will help to reduce the remaining slack in the labor market, and should place upward pressure on wages. Rising employment and wage gains will greatly improve the
health of the economy as we move into 2016.
— Economic analysis prepared by Barry Boardman, Ph.D., Chief Economist
North Carolina General Assembly, Fiscal Research Division October 5, 2015
Bodie Island Lighthouse Photo Courtesy of Visit NC Facebook

Financial Highlights — Fiscal Year 2015
Page 5
Financial Highlights
Government-wide The State’s total net position increased by $4.95 billion or 12.05% as a result of this year’s operations. Net posi-
tion of governmental activities and business-type activities increased by $3.26 billion (or 8.23%) and $1.69 billion
(or 114.4%), respectively. At year-end, net position of governmental activities and business-type activities totaled $42.86 billion and $3.17 billion, respectively.
Component units reported net position of $22.83 billion, an increase of $941.7 million or 4.3% from the previous
year. The majority of the net position is attributable to the University of North Carolina System, a major
component unit.
Fund Financials The fund balance of the General Fund increased from $1.55 billion at June 30, 2014 (as restated) to $2.51 billion
at June 30, 2015, an increase of 61.44%. A significant decrease in individual income tax refunds, due to tax law
changes, is the main contributor to the fund balance increase. Tax refunds were lower due to the elimination of
many deductions and tax credits and taxpayers not adjusting their withholding amounts for the 2014 tax year. The fund balance of the Highway Fund increased 65.68% to $367.09 million at June 30, 2015. The increase is
attributable, in part, to the issuance of $264.93 million in grant anticipation vehicle (GARVEE) bonds in May 2015.
The fund balance of the Highway Trust
Fund increased 29.45% to $1.13 billion
at June 30, 2015. The increase is due, in part, to the continued growth in new
car sales, which led to an increase in the highway use tax.
The Unemployment Compensation Fund
reported net position of positive $1.14
billion at June 30, 2015 compared to negative $370.52 million at June 30,
2014. The improvement in net position is attributable to the drop in the State’s
unemployment rate and the implemen-tation of Session Law 2013-2. The State
paid off the federal unemployment debt
(amount that was advanced to finance State unemployment benefit payments)
on April 30, 2015. Net ticket sales of the N.C. State Lot-
tery Fund (Lottery) increased 7.23% from the previous fiscal year to $1.97
billion. As required by law, the Lottery transferred $526.43 million to the Gen-
eral Fund to support educational programs. The net position of the N.C. Turnpike Authority (Authority) increased 21.51% to $335.96 million at June 30, 2015.
Total operating revenues increased 24.21% to $30.71 million primarily due to the increase in toll revenues. The Authority receives gap funding of debt service from the Highway Trust Fund.
The net position of the EPA Revolving Loan Fund increased 6.94% to $1.5 billion.
Bechtler Museum of Modern Art Photo Courtesy of Visit NC Facebook
Financial Highlights — Fiscal Year 2015
Page 6
Government-wide Financials
The Statement of Net Position and the Statement of Activities are two financial statements that report information about
the State, as a whole, and about its activities that should help answer this question: Is the State, as a whole, better off
or worse off as a result of this year’s activities?
Governmental activities cover most of the State’s basic services such as health and human services, transporta-
tion and education. These services are generally funded by taxes and intergovernmental revenues. Business-type activities are services provided to the State or outside customers that are similar in function to pri-
vate businesses and are primarily financed by fees charged to the customers. These fees cover all or most of the cost of the service being provided. The State’s Unemployment Compensation Fund, the EPA Revolving Loan
Fund, the N.C. State Lottery Fund, and the N.C. Turnpike Authority are the predominant business-type activities of the State.
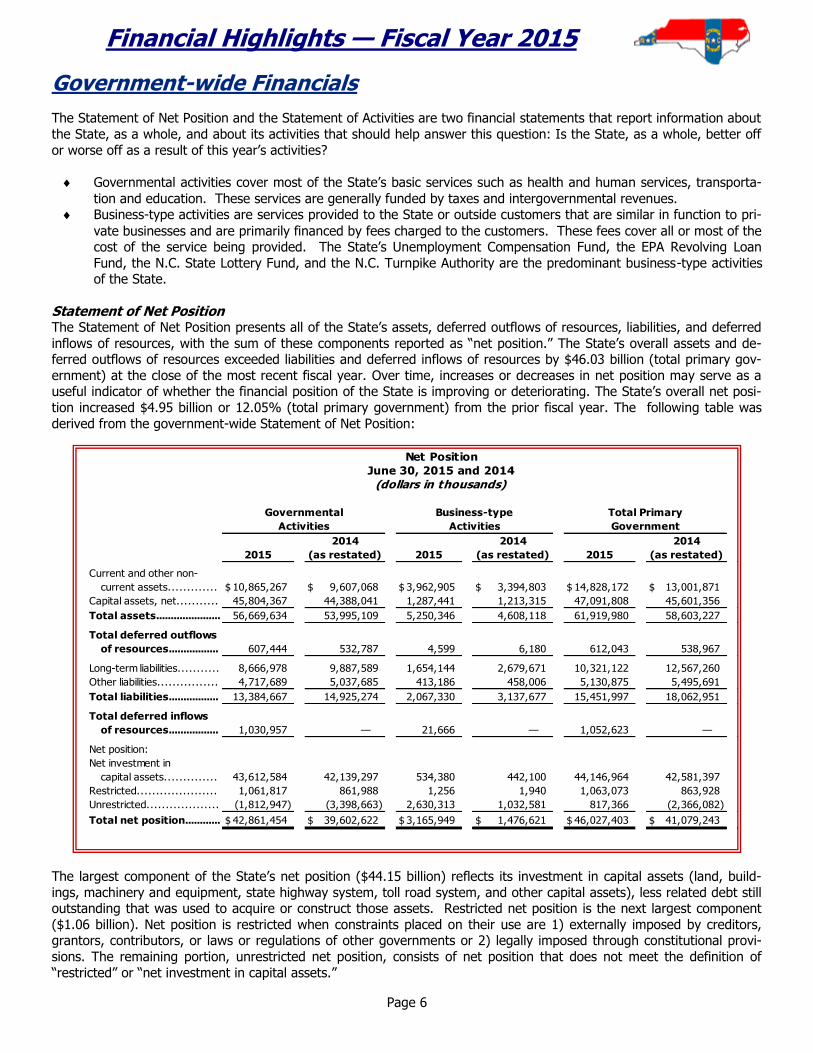
Statement of Net Position The Statement of Net Position presents all of the State’s assets, deferred outflows of resources, liabilities, and deferred
inflows of resources, with the sum of these components reported as “net position.” The State’s overall assets and de-ferred outflows of resources exceeded liabilities and deferred inflows of resources by $46.03 billion (total primary gov-
ernment) at the close of the most recent fiscal year. Over time, increases or decreases in net position may serve as a useful indicator of whether the financial position of the State is improving or deteriorating. The State’s overall net posi-
tion increased $4.95 billion or 12.05% (total primary government) from the prior fiscal year. The following table was
derived from the government-wide Statement of Net Position:
The largest component of the State’s net position ($44.15 billion) reflects its investment in capital assets (land, build-
ings, machinery and equipment, state highway system, toll road system, and other capital assets), less related debt still outstanding that was used to acquire or construct those assets. Restricted net position is the next largest component
($1.06 billion). Net position is restricted when constraints placed on their use are 1) externally imposed by creditors, grantors, contributors, or laws or regulations of other governments or 2) legally imposed through constitutional provi-
sions. The remaining portion, unrestricted net position, consists of net position that does not meet the definition of
“restricted” or “net investment in capital assets.”
2014 2014 2014
2015 (as restated) 2015 (as restated) 2015 (as restated)
Current and other non-
current assets............. 10,865,267$ 9,607,068$ 3,962,905$ 3,394,803$ 14,828,172$ 13,001,871$
Capital assets, net........... 45,804,367 44,388,041 1,287,441 1,213,315 47,091,808 45,601,356
Total assets...................... 56,669,634 53,995,109 5,250,346 4,608,118 61,919,980 58,603,227
Total deferred outflows
of resources................. 607,444 532,787 4,599 6,180 612,043 538,967
Long-term liabilities........... 8,666,978 9,887,589 1,654,144 2,679,671 10,321,122 12,567,260
Other liabilities................ 4,717,689 5,037,685 413,186 458,006 5,130,875 5,495,691
Total liabilities................. 13,384,667 14,925,274 2,067,330 3,137,677 15,451,997 18,062,951
Total deferred inflows
of resources................. 1,030,957 — 21,666 — 1,052,623 —
Net position:
Net investment in
capital assets.............. 43,612,584 42,139,297 534,380 442,100 44,146,964 42,581,397
Restricted..................... 1,061,817 861,988 1,256 1,940 1,063,073 863,928
Unrestricted................... (1,812,947) (3,398,663) 2,630,313 1,032,581 817,366 (2,366,082)
Total net position............ 42,861,454$ 39,602,622$ 3,165,949$ 1,476,621$ 46,027,403$ 41,079,243$
Net Position
June 30, 2015 and 2014
(dollars in thousands)
Activities Activities Government
Governmental Business-type Total Primary

Financial Highlights — Fiscal Year 2015
Page 7
Statement of Activities The Statement of Activities presents information showing how the State’s net position changed during the most recent
fiscal year. The following financial information was derived from the government-wide Statement of Activities and re-flects how the State’s net position changed during the fiscal year:
Governmental Activities:
Revenues outpaced expenses and when combined with transfers from the State’s business-type activities, an in-
crease in net position of $3.26 billion (or 8.23%) resulted for governmental activities.
Total revenues increased by 4.79% ($1.99 billion). Total expenses increased by 3.55% ($1.4 billion).
Business-type Activities:
Business-type activities reflect an overall increase in net position of $1.69 billion or 114.4%, primarily because of
the financial results of the Unemployment Compensation Fund. The net position increase of $1.51 billion in the Unemployment Compensation Fund is explained by the drop in the
State’s unemployment rate. The net position increase of $59.47 million for the N.C. Turnpike Authority is due primarily to transfers in from the
Highway Trust Fund. The net position increase of $97.29 million in the EPA Revolving Loan Fund is due to the recognition of federal
capitalization grants.
The N.C. State Lottery Fund has no net position since its net profits are distributed to the State’s governmental
activities, as required by statute.
Governmental Business-type
Activities Activities Total
Changes in Net Position
Net (expense) revenue (21,399,281)$ 2,105,807 $ (19,293,474)$
General Revenues:
Taxes:
Individual income tax....................................... 11,288,542 — 11,288,542
Corporate income tax...................................... 1,272,879 — 1,272,879
Sales and use tax........................................... 6,869,090 — 6,869,090
Gasoline tax................................................. 1,945,462 — 1,945,462
Franchise tax................................................ 556,786 — 556,786
Highway use tax............................................ 653,931 — 653,931
Insurance tax............................................... 529,927 — 529,927
Beverage tax................................................ 360,280 — 360,280
Tobacco products tax...................................... 279,795 — 279,795
Other taxes................................................. 288,340 — 288,340
Tobacco settlement........................................... 137,910 — 137,910
Unrestricted investment earnings........................... 20,139 — 20,139
Miscellaneous................................................... 34,167 4 34,171
Contributions to permanent funds............................. 4,382 — 4,382
Transfers.......................................................... 416,483 (416,483) —
Total general revenues, contributions, and transfers....... 24,658,113 (416,479) 24,241,634
Change in net position........................................... 3,258,832 1,689,328 4,948,160
Net position — July 1, as restated (Note 23)................. 39,602,622 1,476,621 41,079,243
Net position — June 30.......................................... 42,861,454 $ 3,165,949 $ 46,027,403 $
Condensed Statement of Activities
Primary Government
For the Fiscal Year Ended June 30, 2015
(dollars in thousands)
Primary Government
Financial Highlights — Fiscal Year 2015
Page 8
Statement of Activities (cont’d)
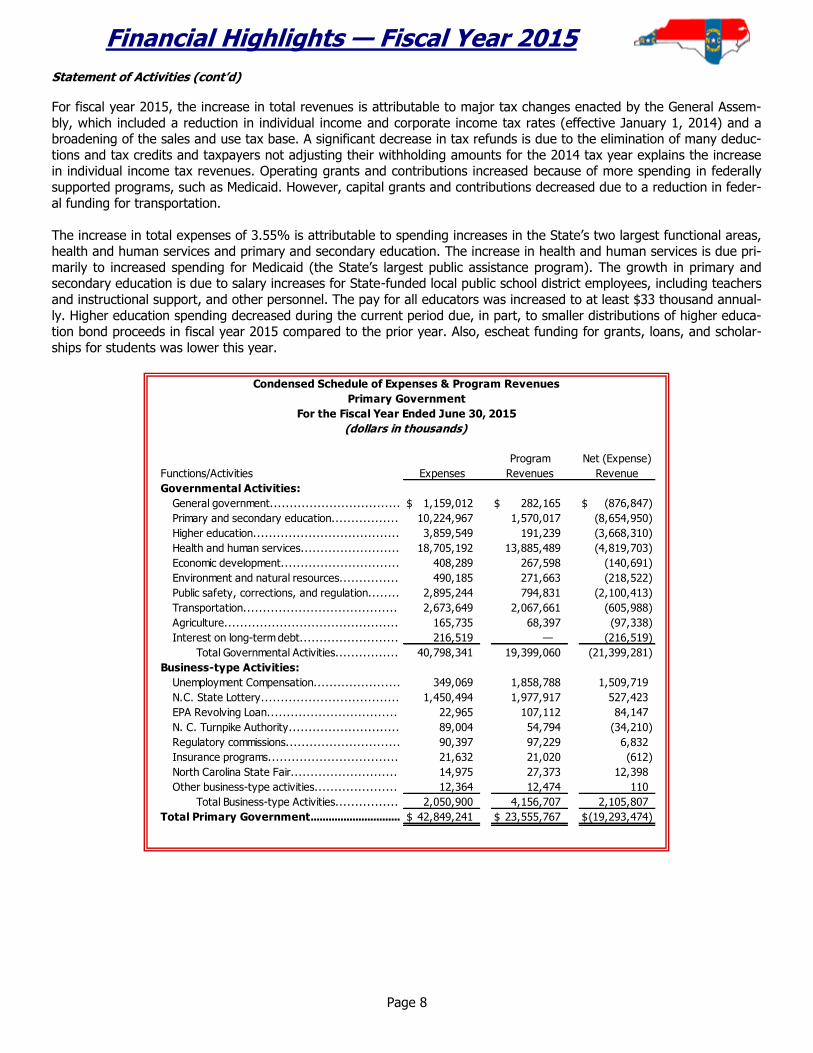
For fiscal year 2015, the increase in total revenues is attributable to major tax changes enacted by the General Assem-
bly, which included a reduction in individual income and corporate income tax rates (effective January 1, 2014) and a broadening of the sales and use tax base. A significant decrease in tax refunds is due to the elimination of many deduc-
tions and tax credits and taxpayers not adjusting their withholding amounts for the 2014 tax year explains the increase in individual income tax revenues. Operating grants and contributions increased because of more spending in federally
supported programs, such as Medicaid. However, capital grants and contributions decreased due to a reduction in feder-
al funding for transportation.
The increase in total expenses of 3.55% is attributable to spending increases in the State’s two largest functional areas, health and human services and primary and secondary education. The increase in health and human services is due pri-
marily to increased spending for Medicaid (the State’s largest public assistance program). The growth in primary and secondary education is due to salary increases for State-funded local public school district employees, including teachers
and instructional support, and other personnel. The pay for all educators was increased to at least $33 thousand annual-
ly. Higher education spending decreased during the current period due, in part, to smaller distributions of higher educa-tion bond proceeds in fiscal year 2015 compared to the prior year. Also, escheat funding for grants, loans, and scholar-
ships for students was lower this year.
Condensed Schedule of Expenses & Program Revenues
Primary Government
For the Fiscal Year Ended June 30, 2015
(dollars in thousands)
Program Net (Expense)
Functions/Activities Expenses Revenues Revenue
Governmental Activities:
General government................................. 1,159,012$ 282,165$ (876,847)$
Primary and secondary education................. 10,224,967 1,570,017 (8,654,950)
Higher education..................................... 3,859,549 191,239 (3,668,310)
Health and human services......................... 18,705,192 13,885,489 (4,819,703)
Economic development.............................. 408,289 267,598 (140,691)
Environment and natural resources............... 490,185 271,663 (218,522)
Public safety, corrections, and regulation........ 2,895,244 794,831 (2,100,413)
Transportation....................................... 2,673,649 2,067,661 (605,988)
Agriculture............................................ 165,735 68,397 (97,338)
Interest on long-term debt......................... 216,519 — (216,519)
Total Governmental Activities................ 40,798,341 19,399,060 (21,399,281)
Business-type Activities:
Unemployment Compensation...................... 349,069 1,858,788 1,509,719
N.C. State Lottery................................... 1,450,494 1,977,917 527,423
EPA Revolving Loan................................. 22,965 107,112 84,147
N. C. Turnpike Authority............................ 89,004 54,794 (34,210)
Regulatory commissions............................. 90,397 97,229 6,832
Insurance programs................................. 21,632 21,020 (612)
North Carolina State Fair........................... 14,975 27,373 12,398
Other business-type activities..................... 12,364 12,474 110
Total Business-type Activities................ 2,050,900 4,156,707 2,105,807
Total Primary Government.............................. 42,849,241$ 23,555,767$ (19,293,474)$

Financial Highlights — Fiscal Year 2015
Page 9
Statement of Activities (cont’d)
The following chart reflects the dollar change in the revenues by source of governmental activities between fiscal years
2014 and 2015.
The following chart reflects the dollar change in the functional expenses of governmental activities between fiscal years 2014 and 2015.
Dollar Change in Governmental Activities Functional Expenses
Between Fiscal Years 2014 and 2015
$—
$(26)
$66
$(16)
$5
$(12)
$892
$(42)
$452
$78
$(200) $(100) $— $100 $200 $300 $400 $500 $600 $700 $800 $900 $1,000
Interest on long-term debt
Agriculture
Transportation
Public safety, corrections and regulation
Environment and natural resources
Economic development
Health and human services
Higher education
Primary and secondary education
General government
(dollars in millions)
Dollar Change in Governmental Activities Revenues by Source
Between Fiscal Years 2014 and 2015
$(157)
$(1)
$(220)
$1,030
$(45)
$712
$(318)
$891
$102
$(500) $(400) $(300) $(200) $(100) $— $100 $200 $300 $400 $500 $600 $700 $800 $900 $1,000$1,100
Other revenues
Tobacco settlement
Other taxes
Sales and use tax
Corporate income tax
Individual income tax
Capital grants and contributions
Operating grants and contributions
Charges for services
(dollars in millions)

Financial Highlights — Fiscal Year 2015
Page 10
Statement of Activities (cont’d)
The following chart depicts the total expenses and total program revenues of the State’s governmental functions. This
format identifies the extent to which each governmental function is self-financing through fees and intergovernmental aid or draws from the general revenues of the State.
Wild Horses at Shackleford Banks Photo Courtesy of Visit NC Facebook
Expenses - Governmental Activities
Fiscal Year Ended June 30, 2015
$0
$1
$2
$3
$4
$5
$6
$7
$8
$9
$10
$11
$12
$13
$14
$15
$16
$17
$18
$19
$20
Generalgovernment
Primary andsecondaryeducation
Higher education Health andhuman services
Economicdevelopment
Environment andnatural
resources
Public safety,corrections, and
regulation
Transportation Agriculture Interest on long-term debt
Expenses
Program Revenues (excluding Capital
Grants)
Billions
Financial Highlights — Fiscal Year 2015
Page 11
Statement of Activities (cont’d)
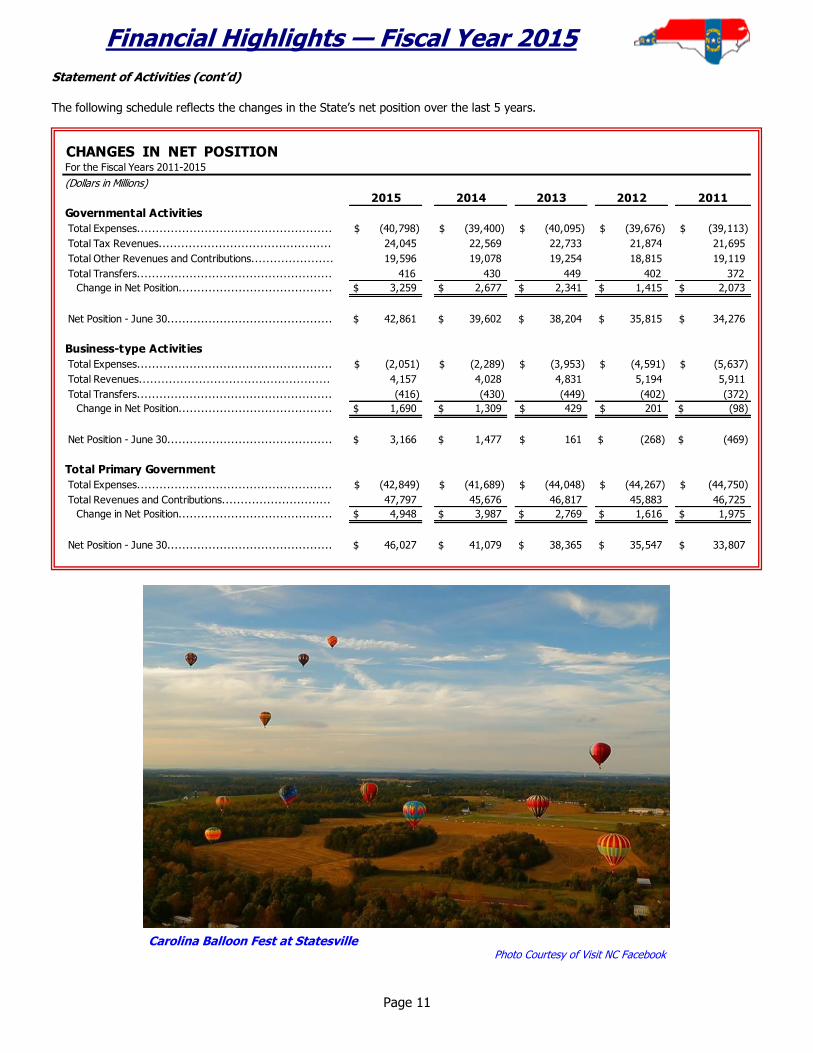
The following schedule reflects the changes in the State’s net position over the last 5 years.
Carolina Balloon Fest at Statesville Photo Courtesy of Visit NC Facebook
CHANGES IN NET POSITIONFor the Fiscal Years 2011-2015
(Dollars in Millions)
2015 2014 2013 2012 2011
Governmental Activities
Total Expenses.................................................... (40,798)$ (39,400)$ (40,095)$ (39,676)$ (39,113)$
Total Tax Revenues.............................................. 24,045 22,569 22,733 21,874 21,695
Total Other Revenues and Contributions...................... 19,596 19,078 19,254 18,815 19,119
Total Transfers.................................................... 416 430 449 402 372
Change in Net Position......................................... 3,259 $ 2,677 $ 2,341 $ 1,415 $ 2,073 $
Net Position - June 30............................................ 42,861 $ 39,602 $ 38,204 $ 35,815 $ 34,276 $
Business-type Activities
Total Expenses.................................................... (2,051)$ (2,289)$ (3,953)$ (4,591)$ (5,637)$
Total Revenues................................................... 4,157 4,028 4,831 5,194 5,911
Total Transfers.................................................... (416) (430) (449) (402) (372)
Change in Net Position......................................... 1,690 $ 1,309 $ 429 $ 201 $ (98)$
Net Position - June 30............................................ 3,166 $ 1,477 $ 161 $ (268)$ (469)$
Total Primary Government
Total Expenses.................................................... (42,849)$ (41,689)$ (44,048)$ (44,267)$ (44,750)$
Total Revenues and Contributions............................. 47,797 45,676 46,817 45,883 46,725
Change in Net Position......................................... 4,948 $ 3,987 $ 2,769 $ 1,616 $ 1,975 $
Net Position - June 30............................................ 46,027 $ 41,079 $ 38,365 $ 35,547 $ 33,807 $

Financial Highlights — Fiscal Year 2015
Page 12
Capital Assets
As of June 30, 2015, the State’s investment in capital assets was $47.09 billion, an increase of 3.27% from the previous
fiscal year-end.
The largest component of capital assets is the state highway system. North Carolina has a 79,584 mile highway system,
making it the second largest state-maintained highway system in the nation. The major capital asset activity
during the current fiscal year included the following:
The N.C. Department of Transportation reported
year-end construction in progress of $1.58 billion
(including land improvements) for state highway projects. Additionally, the N.C. Turnpike Authority
(business-type activity) reported year-end con-
struction in progress of $263 million for the Mon-roe Connector System, a toll project in eastern
Mecklenburg County.
The Department of Health and Human Services
(DHHS) is constructing new psychiatric hospitals
to replace its aging state-operated psychiatric hospitals. It began construction of a new Cherry
Hospital in 2010 and a new Broughton Hospital in
2012. At year-end, construction in progress for Cherry Hospital and Broughton Hospital totaled
$226 million. The new hospitals are being financed by special indebtedness bonds.
DHHS is also replacing major legacy IT systems. NC Tracks, the new multi-payer Medicaid Management Infor-
mation System, became operational on July 1, 2013 (total development cost of $237 million). This system facili-
tates provider enrollment, consolidates claims processing activities, and supports healthcare administration. NC FAST, the new system for managing and administering social services benefits, will improve the way DHHS and
the 100 county departments of social services conduct business. At year-end, computer software in development for NC FAST totaled $301 million.
Cape Fear Memorial Bridge Photo Courtesy of Visit NC Facebook
2014 2014 2014
2015 (as restated) 2015 (as restated) 2015 (as restated)
Land and permanent easements....... 16,634,469 $ 16,221,268 $ 185,894 $ 160,571 $ 16,820,363 $ 16,381,839 $
Buildings................................... 2,757,591 2,792,625 63,288 54,232 2,820,879 2,846,857
Machinery and equipment.............. 604,889 589,323 6,833 8,160 611,722 597,483
Infrastructure:
State highway system................ 22,850,001 21,897,786 — — 22,850,001 21,897,786
NC toll road system................... — — 762,446 778,576 762,446 778,576
Other infrastructure.................. 160,093 163,062 4,322 4,645 164,415 167,707
Computer software...................... 307,400 288,109 987 12 308,387 288,121
Art, literature, and other artifacts.... 116,223 104,296 390 209 116,613 104,505
Construction in progress................ 2,049,311 2,040,771 263,281 206,910 2,312,592 2,247,681
Computer software in development... 324,390 290,801 — — 324,390 290,801
Total................................. 45,804,367 $ 44,388,041 $ 1,287,441 $ 1,213,315 $ 47,091,808 $ 45,601,356 $
Total percent change between
fiscal years 2014 and 2015
Capital Assets as of June 30, 2015
(net of depreciation, dollars in thousands)
3.19 % 6.11 % 3.27 %
Governmental
Activities
Business-type
Activities Total
Financial Highlights — Fiscal Year 2015
Page 13
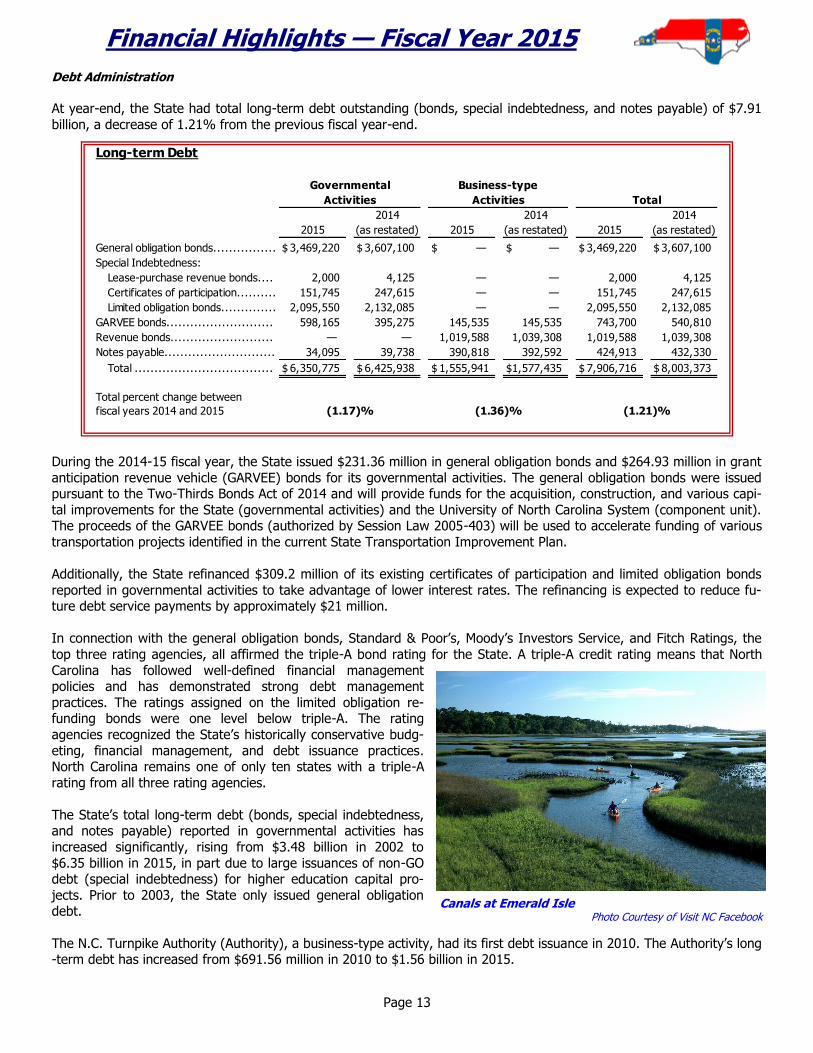
Debt Administration
At year-end, the State had total long-term debt outstanding (bonds, special indebtedness, and notes payable) of $7.91
billion, a decrease of 1.21% from the previous fiscal year-end.
During the 2014-15 fiscal year, the State issued $231.36 million in general obligation bonds and $264.93 million in grant
anticipation revenue vehicle (GARVEE) bonds for its governmental activities. The general obligation bonds were issued pursuant to the Two-Thirds Bonds Act of 2014 and will provide funds for the acquisition, construction, and various capi-
tal improvements for the State (governmental activities) and the University of North Carolina System (component unit). The proceeds of the GARVEE bonds (authorized by Session Law 2005-403) will be used to accelerate funding of various
transportation projects identified in the current State Transportation Improvement Plan.
Additionally, the State refinanced $309.2 million of its existing certificates of participation and limited obligation bonds
reported in governmental activities to take advantage of lower interest rates. The refinancing is expected to reduce fu-ture debt service payments by approximately $21 million.
In connection with the general obligation bonds, Standard & Poor’s, Moody’s Investors Service, and Fitch Ratings, the
top three rating agencies, all affirmed the triple-A bond rating for the State. A triple-A credit rating means that North
Carolina has followed well-defined financial management policies and has demonstrated strong debt management
practices. The ratings assigned on the limited obligation re-funding bonds were one level below triple-A. The rating
agencies recognized the State’s historically conservative budg-
eting, financial management, and debt issuance practices. North Carolina remains one of only ten states with a triple-A
rating from all three rating agencies.
The State’s total long-term debt (bonds, special indebtedness, and notes payable) reported in governmental activities has
increased significantly, rising from $3.48 billion in 2002 to
$6.35 billion in 2015, in part due to large issuances of non-GO debt (special indebtedness) for higher education capital pro-
jects. Prior to 2003, the State only issued general obligation debt.
The N.C. Turnpike Authority (Authority), a business-type activity, had its first debt issuance in 2010. The Authority’s long-term debt has increased from $691.56 million in 2010 to $1.56 billion in 2015.
Long-term Debt
2014 2014 2014
2015 (as restated) 2015 (as restated) 2015 (as restated)
General obligation bonds................ 3,469,220 $ 3,607,100 $ — $ — $ 3,469,220 $ 3,607,100 $
Special Indebtedness:
Lease-purchase revenue bonds.... 2,000 4,125 — — 2,000 4,125
Certificates of participation.......... 151,745 247,615 — — 151,745 247,615
Limited obligation bonds.............. 2,095,550 2,132,085 — — 2,095,550 2,132,085
GARVEE bonds........................... 598,165 395,275 145,535 145,535 743,700 540,810
Revenue bonds.......................... — — 1,019,588 1,039,308 1,019,588 1,039,308
Notes payable............................ 34,095 39,738 390,818 392,592 424,913 432,330
Total ................................... 6,350,775 $ 6,425,938 $ 1,555,941 $ 1,577,435 $ 7,906,716 $ 8,003,373 $
Total percent change between
fiscal years 2014 and 2015
Total
(1.21)%
Business-type
Activities
(1.17)%
Governmental
Activities
(1.36)%
Canals at Emerald Isle Photo Courtesy of Visit NC Facebook
Financial Highlights — Fiscal Year 2015
Page 14
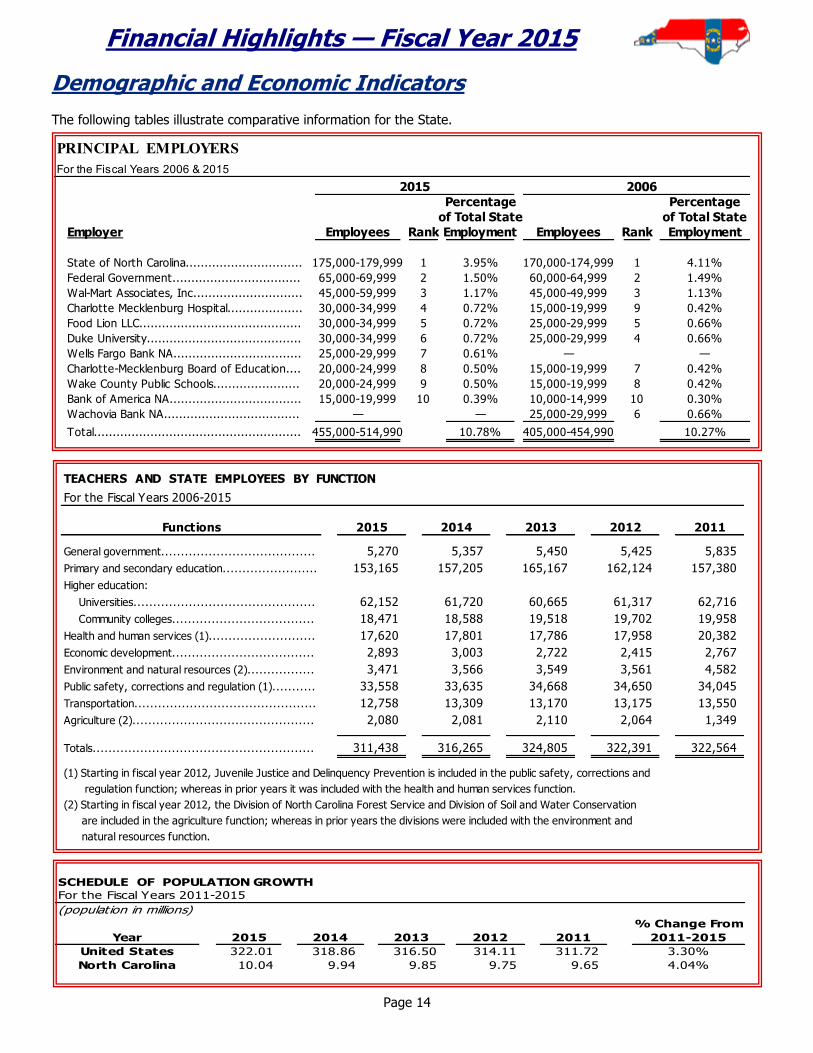
Demographic and Economic Indicators
The following tables illustrate comparative information for the State.
PRINCIPAL EMPLOYERS
For the Fiscal Years 2006 & 2015
2015 2006
Percentage Percentage
of Total State of Total State
Employer Employees Rank Employment Employees Rank Employment
State of North Carolina............................... 175,000-179,999 1 3.95% 170,000-174,999 1 4.11%
Federal Government.................................. 65,000-69,999 2 1.50% 60,000-64,999 2 1.49%
Wal-Mart Associates, Inc............................. 45,000-59,999 3 1.17% 45,000-49,999 3 1.13%
Charlotte Mecklenburg Hospital.................... 30,000-34,999 4 0.72% 15,000-19,999 9 0.42%
Food Lion LLC........................................... 30,000-34,999 5 0.72% 25,000-29,999 5 0.66%
Duke University......................................... 30,000-34,999 6 0.72% 25,000-29,999 4 0.66%
Wells Fargo Bank NA.................................. 25,000-29,999 7 0.61% — —
Charlotte-Mecklenburg Board of Education.... 20,000-24,999 8 0.50% 15,000-19,999 7 0.42%
Wake County Public Schools....................... 20,000-24,999 9 0.50% 15,000-19,999 8 0.42%
Bank of America NA................................... 15,000-19,999 10 0.39% 10,000-14,999 10 0.30%
Wachovia Bank NA.................................... — — 25,000-29,999 6 0.66%
Total....................................................... 455,000-514,990 10.78% 405,000-454,990 10.27%
TEACHERS AND STATE EMPLOYEES BY FUNCTION
For the Fiscal Years 2006-2015
Functions 2015 2014 2013 2012 2011
General government....................................... 5,270 5,357 5,450 5,425 5,835
Primary and secondary education........................ 153,165 157,205 165,167 162,124 157,380
Higher education:
Universities.............................................. 62,152 61,720 60,665 61,317 62,716
Community colleges.................................... 18,471 18,588 19,518 19,702 19,958
Health and human services (1)........................... 17,620 17,801 17,786 17,958 20,382
Economic development.................................... 2,893 3,003 2,722 2,415 2,767
Environment and natural resources (2)................. 3,471 3,566 3,549 3,561 4,582
Public safety, corrections and regulation (1)........... 33,558 33,635 34,668 34,650 34,045
Transportation.............................................. 12,758 13,309 13,170 13,175 13,550
Agriculture (2).............................................. 2,080 2,081 2,110 2,064 1,349
Totals........................................................ 311,438 316,265 324,805 322,391 322,564
(1) Starting in fiscal year 2012, Juvenile Justice and Delinquency Prevention is included in the public safety, corrections and
regulation function; whereas in prior years it was included with the health and human services function.
(2) Starting in fiscal year 2012, the Division of North Carolina Forest Service and Division of Soil and Water Conservation
are included in the agriculture function; whereas in prior years the divisions were included with the environment and
natural resources function.
SCHEDULE OF POPULATION GROWTH
For the Fiscal Years 2011-2015
(population in millions)
% Change From
Year 2015 2014 2013 2012 2011 2011-2015
United States 322.01 318.86 316.50 314.11 311.72 3.30%
North Carolina 10.04 9.94 9.85 9.75 9.65 4.04%

Financial Highlights — Fiscal Year 2015
Page 15
Education Highlights (Primary and Secondary) North Carolina ranks 9th in the Nation for the highest percentage of funds from state revenue. The national average is 46.2%. Most other state school systems are primarily funded by locally driven initiatives such as property taxes and local bond issues.
Of the $7.8 billion State Public School fund for fiscal year 2013-2014, all but 6.3% was used for salaries and benefits. Information provided by NC DPI at www.ncpublicschools.org.
Financial Highlights — Fiscal Year 2015
Page 16
North Carolina Education Lottery For the ninth year in a row, the N.C. Education Lottery completed its fiscal year by setting a
record not only for lottery ticket sales, but also for its contribution to education programs in North Carolina.
The Education Lottery ended the fiscal year on June 30, 2015 with $1.97 billion in sales and
$526 million in earnings. Since inception on March 30, 2006 through the end of fiscal year 2015, the lottery surpassed $13.4 billion in sales and exceeded $3.9 billion in overall transfers
to the state and education.
The instant product continued to be the largest revenue source, generating $1.29 billion in
sales. The lottery launched 50 new instant games during the year, including a $20 game, $200 Million Blowout, which offered 20 prizes from $1 million to $4 million plus a new “Win It
All” feature for players to win all prizes on a ticket with one match. The lottery also launched
its sixth draw game, All or Nothing, a $2 game with a top prize of $250,000 when a ticket matches all of the numbers or none of the numbers drawn.
More than 588,000 North Carolinians joined the lottery’s Lucke-Zone, a website where they can get lottery news, ask questions about lot-
tery games, and enter second-chance drawings and other promotions.
Recruitment and retention of retail locations continued to support ticket sales. In fiscal year 2015, retailers earned
$138.7 million in sales commissions and incentives and the number of retailers stood at 6,901 to finish the year.
The State Lottery Act directs the lottery to increase and maximize the available revenues for education purposes. In fis-
cal year 2015 , a breakdown of lottery revenues showed 62% went to prizes, 27% for education programs that the lot-tery serves, 7% in retailer commissions. The remaining 4% of revenues included 1.5% to gaming vendors, 1% to adver-
tising, and the rest for other administrative expenses.
The Education Lottery transfers its net assets on a quarterly basis to the Office of State Budget and Management to the North Carolina State Lottery Fund. The monies are then distributed as outlined in the fiscal year 2015 budget approved
by the General Assembly.

Financial Highlights — Fiscal Year 2015
Page 17
North Carolina Education Lottery (cont’d)
The following tables illustrate how lottery funds were distributed for education for fiscal year 2015:
Information provided by the North Carolina Education Lottery at www.nc-educationlottery.org.
$-
$50,000
$100,000
$150,000
$200,000
$250,000
$300,000
$350,000
$400,000
2008 2009 2010 2011 2012 2013 2014 2015
Education Lottery Fund Distribution
Fiscal Years 2008-2015
(dollars in thousands)
More-at-Four
Class Size Reduction
School Construction
College Scholarships
UNC Need-Based Aid
Adj to Local School
Sys
13%
63%
17%
5%
2%
Fiscal Year 2015 Education Lottery Fund Distribution
More-at-Four
Class Size Reduction
School Construction
College Scholarships
UNC Need-Based Aid

Financial Highlights — Fiscal Year 2015
Page 18
Transportation Highlights
For the fiscal year 2015, the North Carolina Department of Transportation (NCDOT) listed the following as some of its
key accomplishments:
The 2015 legislative session was a landmark year for NCDOT in terms of obtaining additional state budget authori-
ty for both construction and maintenance of our transportation infrastructure, and modernizing and stabilizing our
major funding sources. The most significant changes include: ending the transfer of more than $200 million annu-
ally from the Highway Fund to the General Fund; stabilizing the motor fuels tax; increasing most DMV fees by 30% and indexing them for inflation (first increase in a decade); and increasing the Highway Use Tax caps on ve-
hicle title transfers for commercial, recreational and out-of-state vehicles.
Achieved financial close and secured funding at historically low interest rates on the I-77 express lanes project -
the State’s first major P3. The express lanes will give drivers the choice to pay a toll that guarantees reliable travel
time or remain in the general purpose lanes for free. The department chose the P3 concept for the I-77 Express Lanes to be able to deliver this project in its in entirety and begin providing reliable travel times and long-term
congestion management in this region much sooner than possible in traditional project methods.
Through a contract with Travelers Marketing LLC that guarantees $2 million in total revenue over four years, State
Farm Insurance is sponsoring NCDOT’s Incident Management Assistance Patrols, which aid in clearing incidents
and offer roadside assistance on major interstate routes throughout the state. The sponsorship will help offset NCDOT’s cost to operate the program.
The Triangle Expressway continued to exceed traffic and revenue projections. Revenue in fiscal year 2015 was
$5.3 million higher than projected in 2009. In the fourth quarter of 2015, year-over-year daily traffic was up 18-
29%, depending on the segment of the facility.
In May, NCDOT started construction on the Monroe Expressway, a roughly 20-mile toll freeway that will pro-
vide an alternative for high-speed regional travel along the U.S. 74 corridor. The new freeway will extend
from U.S. 74 near I-485 in Mecklenburg County to U.S. 74 between the towns of Wingate and Marshville in Union County. The approximately $840 million project is expected to open to traffic in late 2018. The Monroe Express-
way will be managed by the North Carolina Turnpike Authority and use electronic tolling similar to the Triangle
Expressway.
The N.C. Division of Motor Vehicles began offering online driver license renewal, allowing customers to renew their
licenses without coming into a DMV office. By offering online renewals, examiners have more time to serve other customers’ needs. As our population is rapidly growing, this will help us continue to meet increased demand while
holding down costs and reducing wait times.
Information provided by the NCDOT Communications Office. Additional information available at www.ncdot.gov.

Financial Highlights — Fiscal Year 2015
Page 19
Award for Outstanding Achievement
The Government Finance Officers Association of the United States and Canada (GFOA) has given an Award for Out-
standing Achievement in Popular Annual Financial Reporting to the State of North Carolina for its Popular Annual Finan-
cial Report for the fiscal year ended June 30, 2014. The Award for Outstanding Achievement in Popular Annual Financial
Reporting is a prestigious national award recognizing conformance with the highest standards for preparation of state
and local government popular reports.
To receive an Award for Outstanding Achievement in Popular Annual Financial Reporting, a government unit must pub-
lish a Popular Annual Financial Report whose contents conform to program standards of creativity, presentation, under-
standability and reader appeal.
An Award for Outstanding Achievement in Popular Annual Financial Reporting is valid for a period of one year only. The
State of North Carolina has received a Popular Award for the last 17 consecutive years (fiscal years ended 1998-2014).
We believe our current report continues to conform to the Popular Annual Financial Reporting requirements, and we are
submitting it to the GFOA.
25 copies of this public document were printed at a cost of $153.96 or $6.1584 per copy.