pop and fizzle
DESCRIPTION
Pop and Fizzle. Benjamin Tal, Senior Economist. A Lost Decade. US Housing – Far From Normal. Negative Equity in US Housing Market. Credit Availability Still Looks Tight. Number of Failed Financial Institutions (US). US Labour Market: Still Long Way to Full Employment. - PowerPoint PPT PresentationTRANSCRIPT
January 2010
Pop and Fizzle
Benjamin Tal, Senior Economist
| 2
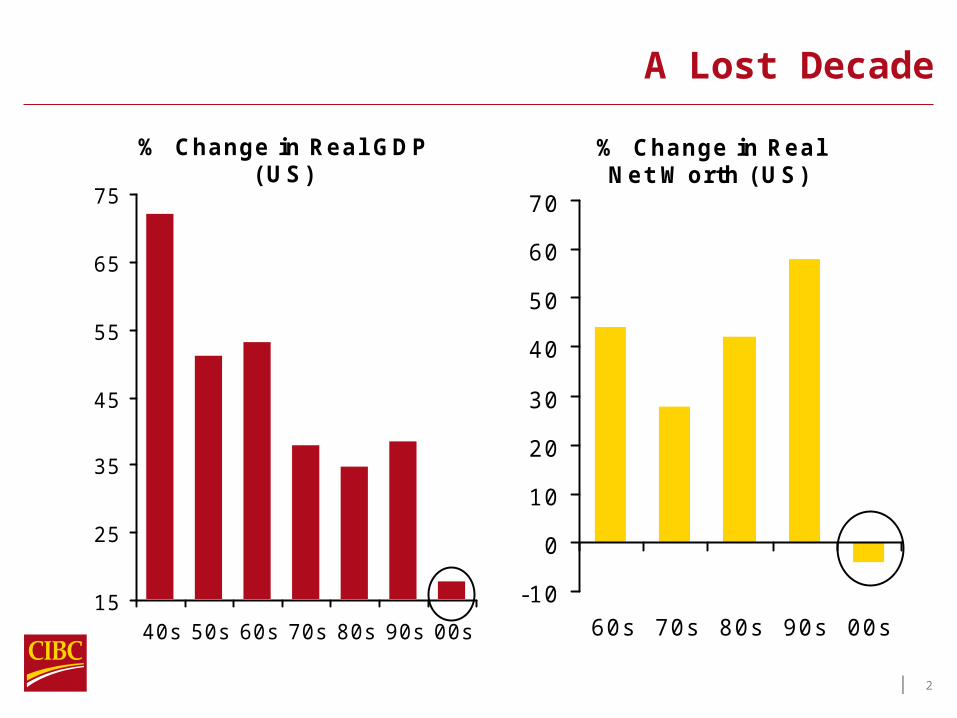
A Lost Decade
% Change in Real GDP(US)
15
25
35
45
55
65
75
40s 50s 60s 70s 80s 90s 00s
% Change in RealNet Worth (US)
-10
0
10
20
30
40
50
60
70
60s 70s 80s 90s 00s

| 3
US Housing – Far From Normal
15
35
55
75
95
115
135
155
175
99 01 03 05 07 09
Existing Home SalesNew Home Sales
I ndex1999=100
First timehome buyer
tax credit
0
2
4
6
8
10
12
14
16
18
20
99 01 03 05 07 09
Ratio - Existing home sales to new home sales
A recordhigh

| 4
Negative Equity in US Housing Market
0
2
4
6
8
10
12
14
16
18
2006 2007 2008 2009
Mn households 10 million with negative equity of more than 20%
| 5
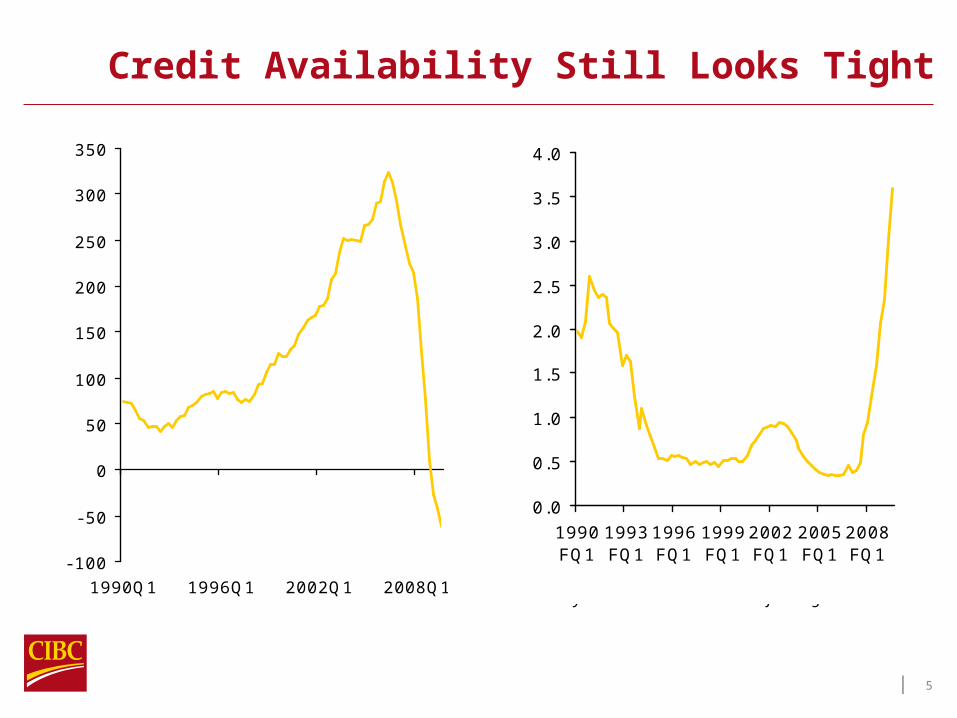
Credit Availability Still Looks Tight
- 100
- 50
0
50
100
150
200
250
300
350
1990Q1 1996Q1 2002Q1 2008Q1
Household borrowing, bn$ (4qrtr avg)
0.0
0.5
1.0
1.5
2.0
2.5
3.0
3.5
4.0
1990FQ1
1993FQ1
1996FQ1
1999FQ1
2002FQ1
2005FQ1
2008FQ1
Ratio, nonperforming loans to total loans
Money centre banks and major regionals
| 6
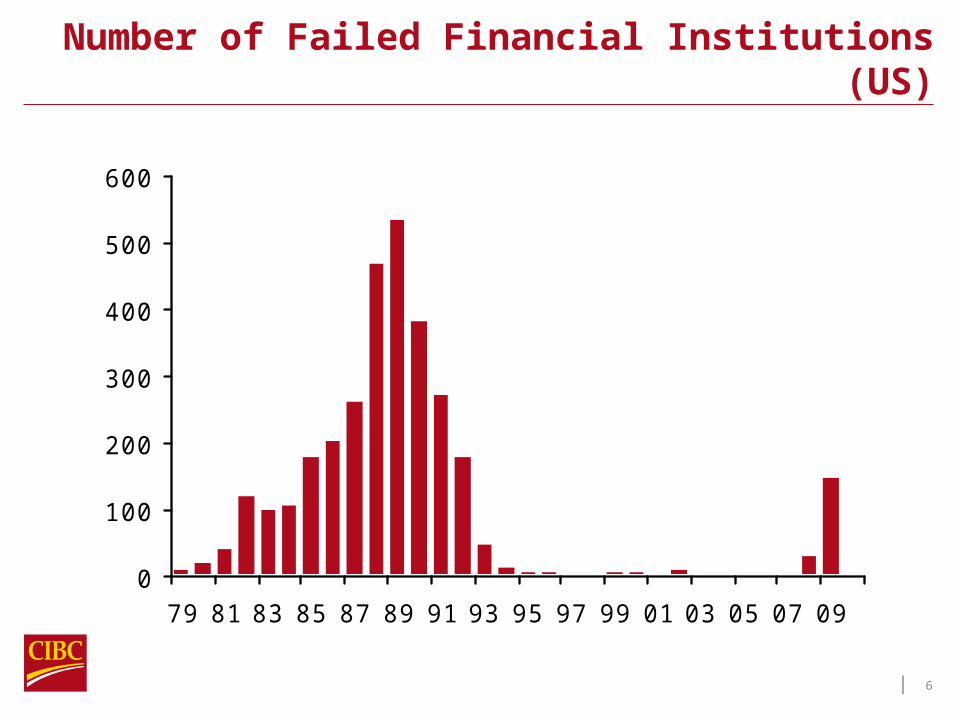
Number of Failed Financial Institutions (US)
0
100
200
300
400
500
600
79 81 83 85 87 89 91 93 95 97 99 01 03 05 07 09
Total (Units)
| 7
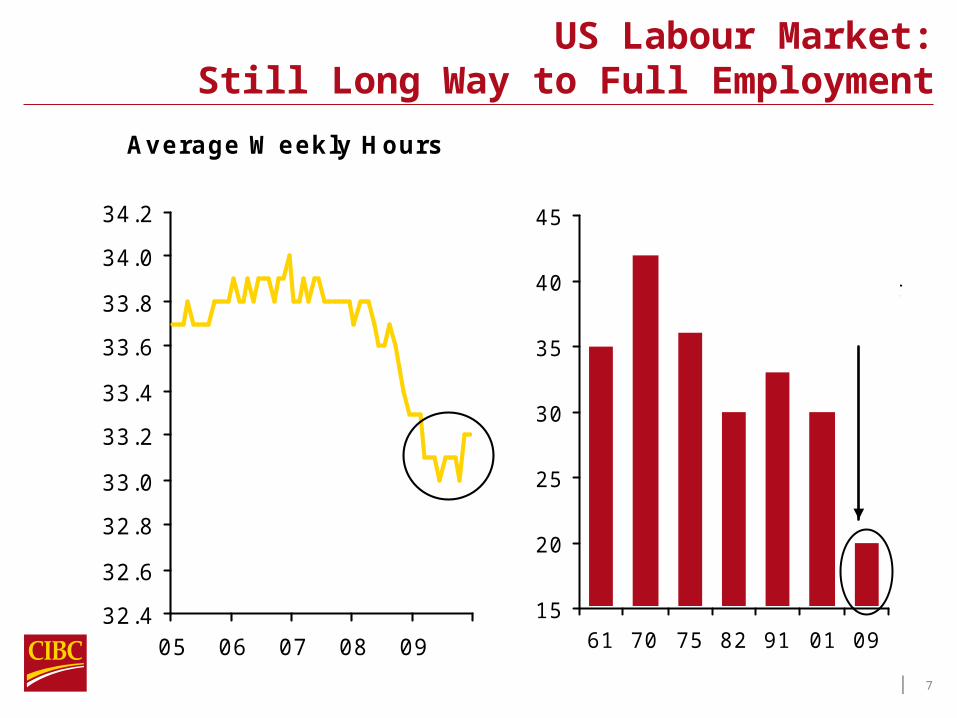
US Labour Market: Still Long Way to Full Employment
15
20
25
30
35
40
45
61 70 75 82 91 01 09
% (eve of recovery)
Probability of ExitingUnemployment in Given Month
Post-warlow
Average Weekly Hours
32.4
32.6
32.8
33.0
33.2
33.4
33.6
33.8
34.0
34.2
05 06 07 08 09

| 8
Mega Bust in US Business Spending
Business I nvestment
-25
-20
-15
-10
-5
0
5
10
15
20
25
71 77 83 89 95 01 07
y/y % chg
2009
Business I nvestment Cumulative Drop
-25
-20
-15
-10
-5
0
Q4-00 toQ2-03
Q2-08 toQ2-09
ITMeltdown
:Peak
toTrough
So farcurrent
recession
%
Source: BEA, CIBC
| 9
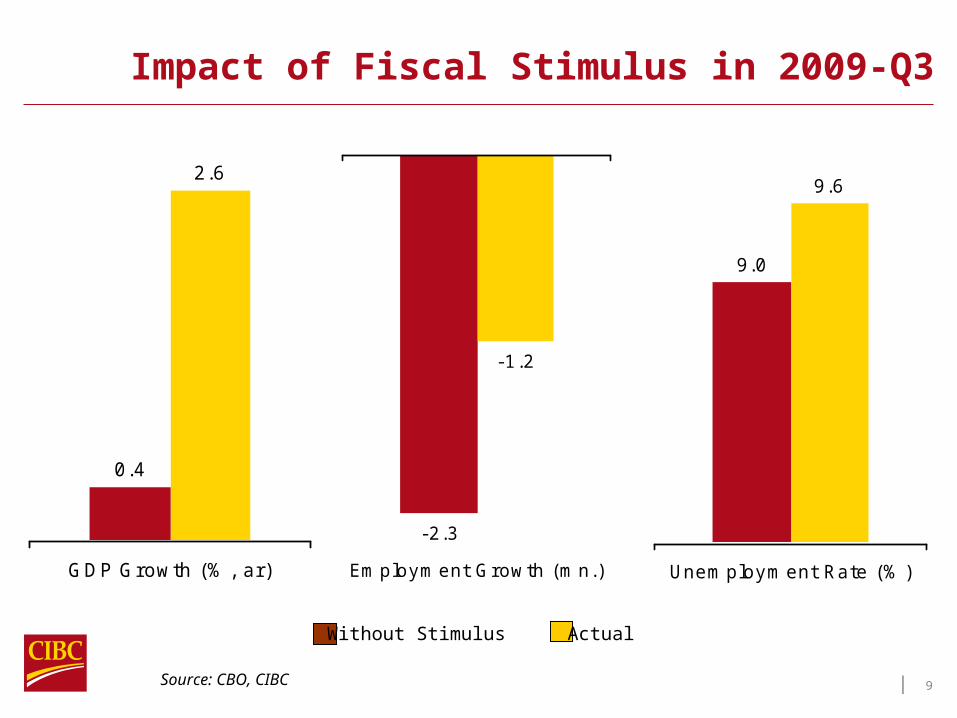
Impact of Fiscal Stimulus in 2009-Q3
Without Stimulus Actual
Source: CBO, CIBC
0.4
2.6
GDP Growth (% , ar)
-2.3
-1.2
Employment Growth (mn.)
9.0
9.6
Unemployment Rate (% )

| 10
Contribution of US Stimulus Package to US GDP Growth (%-pts)
Fiscal Stimulus
-2
-1
0
1
2
3
4
09
Q:2
09
Q:3
09
Q:4
10
Q:1
10
Q:2
10
Q:3
10
Q:4
11
Q:1
11
Q:2
11
Q:3
11
Q:4
Forecast
0

| 11
FED Financing US Budget Deficit
US Budget Deficit
-1600
-1400
-1200
-1000
-800
-600
-400
-200
0Ja
n-0
9Feb
-09
Mar-
09
Ap
r-0
9M
ay-0
9Ju
n-0
9Ju
l-0
9A
ug
-09
Sep
-09
Oct
-09
Nov-0
9D
ec-
09
$Bn
0
200
400
600
800
1000
1200
1400
1600
1800
2000
Jan
-09
Feb
-09
Ma
r-0
9A
pr-
09
Ma
y-0
9Ju
n-0
9Ju
l-0
9A
ug
-09
Se
p-0
9O
ct-0
9N
ov
-09
De
c-0
9
Fed's holdings of US Gov't & Agcy Securities($Bn)

| 12
Massive Fiscal Stimulus Worldwide in 2009/10
-0.5
0.0
0.5
1.0
1.5
2.0
2.5
3.0
3.5
C AN US C HN J PN AUS UK GER FRA
2009 2010
Discretionary Fiscal S timulus, % of GDP
Source: IMF
| 13
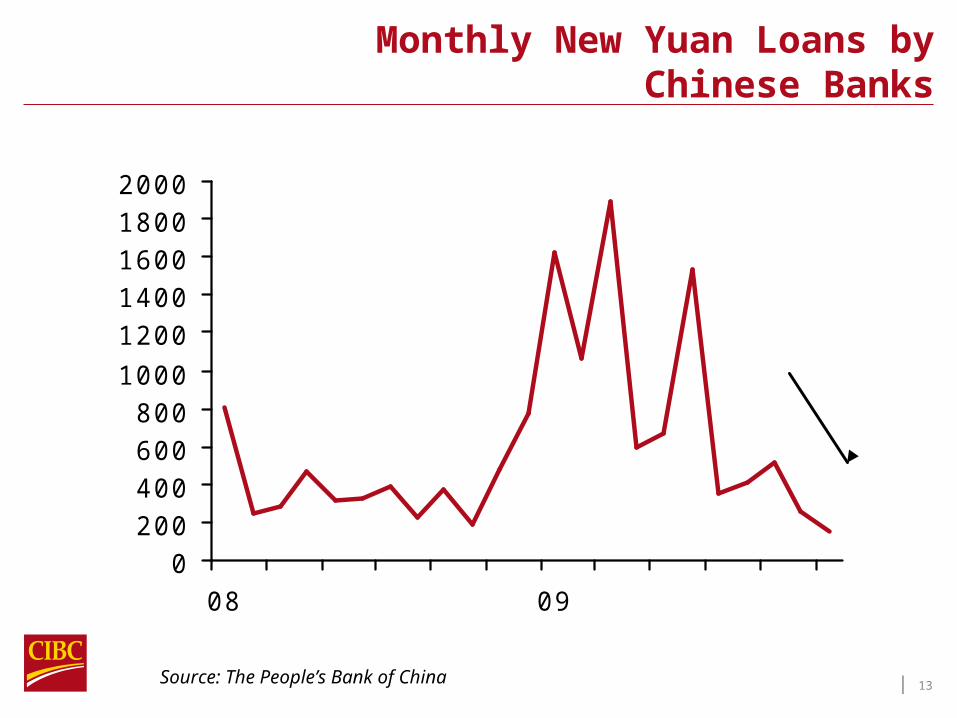
Monthly New Yuan Loans by Chinese Banks
Source: The People’s Bank of China
0200400600800
1000
12001400160018002000
08 09
bn yuan
| 14
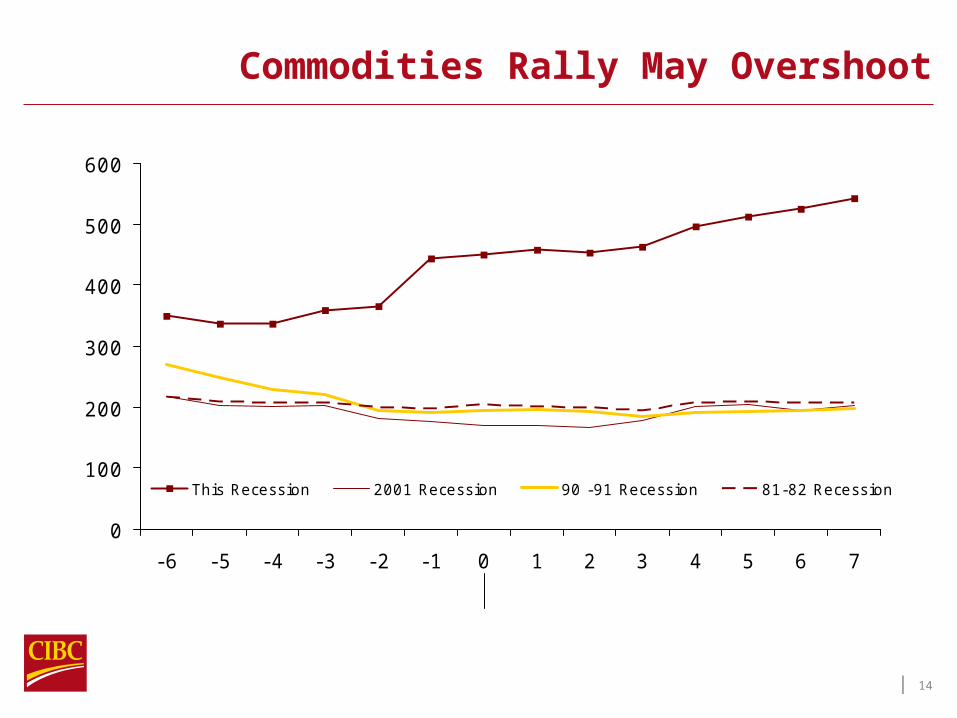
Commodities Rally May Overshoot
0
100
200
300
400
500
600
-6 -5 -4 -3 -2 -1 0 1 2 3 4 5 6 7
This Recession 2001 Recession 90 -91 Recession 81-82 Recession
Months before trough in US GDP Months after trough in US GDP
S&P GSCI I ndex ( J an-70=100)

| 15
C$ Overvalued Relative to Commodities
50
60
70
80
90
100
110
08Q3 08Q4 09Q1 09Q2 09Q3 09Q4
1.00
1.05
1.10
1.15
1.20
1.25
Index (08Q3=100) reverse axis
Source: Statistics Canada, CIBC
C$/US$ (R)
BoC Commodity price index (L)
| 16
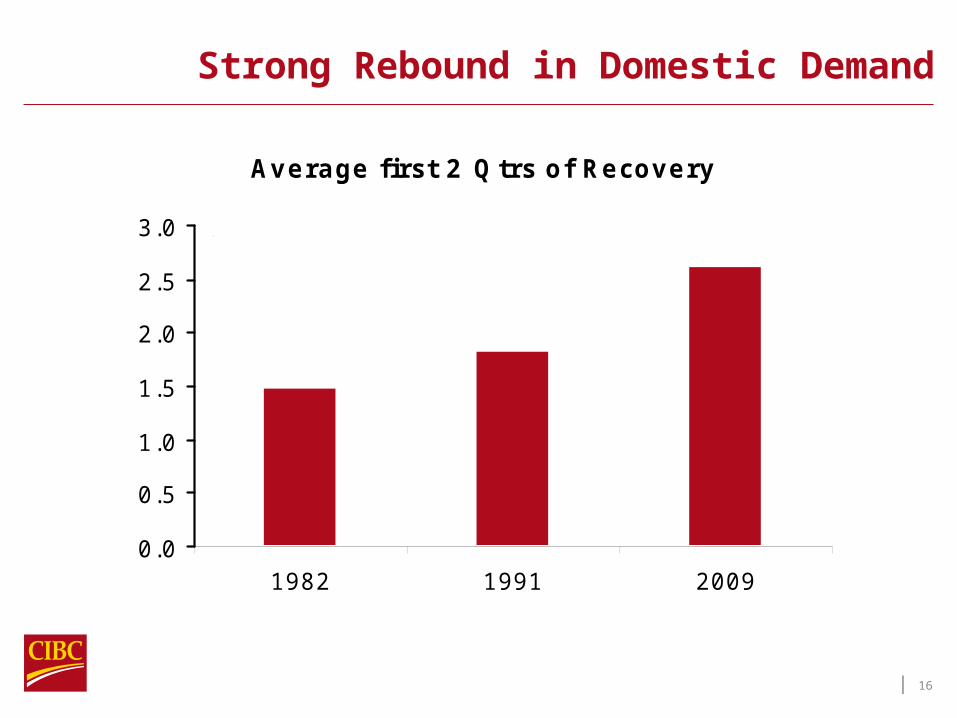
Strong Rebound in Domestic Demand
Average first 2 Qtrs of Recovery
0.0
0.5
1.0
1.5
2.0
2.5
3.0
1982 1991 2009
% (ar)
| 17
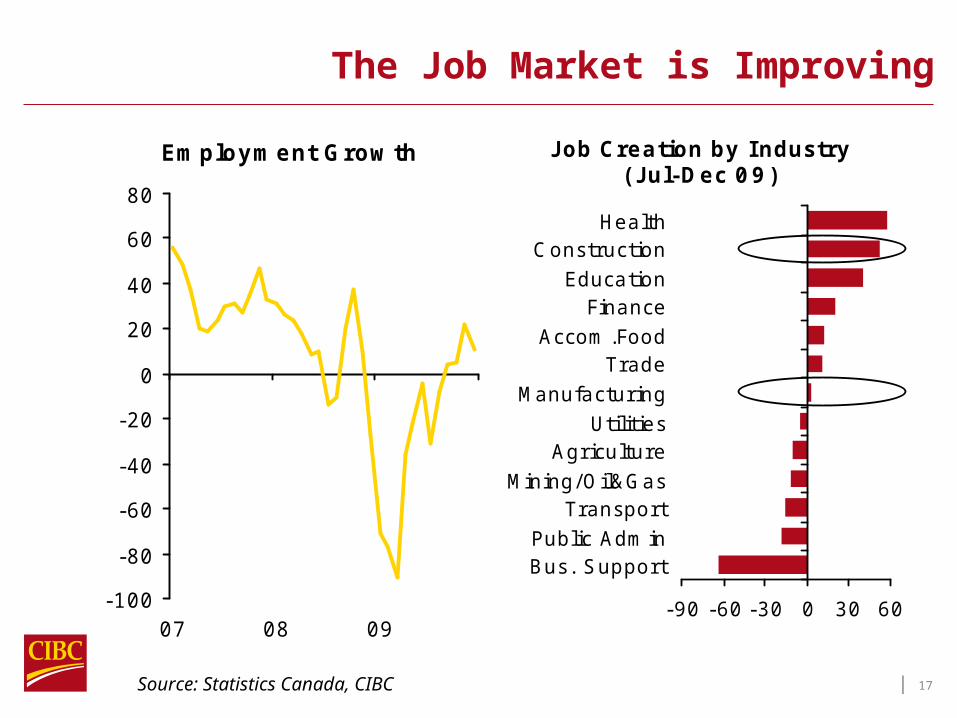
The Job Market is Improving
Employment Growth
-100
-80
-60
-40
-20
0
20
40
60
80
07 08 09
'000, m/m3-mo moving avg
J ob Creation by Industry ( J ul-Dec 09)
-90 -60 -30 0 30 60
HealthC onstruction
EducationFinance
Accom.FoodTrade
Manufacturing
UtilitiesAgriculture
Mining/Oil&GasTransport
Public AdminBus. Support
'000
Source: Statistics Canada, CIBC
| 18
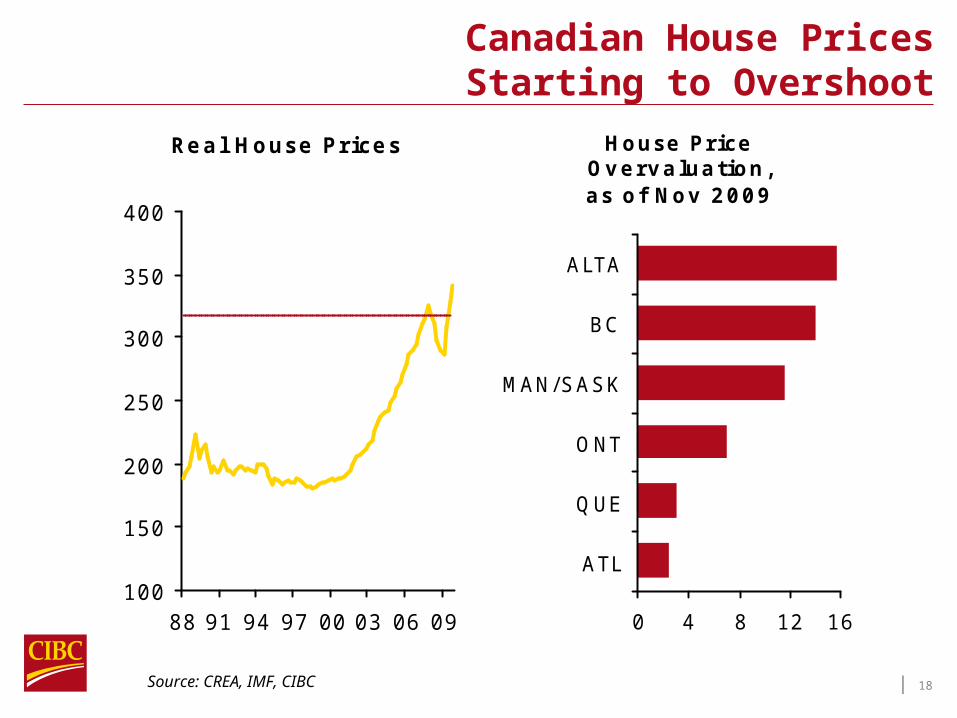
Canadian House Prices Starting to Overshoot
Source: CREA, IMF, CIBC
Real House Prices
100
150
200
250
300
350
400
88 91 94 97 00 03 06 09
$000s (2009 prices)
Fair value
House Price Overvaluation, as of Nov 2009
0 4 8 12 16
ALTA
BC
MAN/SASK
ONT
QUE
ATL %

| 19
Housing: An Important Economic Driver
Source: CREA, Statistics Canada, Bank of Canada, CIBC
House Prices lead Construction J obs
1000
1050
1100
1150
1200
1250
1300
06 07 08 09220
240
260
280
300
320
340
360
C onstruction employment (L)Avg house price (R)
$'000, 3-mo moving avg$mn
Wealth Effect on Consumption
-2
-1
0
1
2
3
4
5
06 07 08 09 10200
220
240
260
280
300
320
340
360
Housing wealth effect (L)Avg Home Price (R)
$000s
Fcst
$bn
| 20
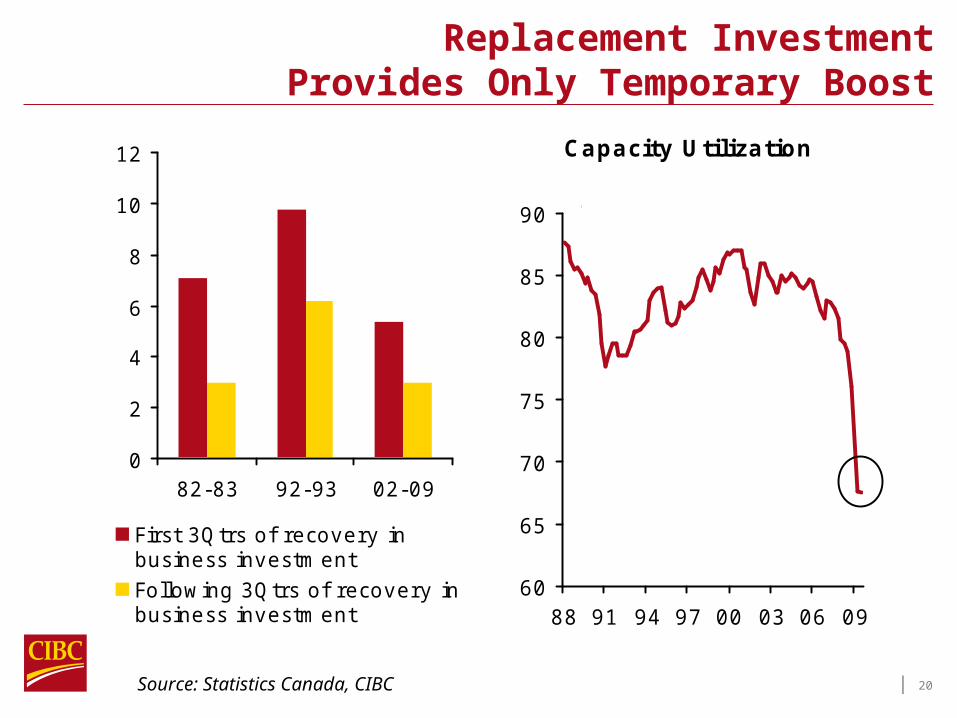
Replacement Investment Provides Only Temporary Boost
Source: Statistics Canada, CIBC
Capacity Utilization
60
65
70
75
80
85
90
88 91 94 97 00 03 06 09
%
recordlow
0
2
4
6
8
10
12
82-83 92-93 02-09
First 3Qtrs of recovery inbusiness investmentFollowing 3Qtrs of recovery inbusiness investment
| 21
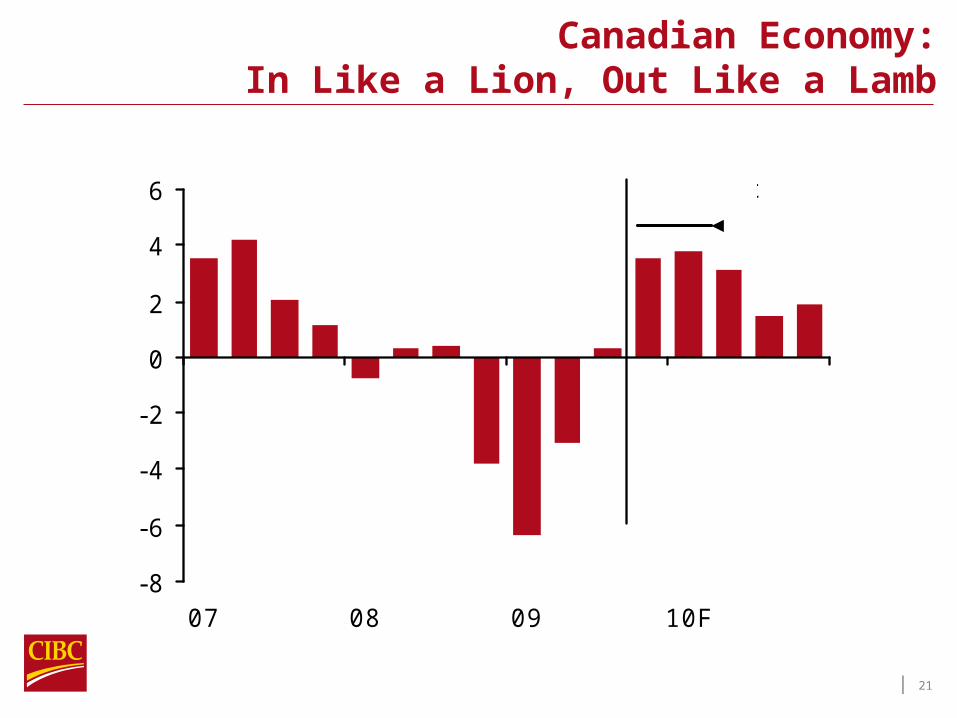
Canadian Economy:In Like a Lion, Out Like a Lamb
-8
-6
-4
-2
0
2
4
6
07 08 09 10F
q/q % chg in Real GDP, s.a.a.r. Forecast
| 22
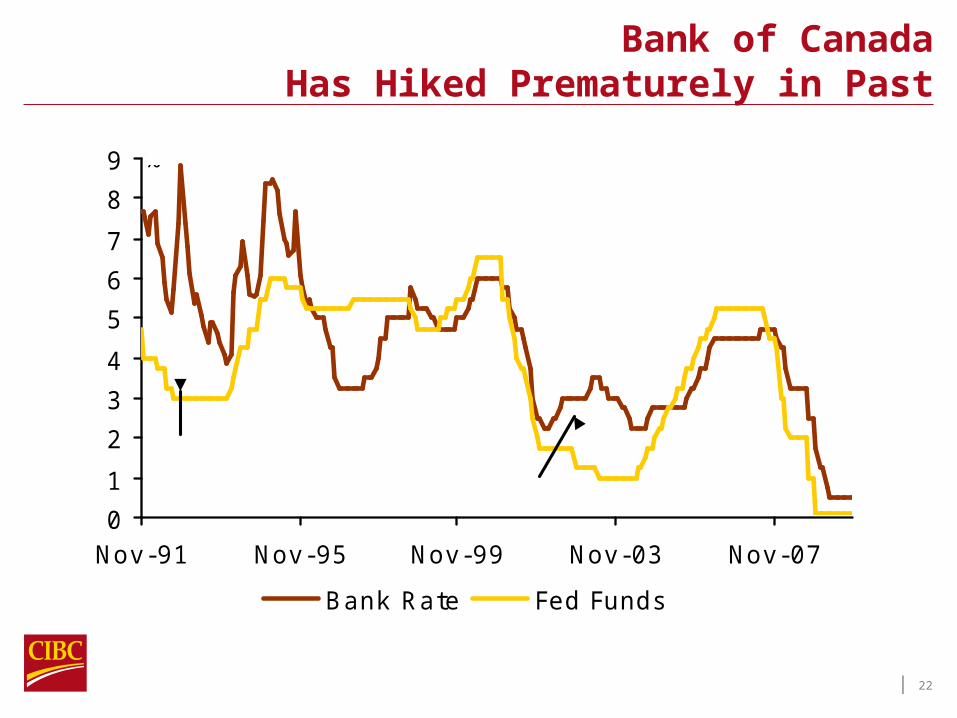
Bank of Canada Has Hiked Prematurely in Past
0
1
2
3
4
5
6
7
8
9
Nov-91 Nov-95 Nov-99 Nov-03 Nov-07
Bank Rate Fed Funds
premature tightening
premature tightening
%

| 23
Credit Continued To Expand During the Recession
Source: Statistics Canada, CIBC
Real Household Credit
-15-12
-9-6-30369
1215
75 79 83 87 91 95 99 03 07
y/y % chg
09
indicatesrecession

| 24
Average Annual Change in Consumer Bankruptcies
Source: Statistics Canada, CIBC
Since 1980
0
2
4
6
8
10
12
14
During periods of fallinginterest rates
During periods of risinginterest rates
%
| 25
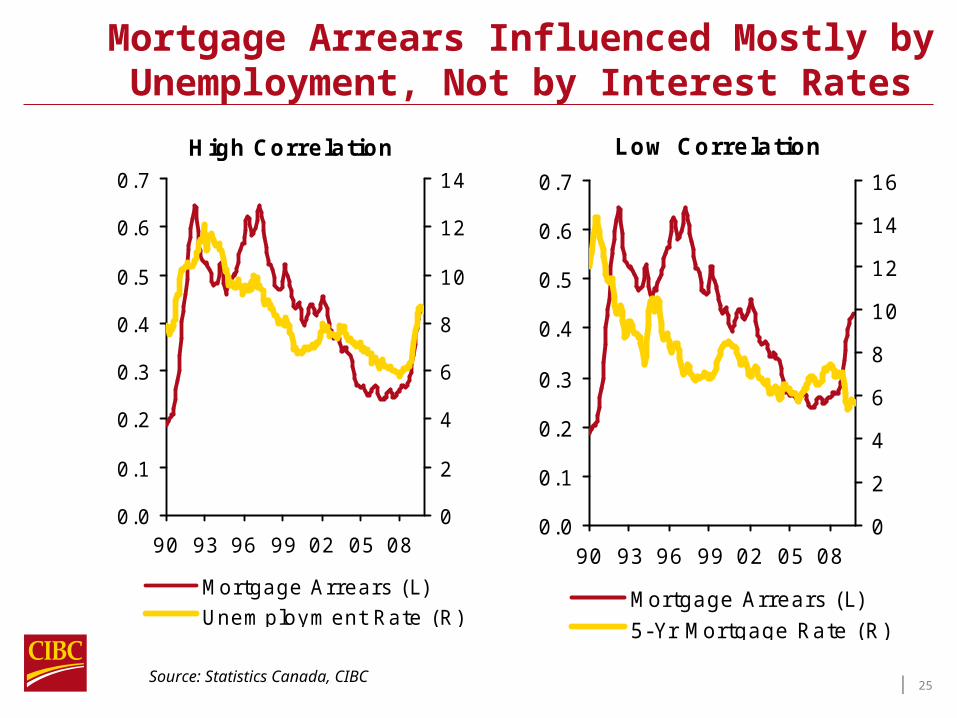
Mortgage Arrears Influenced Mostly by Unemployment, Not by Interest Rates
Source: Statistics Canada, CIBC
High Correlation
0.0
0.1
0.2
0.3
0.4
0.5
0.6
0.7
90 93 96 99 02 05 080
2
4
6
8
10
12
14
Mortgage Arrears (L)Unemployment Rate (R)
Low Correlation
0.0
0.1
0.2
0.3
0.4
0.5
0.6
0.7
90 93 96 99 02 05 080
2
4
6
8
10
12
14
16
Mortgage Arrears (L)5-Yr Mortgage Rate (R)
| 26
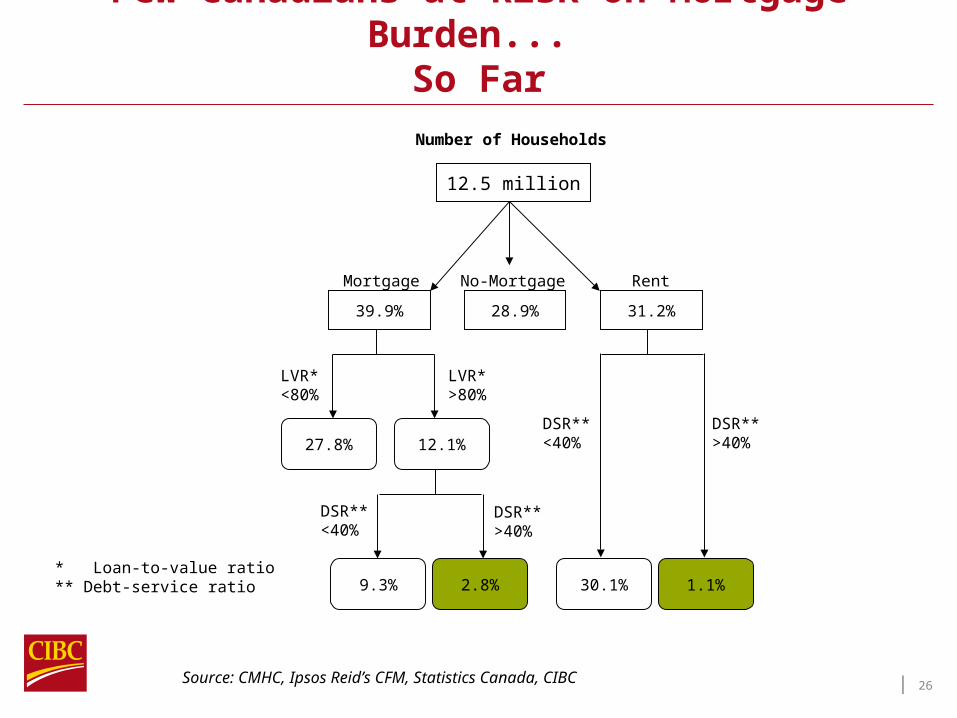
Few Canadians at Risk on Mortgage Burden...
So Far
Source: CMHC, Ipsos Reid’s CFM, Statistics Canada, CIBC
Number of Households
Mortgage
12.5 million
27.8%
31.2%
Rent
DSR**<40%
28.9%39.9%
No-Mortgage
12.1%
* Loan-to-value ratio** Debt-service ratio
LVR*<80%
LVR*>80%
9.3% 2.8%
DSR**>40%
DSR**<40%
DSR**>40%
30.1% 1.1%

| 27
Low Income Canadians Rely Less on VRM
Source: Ipsos Reid’s CFM, CIBC
Share of Variable Rate Mortgage by Income Group
10
15
20
25
30
35
40
< $55k $55k - $70k $70k -$100k
$100k+
%

| 28
Money Market Fund
Out of Cash...
45
50
55
60
65
70
75
80Ja
n-0
8
Ap
r-0
8
Jul-
08
Oct
-08
Jan
-09
Ap
r-0
9
Jul-
09
Oct
-09
$bn
Money Market
Source: IFIC, CIBC
… Into Bond & Equities
40
50
60
70
80
Jan
-08
Ap
r-0
8
Jul-
08
Oct
-08
Jan
-09
Ap
r-0
9
Jul-
09
Oct
-09
60
80
100
120
140
160
180
200$bn
Bond & I ncome (L)
Equities(R)
$bn

| 29
10-Year Lagged Cyclically Adjusted TSX PE Ratio
0
10
20
30
40
50
60
70
Long-TermAvg
(23.7)

| 30
Dividend Stocks Have Done Well, Long Term (right) and Recently (left)
45.8
32.2
0
5
10
15
20
25
30
35
40
45
50
TSXC omposite
DividendAristocrats
% Total Return in 2009
800
1100
1400
1700
2000
J un-04 Dec-05 J un-07 Dec-08
TSX C omposite TRDividend Aristocrats TR
Total Return, J un-04 = 1000
Source: S&P, CIBC
| 31
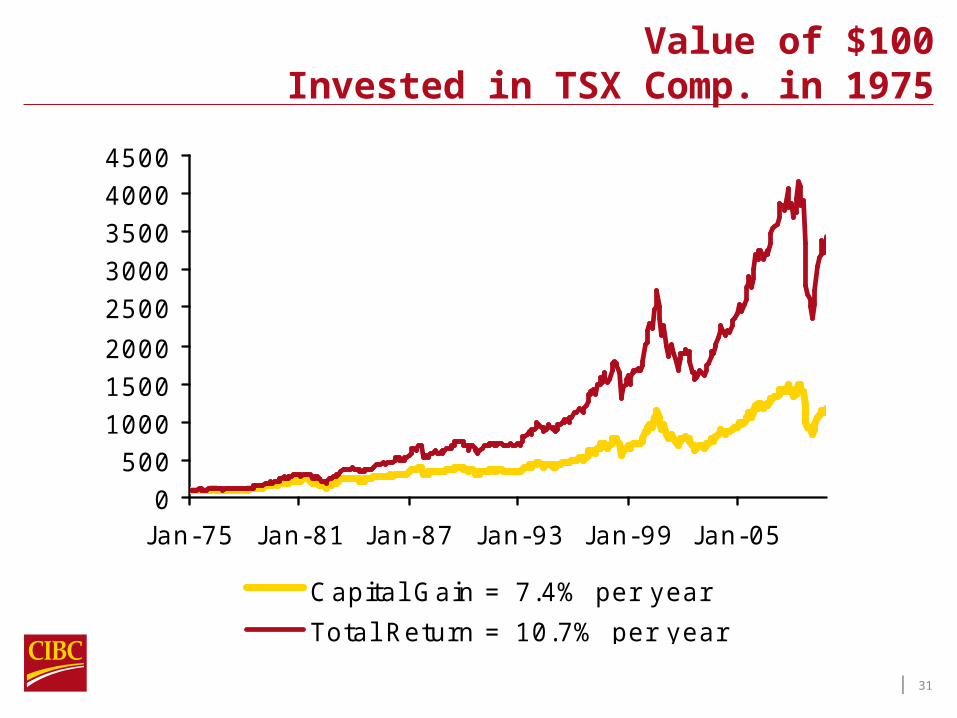
Value of $100 Invested in TSX Comp. in 1975
0500
100015002000
25003000350040004500
J an-75 J an-81 J an-87 J an-93 J an-99 J an-05
C apital Gain = 7.4% per year
Total Return = 10.7% per year

| 32
Eight Highest Yielding TSX Industry Groups
Source: Bloomberg, CIBC
Indicated Dividend Yield (%)
Telecommunication Services 5.5
Utilities 5.1
Real Estate 5.0
Media 4.7
Diversified Financials 4.2
Health Care Equipment & Services 4.0
Banks 4.0
Insurance 3.8

| 33
Question
&
Answer
This material was prepared for investment professionals only and is not for public distribution. It is for informational purposes only and is not intended to convey investment, legal, or tax advice. The material and/or its contents may not be reproduced without the express written consent of Renaissance
Investments.