pooled estimate of vitamin d deficiency among pregnant
TRANSCRIPT
REVIEW ARTICLE Open Access
Pooled estimate of vitamin D deficiencyamong pregnant women in India: asystematic review and meta-analysisAngeline Jeyakumar1,2*, Vidhya Shinde1 and Reshma Ravindran1
Abstract
Background: Vitamin D deficiency among pregnant women is a public health concern globally. In India, individualstudies report high prevalence. However, lack of national data masks the true burden. This work determined thepooled prevalence of vitamin D deficiency among pregnant women in India through a systematic review ofliterature and meta-analysis.
Methods: Three different search engines yielded 15 eligible articles. Study quality was assessed by 10 differentcriteria and summary of study quality was categorized as per Cochrane standards. Meta-analysis was performed toestimate pooled prevalence of vitamin D deficiency among healthy pregnant women and heterogeneity amongselected studies. A sample of n = 4088 was used to study the pooled prevalence among pregnant women.
Results: The random effects combined estimate was 32.35% (95% CI, (12.58–117.48). High heterogeneity (tau2 =0.39, I2 = 100%) and high risk of bias was observed among the selected studies. The test for overall effect wasobserved to be z = 2.54(P = 0.01).
Conclusion: Pooled estimate > 30% emphasizes the need for screening through antenatal care services and initiatepreventive measures to address the deficiency.
Keywords: Vitamin D deficiency, Pregnant women, Systematic review, Meta-analysis
IntroductionVitamin D has emerged as a micronutrient of concerndue to widespread prevalence of deficiency [1]. Amongthe different definitions, Endocrine Society defines defi-ciency of vitamin D as serum levels of 25-hydroxyvitamin D (25[OH]D) below 20 ng/ml and levelsbetween 20 and 30 ng/ml as insufficient [2]. The globalprevalence of deficiency or insufficiency ranges between54–100% and 39–76%, respectively [3]. Mild to severedeficiencies have been reported both in developed aswell as third world countries [4]. Among European
countries, Belgium reports > 70% prevalence, while trop-ical countries in Asia with abundant sunshine reporteven higher prevalence (> 80%) [4–6]. Compared to Asia(80%), African countries show less prevalence (30%).Among Asian countries, in India, the prevalence of vita-min D deficiency among healthy pregnant women is re-portedly high [4, 7]. Individual studies report 93%prevalence in Delhi, 97% in Bangalore, Karnataka, and94% in Mumbai, Maharashtra [6, 8, 9]. High prevalencehas been reported among women in reproductive agegroup both in rural and urban areas, as well as acrosseconomic classes [4].The physiological role of vitamin D implicated beyond
bone health evoked extensive research with this vitamin.From a maternal and child health perspective, its role in
© The Author(s). 2021 Open Access This article is licensed under a Creative Commons Attribution 4.0 International License,which permits use, sharing, adaptation, distribution and reproduction in any medium or format, as long as you giveappropriate credit to the original author(s) and the source, provide a link to the Creative Commons licence, and indicate ifchanges were made. The images or other third party material in this article are included in the article's Creative Commonslicence, unless indicated otherwise in a credit line to the material. If material is not included in the article's Creative Commonslicence and your intended use is not permitted by statutory regulation or exceeds the permitted use, you will need to obtainpermission directly from the copyright holder. To view a copy of this licence, visit http://creativecommons.org/licenses/by/4.0/.The Creative Commons Public Domain Dedication waiver (http://creativecommons.org/publicdomain/zero/1.0/) applies to thedata made available in this article, unless otherwise stated in a credit line to the data.
* Correspondence: [email protected]; [email protected] School of Health Sciences, Savitribai Phule Pune University,Maharashtra, India2School of Hospitality Management, University of Johannesburg,Johannesburg, South Africa
Jeyakumar et al. Journal of Health, Population and Nutrition (2021) 40:28 https://doi.org/10.1186/s41043-021-00253-y

fertility and conception, pathogenesis in preterm birth,gene transcription in placenta, and immune function arewidely researched [10–14]. Deficiency in pregnancy isknown to increase risk of pre-eclampsia, gestational dia-betes mellitus, preterm birth, and other tissue-specificconditions [1, 11]. Moreover, vitamin D status of neo-nates and infants is affected by vitamin D levels ofmothers [15, 16]. Lactation further increases require-ments and severe deficiency has been reported duringthis phase too [17–20]. As per the guidelines of Endo-crine Society, poor vitamin D status in adolescence andincreased requirements during pregnancy make the re-productive phase vulnerable [2, 21]. Unlike other vita-mins that are obtained through foods, most of the foodscommonly consumed are poor sources of vitamin D.The World Health Organization has emphasized the im-portance of investigating this vitamin as it affects preg-nancy outcome [1]. The paucity of national data andhigh prevalence as per regional evidence identifies theneed to estimate the burden among pregnant women inIndia. The present work is a systematic review andmeta-analysis to determine the combined estimate of
vitamin D deficiency among healthy pregnant women inIndia.
MethodsStandard protocols for systematic review writing byKhan and coworkers [22] and Preferred Reporting Itemsfor Systematic Reviews and Meta-Analyses (PRISMA)guidelines [23] were followed.
Preliminary research and idea validationTo ensure validity of the chosen topic and to avoid du-plication of work, we performed a preliminary search inPubMed with search terms viz. vitamin D deficiency/in-sufficiency + pregnant women + India. As we did notcome across systematic review and meta-analysis forvitamin D deficiency among pregnant women or na-tional prevalence data in India, we chose to perform thissystematic review and meta-analysis. We also found sub-stantial responses to these search terms that enabled usto progress with this research.
Fig. 1 PRISMA chart: Search strategy and selection of studies
Jeyakumar et al. Journal of Health, Population and Nutrition (2021) 40:28 Page 2 of 11

Literature searchA systematic literature search was performed by two re-searchers independently in electronic databases that in-cluded PubMed, Google Scholar, and Web of Science inNovember 2018. The search terms used were ("epide-miology"[Subheading] OR "epidemiology"[All Fields] OR"prevalence"[All Fields] OR "prevalence"[MeSH Terms])AND ("vitamin D deficiency"[MeSH Terms] OR "25 OHVitamin D levels"[All Fields]) AND ("pregnant women"[-MeSH Terms] OR ("pregnant"[All Fields] AND "wome-n"[All Fields]) OR "pregnant women"[All Fields]) AND("india"[MeSH Terms] OR "india"[All Fields])) AND("2007/12/03"[PDat] : "2018/11/29"[PDat]) (Fig. 1).
Study selectionApplying selection criteria (a) studies that were ori-ginal articles, (b) published in English language, (c)
study designs that were observational, interventionstudies that provided baseline information on vitaminD levels of healthy pregnant women, (d) India asstudy location, (e) studies that determined the preva-lence of vitamin D deficiency among pregnant womenacross gestational age, irrespective of parity were se-lected. (f) Time frame for literature selection was re-stricted to those published between 2005 and 2018.(g) As the objective of the present review is to studyvitamin D deficiency among pregnant women, studiesthat recruited pregnant women from hospitals wereincluded. Reference lists of the selected articles wereused for manually identifying relevant literature. Full-text articles that were unavailable and data requiredfor participants in specific age groups were obtainedfrom authors on request. All papers were screenedand verified by two researchers independently.
Fig. 2 Map showing studies selected from Indian states and their coordinates
Jeyakumar et al. Journal of Health, Population and Nutrition (2021) 40:28 Page 3 of 11

Exclusion criteria(i) Earlier work had used > 30 sample as a selection cri-terion [24]. In our search, the least sample in the eligiblestudies was n = 20 and the next higher sample was n =50. As smaller studies increase the risk of bias, studieswith sample size less than 50 were excluded.(i) Studies that reported vitamin D deficiency associ-
ated with specific disease conditions and (ii) eligiblestudies from which data if unavailable from authors afterrequest were excluded.
Data extractionFull texts of the selected articles were retrieved. To avoidpublication bias, only peer-reviewed published studieswere included. The outcome of interest was combinedestimate of vitamin D deficiency among pregnantwomen in India. For this, the estimated prevalence ofdeficiency was recorded from every selected study. Inaddition, associated variables that describe the studycharacteristics such as study design, study setting, socio-
demographic and economic status, and criteria used tocategorize deficiency and sufficiency, season of study,maternal characteristics of pregnant women such as ges-tational age, and parity were recorded. Data was ex-tracted and entered in Microsoft Excel in duplicate byRR and VS. Disagreement in selection of articles anddata clarification if any was verified by third reviewer AJ.
Assessment of study qualityCriteria proposed by Hoy and coworkers [25] for preva-lence studies were applied to assess the risk of bias inthe selected articles. This model applies 10 criteria forassessment of risk of bias. Applying this, the papers wereassessed for representation of population, sampling, ran-dom selection, non-response bias, data collected directlyfrom subjects, case definition, reliability and validity ofthe method used, mode of data collection whether simi-lar, length of shortest prevalence period, and numeratorand denominator. The summary of study quality wascategorized as per Cochrane standards [26] as low (all
Table 1 Description of studies among pregnant women in India
References Location Samplesize
Study design Prevalence
Sachan et al. 2005 [31] Lucknow(North )
207 Cross-sectional 66.6%
Farrant et al. 2009 [32] Mysore(South )
559 Cross-sectional 66.0%
Sahu et al.2009 [33]
Lucknow(North)
139 Cross-sectional 74.0%
Marwaha et al. 2011 [7] Delhi(North)
541 Cross-sectional 96.30%
Jani et al.2014 [9]
Mumbai(West )
150 Cross-sectional 94.0%
Singla et al.2015 [34]
Chandigarh(North)
304 Prospective cohort 92.11%
Ajmani et al.2016 [35]
Delhi(North)
200 Cross-sectional 37.50%
Sharma et al. 2016 [36] Delhi(North)
418 Prospective cohort 34.54%
Krishnaveni etal. 2011 [37]
Mysore(South)
568 Prospective cohort 66.0%
Veena et al.20162017 [38]
Mysore(South)
468 Prospective cohort 66.8%
Nandal et al.2016 [39]
Haryana(North)
60 Prospective cohort 93.75%
Kumaret al. 2015 [40]
Bengaluru(South)
106 Prospective cohort 70.70%
Chary et al.20152014 [41]
Hyderabad(South)
153 Prospective cohort 52.2%
Dasguptaet al. 2012 [42]
Guwahati(North-East)
50 Cohort 42.00%
Sablok et al.2015 [43]
Delhi(North)
165 RCT 77.50%
ELISA enzyme-linked immunosorbent assay, CI confidence interval, RCT randomized control trials
Jeyakumar et al. Journal of Health, Population and Nutrition (2021) 40:28 Page 4 of 11

10 criteria assessed to have low risk), moderate (at leasttwo criteria showing high risk), and high risk (more thantwo criteria showing high risk).
Statistical analysisReview manager [27] software version 5.3 was used toobtain a forest plot to demonstrate the degree of hetero-geneity among the selected articles. The software usesChi2, I2, and Tau2 to study heterogeneity. Estimatingpooled prevalence is a testing strategy where prevalencefrom a number of studies are aggregated into a singlesample (or pool), which is then evaluated for the preva-lence of interest [28]. In this review, reported prevalencein individual papers was extracted, log transformed, andstandard error of proportion of prevalence was esti-mated. Considering the variation in the selected preva-lence studies, and not assuming a uniform effect size in
the selected studies, random effects model was used toperform meta-analysis. This model prevents one or fewstudies influencing the overall estimate and allows morebalance in the relative weights of the studies [29]. The Pvalue is the probability from chi-square statistic calcu-lated using estimates of individual study weight, effectsize, and overall effect size [30]. Publication bias wasassessed using a funnel plot. Asymmetry in the distribu-tion of studies in the funnel plot indicates the extent ofbias.
ResultsLiterature search using specific search terms on preva-lence of vitamin D deficiency among pregnant women inIndia identified 6971 articles. After screening titles andabstracts for relevance and excluding duplicates, 6960articles were excluded as they did not match the
Table 2 Description of associated variables in studies selected for estimating prevalence among pregnant women (n = 15)Study Age
group/mean age
Socio-economic status Education Rural/urban
Parity Trimester Exposure to sunlight Seasonsof study
Ajmani et al.2016 [35]
20–25 Lower, upper lower, lowermiddle, upper middle
Illiterate, primarylevel, graduate
Urban Multi-gravidaandPrimigravida
All trimesters NM NM
Farrant et al.2009] [32]
20–26 Upper, lower NM Urban NM < 32 weeks ofpregnancy
NM Summer,Winter
Jani et al.2014 [9]
26.7 ± 4.1 NM NM Rural NM 2nd trimester Summer: 35.4 ± 15.9 h/day *%BSA
Summer,Winter
Marwaha et al.2011 [7]
19–30 Lower middle NM Urban 1, 2, and >2
All trimesters 1st trimester: 10–60 min 2ndtrimester: 10–60 min3rd trimester; 10–20 min
Summer,Winter
Sachan et al.2005 [31]
24 ± − 4.1 Lower, middle NM Rural andurban
NM 3rd trimester Urban: 4.1 ± 3.2 h/day*%BSARural: 9.7 ± 8.1 h/day*%BSA
Autumn
Sahu et al.2009 [33]
20–25 Lower, upper NM Rural andurban
< 3 3rd trimester Mean 14:00 ± 2 h Springsummer
Sharma et al.2016 [36]
22–23 Lower, upper lower, lowermiddle upper middle
Both educated andnot educated
Urban Primigravida Full term NM Summer,Winter
Singla et al.2015 [34]
18–35 Upper, upper middle, lower,lower middle
NM Urban Nulliparous,1 and 2
2nd trimester Summer: shorter ≤ 30 minLonger > 30 minWinter:Shorter ≤ 90 minLonger > 90 min
Summer,Winter
Krishnaveniet al. 2011 [37]
24 ± 4.3 Lower NM NM NM 3rd trimester NM NM
Veena et al.2017 [38]
23.9 ± 4.3 Lower < 10(34.9%− 10(31.7%)> 10(33.4%
NM 1, 2, and >2
3rd trimester NM NM
Nandal et al.2016 [23, 39]
30.83 ±4.0
upper NM urban NM 2nd trimester NM NM
Kumar etal. 2015 [40]
NM NM NM NM NM NM NM NM
Chary et al.2015 [41]
24.5 ± 2.6 Upper, upper middle, lower,lower middle
Illiterate, primarylevel, High SchoolPost high school
Rural andurban
NM 3rd trimester < 60 min NM
Dasgupta et al.2012 [42]
20–40 NM NM NM NM 1st trimester 33 ± 9.07% Summer,rainy
Sablok et al.2015 [43]
NM Lower, middle NM NM Primigravida 2nd trimester < 1 h/day> 4 h/day
NM
NM not mentioned
Jeyakumar et al. Journal of Health, Population and Nutrition (2021) 40:28 Page 5 of 11

selection criteria. This yielded 11 relevant articles. Sixadditional records were obtained from references citedwithin these articles. A total of 17 articles with samplesize ranging from 50 to 568 were assessed for eligibilityas per the selection criteria that further resulted in ex-clusion of two articles. Thus, 15 primary studies amongpregnant women were included for the review.Figure 2 shows the states where the studies were car-
ried out and their coordinates on the Indian map. Nineout of 15 studies were conducted in Northern India. Fivestudies were conducted in south and one study each inwest and north-east India. Table 1 describes the articlesselected for the review. In all, the sample size in thestudies ranged from 50 to 568. Of the 15 selected stud-ies, 6 were cross sectional and the other 8 were pro-spective cohorts, and a randomized control trial. Allstudies were hospital based excluding Sahu’s [33] workwhich was population based with calculated sample size.Table 2 describes the maternal characteristics of selectedstudies. The age of pregnant women ranged from 18 to40 years in all the papers reviewed. Socioeconomic statusof the study group ranged from upper, middle, andlower income groups. Six out of 15 studies provided in-formation on the educational status of women. Workdone by Ajmani and coworkers [35] described the distri-bution of women as per their level of education. Educa-tional status of participants from other studies rangedfrom illiterate, primary education to graduates. Study
setting was rural, urban, or combined representation ofboth rural and urban settings.Parity was described in 7 out of 15 articles [31–44] ac-
cordingly pregnant women were primi or multi-gravida,nulliparous, or had parity less than three. Women acrosstrimesters were recruited in two articles [35, 44].Women in second trimester were enrolled in five studies[9, 32, 34, 39, 43] and four studies were conducted dur-ing the last trimester of pregnancy [33, 37–40, 42, 43].Data pertaining to sunlight exposure was provided by 8out of 15 papers. Of these, two papers [9, 42] provided adirect estimation of sunlight exposure by duration topercent body surface area and while two [9, 34] providedduration exposed specifically in summer and winter.Ajmani and coworkers [35] worked among burka-cladpregnant women and provided information about sun-light exposure indirectly by the number of hours of out-door activity and use of sun screens and skincomplexion. Eight studies mentioned the seasons ofstudy [9, 32, 34, 36, 42, 44]; however, seven studies didnot mention the season of study.Table 3 describes the techniques used in determining
the vitamin D levels and the estimated prevalence in theselected studies. Serum was used as the sample for vita-min D estimation in all the studies. Among the tech-niques used, ELISA [31, 32, 34, 35, 39, 44] andradioimmunoassay were used in six studies [32–34, 36–40, 42, 43] and chemiluminescent assay and HPLC [41]
Table 3 Mean levels of serum 25 (OH) D among pregnant women
Study Vitamin Destimationmethod
Mean serum 25(OH) D 25 (OH) D ranges in serum
Deficiency Insufficiency Sufficiency/adequacy
Ajmani et al. 2016 [35] ELISA 23.25 ng/ml ± 18.49 < 20 ng/ml 20–30 ng/ml > 30 ng/ml
Farrant et al. 2009 [32] Radioimmunoassay Median: 15.12 ng/ml < 20 ng/ml NM NM
Jani et al. 2014 [9] Chemiluminescentimmunoassay
10.6 ng/mL < 20 ng/ml <20–30 ng/ml 30 ng/ml
Marwaha et al. 2011 [7] ELISA 9.28 ng/ml < 20 ng/ml NM NM
Sachan et al. 2005 [31] Radioimmunoassay 14.93 ng/mL < 20 ng/ml NM Normal: 20–80 ng/ml nmol/L
Sahu et al. 2009 [33] Radioimmunoassay 15.12 ng/ml ± 7.92 < 20 ng/ml NM 30 ng/ml
Sharma et al. 2016 [36] ELISA Deficiency: 7.10 ± 1.49 ng/ml Severe< 10 ng/ml
Deficient< 20 ng/ml)
Normal32–100 ng/ml
Singla et al. 2015 [34] ELISA Median: 7.9 ng/ml (IQR 5.7, 12 < 20 ng/ml < 20–30 ng/ml 30 ng/ml
Krishnaveni et al. 2011 [37] Radioimmunoassay 15.6 ng/ml < 20 ng/ml NM NM
Veena et al.2017 [38]
Radioimmunoassay NM < 20 ng/ml NM NM
Nandal et al. 2016 [39] ELISA 11.98 ng/ml < 12 ng/ml 12–20 ng/ml 20–30 ng/ml
Kumaret al. 2015 [40]
LC-MS/MS 16.3 ng/ml < 20 ng/mL NM NM
Chary et al. 2015 [41] HPLC NM < 19 ng/mL 20–29 ng/mL > 30 ng/mL
Dasgupta et al. 2012 [42] Radioimmunoassay 38.4 ± 18.37 ng/ml < 20 ng/ml NM NM
Sablok et al. 2015 [43] ELISA 18.44 ng/ml < 20 ng/ml < 20–30 ng/ml 30 ng/ml
NM not mentioned, IQR inter quartile range, SD standard deviation
Jeyakumar et al. Journal of Health, Population and Nutrition (2021) 40:28 Page 6 of 11
Table
4Risk
ofbias
andsummaryof
riskof
selected
stud
ies
Risk
ofbias
Krishna
veni
etal.2
011
[37]
Vee
naet
al.
2017
[38]
Nan
dal
etal.
2016
[39]
Dasgup
taet
al.
2012
[42]
Sach
anet
al.
2005
[31]
Sahu
etal.
2009
[33]
Farran
tet
al.
2009
[32]
Sharma
etal.
2016
[36]
Marwah
aet
al.2
011
[7]
Jani
etal.
2014
[9]
Ajm
ani
etal.
2016
[35]
Cha
ryet
al.
2015
[41]
Kum
aret
al.
2015
[40]
Sing
laet
al.
2015
[34]
Sablok
etal.
2015
[43]
Represen
tatio
nof
data
Highrisk
High
risk
High
risk
Highrisk
High
risk
Low
risk
High
risk
High
risk
Highrisk
High
risk
Highrisk
High
risk
High
risk
High
risk
High
risk
Sampling
Highrisk
High
risk
High
risk
Highrisk
High
risk
low
risk
High
risk
high
risk
Highrisk
High
risk
Highrisk
High
risk
High
risk
High
risk
Highrisk
Rand
omselection
Low
risk
Low
risk
Low
risk
Low
risk
Low
risk
Low
risk
Low
risk
Low
risk
Low
risk
Low
risk
Low
risk
Low
risk
Low
risk
Low
risk
Low
risk
Non
-respo
nsebias
Highrisk
High
risk
Low
risk
Low
risk
High
risk
Low
risk
High
risk
High
risk
Low
risk
Low
risk
Low
risk
Low
risk
High
risk
High
risk
Low
risk
Datacollected
directly
from
subject
Low
risk
Low
risk
Low
risk
Highrisk
Low
risk
Low
risk
Low
risk
Low
risk
Low
risk
Low
risk
Low
risk
Low
risk
Low
risk
Low
risk
Low
risk
Casede
finition
Low
risk
Low
risk
Low
risk
Low
risk
Low
risk
Low
risk
Low
risk
Low
risk
Low
risk
Low
risk
Low
risk
Low
risk
Low
risk
Low
risk
Low
risk
Reliabilityandvalidity
ofmetho
dLow
risk
Low
risk
Low
risk
Low
risk
Low
risk
Low
risk
Low
risk
Low
risk
Low
risk
Low
risk
Low
risk
Low
risk
Low
risk
Low
risk
Low
risk
Samemod
eof
data
collected
Low
risk
Low
risk
Low
risk
Low
risk
Low
risk
Low
risk
Low
risk
Low
risk
Low
risk
Low
risk
Low
risk
Low
risk
Low
risk
Low
risk
Low
risk
Leng
thof
theshortest
perio
dof
theprevalen
ceLow
risk
Low
risk
Low
risk
Low
risk
Low
risk
Low
risk
Low
risk
Low
risk
Low
risk
Low
risk
Low
risk
Low
risk
Low
risk
Low
risk
Low
risk
Num
erator
and
deno
minator
Highrisk
High
risk
High
risk
Highrisk
High
risk
Low
risk
High
risk
High
risk
Highrisk
High
risk
Highrisk
High
risk
High
risk
High
risk
Low
risk
Summary*
Highriskof
bias
High
riskof
bias
High
riskof
bias
Highrisk
ofbias
High
riskof
bias
Low
risk
ofbias
High
riskof
bias
High
riskof
bias
Highriskof
bias
High
riskof
bias
Highrisk
ofbias
High
riskof
bias
High
riskof
bias
High
riskof
bias
Mod
erate
riskof
bias
Low
riskof
bias:allcrite
riamet
(i.e.,low
foreach
domain).*Mod
erateriskof
bias:o
neto
twocrite
riano
tmet
(i.e.,h
ighforeach
domain),H
ighriskof
bias:m
orethan
twocrite
riano
tmet
(i.e.,h
ighforeach
domain)
Jeyakumar et al. Journal of Health, Population and Nutrition (2021) 40:28 Page 7 of 11

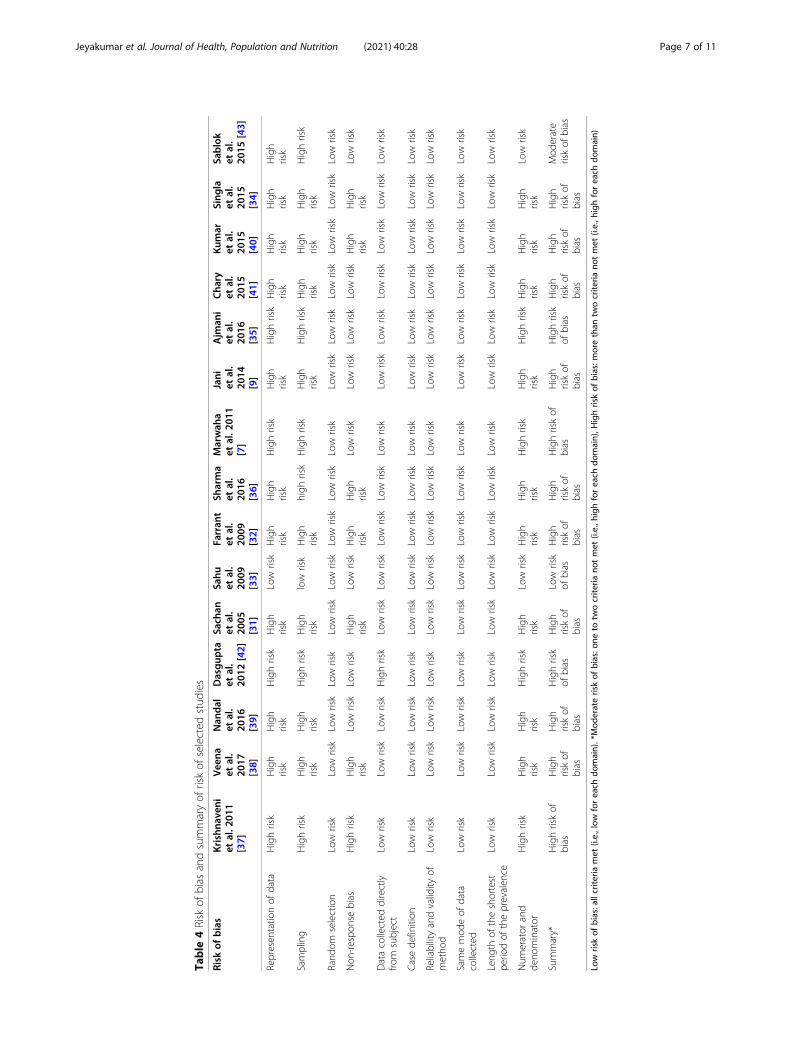
and LC-MS/MS [40] by one study each. Except Farrant’swork [32] (2009), all studies were limited in detail per-taining to standardization and validation of methods.Majority of the studies (13 out of 15)) used 20 ng/ml asthe cuff for defining deficiency, although some studiesused [35, 39] 10 or 12 ng/ml defining severe deficiency.Table 4 summarizes risk of bias (RoB) of the selected pa-pers among pregnant women. Sahu’s work [33] was theonly population-based study that estimated prevalencebased on sample size calculation. Therefore, his workscored low risk in domains pertaining to (i) populationrepresentation and (ii) numerator and denominator. Allother articles scored high risk in the above-mentioneddomains. In all, 13 out of 15 selected studies were cate-gorized as high risk as at least two domains were
categorized as high risk, one study each were categorizedas moderate and low risk, respectively.The asymmetrical distribution of studies in the forest
plot (Fig. 3) provides a visual representation of publica-tion bias. Figure 4 shows the forest plot derived for theselected studies. The prevalence of vitamin D deficiencyamong pregnant women ranged from 34.45 to 96.30%.High heterogeneity was observed among the studies(Tau2 = 0.39, chi2 = 12509.42, df = 14, p = < 0.00001, I2
= 100%). The test for overall effect was observed to be Z= 2.54(p = 0.01). As per categorization of heterogeneityby Higgins et al. 2003 [45], I2 > 75% indicates consider-able heterogeneity. This indicates large variation amongincluded studies. The random effects combined estimate
Fig. 3 Funnel plot of individual studies selected for meta-analysis
Fig. 4 Forest plot showing pooled estimate of vitamin D deficiency among pregnant women
Jeyakumar et al. Journal of Health, Population and Nutrition (2021) 40:28 Page 8 of 11
for overall prevalence was 32.35%, 95% CI, 12.58–117.48).
DiscussionVitamin D deficiency among women in reproductive agehas gained public health attention in recent years. Theestimated pooled prevalence as per this review was32.35% among healthy pregnant women. As per currentliterature evidence, a population prevalence > 20% isconsidered a public health problem that calls for imme-diate intervention [46]. Data from individual studies indeveloping countries report high prevalence inBangladesh (81%), Lahore, in Pakistan (73%), Beijing(40%), and Malaysia (90%) [46–49]. Another systematicreview among Indian pregnant women by Tasset [50] re-ported 66–98% prevalence; however it was not a pooledestimate. These findings underscore the unmet require-ments that increase vulnerability during the reproductivephase.Besides high requirements in pregnancy, geographical
location and climate affect vitamin D status. While lackof sunshine contributes to low vitamin D status in devel-oped countries, poor living conditions, economic status,and cultural factors affect those in developing countriesdespite adequate sunshine. For instance, in Europe andJapan, low and high prevalence were reported in sum-mer and winter, respectively [51, 52]. Whereas in devel-oping countries, urbanization and transition increaserisk for poor vitamin D status irrespective of season [53,54] Although women in lower socioeconomic strata arehighly susceptible, women from higher socioeconomicstatus who preferred indoors too were at equal risk [55].Cultural practices such as women covering maximumbody surface and veiling prevents maximum sun expos-ure [56]. Dark skin among south Asians further limitsabsorption of vitamin D. In resource poor settingshouses are closely packed with no direct sunlight withintheir dwellings and high level of air pollution aggravatesvulnerability [57]. High prevalence of deficiency has beenreported among migrant women in developing coun-tries [58]. The above factors associated with poor vita-min D status are commonly observed in developingcountries as a consequence of urbanization [1, 59–64].However, rural areas as place of residence did not de-crease the risk of vitamin D deficiency. Poor access tonutrient dense foods increased risk in these settings aswell [65]. Among maternal characteristics, multi-paritycombined with low vitamin D intake is known to in-crease risk of deficiency [16, 66, 67]A global summary of maternal and newborn vitamin
D status reports 87% deficiency among pregnant womenin Southeast Asia [68], while pooled estimates showlower prevalence. Varied estimates of prevalence arise
due to variations in techniques and difference in definingdeficiencies and geographical variations [69, 70].Dearth of national level data in developing countries
masks the true burden of this deficiency and limits com-parison. National surveys have not focused on screeningvitamin D levels of pregnant women for deficiency. InIndia, the national guidelines recommend 500 mg elem-ental calcium and 250 IU vitamin D3 twice a day tomeet the increased requirements in pregnancy [71].However, considering the low quality of available evi-dence between deficiency state and critical pregnancyoutcome there exist no recommendation for vitamin Dsupplementation as part of routine antenatal care[72–74]. This meta-analysis has provided a pooled esti-mate in the absence of a national prevalence of vitaminD deficiency. However, it suffers from the following limi-tations: despite finding eligible studies some studies wereexcluded due to non-response from authors. Therefore,it is likely that the studies selected for this review arenot a representation of the available literature. Althoughfunnel plot was created using RevMan software, statis-tical test for publication bias could not be performedusing this software. Sensitivity analysis could not be per-formed as prevalence from the excluded papers couldnot be derived. The high risk of bias due to low powerof the selected studies and the time period applied forselecting studies further added to the study limitation.
ConclusionThe pooled estimate of vitamin D deficiency accordingto the selected Indian literature identifies a significantpercentage of deficiency among pregnant women.Screening of women in reproductive age would identifythe magnitude of deficiency to promote early interven-tion. Vitamin D deficiency is a potentially preventablemicronutrient deficiency and high prevalence calls forpublic health strategies to address this serious issue.
AcknowledgementsThe authors wish to thank Dr. Sumedha Dharmarajan and Dr. SwapnilGadhave for their scientific support while we performed the meta-analysis.
Authors’ contributionsAJ conceptualized the review. VS and RR extracted data and performed themeta-analysis under the guidance of AJ. Manuscript was written by AJ. Allauthors read and approved the final manuscript.
FundingThis project was funded by UGC-UPE–2018. The funding body did not play arole in the design of the study, analysis, interpretation of data, and in writingthe manuscript.
Availability of data and materialsPlease contact author for data requests.
Jeyakumar et al. Journal of Health, Population and Nutrition (2021) 40:28 Page 9 of 11
Declarations
Ethics approval and consent to participateEthics approval of this study was obtained from the institutional ethicscommittee Ref: SPPU/IEC/2018/03. Consent was not applicable for this study.
Consent for publicationAll authors have given their consent for this publication.
Competing interestsThe authors declare that they have no competing interests.
Received: 15 September 2019 Accepted: 2 June 2021
References1. World Health Organization. Guideline: vitamin D supplementation in
pregnant women.2012; Available in http://www.who.int/nutrition/publications/micronutrients/guidelines/vit_d_supp_pregnant_women/en/Accessed December 2018.
2. Holick MF, Binkley NC, Bischoff-Ferrari HA, Gordon CM, Hanley DA, HeaneyRP, et al. Evaluation, treatment, and prevention of vitamin D deficiency: anEndocrine Society clinical practice guideline. J Clin Endocrinol Metab. 2011;96(7):1911–30. https://doi.org/10.1210/jc.2011-0385.
3. Van der Pligt P, Willcox J, Szymlek-Gay E, Murray E, Worsley A, Daly R.Associations of maternal vitamin D deficiency with pregnancy and neonatalcomplications in developing countries: a systematic review. Nutrients. 2018;10(5):640. https://doi.org/10.3390/nu10050640.
4. Edwards MH, Cole ZA, Harvey NC, Cooper C. The global epidemiology ofvitamin D status. J Aging Res Clin Prac. 2014;3(3):148–58.
5. Vandevijvere S, Amsalkhir S, Van Oyen H, Moreno-Reyes R. High prevalenceof vitamin D deficiency in pregnant women: a national cross-sectionalsurvey. PloS one. 2012;7(8):e43868. https://doi.org/10.1371/journal.pone.0043868.
6. Puri S, Marwaha RK, Agarwal N, Tandon N, Agarwal R, Grewal K, et al.Vitamin D status of apparently healthy schoolgirls from two differentsocioeconomic strata in Delhi: relation to nutrition and lifestyle. Br J Nutri.2008;99(4):876–82. https://doi.org/10.1017/S0007114507831758.
7. Marwaha RK, Tandon N, Chopra S, Agarwal N, Garg MK, Sharma B, et al.Vitamin D status in pregnant Indian women across trimesters and differentseasons and its correlation with neonatal serum 25-hydroxyvitamin D levels.Br J Nutri. 2011;106(9):1383–9. https://doi.org/10.1017/S000711451100170X.
8. Divakar H, Singh R, Narayanan P, Divakar GV. Prevalence of Vitamin DDeficiency In A Population Of Indian Women-A Call For UniversalSupplementation. J Evid Based Med Healthc. 2017;4(52):3196–200. https://doi.org/10.18410/jebmh/2017/634.
9. Jani R, Palekar S, Munipally T, Ghugre P, Udipi S. Widespread 25-hydroxyvitamin D deficiency in affluent and nonaffluent pregnant Indianwomen. BioMed Res Int. 2014;2014:1-8. Article ID 892162.. https://doi.org/10.1155/2014/892162.
10. Finkelstein JL, Duggan C, Mehta S, Thomas T, Srinivasan K, Kurpad AV.Maternal vitamin d status and adverse pregnancy and neonatal outcomesin India. FASEB J. 2016;30(1):44–6.
11. Mousa A, Abell S, Scragg R, De Courten B. Vitamin D in reproductive healthand pregnancy. In Seminars Reprod Med. 2016; 34 (2),. e1-e13). ThiemeMedical Publishers.
12. Wei SQ, Qi HP, Luo ZC, Fraser WD. Maternal vitamin D status and adversepregnancy outcomes: a systematic review and meta-analysis. J Matern FetalNeonatal Med. 2013;26(9):889–99. https://doi.org/10.3109/14767058.2013.765849.
13. Liu N, Kaplan AT, Low J, Nguyen L, Liu GY, Equils O, et al. Vitamin D inducesinnate antibacterial responses in human trophoblasts via an intracrinepathway. Biol Reprod. 2009;80(3):398–406. https://doi.org/10.1095/biolreprod.108.073577.
14. Evans KN, Nguyen L, Chan J, Innes BA, Bulmer JN, Kilby MD, et al. Effects of25-hydroxyvitamin D3 and 1, 25-dihydroxyvitamin D3 on cytokineproduction by human decidual cells. Biology of reproduction. 2006;75(6):816–22. https://doi.org/10.1095/biolreprod.106.054056.
15. Nicolaidou P, Hatzistamatiou Z, Papadopoulou A, Kaleyias J, Floropoulou E,Lagona E, et al. Low vitamin D status in mother-newborn pairs in Greece.
Calcified Tissue International. 2006;78(6):337–42. https://doi.org/10.1007/s00223-006-0007-5.
16. Dijkstra SH, van BA JJW, de Vleeschouwer LH, Huysman WA, van den AkkerEL. High prevalence of vitamin D deficiency in newborn infants of high-riskmothers. Arch Dis Child. 2007;92(9):750–3. https://doi.org/10.1136/adc.2006.105577.
17. Asaduzzaman M, Basak R, Islam S, Juliana FM, Ferdous T, Islam MJ, et al.Vitamin D deficiency and insufficiency in healthy pregnant women living inDhaka, Bangladesh. IOSR-JDMS. 2018;17(4):66–73.
18. Zhao Y, Yu Y, Li H, Chang Z, Li Y, Duan Y, et al. Vitamin D status and theprevalence of deficiency in lactating women from eight provinces andmunicipalities in China. PloS one. 2017;12(3):e0174378. https://doi.org/10.1371/journal.pone.0174378.
19. Andiran N, Yordam N, Ozon A. Risk factors for vitamin D deficiency inbreast-fed newborns and their mothers. Nutrition. 2002;18:47–50. https://doi.org/10.1016/S0899-9007(01)00724-9.
20. Javaid MK, Crozier SR, Harvey NC, Gale CR, Dennison EM, Boucher BJ, et al.Maternal vitamin D status during pregnancy and childhood bone mass atage 9 years: a longitudinal study. The Lancet. 2006;367(9504):36–43. https://doi.org/10.1016/S0140-6736(06)67922-1.
21. Baggerly CA, Cuomo RE, French CB, Garland CF, Gorham ED, Grant WB,et al. Sunlight and vitamin D: necessary for public health. J Am Coll Nutr.2015;34(4):359–65. https://doi.org/10.1080/07315724.2015.1039866.
22. Khan KS, Kunz R, Kleijnen J, Antes G. Five steps to conducting a systematicreview. Journal of the Royal Society of Medicine. 2003;96(3):118–21. https://doi.org/10.1177/014107680309600304.
23. Checklist PRISMA statement 2009; Available in http://prisma- statement.org/PRISMA Statement/Checklist.aspx Accessed December 2018
24. Zhang L, Chow EP, Su S, Yiu WL, Zhang X, Iu KI, et al. A systematic reviewand meta-analysis of the prevalence, trends, and geographical distributionof HIV among Chinese female sex workers (2000–2011): implications forpreventing sexually transmitted HIV. Int J Infect Dis. 2015;39:76–86. https://doi.org/10.1016/j.ijid.2015.08.014.
25. Hoy D, Brooks P, Woolf A, Blyth F, March L, Bain C, et al. Assessing risk ofbias in prevalence studies: modification of an existing tool and evidence ofinterrater agreement. J Clin Epidemiol. 2012;65(9):934–9. https://doi.org/10.1016/j.jclinepi.2011.11.014.
26. Assessing risk of bias in included studies - Cochrane Handbook, 2011;Available in http://handbook-51.cochrane.org/chapter_8/8_assessing_risk_of_bias_in_included_studies.htm. Accessed November 2018.
27. Cochrane Collaboration.RevMan 5.3 user guide. The Cochrane Collaboration.2014; Available with RevMan, 5.
28. Sergeant, ESG. Epitools epidemiological calculators 2018. Ausvet Pty Ltd.Available at. http://epitools.ausvet.com.au Accessed November 2018.
29. Borenstein M, Hedges L, Rothstein H. Meta-analysis: Fixed effect vs. randomeffects. Meta-analysis. com. 2007.
30. Ried, K. Interpreting and understanding meta-analysis graphs: a practicalguide Reprinted from Australian Family Physician 2006; 35 (8).
31. Sachan A, Gupta R, Das V, Agarwal A, Awasthi PK, Bhatia V. High prevalenceof vitamin D deficiency among pregnant women and their newborns innorthern India. The American journal of clinical nutrition. 2005;81(5):1060–4.https://doi.org/10.1093/ajcn/81.5.1060.
32. Farrant HJ, Krishnaveni GV, Hill JC, Boucher BJ, Fisher DJ, Noonan K, et al.Vitamin D insufficiency is common in Indian mothers but is not associatedwith gestational diabetes or variation in newborn size. Eur J Clin Nutr. 2009;63(5):646–52. https://doi.org/10.1038/ejcn.2008.14.
33. Sahu M, Bhatia V, Aggarwal A, Rawat V, Saxena P, Pandey A, et al. Vitamin D deficiencyin rural girls and pregnant women despite abundant sunshine in northern India. ClinEndocrinol. 2009;70(5):680–4. https://doi.org/10.1111/j.1365-2265.2008.03360.x.
34. Singla R, Dutta U, Aggarwal N, Bhadada SK, Kochhar R, Dhaliwal LK. Vitamin-D deficiency is associated with gallbladder stasis among pregnant women.Digestive diseases and sciences. 2015;60(9):2793–9. https://doi.org/10.1007/s10620-015-3678-9.
35. Ajmani SN, Paul M, Chauhan P, Ajmani AK, Yadav N. Prevalence of vitamin Ddeficiency in burka-clad pregnant women in a 450-Bedded MaternityHospital of Delhi. J Obstet Gynecol India. 2016;66(1):67–71. https://doi.org/10.1007/s13224-015-0764-z.
36. Sharma S, Kumar A, Prasad S, Sharma S. Current Scenario of Vitamin DStatus During Pregnancy in North Indian Population. The Journal ofObstetrics and Gynecology of India. 2016;66(2):93–100. https://doi.org/10.1007/s13224-014-0658-5.
Jeyakumar et al. Journal of Health, Population and Nutrition (2021) 40:28 Page 10 of 11
37. Krishnaveni GV, Veena SR, Winder NR, Hill JC, Noonan K, Boucher BJ, et al.Maternal vitamin D status during pregnancy and body composition andcardiovascular risk markers in Indian children: the Mysore Parthenon Study.Am J Clin Nutr. 2011;93(3):628–35. https://doi.org/10.3945/ajcn.110.003921.
38. Veena SR, Krishnaveni GV, Srinivasan K, Thajna KP, Hegde BG, Gale CR, et al.Association between maternal vitamin D status during pregnancy andoffspring cognitive function during childhood and adolescence. Asia Pacificjournal of clinical nutrition. 2017;26(3):438–49. https://doi.org/10.6133/apjcn.032016.07.
39. Nandal R, Chhabra R, Sharma D, Lallar M, Rathee U, Maheshwari P.Comparison of cord blood vitamin D levels in newborns of vitamin Dsupplemented and unsupplemented pregnant women: a prospective,comparative study. J Matern Fetal Neonatal Med. 2016;29(11):1812–6.
40. Kumar P, Shenoi A, Kumar RK, Girish SV, Subbaiah S. Vitamin D DeficiencyAmong Women in Labor and Cord Blood of Newborns. Indian Pediatr.2015;52(6):530–1.
41. Chary AV, Hemalatha R, Seshacharyulu M, Murali MV, Jayaprakash D, KumarBD. Vitamin D deficiency in pregnant women impairs regulatory T cellfunction. J Steroid Biochem Mol Biol. 2015;147:48–55. https://doi.org/10.1016/j.jsbmb.2014.11.020.
42. Dasgupta A, Saikia UK, Sarma D. Status of 25 (OH) D levels in pregnancy: Astudy from the North Eastern part of India. Indian J Endocrinol Metab. 2012;16(Suppl 2):S405–7. https://doi.org/10.4103/2230-8210.104109.
43. Sablok A, Batra A, Thariani K, Batra A, Bharti R, Aggarwal AR, et al.Supplementation of vitamin D in pregnancy and its correlation with feto-maternal outcome. Clin Endocrinol. 2015;83(4):536–41. https://doi.org/10.1111/cen.12751.
44. Marwaha RK, Tandon N, Chopra S, Agarwal N, Garg MK, Sharma B, et al.Vitamin D status in pregnant Indian women across trimesters and differentseasons and its correlation with neonatal serum 25-hydroxyvitamin D levels.Br J Nutr. 2011;106(09):1383–9. https://doi.org/10.1017/S000711451100170X.
45. Higgins JP, Thompson SG, Deeks JJ, Altman DG. Measuring inconsistency inmeta-analyses. Bmj. 2003;327(7414):557–60.
46. Junaid K, Rehman A, Jolliffe DA, Wood K, Martineau AR. High prevalence ofvitamin D deficiency among women of child-bearing age in LahorePakistan, associating with lack of sun exposure and illiteracy. BMC Women'sHealth. 2015;15(1):83. https://doi.org/10.1186/s12905-015-0242-x.
47. Woo J, Lam CW, Leung J, Lau WY, Lau E, Ling X, et al. Very high rates ofvitamin D insufficiency in women of child-bearing age living in Beijing andHong Kong. Br J Nutr. 2008;99(06):1330–4. https://doi.org/10.1017/S0007114507844382.
48. Bukhary NBI, Isa ZM, Shamsuddin K, Lin KG, Mahdy ZA, Hassan H, et al. Riskfactors for antenatal hypovitaminosis D in an urban district in Malaysia. BMCPregnancy Childbirth. 2016;16(1):156.
49. Tasset JL. A systematic review of vitamin D deficiency in pregnancy in Indiaand its impact on maternal and fetal outcomes.2014;( Doctoral dissertation,University of Cincinnati).
50. Dovnik A, Mujezinović F, Treiber M, Balon BP, Gorenjak M, Maver U, et al.Seasonal variations of vitamin D concentrations in pregnant women andneonates in Slovenia. Eur J Obstet Gynecol Reprod Biol. 2014;181:6–9.https://doi.org/10.1016/j.ejogrb.2014.07.019.
51. Ono Y, Suzuki A, Kotake M, Zhang X, Nishiwaki-Yasuda K, Ishiwata Y, et al.Seasonal changes of serum 25-hydroxyvitamin D and intact parathyroidhormone levels in a normal Japanese population. J Bone Mineral Metab.2005;23(2):147–51. https://doi.org/10.1007/s00774-004-0553-8.
52. Mithal A, Wahl DA, Bonjour JP, Burckhardt P, Dawson-Hughes B, Eisman JA,et al. Global vitamin D status and determinants of hypovitaminosis D.Osteoporos Int. 2009;20(11):1807–20. https://doi.org/10.1007/s00198-009-0954-6.
53. Contreras-Manzano A, Villalpando S, Robledo-Pérez R. Vitamin D status bysociodemographic factors and body mass index in Mexican women atreproductive age. Salud Pública De México. 2017;59:518–25.
54. Pratumvinit B, Wongkrajang P, Wataganara T, Hanyongyuth S, Nimmannit A,Chatsiricharoenkul S, et al. Maternal vitamin D status and its related factorsin pregnant women in Bangkok, Thailand. PloS one. 2015;10(7):e0131126.https://doi.org/10.1371/journal.pone.0131126.
55. Azami MILAD, Shamloo MBB, Nasirkandy MP, Veisani YOUSEF, RahmatiSHOBOO, YektaKooshali MH, et al. Prevalence of vitamin D deficiencyamong pregnant women in Iran: a systematic review and meta-analysis.Koomesh. 2017;19(3):505–14.
56. Agarwal KS, Mughal MZ, Upadhyay P, Berry JL, Mawer EB, Puliyel JM. Theimpact of atmospheric pollution on vitamin D status of infants and toddlersin Delhi, India. Arch. Dis. Child. 2002;87(2):111–3. https://doi.org/10.1136/adc.87.2.111.
57. Van der Meer IM, Karamali NS, Boeke AJ, Lips P, Middelkoop BJ, Verhoeven I,et al. High prevalence of vitamin D deficiency in pregnant non-Westernwomen in The Hague, Netherlands. Am J Clin Nutr. 2006;84(2):350–3.https://doi.org/10.1093/ajcn/84.2.350.
58. Parlak M, Kalay S, Kalay Z, Kirecci A, Guney O, Koklu E. Severe vitamin Ddeficiency among pregnant women and their newborns in Turkey. TheJournal of Maternal-Fetal & Neonatal Medicine. 2015;28(5):548–51. https://doi.org/10.3109/14767058.2014.924103.
59. Roth DE, Shah MR, Black RE, Baqui AH. Vitamin D status of infants in north-eastern rural Bangladesh: preliminary observations and a review of potentialdeterminants. J Health Popul Nutr. 2010;28(5):458.
60. Kruger MC, Kruger IM, Wentzel-Viljoen E, Kruger A. Urbanization of blackSouth African women may increase risk of low bone mass due to lowvitamin D status, low calcium intake, and high bone turnover. Nutr Res.2011;31(10):748–58. https://doi.org/10.1016/j.nutres.2011.09.012.
61. Misra A, Singhal N, Sivakumar B, Bhagat N, Jaiswal A, Khurana L. Nutritiontransition in India: Secular trends in dietary intake and their relationship todiet-related non-communicable diseases. Journal of diabetes. 2011;3(4):278–92. https://doi.org/10.1111/j.1753-0407.2011.00139.x.
62. Akhtar S. Vitamin D status in South Asian populations–risks andopportunities. Critical reviews in food science and nutrition. 2016;56(11):1925–40. https://doi.org/10.1080/10408398.2013.807419.
63. Anwar S, Iqbal MP, Azam I, Habib A, Bhutta S, Soofi SB, et al. Urban andrural comparison of vitamin D status in Pakistani pregnant women andneonates. J Obstet Gynaecol. 2016;36(3):318–23.
64. Gupta A. Vitamin D deficiency in India: prevalence, causalities andinterventions. Nutrients. 2014;6(2):729–75.
65. Christesen H, Falkenberg T, Lamont R. The impact of vitamin D onpregnancy: a systematic review. Acta Obstetricia et GynecologicaScandinavica. 2012;91(12):1357–67. https://doi.org/10.1111/aogs.12000.
66. Moghraby SA, Al Shawaf T, Akiel A, Sedrani SH, El Idrissy AT, Al-Meshari AA.Parity and vitamin D metabolites. Ann Trop Paediatr. 1987;7(3):210–3.https://doi.org/10.1080/02724936.1987.11748509.
67. Saraf R, Morton S, Camargo CA, Grant CC. Global summary of maternal andnewborn vitamin D status–a systematic review. Matern Child Nutr. 2016;12(4):647–68. https://doi.org/10.1111/mcn.12210.
68. Shah I, James R, Barker J, Petroczi A, Naughton DP. Misleading measures inVitamin D analysis: a novel LC-MS/MS assay to account for epimers andisobars. Nutrition Journal. 2011;10(1):46. https://doi.org/10.1186/1475-2891-10-46.
69. Recommended dietary Allowance for Indians. 2010; available in ninindia.org/ dietaryguidelinesforninwebsite.pdf Accessed February 2019.
70. WHA65, R. 11. Nutrition. Maternal, infant and young child nutrition: draftcomprehensive implementation plan. Sixth-fifth World Health Assembly,Geneva, 2012; 21-26. (http://apps.who.int/gb/ebwha/pdf_files/WHA65/A65_11-en.pdf, accessed 18 December 2018).
71. Holick MF. Vitamin D deficiency. New England Journal of Medicine. 2007;357(3):266–81. https://doi.org/10.1056/NEJMra070553.
72. Bandeira F, Griz L, Dreyer P, Eufrazino C, Bandeira C, Freese E. Vitamin Ddeficiency: a global perspective. Arquivos Brasileiros de Endocrinologia &Metabologia. 2006;50(4):640–6. https://doi.org/10.1590/S0004-27302006000400009.
73. Micka AE. Vitamin D status among Bangladeshi women of reproductive age,2009; (Doctoral dissertation, University of Massachusetts Amherst).
74. Eyles D, Anderson C, Ko P, Jones A, Thomas A, Burne T, et al. A sensitive LC/MS/MS assay of 25OH vitamin D 3 and 25OH vitamin D 2 in dried bloodspots. Clinica Chimica Acta. 2009;403(1):145–51. https://doi.org/10.1016/j.cca.2009.02.005.
Publisher’s NoteSpringer Nature remains neutral with regard to jurisdictional claims inpublished maps and institutional affiliations.
Jeyakumar et al. Journal of Health, Population and Nutrition (2021) 40:28 Page 11 of 11