poly(thiolactone) homo- and copolymers from … supporting information poly(thiolactone) homo- and...
TRANSCRIPT

1
Supporting information
Poly(thiolactone) Homo- and Copolymers from
Maleimide Thiolactone: Synthesis and
Functionalization
Tobias Rudolph,1,2 Pieter Espeel,3 Filip E. Du Prez,3,* Felix H. Schacher1,2,*
[1] Laboratory of Organic and Macromolecular Chemistry, Friedrich Schiller University Jena,
Humboldtstr. 10, 07743 Jena, Germany
E-mail: [email protected]
[2] Jena Center for Soft Matter (JCSM), Friedrich Schiller University Jena, Philosophenweg 7,
07743 Jena, Germany
[3] Polymer Chemistry Research Group, Department of Organic and Macromolecular Chemistry,
Ghent University, Krijgslaan 281 S4-bis, B-9000 Gent, Belgium
E-mail: [email protected]
Electronic Supplementary Material (ESI) for Polymer Chemistry.This journal is © The Royal Society of Chemistry 2015
2
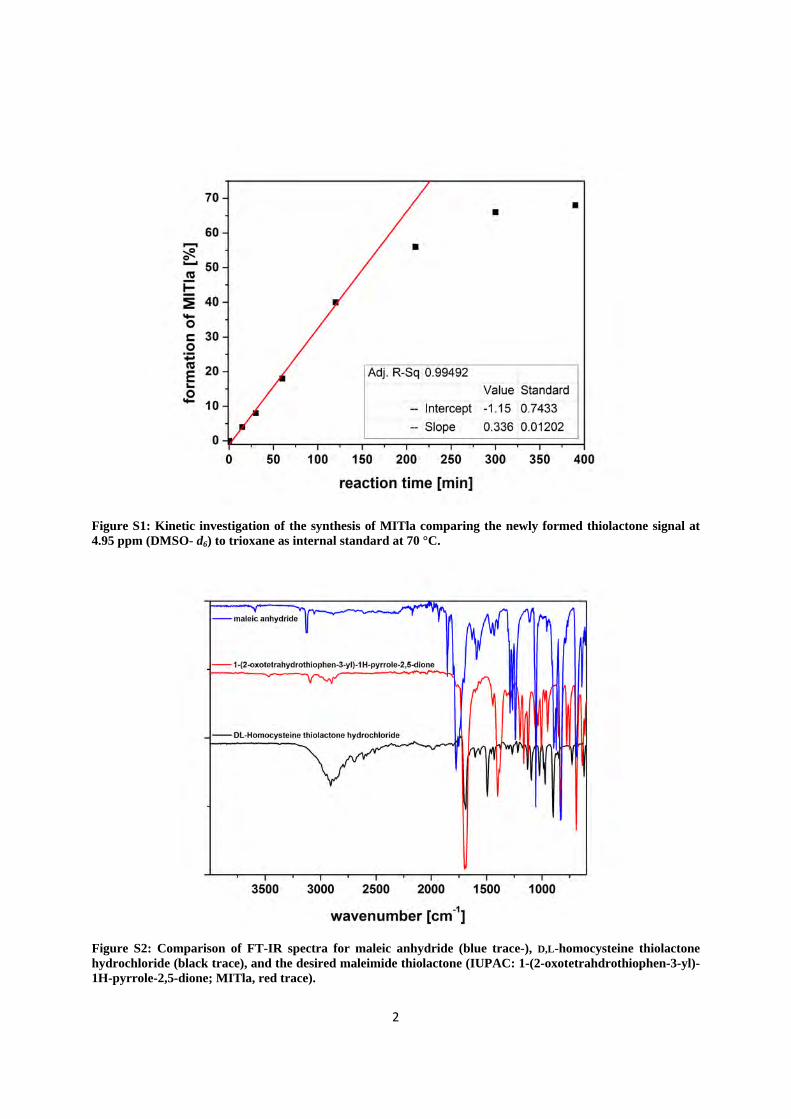
Figure S1: Kinetic investigation of the synthesis of MITla comparing the newly formed thiolactone signal at 4.95 ppm (DMSO- d6) to trioxane as internal standard at 70 °C.
Figure S2: Comparison of FT-IR spectra for maleic anhydride (blue trace-), D,L-homocysteine thiolactone hydrochloride (black trace), and the desired maleimide thiolactone (IUPAC: 1-(2-oxotetrahdrothiophen-3-yl)-1H-pyrrole-2,5-dione; MITla, red trace).

Figure S31400, and
Figure S4
3: Enlarged Fd the maleimi
4: 1H-NMR sp
FT-IR spectride double bo
pectra of mal
rum for MITlond at 830 and
leimide thiola
3
la and the imd 690 cm-1.
actone (MITla
mportant sign
a) and peak a
nals for: carb
assignment (C
bonyls at 1689
CDCl3, 300 M
9, C-N-C at
MHz).
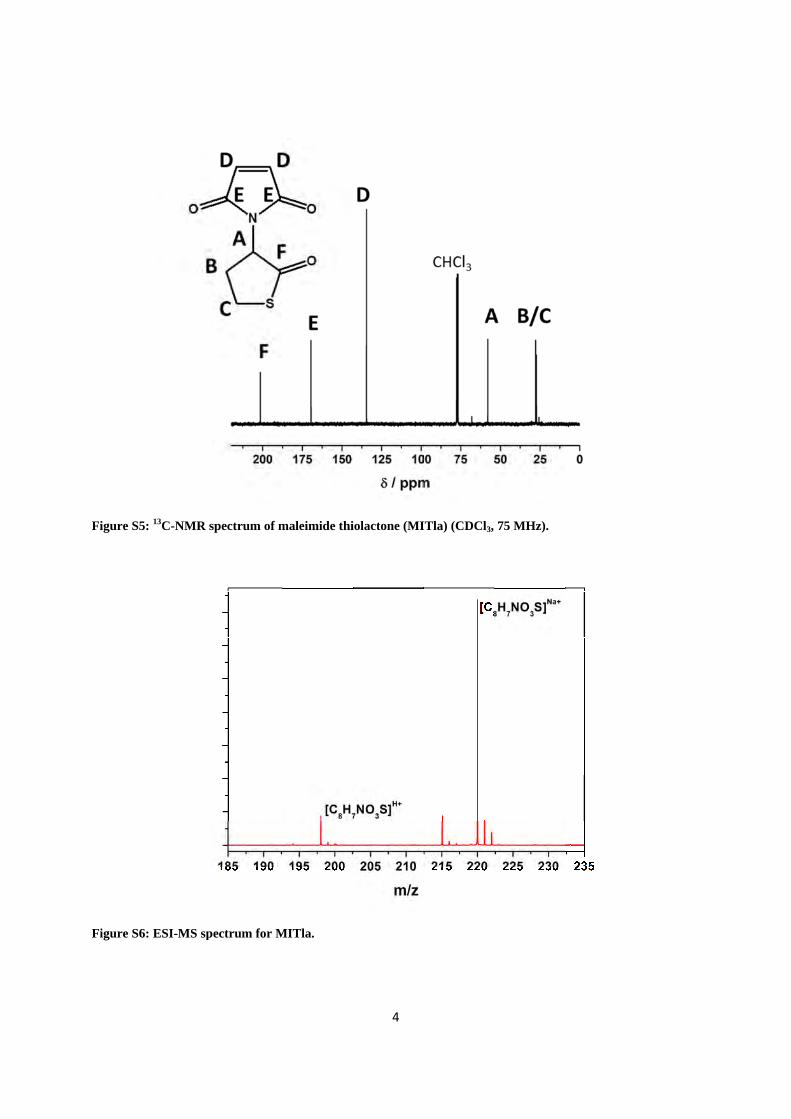
Figure S5
Figure S6
5: 13C-NMR s
6: ESI-MS sp
spectrum of m
pectrum for M
maleimide thi
MITla.
4
iolactone (MIITla) (CDCl3, 75 MHz).

5
Figure S7: Comparison of SEC traces for the homopolymerization of MITla initiated by different amounts of TPO in solution (100 mg mL-1 DCM): 5 wt.% (dotted line), 10 wt.% (straight line), and 20 wt.% (dashed line).
Figure S8: Comparison of SEC traces for the homopolymerization of MITla initiated by different amounts of AIBN in solution (100 mg mL-1 THF): 5 wt.% (dotted line), 10 wt.% (straight line), and 20 wt.% (dashed line).

Figure S9trace) (DM
Figure S1
9: ComparisoMSO-d6 , 75 M
10: NMR spec
on of 13C-NMMHz).
ctrum for PM
MR traces for
MITlaAIBN init
6
r MITla (bla
tiated by AIB
ack trace) and
BN in THF (C
d PMITla (1
CDCl3, 300 MH
0 wt.% TPO
Hz).
O, bulk; red

Figure S1
Figure S1
11: 13C-NMR
12: 13C-NMR
R spectrum for
R spectrum for
r PMITlaAIBN
r PMITlaAIBN
7
N (DMSO-d6 ,
N (CDCl3, 75 M
75 MHz).
MHz).

Figure S1
Figure S1
13: COSY spe
14: HSQC NM
ectrum for PM
MR spectrum
MITlaAIBN ini
m for PMITlaA
8
itiated via AI
AIBN initiated
BN in THF (3
via AIBN in T
300 MHz; CD
THF (300 MH
DCl3).
Hz; CDCl3).

Figure S1
Figure S1enlargem
15: DSC ther
16: Comparisment of the fin
mogram for P
son of FT-IR ngerprint regi
PMITlaTPO in
R traces for PMion (B).
9
n the tempera
MITlaAIBN (re
ature range of
ed trace) and
f -30 to 200°C
d PMITlaTPO
C.
(black trace)
(A) and an

Figure S1P(MITla-
Figure S1
17: Comparis-alt-S)36 (dash
18: 1H-NMR
son of SEC trhed line).
spectrum for
races for P(M
r P(MITla-alt-
10
MITla-alt-S)10
-S)23 and pea
(dotted line)
k assignment
), P(MITla-alt
t (300 MHz; C
lt-S)23 (straigh
CDCl3).
ht line), and

Figure S1
Figure S2
19: 1H-NMR
20: 1H-NMR s
spectrum for
spectrum for
r P(MITla-alt-
P(MITla-co-
11
-S)23 and pea
-NIPAAm)23 a
k assignment
and peak assi
t (300 MHz; D
ignment (300
DMSO-d6).
MHz; CDCl3
3).

Figure S2dot) for tof the cop
Figure S2and PMI
21: A) Time the copolymerpolymerizatio
22: ComparisTlaTPO (blue l
vs. styrene mrization of Mon of MITla a
son of DSC tlines) in the s
monomer convMITla and styrand styrene u
races for P(Msecond (straig
12
version plot drene; B) compsing RAFT.
MITla-alt-S)23
ght lines) and
determined bparison of SE
3 (black lines)third (dashed
by NMR (blaEC traces for
), P(MITla-cod lines) heatin
ck square) anthe kinetic in
o-NIPAAm)23
ng run.
nd GC (red nvestigation
3 (red lines)

Figure S2modificat
Figure S2butylami
23: Comparition via n-but
24: HSQC Nne and peak
ison of NMR tylamine and
NMR spectra assignment (3
spectra for methyl acryl
for PMITlaA
300 MHz; CD
13
PMITlaAIBN blate (300 MHz
AIBN,DM initiateDCl3).
before (blackz; CDCl3).
ed via AIBN
k trace) and
in CHCl3 by
after (red tr
y methyl acry
ace) double
ylate and n-

Figure S2double m
Figure S2modificat
25: Comparismodification vi
26: Comparistion via n-but
son of NMR tia n-butylami
son of NMR ttylamine and
traces for P(Mine and meth
traces for P(Mmethyl acryl
14
MITla-co-NIPhyl acrylate (3
MITla-alt-S)3
late (300 MHz
PAAm)23 befo300 MHz; CD
6 before (blacz; CDCl3).
ore (black traDCl3).
ck trace) and
ace) and after
d after (red tr
r (red trace)
race) double

15
Figure S27: Comparison of 13C-NMR traces for PMITlaAIBN,DM (blue trace), P(MITla-co-NIPAAm)23DM (red
trace), and P(MITla-alt-S)36DM (black trace); inset shows the signal at 58 ppm.
Figure S28: Comparison of SEC traces for the double modification by methyl acrylate and n-butylamine for P(MITla-alt-S)36 in different solvents: pristine P(MITla-alt-S)36 (dashed line), in THF (black line), in dioxane (red line), chloroform (blue line), DMF (blue line).

Table S1(25 mg m
Solve
DMF
THF
Dioxa
Chlorof
a) Db) S
Figure S2for P(MIDMF (blusignals ar
: Double modmL-1).
ent Reac
Tim
F 4
F 4
ane 4
form 4
Degree of funSEC (DMAC/
29: CompariITla-alt-S)36 iue line) (75 Mre still observ
dification of P
ction
me [h]
Fuad
48
48
48
48
nctionalization/LiCl): PS-ca
son of 13C-NMn different so
MHz; CDCl3)ved).
P(MITla-co-S
urther educddition afte
24 h
24 h
24 h
24 h
n is estimatedalib.
MR spectra olvents: in T); (As polyme
16
S)36 by n-buty
ct er fu
d via 1H-NMR
for double mTHF (black liners were only
lamine and m
Estimated unctionaliz
40
60
50
60
R (300 MHz; C
modification bne), in dioxa
y precipitated
methyl acrylat
degree of zation [%]a
0
0
0
0
CDCl3)
by methyl acrne (red line),
d once before
te at differen
Mnb
mol
19 6
18 6
16 6
15 0
rylate and n-, chloroform measuring N
t conditions
[g l-1]
Ðb
600 1.55
600 1.37
600 1.30
000 1.29
-butylamine (blue line),
NMR, educt

Figure Smodificat
Figure S3trace) mo
S30: Compartion by methy
31: Compariodification by
rison of FT-yl acrylate an
ison of FT-IRy methyl acry
-IR spectra nd n-butylami
R spectra forylate and n-bu
17
for PMITlaA
ine.
r P(MITla-coutylamine.
AIBN before (
o-NIPAAm)23
(black trace)
3 before (blac
) and after
ck trace) and
(red trace)
d after (red

18
Figure S32: Comparison of FT-IR spectra for P(MITla-co-S)36 before (black trace) and after (red trace) modification by methyl acrylate and n-butylamine.