pollution p2p file sharing systems -...
TRANSCRIPT
Pollution in P2P File Sharing Systems Jian Liang Rakesh Kumar Yongjian Xi Keith W. Ross
Department of Computer and Department of Electrical and Depaxtment of Computer and Department of Computer and Information Science. Computer Engineering. Information Science. Information Science.
Polytechnic University. Polytechnic University. Polytechnic University, Polytechnic University, Brooklyn. NY Brooklyn. NY Brooklyn. NY Brooklyn. NY
Email: [email protected] Email: [email protected] Email. [email protected] Email: [email protected] Phone : 1-7 18-260-3859
Abstract-One way tu combat f z P file sharing of copyrighted content is to deposit into the file sharing systems large volumes of polluted files. Without taking sides in the file sharing debate, in this paper we undertake a measurement study af the nature and magnitude of pollution in the FastTrack P2P network, currently the most popular PZP file sharing system. We develop a crawling platform which crawls the majority of the FastTrack Network’s 20,000+ supernodes in less than 60 minutes, From the raw data gathered by the crawler for popular audio content, we obtain statistics on the number of unique versions and copies available in a 24-hour period. We develop an automated procedure tu detect whether a given version is polluted or not, and we show that the probabilities of false positives and negatives of the detection procedure are very small. We use the data from the crawler and our pollution detection algorithm to determine the fraction of versions and fraction of copies that are polluted for several recent and old songs. We observe that pollution is pervasive for recent popular songs. We also identify and describe a number of anti-pollution mechanisms.
Keywords- Network Measurements.
I. INTRODUCTION
By many measures, file sharing is the most important application in the Internet today. For example, on a typical day, the FastTrack P2P network - currently one of the most largest file-sharing network - has more than 3 million active users sharing over 5,000 terabytes of content, (the FastTrack Network includes KaZaA, KaZaA-lite, Grokster and iMesh nodes). On the Uni- versity of Washington campus network in June 2002, KaZaA consumed approximately 37% of all TCP traffic, which was more than twice the Web traffic on the same campus at the same time [11.
But file sharing is not only having an important impact on Internet usage and traffic; it is also profoundly impacting sales in the music and video recording indus- tries. For example, in a recent study, Forrester estimates that the music industry lost over $700 million in CD sales in 2003 due to illicit sharing of copyrighted songs in P2P file sharing systems [2]. Each week there are more than one billion downloads of music files, and over 60 million Americans have downloaded music [3]
Because of the potential of huge financial losses, the 141 .
music industry has attempted to throttle P2P file sharing activity on three distinct fronts. First, it has taken many of the file-sharing companies to court for copyright in- fringement. Ths approach was successful in 2001. when the US courts effectively shut down the leading file sharing application. Napster, a US-based company with a centralized architecture for file location [5]. However, this approach has had little success at curtailing the FastTrack Network, for which it is more difficult to simply “pull the plug” due to its highly decentralized architecture and to its elusive international corporate structure. The second front has been to prosecute the individual users for copyright infringement, which by some estimates has decreased illicit file sharing by 20% However, file sharing remains rampant in the Internet, as it is difficult to prosecute millions of “small” users. particuIarly when they are scattered across the globe. The music industry’s third front for throttling file sharing is to actually sabotage the P2P file sharing systems. This approach has received relatively little press to date but - as we shall demonstrate in this paper - is currently being deployed on a grand scale.
One sabotage techruque that is particularly prevalent today, is that of pollution. Here. a “pollution com- pany” first tampers with copyrighted content with the intention of rendering the content unusable. it then deposits the tampered content in large volumes in the P2P network. Unable to distinguish polluted files from unpolluted files, unsuspecting users download the files into their own file-sharing folders, from which other users download the polluted files. In this manner, the polluted copies of a given song spread through the file- sharing system, and the number of polluted copies can eventually exceed the number of clean copies of a given song. The goal of the pollution company is to trick users into frequently downloading polluted copies; users may then become frustrated and abandon M P file sharing.
In this paper we undertake a detailed measurement study of the nature and magnitude of pollution in the FastTrack Network, currently the most popular P2P file sharing system. We emphasize that the purpose of this paper is not to take sides on the P2P file-sharing debate nor to condone nor to condemn pollution. The goal instead is to understand P2P pollution, how pervasive it is currently in P2P networks, how quickly it spreads, and to identify measures for countering P2P pollution
1174 0-7803-8968-9/05/$20.00 (C)ZOOS IEEE
Authorized licensed use limited to: Technische Universiteit Delft. Downloaded on March 3, 2009 at 09:03 from IEEE Xplore. Restrictions apply.
attacks. We will see that pollution is indeed pervasive, with more than 50% of the copies of many popular recent songs being polluted in the FastTrack Network today. Because P2P file sharing is having a major impact on Internet &traffic and usage. it is important to gain deep insights into P2P pollution, which is now a central part of fie P2P landscape.
The contributions of t h i s paper include: We developed a powerful crawling system which crawls the majority of the FastTrack Network’s 20,000+ supernodes in less than 60 minutes. Devel- oping such a crawler is highly challenging since the FastTrack Network uses a proprietary protocol with most of its signaling messages being encrypted. From the raw data collected by the crawler, we obtained statistics for popular audio content on the number of unique versions and copies available in a 24-hour period. For a given song, we find that the number the copies versus the version number typically follows a Zipf distribution. In order to estimate pollution levels, we devel- oped an automated processing procedure to detect whether a given version is polluted or not (which does not involve listening to the song). For the current pollution attacks, we show that the prob- abilities of false positives and false negatives of the detection procedure are very small.
+ We used the data from the crawler and our pollu- tion detection algorithm to determine the fraction of versions and fraction of copies that are polluted for several popular songs. We observe that pol- lution is pervasive for recent popular songs and hardly significant for older songs. We used our crawler to study the evolution of versions, copies, and pollution in the FastTrack Network for a period of 19 days. We use or measurement data to show that the FastTrack Network’s rating system is ineffective for identifying polluted files. Finally, we identify and describe a number of anti- pollution mechanisms. These mechanisms fall into two categories: schemes that require the user to download a portion of the file before declaring the file polluted; and those which do not require any user downloading.
11. CLASSIFICATION OF P2P POtLUTiON
Depending on the strategies taken to pollute content, pollution in file-sharing systems can be classified into two major categories.
Content Pollution: This is currently the more common fomi of pollution. The polluting party targets a particular digital recording (e.g., song or video). It then manufactures decoys for the recording by modifying it in one or more ways, including. replacing a11 or part of the content with white noise, cutting the duration, shuffling blocks
of bytes within the digitaI recording, inserting warnings of the illegality of file sharing in the recording, and inserting advertisements. We ob- served that today a popular pollution technique is to insert tens of seconds of undecodable white noise into the middk of the song. Metadata Pollution: The other strategy is to not tamper with the digital recordings themselves but instead tamper with metadata. This often involves taking an older recording, whose copyright has expired, and changng its song title, aIbum title, and artist name to that of the targeted recently- released recording. Thus, when a user requests the target recording, the user will mistakenly obtain a different recording.
We emphasize that these pollution schemes currently work well because there is a lack of good media matching systems in P2P file sharing. We discuss more about strategies for countering pollution in Section VI.
We can also classify pollution as intentional and un- intentional. A pollution company intentionally creates polluted versions of files, using the content and metadata pollution techniques described above. But users often accidentally create damaged files and inject them into P2P file sharing systems. For example, a user may “rip” a song from a CD, inadvertently truncate the song, and then make available the truncated song in the P2P file- sharing system. Or a user may record the song from the radio and accidentally pick up the disk-jockey’s voice at the beginning or end of the song. We refer to files whch have been inadvertently corrupted by user error as unintentional pollution. Finally, we remark that certain parfies sometimes make minor modifications in recordings which are hardly noticeable, For example, we have observed that to reduce a song’s air time, a radio station may eliminate a long, repetitive tail of the song or even slightly accelerate its playback. A user can then record and distribute the slightly-tampered song in a P2P file sharing system. The songs investigated in tius study are listed in Table 1. (In Section IV we explain why we chose these particular songs.)
111. THE FASTTRACK CRAWLING SYSTEM To gather raw data about versions, copies, and pollu-
tion levels in P2P systems, we developed and deployed a farm of multi-threaded crawling nodes, which we call the The FastTrack Crawling Platform. This system crawls through virtually all of the 30,000+ FastTrack Network’s supernodes in 15-60 minutes. Furthermore, it is scalable in that the crawling time is inversely pro- portional to the number of Linux boxes in the platform.
A crawling system was previously developed for the Gnutella P2P network [6 ] . Developing a crawl- ing system for the FastTrack Network is significantly more challenging for two reasons. First, the. FastTrack Network is 10-100 times larger than Gnutella, both in terms of the number of peers and traffic. Second, and
1175
Authorized licensed use limited to: Technische Universiteit Delft. Downloaded on March 3, 2009 at 09:03 from IEEE Xplore. Restrictions apply.
TABLE I SONGS INVESTIGATED FOR POLLUTION
more importantly, the Gnutella protocol is in the pub- lic domain, whereas the FastTrack Network’s protocol is proprietary with little information available to the research community about how it operates. Thus, to develop the FastTrack Crawling Platform, we first had to undertake a measurement and reverse engineering project to understand how the FastTrack Network sys- tem operates [7] .
A. Overview of FasrTrack’s Design To present the FastTrack Crawling System and ow
experimental methodology, we first need to summarize how FastTrack Network works. Our focus here is on those aspects of the FastTrack Network that are relevant to the FastTrack Crawling System. A more complete description is available in [7].
The FastTrack Network contains files available for file sharing. These files include audio mpegs, videos, and executables including games. Each file in the system includes metadata. A file’s metadata includes the file name, the file size and file descriptors. For music, a file’s file descriptors typically include song title, artist, album, and user-supplied keywords. The file descriptors are used for keyword matches during querying.
The KaZaA software installed and executed on the peers is called the KaZaA Media Desktop (KMD). The KMD enables a peer to download files directly from other peers, upload files directly to other peers, and query for content stored in the other peers. For each file in the KaZaA shared folder, the KMD determines the file’s ContentHash, which is a proprietary signature taken over the entire file, including the file’s metadata. The ContentHash plays a central role in the KaZaA design. In the most recent version of KaZaA, the ContentHash is the only identifier used to identify a file when requesting a download, If a download from a specific peer fails, the ContentHash enables the KaZaA client to search for the specific file automatically, with- out issuing a new keyword query,
In addition to KaZaA, Grokster and iMesh are two other clients that currently participate in the FastTrack overlay network. All three clients are licensed by Sharman Networks, Inc and use the same protocol as KaZaA. Many users today dso use KaZaA-Lite IS].
an unofficial copy of the KMD, rather than the KaZaA client (KMD) distributed by S h m a n . Each KaZaA-Lite client emulates Shaman’s KMD and participates in the same KaZaA network.
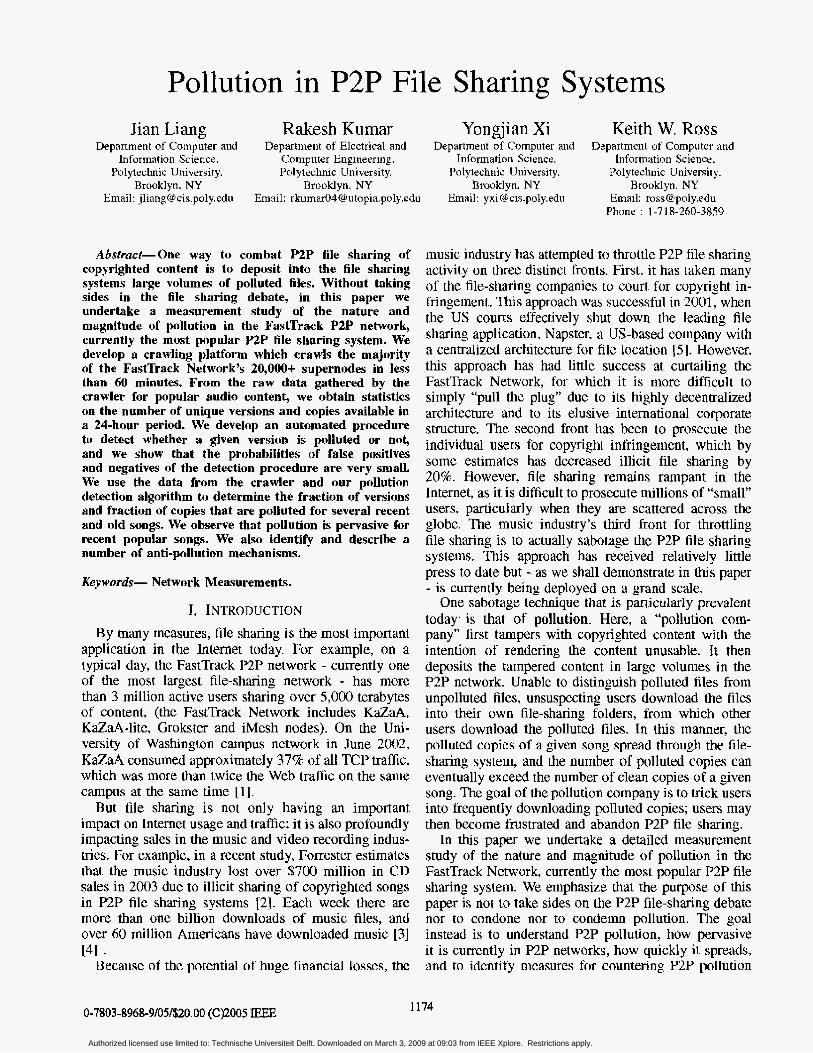
Unlike Napster, the FastTrack Network is decentrd- ized and does not maintain an always-on, centralized index for tracking the location of files. As shown in Figure 1, the FastTrack Network has two classes of peers, Ordinary Nodes (ONs) and Super Nodes (SNs). SNs have greater responsibilities and are typically more powerful than the ONs with respect to availability, Internet connection bandwidth and processing power. When an ON launches the KaZaA application, the ON establishes a TCP connection with a SN, thereby becoming a “child” of that SN. The ON then uploads to the SN the metadata and ContentHashes for the files it is sharing. This allows the SN to maintain a local index which includes ContentHashes and file descriptors for all the files its children are sharing along with the corresponding IP addresses of the ONs holding the particular files. In this way, each SN becomes a mini Napster-like hub. But in contrast with Napster, a SN is not a dedicated server (or server farm); instead, it is a peer belonging to an individual user. As shown in Figure 1, each SN also maintains long-lived TCP connections with other SNs, creating an overlay network among the SNs.
When a user wants to find files, the user’s ON sends a query with keywords over the TCP connection to its SN. For each match in its local index, the SN returns the metadata and IP addresses corresponding to the match. When a SN receives a query, it may flood the query over the overlay network to one or more of the SNs to which it is connected. ‘A given query will in general visit a small subset of the SNs, and hence will obtain the metadata information of a small subset of dl the ONs.
As part of the signalling traffic, the FastTrack Net- work nodes frequently exchange with each other lists of supemodes. For example, when an ON connects with a SN, the SN immediately pushes to the ON a supernode refresh list, which consists of the IP addresses of up to 200 SNs. Each ON maintains a cache of up 200 SNs whereas SNs appear to maintain a cache of thousands of
.
1176
Authorized licensed use limited to: Technische Universiteit Delft. Downloaded on March 3, 2009 at 09:03 from IEEE Xplore. Restrictions apply.
n
Fig. 1. network
Supernode and Ordinay nodes in the FmrTruck Network
SNs. When a peer A (ON or SN) receives a supernode refresh list from another peer B, peer A will typically purge some of the entries from its cache and add entries sent by peer E. By frequently exchanging supemode refresh lists, nodes maintain up-to-date lists of active SNs.
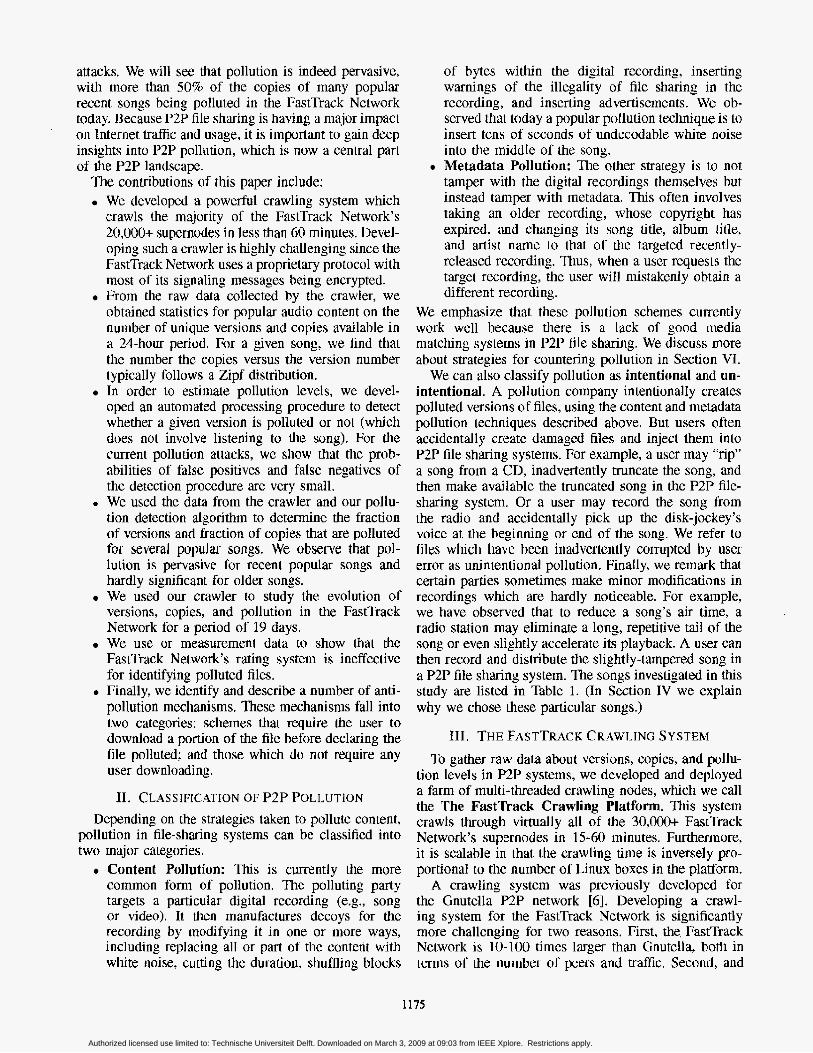
B. The K a M Crawling Pia forin Architecture The FastTrack Crawling Platform is shown in Figure
2. It consists of a process manager, a measurement database, and n crawIing nodes. At the core of the system are the n crawling nodes, each implemented in its own Linux box. In our current deployment, n = 10. Each crawling node runs four processes, with each process maintaining 40 threads. Thus with n = 10, the FastTrack Crawling Platform has 1,600 parallel threads. h c h thread partially emulates the client-side of the FastTrack Network connect and query protocol. (We used the results of an earlier reverse engineering project to design the syntax and semantics of the threads’ messages [7].) All of these Linux boxes are. located in Polytechnic campus in Brooklyn. It is also possible to run crawler experiments from multiple locations distributed throughout the world. However as our mea- surement results described in section 111-C show, we are crawling the vast majority of SNs from the one location itself. Thus a distributed approach is not necessary.
The crawling takes place in rounds of 30 seconds. In each round, each crawling thread operates as follows:
1) ’Ihe crawling thread is initialized with (2) the IP address of some candidate SN in the FastTrack Network, and (ii) a set of query strings. For a targeted song, each query string typically consists of the song title and artist name.
2) The crawling thread attempts to make a TCP connection with the candidate SN. If it fails to establish a TCP connection, then the thread waits until the next round to get a new IP address. If it succeeds, it exchanges handshake messages with the SN and continues as follows,
3) The crawling thread receives from the SN a SN refresh List, consisting of IP addresses of up to 200 SNs. This SN refresh list is forwarded to the Process Manager.
crawler crawler crawler crawler
FaslTrack Network
Fig. 2. The FmtTrack Crawling Pla~orni Architecture
4) For each query string, the crawling thread sends a query to the KaZaA network (via the connected SN). If there are m songs to be queried. the crawling thread sends out m queries back-to-back.
5 ) For each of these queries, the crawling thread receives (via the connected SN) matching query results. Each query result includes the metadata and ContentHash for the file associated with the match. We set the time-out of each such query session to be 30 seconds.
6) The metadata, ContentHash and IP address from each query result is forwarded to the measurement database.
The Process Manager coordinates and controls the crawling nodes. It maintains a list of all candidate SNs, which is augmented whenever it receives a SN refresh list. In steady state, the Process Manager dispatches 1600 candidate IP addresses to the processes every 30 seconds. Each candidate SN is eventually checked by one of the threads; if the thread succeeds at making a TCP connection with the candidate SN and at querying the SN’s local index, the candidate SN is further labeled as conjinned.
At the end of each hour, the FastTrack Crawling Platform starts from scratch, with the candidate set of SNs initialized with the confirmed set of SNs of the previous hour. For each experiment, we gather data for a 24-hour period.
We employ a simple optimization to accelerate the harvest rate of SN IP addresses, As discussed above, after connecting to a SN, a crawling thread sends a sequence of queries into the FastTrack Network. We include in h s sequence generic queries such as “mp3”. For each response, the crawling system identifies the SN that originating the query response. The responses thus provide an additional source of IF’ addresses, which are merged with the addresses currently in the global list of the process manager.
1177
Authorized licensed use limited to: Technische Universiteit Delft. Downloaded on March 3, 2009 at 09:03 from IEEE Xplore. Restrictions apply.
35000 I 30000 4 ...................................................................... ..........I 25000 - ....................................................................................
............................................. .........................
..................................................................................
...................................................................................
z 5 0 0 0 - .................................................................................... L
3:oo IO 3:20 3:io 3.40 3 5 0
Tlmr
(a) May 1.2004 - Early Morning
.............................................. .........................
...............................
..................
. . . . . . . . . . . . . . . . . . . . . . . 1 3 5 7 9 11 13 15 17 19 21 23
TLma nf the Day
(a) Total size of the network (SNs + ONs), Saturday. May 1, 2004 (weekend).
4000000, 3800000 4 .........................................................
d" 3HJ)OlJO 4 ........................................................! J ...................................... ................ j
...............
1 3 5 7 9 11 i3 t5 17 19 21 23
Tlme of the Day
(c) Total size of the network (SNs + ONs), Thursday, May 13, 2004. (weekday)
...........
............
.... ...........................
.... /. ......................................................................... i I
0 ) I
1803 ID10 IN20 IE 30 1840 IB50
f1ma
(b) May 1,2004 - Afternoon
..... 4000Q 1 I
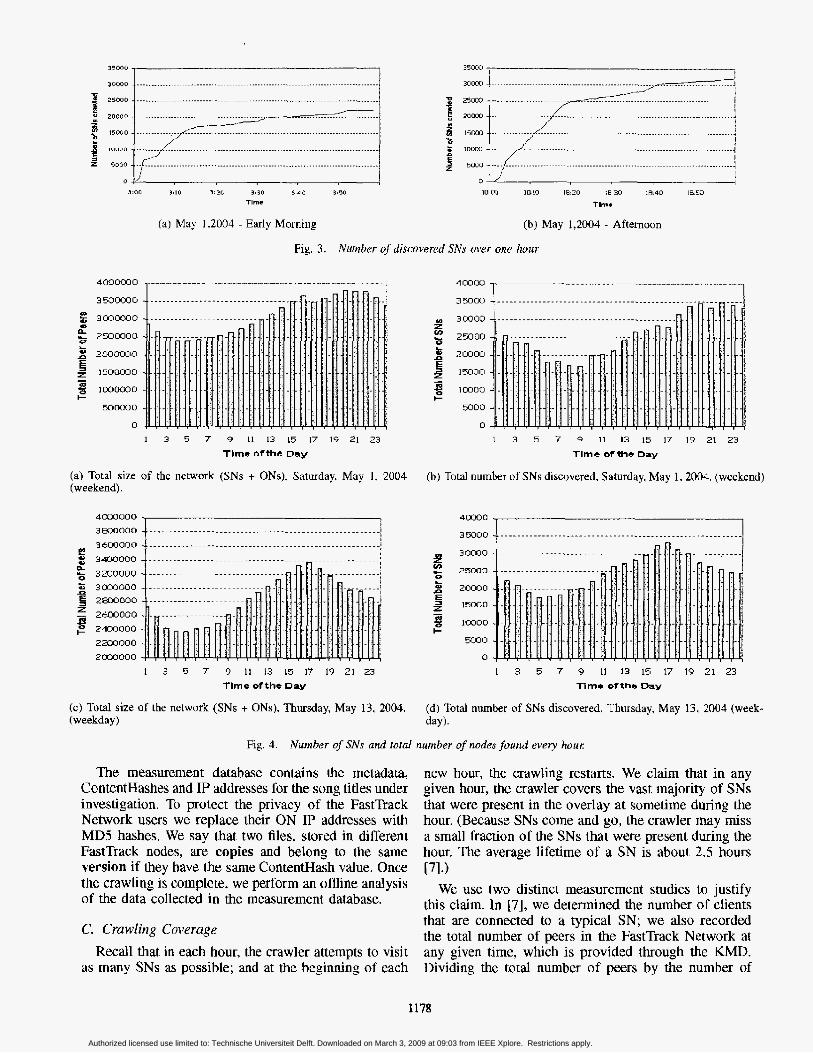
Fig. 3. Niunber of discovered SNs over one hour
Fig. 4. Number of SNs and total number of nodes found every houl:
35000
30000 z 0 E 25000
5 20000
$ 15000 - Ia - loo00
5000
0
1 I
........................... i
I 3 5 7 9 11 13 15 17 19 21 23
Tlmc of the clay
(b) Total number of SNs discovered, Saturday. May 1.2004. (weekend)
4CGQO
35000 ..........................................................
3 0000
25(#30
2ocroo
15030
10000
moo
0
.............. ................
I 3 5 7 9 11 13 15 17 19 21 23 Tlme of the Day
(d) Total number of SNs discovered, Thursday, May 13, 2004 (week- day).
The measurement database contains the metadata, ContentHashes and IP addresses for the song titles under investigation. To protect the privacy of the FastTrack Network users we replace their ON TP addresses with MD5 hashes. We say that two files, stored in different FastTrack nodes, are copies and belong to the same version if they have the same ContentHash value. Once the crawling is complete, we perform an offline analysis of the data collected in the measurement database.
C. Crawling Coverage Recall that in each hour, the crawler attempts to visit
as many SNs as possible; and at the beginning of each
new hour, the crawling restarts. We claim that in any given hour, the crawler covers the vast majority of SNs that were present in the overlay at sometime during the hour. (Because SNs come and go, the crawler may m i s s a small fraction of the SNs that were present during the hour. The average lifetime of a SN is about 2.5 hours
We use two distinct measurement stuhes to justify this claim. In [7] , we determined the number of clients that are connected to a typical SN; we also recorded the total number of peers in the FastTrack Network at any given time, whch is provided through the JCMD. Dividing the total number of peers by the number of
171.)
1178
Authorized licensed use limited to: Technische Universiteit Delft. Downloaded on March 3, 2009 at 09:03 from IEEE Xplore. Restrictions apply.
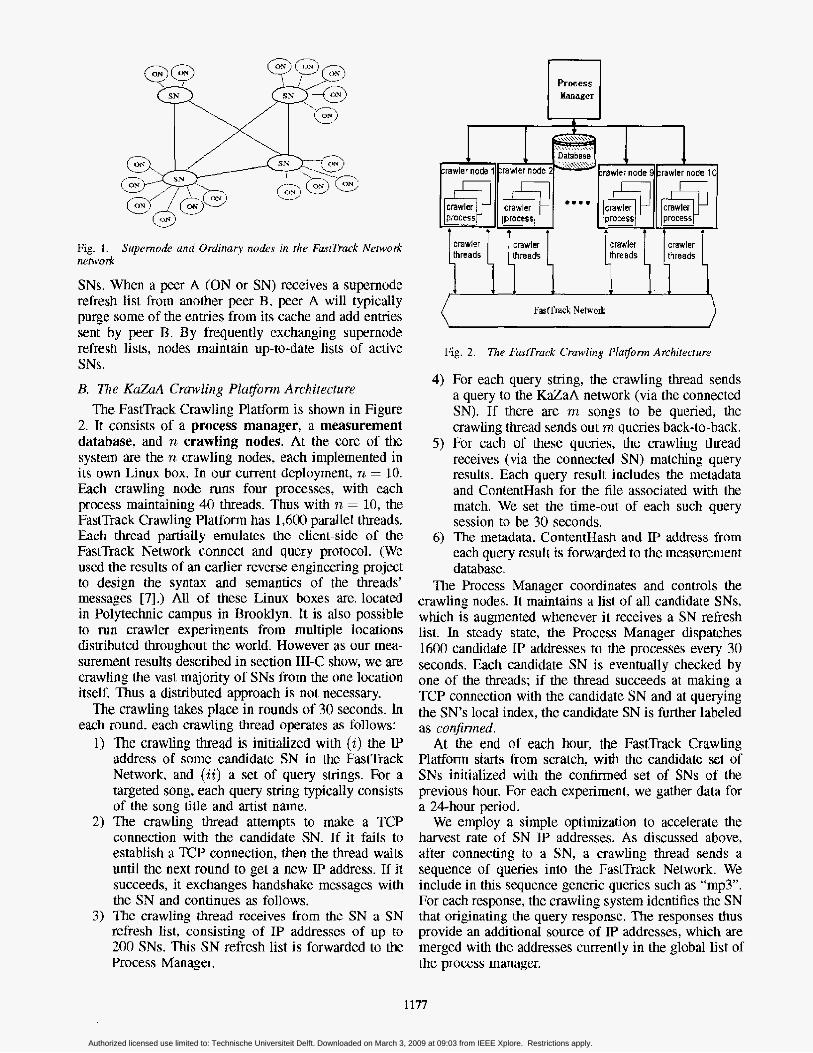
peers connected to a SN gives an estimate of the total number of SNs. We estimated that the number of SNs is about 20.000-30,000, depending on the time of day. Figure 3 presents the number of SNs confirmed by the crawler as a function of time for 60 minutes for two different trials - one in the early morning and the other in afternoon, on the same day. The curves in Figure 3 flatten out after about 30 minutes, at a level of 20,000- 30.000 supernodes. The curves do not completely flatten out, however, due to supernode churn. This flattening out of thc curves in the 20,000-30,000 range supports our claim that our crawler covers essentially all the supernodes in an hour.
To further justify this claim, we also measured the number of ONs and discovered SNs in the overlay for each hour for 24 consecutive hours, The number of dis- covered SNs in each hour is obtained from the FastTrack Crawling Platform,. For the total number of peers (SNs plus ONs), we again rely on KaZaA’s network statistics message displayed in any KMD. Figure 4(a) and 4(c) shows the evolution for the total number of peers in the FastTrack Network whle Figure 4(b) and 4(d) shows the evolution of number of discovered SNs in each hour. The measurements were made for over a period of forty eight hours - 0:OO EST May 13, 2004 to 23:59 EST May 1, 2004 for Figure 4(a) and 4(b); 0:OO EST, May 13, 2004 to 23:59 EST May 13, 2004 for Figure 4(c) and 4(d). Observe that the the shape of the evolution of the SNs closely resembles the shape of the evolution of the total number of peers. The average degree of connectivity from a SN to ONs is 115 with a standard deviation of 9.75. The low variance in the degree of connectivity further supports our claim that the KaZaA Crawling Platform identifies almost all the SNs that are present in each one-hour period.
IV. VERSION RESULTS
Many users use applications called “rippers” to ex- tract audio media from compact discs and store ex- tracted audio content on hard drives, where they can be transformed by an “encoder” into the MP3 format [?I. Such “encoder” and “ripper” processes have re- cently been bundled into “1-Step” software, making duplication and distribution of mpeg audio files even easier [?I. Typically, the software “ripper-encoders” provide many encoding options, including the bit-rate of encoding and the lengths of silence at beginning and end of the song. Thus, users transform the same song from a CD into non-identical MP3 files, each of which hashes to a different value and is thus a different version of the song. Some of the many other factors that create different versions include ripping of songs from different radio stations, DJ mixes, and, most importantly, different metadata keyed in by different users for the same song. All of this results in a plethora of different versions for the same song, each with its own ContentHash.
We performed an extensive version analysis on the seven popular songs shown in Table I . This analysis is presented in Table II. In choosing the seven songs, we chose songs that were ranked highly in the music charts at the time of the experiment; we also sought a diversity of record labels. Otherwise, our choice was random - we did not select and then reject any songs with any c1 priori knowledge of their version or pollution levels. For each of these seven songs, the FastTrack Crawling Platform determined the number of versions of the song available in the FastTrack Network and the number of copies available for each version. To accurately count the number of copies available for a version, for each copy discovered by the crawler, we record the following 4-tupks for the copy: (IP address, port number, user name, ContentHash). The number of copies is the total number of non-identical 4-tuples.
As shown in Table 11, each of these songs has a huge number of versions, ranging from 8,000 to almost 50,000. The number of copies for these songs is also remarkably large, ranging from about 175.000 to about 1.8 million.
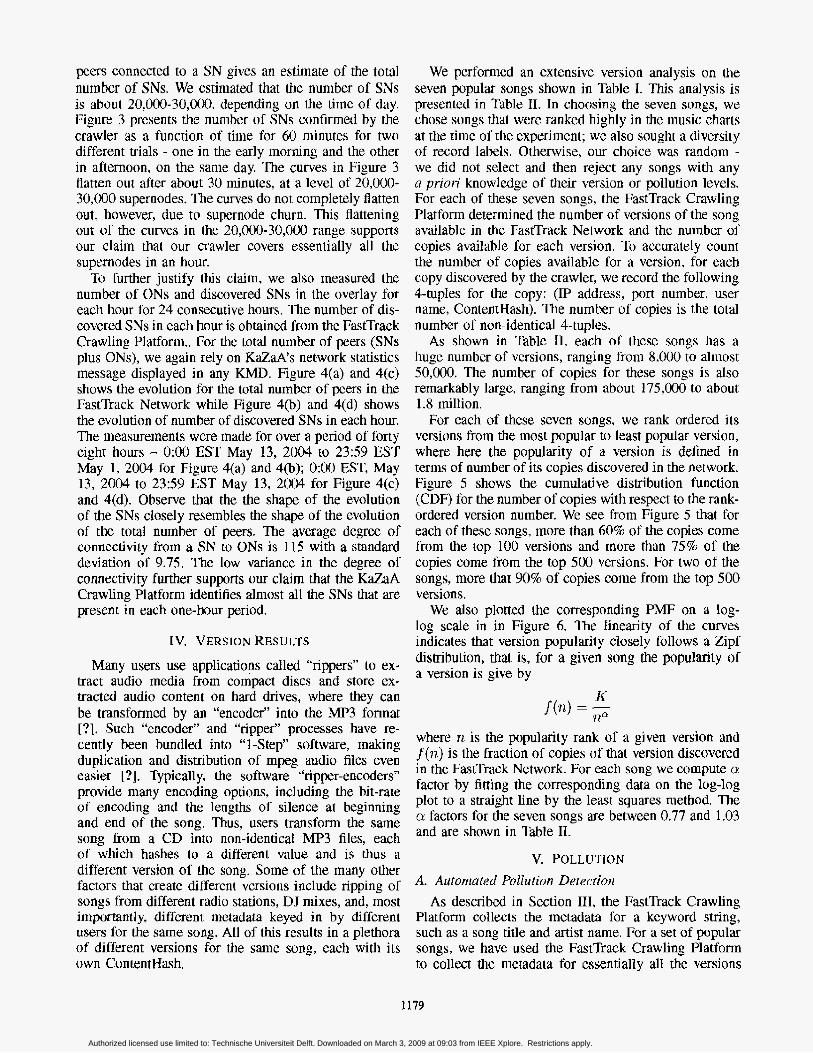
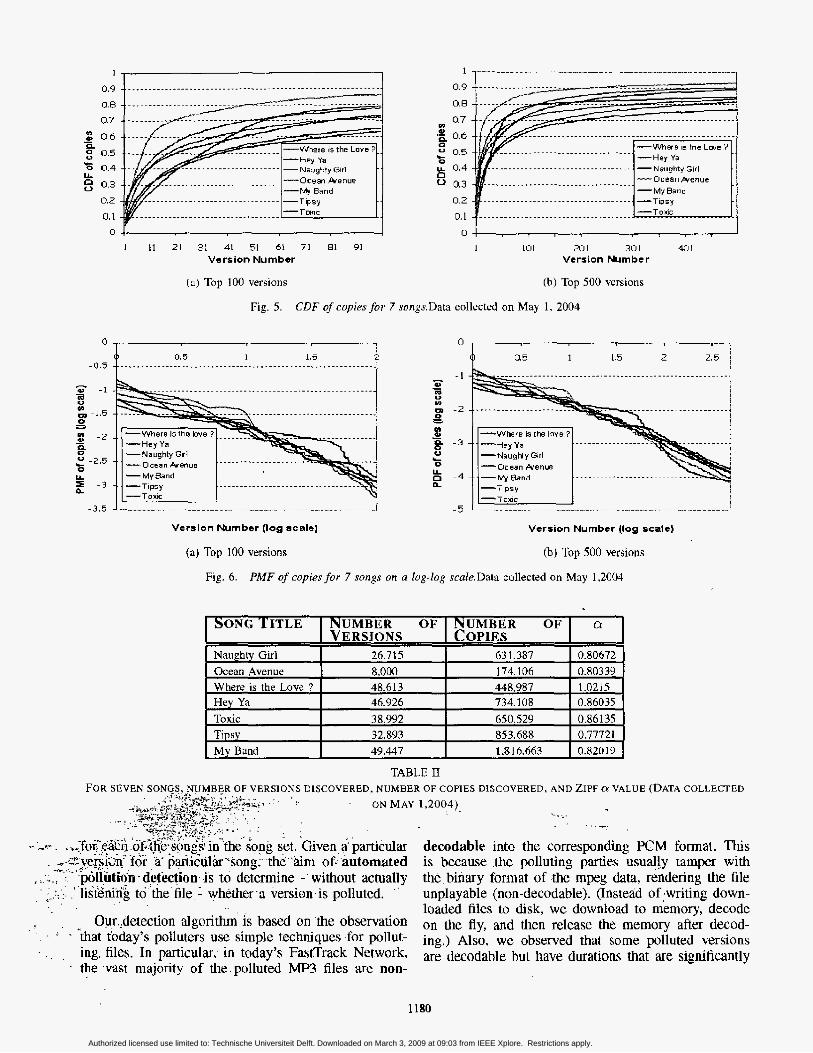
For each of these seven songs, we rank ordered its versions from the most popular to least popular version, where here the popularity of a version is defined in terms of number of its copies discovered in the network. Figure 5 shows the cumulative distribution function (CDF) for the number of copies with respect to the rank- ordered version number. We see from Figure 5 that for each of these songs, more than 60% of the copies come from the top 100 versions and more than 75% of the copies come from the top 500 versions. For two of the songs, more that 90% of copies come from the top 500 versions.
We also plotted the corresponding PMF on a log- log scale in in Figure 6, The linearity of the curves indicates that version popularity closely follows a Zipf distribution, that is, for a given song the popularity of a version is give by
K ?la
f (n) = -
where n is the popularity rank of a given version and J(77.) is the fraction of copies of that version discovered in the FastTrack Network. For each song we compute a factor by fitting the corresponding data on the log-log plot to a straight line by the least squares method. The CY factors for the seven songs are between 0.77 and 1.03 and are shown in Table 11.
v. POLLUTION
A. Autonzated Pollution Defection As described in Section 111. the FastTrack Crawling
Platform collects the metadata for a keyword string, such as a song title and artist name. For a set of popular songs, we have used h e FastTrack Crawling Platform to collect the metadata for essentially all the versions
1179
Authorized licensed use limited to: Technische Universiteit Delft. Downloaded on March 3, 2009 at 09:03 from IEEE Xplore. Restrictions apply.
1
0.9
0.B
0.7
.- g 0.6 0.5
0 0.4 U.
0.3
0.2
0.1
0
a
c
NUMBER OF COPIES
631.387 174.106 448.987 734.108 650.529 853.688 1,8 1 6.663
.............................................................
0.8 0 6 7 2 0.80339 1.0215 0.86035 0.86135 0.77721 0,82019
/I _ _ _ ~ ~ _ _ _ _ _ _ ~ ~ _ _ ...............
.................................. -Tome
........................ /-". Y~ ..........................
................................ 1-T' PSY ti
1 1 ............. ... ~~~ ........... .......l...l ............. " " _ I
0.9
0.0
0.7 *- 0.6 E 0.5 U 0.4 0 0 0.3
YI U
0
0.2 #....................................]--Tipsy
............
............................................. ................................
.................................. -Naughty Girl -Ocean & e w e ...................................
'I ..................................... 0.1 I --Tom
I I 4 0 .5 I 1.5 .............................................................. t
.....................................
........................
........... 7 Version Number (log scale)
0 0.5 1 1.5 2 2.5
- 1 - U
m 0 n
- a -2
- 1 g -3
k - 4
U L 0
k
.............................................
........... ..................... ?
_______.___'
-Taxic ............ -..t.... ....................... ..".I .- .....
Version Number (log scale)
Top 100 versions (b) Top 500 versions
Fig. 6. PMF of copies for 7 songs on a log-log scuZe.Data collected on May 1,2004
SONG TITLE NUMBER OF VERSIONS
Naughty Girl 26.715 Ocean Avenue 8.000 Where is the Love ? 48.61 3 Hey Ya 46.926 Toxic 38.992 Tipsy 32.893 My Band 49.4.47
TABLE I1 DISCOVERED. NUMBER OF COPIES DISCOVERED, AND ZIPF Cv VALUE (DATA COLLECTED
L . . ~ .
O N MAY 1,2004)
. , - - - .
-d-.- ,"ay 'Given,$ &ticular decodable into the corresponding PCM format. This . -e* m ofwautomated is because .the polluting parties usually tamper with
c~..:.! : .pSll,uti~~-detection-,is to determine -'without actually the binary format of .the mpeg data, rendering the file unplayable (non-decodable). (Instead of ,writing down- loaded files to disk, we download to memory, decode
-*>*.. , <'-- -1.7,- -
."lis&ning to .the file, 1 whether version.is polluted, "
' * Our.,detection algorithm 1s based on 'the observation . that today's poh.lkrS Use Simple tEhniqUeS for poht-
on the fly, and release the memory after decod- ing.) Also, we observed that some ~ l l u t ~ versions . '
. . .~ ing. files. In particular; in today's FastTrack Network ' the vast majority of the.palluted Mp3 files are non-
are decodable but have durations that are significantly
1180
Authorized licensed use limited to: Technische Universiteit Delft. Downloaded on March 3, 2009 at 09:03 from IEEE Xplore. Restrictions apply.
(b) for song Naughty Glrl
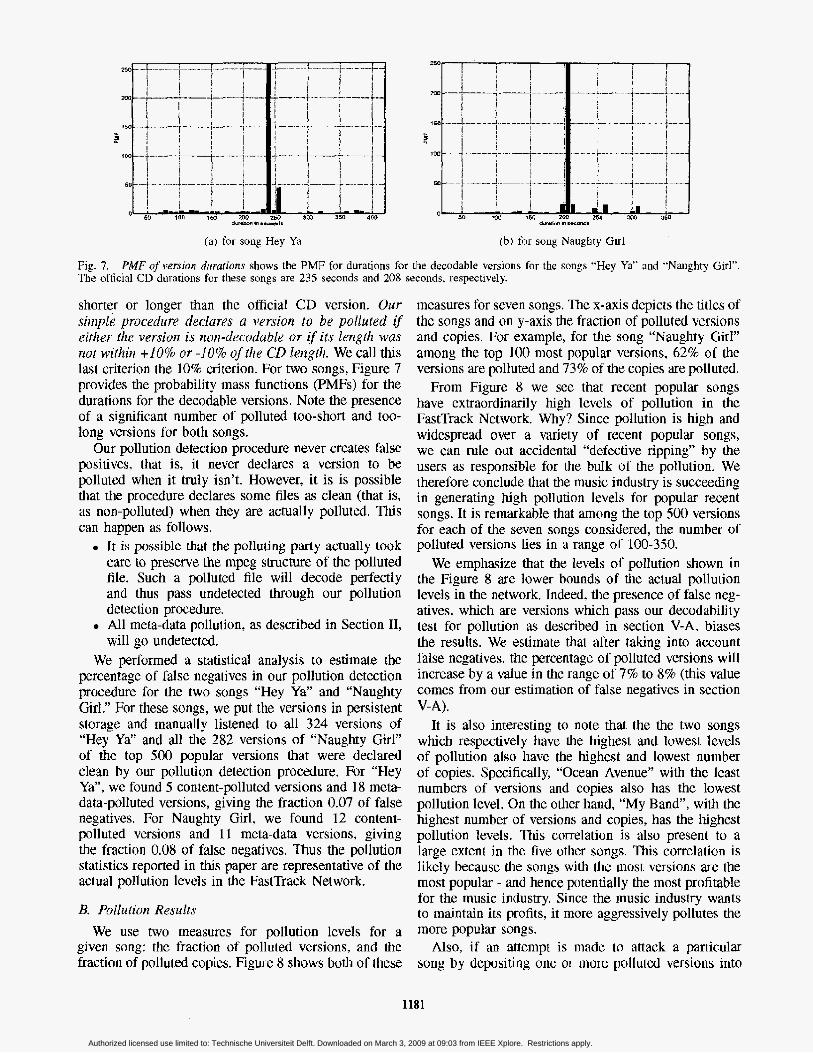
Fie. 7. The official CD durations far these songs are 235 seconds and 208 seconds, respectively.
PMF of version durafions shows the PMF for durations for the decodable versions for the songs “Hey Ya” and “Naughty Girl’’.
shorter or longer than the official CD version. Uiir siwple procedure declares a version to be polluted if either the versima is non-decodablc or if its length wus not wifliiiz +lo% or -10% of the CD length. We call t lus last criterion the 10% criterion. For two songs, Figure 7 provides the probability mass functions (PMFs) for the durations for the decodable versions. Note the presence of a significant number of polluted too-short and too- long versions for both songs.
Our pollution detection procedure never creates false positives, that is, it never declares a version to be polluted when it truly isn’t. However, it is is possible that the procedure declares some files as clean (that is, as non-polluted) when they are actually polluted. This Can happen as follows.
It is possible that the polluting party actually took care to preserve the mpeg structure of the polluted file, Such a polluted file will decode perfectly and thus pass undetected through our pollution detection procedure. All meta-data pollution, as described in Section 11, wiIl go undetected.
We performed a statistical analysis to estimate the percentage of false negatives in our pollution detection procedure for the two songs “Hey Ya” and “Naughty Girl.” For these songs, we put the versions in persistent storage and manually listened to all 324 versions of “Hey Ya” and all the 282 versions of “Naughty Girl” of the top 500 popular versions that were declared clean by our pollution detection procedure. For “Hey Ya”, we found 5 content-polluted versions and 18 meb- data-polIuted versions, giving the fraction 0.07 of false negatives. For Naughty Girl, we found 12 content- polluted versions and 11 meta-data versions, giving the fraction 0.08 of false negatives. Thus the pollution statistics reported in this paper are representative of the actual pollution levels in the FastTrack Network.
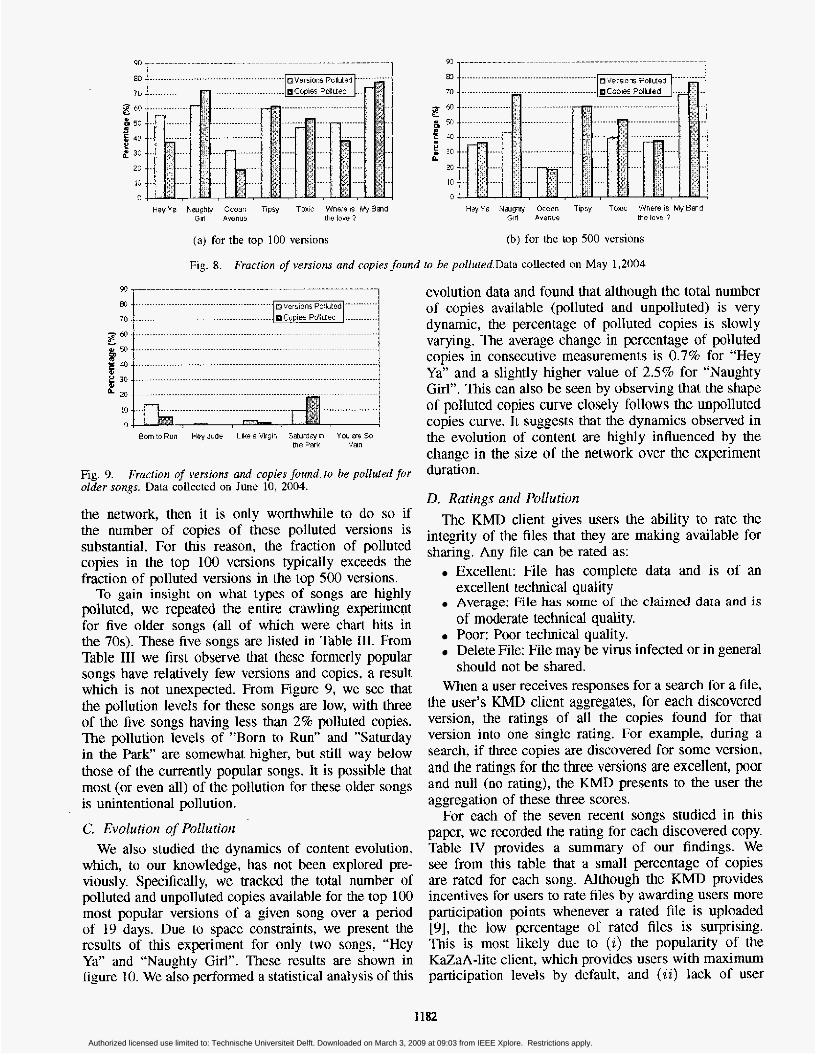
B. Pollution Results We use two measures for pollution levels for a
given song: the fraction of polluted versions, and the fraction of polluted copies. Figure 8 shows both of these
measures for seven songs. The x-axis depicts the titles of the songs and on y-axis the fraction of polluted versions and copies. For example, for the song “Naughty Girl” among the top 100 most popular versions, 62% of the versions are polluted and 73% of the copies are polluted.
From Figure 8 we see that recent popular songs have extraordinarily high levels of pollution in the FastTrack Network. Why? Since pollution is high and widespread over a variety of recent popular songs, we can rule out accidental “defective ripping” by the users as responsible for the bulk of the pollution. We therefore conclude that the music industry is succeeding in generating high pollution levels for popular recent songs. It is remarkable that among the top 500 versions for each of the seven songs considered, the number of polluted versions lies in a range of 100-350.
We emphasize that the levels of pollution shown in the Figure 8 are lower bounds of the actual pollution levels in the network. Indeed, the presence of false neg- atives, which are versions which pass our decodability test for pollution as described in section V-A, biases the results. We estimate that after taking into account false negatives, the percentage of polluted versions will increase by a value in the range of 7% to 8% (this value comes from our estimation of false negatives in section
It is also interesting to note that the the two songs which respectively have the highest and lowest levels of pollution also have the highest and lowest number of copies. Specifically, “Ocean Avenue” with the least numbers of versions and copies also has the lowest pollution level. On the other hand, “My Band”, with the highest number of versions and copies, has the highest pollution levels. This correlation is also present to a large extent in the five other songs. This correlation is likely because the songs with the most versions are the most popular - and hence potentially the most profitable for the music industry. Since the music industry wants to maintain its profits, it more aggressively pollutes the more popular songs.
Also, if an attempt is made to attack a particular song by depositing one or more polluted versions into
V-A).
1181
Authorized licensed use limited to: Technische Universiteit Delft. Downloaded on March 3, 2009 at 09:03 from IEEE Xplore. Restrictions apply.
..............................
.................
..................
HayYa Nauphy Ocean Tipsy Toxic Wne:e is * B a d HeyYa Nagn?g Ocean Ttpsy Tonic Wnereis MyBand Girl Avenue the iove ? Girl Avenue me lowe 7
(a) for the top 100 versions (b) for the top 500 versions
Fig. 8. Frucrion of versions and copies foirnd to be pollured.Data collected on May 1,2004
........... ................................... . . ~ ~
......................................... ............
Born to Run Way Jude Like a Virgin Smrday m You 8 6 So mePam Van
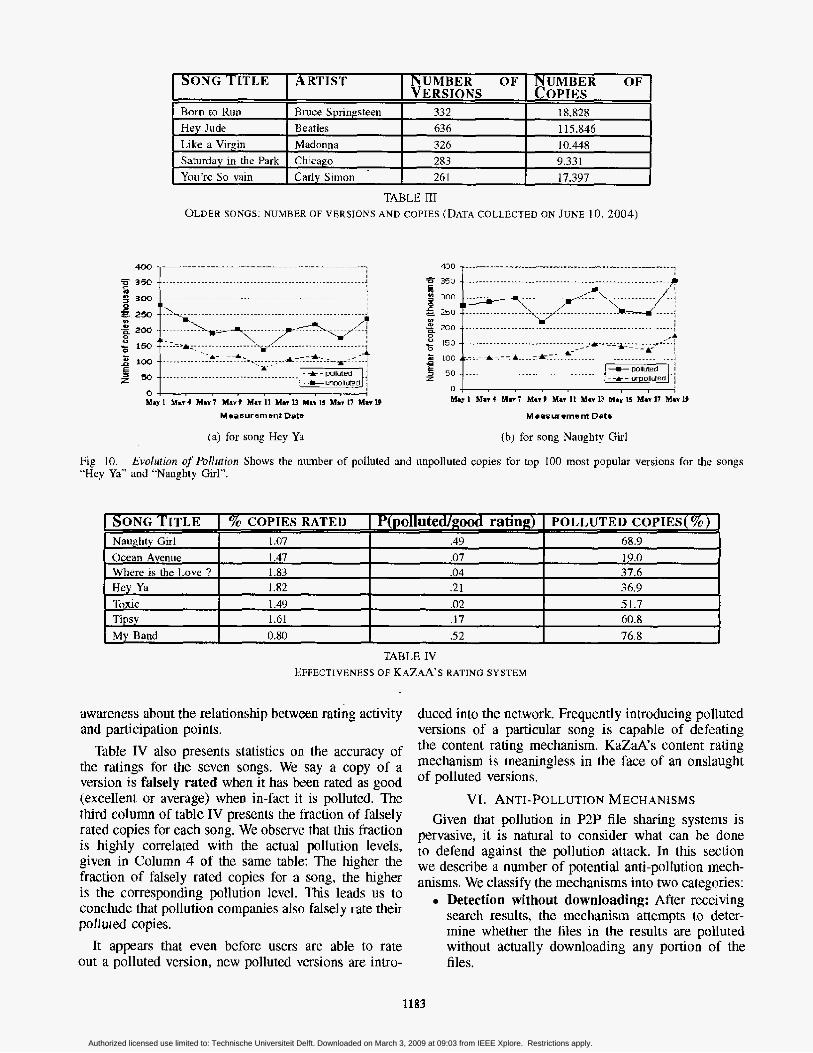
Fig. 9. older songs. Data collected on June 10, 2004.
Fraction of versions and copies found. bo be polluted for
the network, then it is only worthwhile to do so if the number of copies of these polluted versions is substantial. For this reason, the fraction of polluted copies in the top 100 versions typically exceeds the fraction of polluted versions in the top 500 versions.
To gain insight on what types of songs are highly polluted, we repeated the entire crawling experiment for five older songs (all of which were chart hits in the 70s). These five songs are listed in Table 111. From Table I11 we first observe that these formerly popular songs have relatively few versions and copies, a result which is not unexpected. From Figure 9, we see that the pollution levels for these songs are low, with three of the five songs having less than 2% polluted copies. The pollution levels of ”Born to Run” and ”Saturday in the Park” are somewhat higher, but still way below those of the currently popular songs. It is possible that most (or even all) of the pollution for these older songs is unintentional pollution.
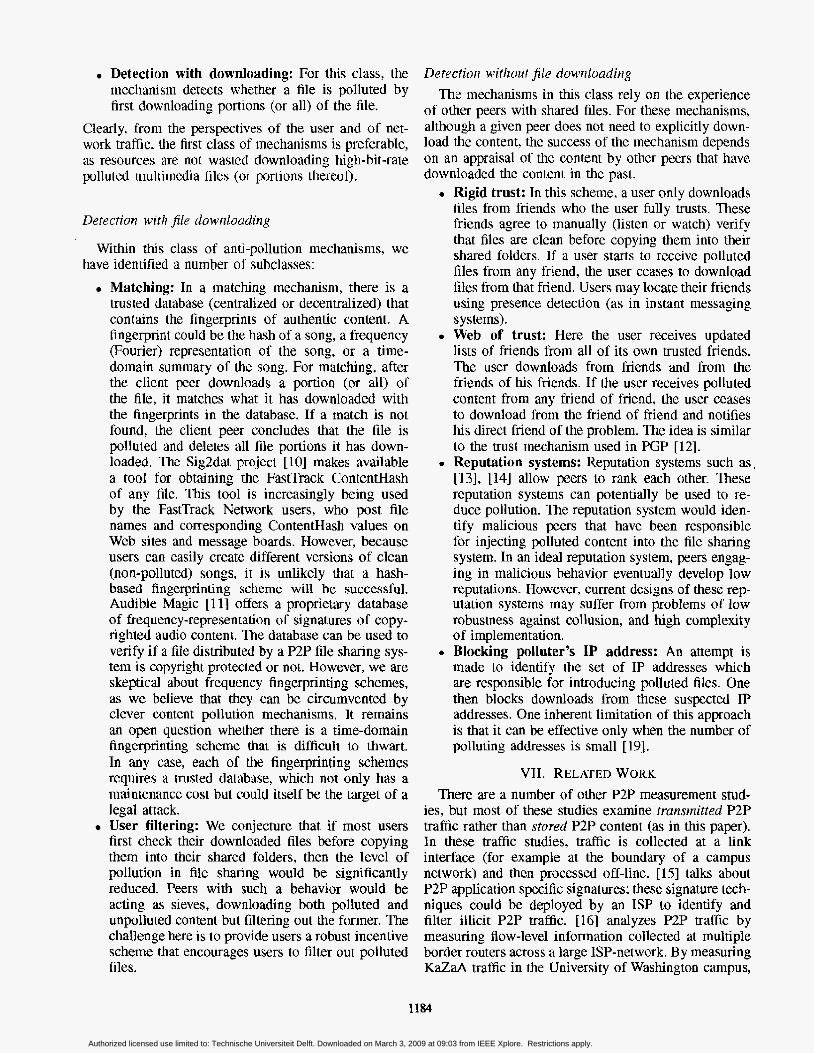
C, Evolution of Pollution We also studied the dynamics of content evolution,
which, to our knowledge, has not been explored pre- viously. Specifically, we tracked the total number of polluted and unpolluted copies available for the top 100 most popular versions of a given song over a period of 19 days. Due to space constraints, we present the results of this experiment for only two songs, “Hey Ya” and “Naughty Girl”. These results are shown in figure 10. We also performed a statistical analysis of this
evolution data and found that although the total number of copies available (polluted and unpolluted) is very dynamic, the percentage of polluted copies is slowly varying. The average change in percentage of polluted copies in consecutive measurements is 0.7% for “Hey Ya” and a slightly higher value of 2.5% for “Naughty Girl”. This can also be seen by observing that the shape of polluted copies curve closely follows the unpolluted copies curve, It suggests that the dynamics observed in the evolution of content are highly influenced by the change in the size of the network over the experiment duration.
D. Ratings and Pollulion The KMD client gives users the ability to rate the
integrity of the files that they are making available for sharing. Any file can be rated as:
Excellent: File has complete data and is of an
Average: File has some of the claimed data and is
Poor: Poor technical quality. Delete File: File may be virus infected or in general
excellent technical quality
of moderate technical quality.
should not be shared. When a user receives responses for a search for a file,
the user’s KMD client aggregates, for each discovered version, the ratings of all the copies found for that version into one single rating. For example, during a search, if three copies are discovered for some version, and the ratings for the three versions are excellent, poor and null (no rating), the KMD presents to the user the aggregation of these three scores.
For each of the seven recent songs studied in this paper, we recorded the rating for each discovered copy. Table IV provides a summary of our findings. We see from this table that a small percentage of copies are rated for each song. Although the KMD provides incentives for users to rate files by awarding users more participation points whenever a rated file is uploaded [9], the low percentage of rated files is surprising. ms is most likely due to (2) the popularity of the KaZaA-lite client, which provides users with maximum participation levels by default, and (ii) lack of user
1182
Authorized licensed use limited to: Technische Universiteit Delft. Downloaded on March 3, 2009 at 09:03 from IEEE Xplore. Restrictions apply.
400
SONG TITLE
Born to Run Hey Jude Like a VKxin Saturday in the Park You're So van
ARTIST NUMBER OF NUMBER OF
Bruce Spnngsteen 332 18.828 Beatles 63 6 115.846 Madonna 326 10.448 Chicago 283 9.331 Carly Smon 26 I 17.397
VERSIONS COPlES
. ~ ................ " .... ............. ~ ~ ....... 1 ..___ ..................................................... 1
Ocean Avenue Where is the Love ? Hey Ya Toxic Tipsy
Measursmant Datu Maasuromsnt Date
(a) for song Hey Ya (b) for song Naughty Girl
Fig 10. "Hey Y3"' and "Naughty Girl*'.
Evolurion of Pulludion Shows the number of polluted and unpolluted copies for top 100 most popular versions for the songs
1.41 .07 19.0 I .83 .04 37.6 1.82 .21 36.9 1.4Y .02 51.7 1.61 .17 60.8
I SONGTITLE I U COPIES RATED I P(p olIuted/good rating) I POLLUTED COPIES( %) J I
- I My Band I 0.80 I .52 I 76.8 I TABLE IV
EFFECTIVENESS OF KAZAA'S RATING SYSTEM
awareness about the relationship between rating activity and participation points.
Table IV also presents statistics on the accuracy of the ratings for the seven songs. We say a copy of a version is falsely rated when it has been rated as good (excellent or average) when in-fact it is polluted. The third column of table IV presents the fraction of falsely rated copies for each song. We observe that this fraction is highly correlated with the actual pollution levels, given in Column 4 of the same table: The higher the fraction of falsely rated copies for a song, the higher is the corresponding pollution level. This leads us to conclude that pollution companies also falsely rate their polIuted copies.
It appears that even before users are able to rate out a polluted version, new polluted versions are intro-
duced into the network. Frequently introducing polluted versions of a particular song is capable of defeating the content rating mechanism. KaZaA's content rating mechanism is meaningless in the face of an onslaught of polluted versions.
VI. ANTI-POLLUTION MECHANISMS Given that pollution in p2P file sharing systems is
pervasive, it is natural to consider what can be done to defend against the pollution attack, In this section we describe a number of potential anti-pollution mech- anisms. We classify the mechanisms into two categories:
Detection without downloading: After receiving search results, the mechanism attempts to deter- mine whether the files in the results are polluted without actually downloading any portion of the files.
1183
Authorized licensed use limited to: Technische Universiteit Delft. Downloaded on March 3, 2009 at 09:03 from IEEE Xplore. Restrictions apply.
Detection with downloading: For this class, the mechanism detects whether a file is polluted by first downloading portions (or all) of the file,
Clearly, from the perspectives of the user and of net- work traffic, the first class of mechanisms is preferable, as resources are not wasted downloading high-bit-rate polluted multimedia files (or portions thereof).
Detecrion wit11 $le downlocldirig
Withtn this class of anti-pollution mechanisms, we
Matching: In a matching mechanism, there is a trusted database (centralized or decentralized) that contains the fingerprints of authentic content. A fingerprint could be the hash of a song, a frequency (Fourier) representation of the song, or a time- domain summary of the song. For matching, after the client peer downloads a portion (or all) of the file, it matches what it has downloaded with the fingerprints in the database. If a match is not found, the client peer concludes that the file is polluted and deletes all file portions it has down- loaded. The Sig2dat project [ 101 makes available a tool for obtaining the FastTrack ContentHash of any file. Th~s tool is increasingly being used by the FastTrack Network users, who post file names and corresponding ContentHash values on Web sites and message boards. However, because users can easily create different versions of clean (non-polluted) songs, it is unlikely that a hash- based fingerprinting scheme will be successful. Audible Magic [l 11 offers a proprietary database of frequency-representation of signatures of copy- righted audio content. The database can be used to verify if a fiie distributed by a P2P file sharing sys- tem is copyright protected or not. However, we are skeptical about frequency fingerprinting schemes, as we believe that they can be circumvented by clever content pollution mechanisms, It remains an open question whether there is a time-domain fingerprinting scheme that is difficult to thwart. In any case, each of the fingerprinting schemes requires a trusted database, whch not only has a maintenance cost but could itself be the target of a legal attack. User filtering: We conjecture that if most users first check their downloaded files before copying them into their shared folders, then the level of pollution in file sharing would be significantly reduced. Peers with such a behavior would be acting as sieves, downloading both polluted and unpolluted content but filtering out the former. The challenge here is to provide users a robust incentive scheme that encourages users to filter out polluted files.
have identified a number of subclasses:
Detection williuut file downloading The mechanisms in this class rely on the experience
of other peers with shared files. For these mechanisms, although a given peer does not need to explicitly down- load the content, the success of the mechanism depends on an appraisal of the content by other peers that have downloaded the content in the past.
Rigid trust: In this scheme, a user only downloads files from friends who the user fully trusts. These friends agree to manually (listen or watch) verify that files are clean before copying them into their shared folders. If a user starts to receive polluted files from any friend, the user ceases to download files from that friend. Users may locate their friends using presence detection (as in instant messaging systems). Web of trust: Here the user receives updated lists of friends from all of its own trusted friends. The user downloads from friends and from the friends of his friends. If the user receives polluted content from any friend of friend, the user ceases to download from the friend of friend and notifies h s direct friend of the problem. The idea is similar to the trust mechanism used in PGP [12]. Reputation systems: Reputation systems such as [13], [14] allow peers to rank each other. These reputation systems can potentially be used to re- duce pollution. The reputation system would iden- tify malicious peers that have been responsible for injecting polluted content into the file sharing system. In an ideal reputation system, peers engag- ing in malicious behavior eventually develop low reputations. However, current designs of these rep- utation systems may suffer from problems of low robustness against collusion, and high complexity of implementation. Blocking polluter’s IP address: An attempt is made to identify the set of IP addresses which are responsible for introducing polluted files. One then blocks downloads from these suspected IP addresses. One inherent limitation of this approach is that it can be effective only when the number of polluting addresses is small [191.
VII. RELATED WORK There are a number of other P2P measurement stud-
ies, but most of these studies examine transmitted p2P traffic rather than stored P2P content (as in this paper). In these traffic studies, traffic is collected at a link interface (for example at the boundary of a campus network) and then processed off-line. [15] talks about P2P application specific signatures; these signature tech- niques could be deployed by an ISP to identify and filter illicit P2P traffic. [16] analyzes P2P traffic by measuring Aow-level information collected at multiple border routers across a large ISP-network. By measuring KaZaA traffic in the University of Washington campus,
1184
Authorized licensed use limited to: Technische Universiteit Delft. Downloaded on March 3, 2009 at 09:03 from IEEE Xplore. Restrictions apply.
[I] studies file-sharing workloads and develops models for multimedia workload.
A crawling system was previously developed for the Gnutella P2P network [6]+ Developing a crawl- ing system for the FastTrack Network is significantly more challenging for two reasons. First, the FastTrack Network is 10-100 times larger than Gnutella, both in terms of the number of peers and traffic. Second, and more importantly, the Gnutella protocol is in the public domain, whereas the FastTrack Network protocol is proprietary with little information available to the research community about how it operates. See also [17] for some additional work on crawling Gnutella and Napster.
There has been some recent measurement work on spread of spyware in networked systems. In 1181 the authors develop signatures for popular spyware and obtain traces of network activity within the University of Washington campus to quantify the spreading of these programs.
VIII. CONCLUSION
We examined the nature and extent of pollution in P2P file sharing. We found that popular contemporary songs can have a remarkably large number of different versions, as many as 50,000. There are also huge num- bers of copies of popular songs, often over 1 million. We found that pollution is indeed pervasive in file sharing, with more than 50% of the copies of many popuIar recent songs being polluted in the FastTrack Network today. Our results indicate that the vast majority of t l u s pollution is intentional. For older songs, pollution is less prevalent and may mostly consist of unintentional pollution. We have also tracked the evolution of copies in the FastTrack Network and have found that pollution levels remained roughly constant over a 19-day period. We also found that KaZaA‘s rating system is largely ineffective at identifying polluted copies, We identified and reviewed a number of potential anti-pollution mech-
REFERENCES [ l ] K.P. Gummadi. R J . Dunn. S. Saroiu. S D . Gribble. H.M. Levy
and J. Zahorjan. “Measurement. Modeling, and Analysis of a Peer-io-Peer File-Sharing Workload,” Proceedings of the 19th ACM Symposium on Operating Systems Principles (SQSP- 19). October 2003.
[2] ”From Discs ro Downloads.” Forrester Research. Inc. http://www.forrester.codnfo/O. 1503.353 .OO.html
[3] ‘%Americans Continire ru Eitrbrace Porential of Digicd Music,“ Tempo: Researching the Digital Landscape,http://www.ipsos- na.com/dsp-tempoxfm.
[4] E Oberholzer, K. Strumpf, “P2P’s Impact on Recorded Miisic Sales,“ Second Workshop on Economics of Peer-to-Peer Sys- tems. Cambridge, Massachusetts. June 2004
[5] J. Kurose, K.W. Rosst “Conputer Networking: A Top-Down Approach Featrrring the Internet,’’ Addison-Wesley. 2005.
[6] M. Ripeanu, I. Foster, and A. Iamnitchi, “Mapping [he Gnutella network: Properrim of large-scale peer-to-peer sysrerns and im- plications f u r sysfem design,” IEEE Intemet Computing Journal. vol. 6, no. 1. 2002.
[7] J . Liang. R. K m a r and K.W. Ross, “Understanding KuzaA.” submitted, 2004
[8] ’‘KuZaA Lire 2.10.” http://www.k-1ite.W [9] ‘‘Inreg n’ly Raring.” http: //www.kazaa.com/us/help/glossary/ratings.htm [IO] ‘5ig2dut tool for FastTrack nehvork.”
http://www.geocities.com/vlaibb/tools.html [ 1 11 ‘‘Audible Magic,” http://www.audiblemagic.com [ 121 I? Zimmerman. “Pgp:Source Code and Intemds.” MIT Press,
1995. I131 S.D. Kamvar, M.T. Schlosser and H. Garcia-Molina, ‘’T?ie
EigenTrusl Algorithm for R e p farion Management in P2P Nemorks,” Proceedings International WWW Conference, Bu- dapest, Hungary. 2003.
[ 141 D. Dutta. A. Goel, R- Govindan, and H. Zhang, “The Design of a Distributed R a h g Scheme for Peer-to-Peer Svsrems,” Workshop on Economics of Peer-to-Peer Systems, June 2003.
[15] S. Sen, 0. Spatcheck and D. Wang, “Accurare, Scalable In- Network Identijcarion of PZP Trafic Using Applicarion Signa- t um, ” Proceedings International WWW Conference, New York. USA.
[16] S . Sen and J . Wang, ‘Analyzing Peer-to-Peer Traflc Across Lclrge Nehvorks,” ACM/IEEE Transactions on Networkmg, Vol. 12, No. 2, April 2004.
[17] K.P. Gummadi, S . Saroiu and S.D. Gribble, “A Memure- m a l Study of Peer-to-Peer File Sharing Systems.” Proceed- ings of Multimedia Computing and Networking, January 2002 (MMCN’02), San Jose, CA, USA.
[ 181 S. Saroiu, S.D. Gribble and Henry M. Levy, “Measurement and Analysis of Spyware in n Universify Environment,” Proceedings of the First Symposium on Networked Systems Design and Implementation (NSDI ’04), San Francisco, California, March 2004.
anisms. [ 1 91 http://www. bluetack.co .uk/index.php We developed the FastTrack Network Crawling
Platform to obtain measurement data for this study. This crawler is of independent interest. Developing the crawler was challenging since the FastTrack Network uses a proprietary protocol with most of its signaling messages being encrypted. Also, a farm of server nodes, each running a large number of threads, was necessary to crawl the 20,000+ FastTrack Network’s supernodes in an acceptable mount of time. In future work we will further exploit the crawler to gain insight into IF’ and geographic information on the sources of content.
Acknowledgments: We thank Torsten Sue1 of Polytech- nic University for his comments and suggestions.
1185
Authorized licensed use limited to: Technische Universiteit Delft. Downloaded on March 3, 2009 at 09:03 from IEEE Xplore. Restrictions apply.