political report february 2011: aei's monthly poll compilation
TRANSCRIPT
8/7/2019 Political Report February 2011: AEI's Monthly Poll Compilation
http://slidepdf.com/reader/full/political-report-february-2011-aeis-monthly-poll-compilation 1/13
Volume 7, Issue 2 • February 2011A M O N T H L Y P O L L C O M P I L A T I O N
1150 Seventeenth Street, N.W., Washington, D.C. 20036 202 .862.5800 www.aei.org
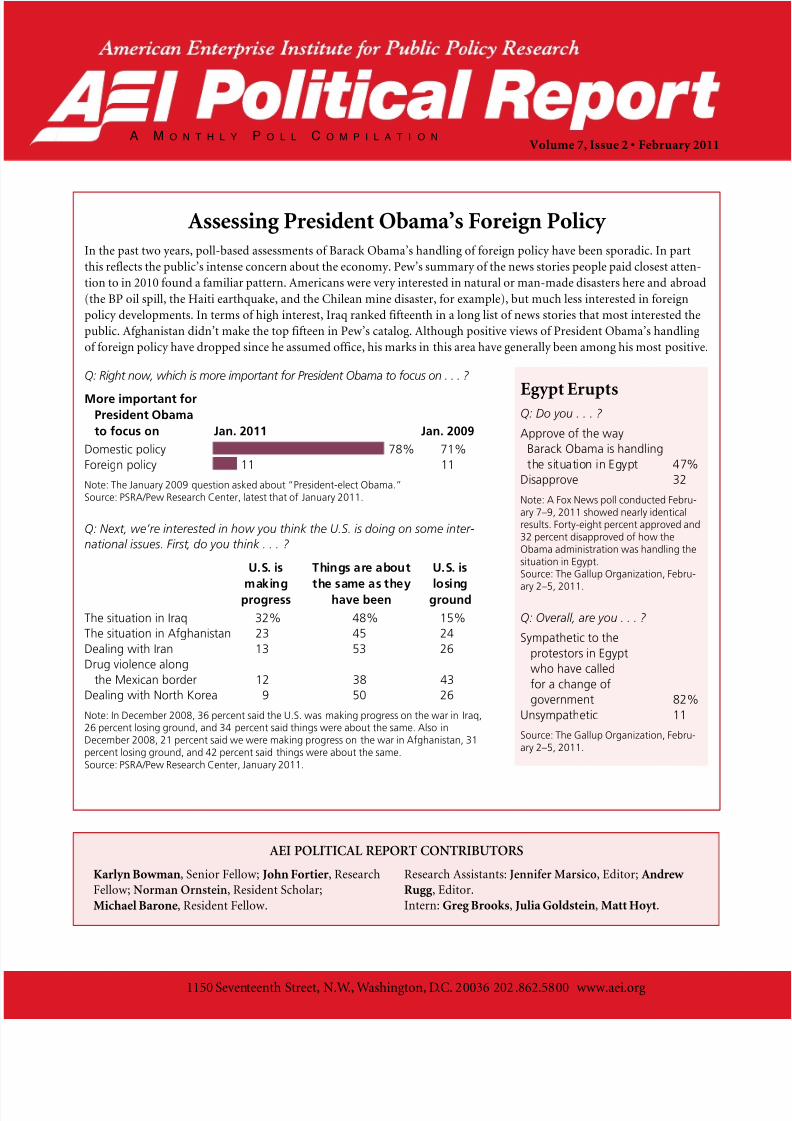
Assessing President Obama’s Foreign Policy In the past two years, poll-based assessments of Barack Obama’s handling of foreign policy have been sporadic. In part
this reflects the public’s intense concern about the economy. Pew’s summary of the news stories people paid closest atten-
tion to in 2010 found a familiar pattern. Americans were very interested in natural or man-made disasters here and abroad
(the BP oil spill, the Haiti earthquake, and the Chilean mine disaster, for example), but much less interested in foreign
policy developments. In terms of high interest, Iraq ranked fifteenth in a long list of news stories that most interested the
public. Afghanistan didn’t make the top fifteen in Pew’s catalog. Although positive views of President Obama’s handling
of foreign policy have dropped since he assumed office, his marks in this area have generally been among his most positive.
Q: Right now, which is more important for President Obama to focus on . . . ?
More important for
President Obama
to focus on Jan. 2011 Jan. 2009
Domestic policy 78% 71%
Foreign policy 11 11
Note: The January 2009 question asked about “President-elect Obama.”Source: PSRA/Pew Research Center, latest that of January 2011.
Q: Next, we’re interested in how you think the U.S. is doing on some inter-
national issues. First, do you think . . . ?
U.S. is Things are about U.S. is
making the same as they losingprogress have been ground
The situation in Iraq 32% 48% 15%
The situation in Afghanistan 23 45 24
Dealing with Iran 13 53 26
Drug violence along
the Mexican border 12 38 43
Dealing with North Korea 9 50 26
Note: In December 2008, 36 percent said the U.S. was making progress on the war in Iraq,26 percent losing ground, and 34 percent said things were about the same. Also inDecember 2008, 21 percent said we were making progress on the war in Afghanistan, 31percent losing ground, and 42 percent said things were about the same.Source: PSRA/Pew Research Center, January 2011.
Egypt EruptsQ: Do you . . . ?
Approve of the way
Barack Obama is handling
the situation in Egypt 47%
Disapprove 32
Note: A Fox News poll conducted Febru-ary 7–9, 2011 showed nearly identicalresults. Forty-eight percent approved and32 percent disapproved of how theObama administration was handling thesituation in Egypt.Source: The Gallup Organization, Febru-
ary 2–5, 2011.
Q: Overall, are you . . . ?
Sympathetic to the
protestors in Egypt
who have called
for a change of
government 82%
Unsympathetic 11
Source: The Gallup Organization, Febru-ary 2–5, 2011.
Karlyn Bowman, Senior Fellow; John Fortier, Research
Fellow; Norman Ornstein, Resident Scholar;
Michael Barone, Resident Fellow.
Research Assistants: Jennifer Marsico, Editor; Andrew
Rugg , Editor.
Intern: Greg Brooks, Julia Goldstein, Matt Hoyt.
AEI POLITICAL REPORT CONTRIBUTORS

8/7/2019 Political Report February 2011: AEI's Monthly Poll Compilation
http://slidepdf.com/reader/full/political-report-february-2011-aeis-monthly-poll-compilation 2/131150 Seventeenth Street, N.W., Washington, D.C. 20036 202 .862.5800 www.aei.org 2
Pollsters Map the President’s Foreign Policy
Obama’s handling of foreign policy
CNN/ORC CBS/NYT Quinnipiac Gallup
App/Dis App/Dis App/Dis App/DisInitial pollsFeb. 2009 - - 50% 15% - - 54% 22%Mar. 66% 28% - - - - 61 28Apr. - - - - 57% 32% - -
Recent pollsJan. 2010 51 46 49 38 - - 47 47Feb. - - 47 34 - - 51 44Mar. 51 44 - - - - 48 46Apr. - - - - 48 42 - -May - - 48 38 - - - -Jun. - - - - - - - -
July - - 44 41 43 46 - -Aug. - - - - - - 44 48Sept. - - - - 45 44 - -Oct. - - - - - - - -Nov. 49 46 46 37 46 44 45 49Dec. - - 40 45 - - - -Jan. 2011 57 40 46 32 47 38 - -Feb. - - - - - - 48 45
Obama’s handling of the situation in Afghanistan
CNN/ORC AP-GfK Quinnipiac Gallup
App/Dis App/Dis App/Dis App/Dis
Initial pollsFeb. 2009 - - - - - - - -Mar. 67% 29%* - - - - - -Apr. - - 60% 26% - - - -
Recent pollsJan. 2010 51 47 49 42 - - - -Feb. - - - - - - 48% 47%Mar. 55 42 57 32 52% 36% - -Apr. - - 51 38 49 39 - -May - - 49 39 45 40 - -Jun. - - 47 41 - - - -July 46 51 - - 43 46 - -
Aug. - - 44 43 - - 36 57Sept. 48 47 53 46 49 40 - -Oct. - - 52 47 - - - -Nov. - - 48 50 - - 44 49Dec. - - - - - - - -Jan. 2011 51 46 54 44 46 40 - -Feb. - - - - - - 47 46
Note: *March 2009 CNN/ORC poll asked of a half sample.
(continued on the next page)

8/7/2019 Political Report February 2011: AEI's Monthly Poll Compilation
http://slidepdf.com/reader/full/political-report-february-2011-aeis-monthly-poll-compilation 3/131150 Seventeenth Street, N.W., Washington, D.C. 20036 202 .862.5800 www.aei.org 3
Exporting Democracy Polls taken during George W. Bush’s presidency showed that Americans agreed with him that the world would be more stable
and safer if there were more democracies. But deep skepticism about our ability to promote democracy abroad remained. Trend
data show that Americans place democracy promotion at or close to the bottom of their foreign policy goals. The reasonappears to be that Americans are not confident that we know enough about how to do this or are uncertain about outcomes.
Q: Below is a list of possible
foreign policy goals that the
United States might have. For
each one please select whether
you think that it should be a
very important foreign policy
goal of the United States, a
somewhat important foreign
policy goal, or not an impor-
tant goal at all?
Note: Beginning in 2002, surveyswere conducted online. In 2010,helping to bring a democratic formof government to other nationsranked 19th of 19 issues the poll-sters inquired about.Source: Chicago Council on GlobalAffairs, latest that of June 2010.
Very Important
19%
Somewhat Important 55%
Not Important
26%
0%
10%
20%
30%
40%
50%
60%
70%
Jan-1974
Nov-1975
Sep-1977
Jul-1979
May-1981
Mar-1983
Jan-1985
Nov-1986
Sep-1988
Jul-1990
May-1992
Mar-1994
Jan-1996
Nov-1997
Sep-1999
Jul-2001
May-2003
Mar-2005
Jan-2007
Nov-2008
Sep-2010
Helping to bring a democratic form of government to other nations
(continued on the next page)
Obama’s handling of the situation in Iraq
CNN/ORC AP-GfKApp/Dis App/Dis
Initial polls
Feb. 2009 - - - -Mar. 63% 35%* - -Apr. - - 59% 27%
Recent pollsJan. 2010 53 43 49 39Feb. - - - -Mar. 51 46 55 33Apr. - - 49 41May - - 51 38Jun. - - 46 40July 49 49 - -Aug. - - 45 43Sept. 57 41 60 39
Oct. - - 56 43Nov. - - 54 45Dec. - - - -Jan. 2011 56 42 57 41
Note: *March 2009 CNN/ORC poll asked of a half sample.
(continued from the previous page)
War StoriesThe Pew Research Center conducts both a news
coverage and a news interest index. They reported
recently that during all of 2010, “just 1 percent of
news coverage was devoted to Iraq events and pol-
icy debates, and in no week did Iraq consume more
than 10 percent of the news hole.” Afghanistan
received 4 percent of all news coverage in 2010.
Pew asked about public interest in Iraq 10 times in
2010. Roughly a quarter of Americans said they
were following the story “very closely,” but only
about one in ten said it was the top story they were
following. As for Afghanistan, Pew inquired about
interest in it 18 times in 2010. Similarly, about a
quarter said they were following Afghanistan-related
news “very closely.” Like Iraq, Afghanistan was the
top story for fewer than one in ten Americans inthese Pew polls. Economic news was the top or sec-
ond most closely followed news story in 32 of the
45 weeks in which Pew measured attention to it.

8/7/2019 Political Report February 2011: AEI's Monthly Poll Compilation
http://slidepdf.com/reader/full/political-report-february-2011-aeis-monthly-poll-compilation 4/131150 Seventeenth Street, N.W., Washington, D.C. 20036 202 .862.5800 www.aei.org 4
Q: I’m going to read you some different things the president and Congress might try to do when it comes to helping
developing countries. As I read each one, tell me if you think it should be one of their top priorities for helping develop-
ing countries, important but not a top priority, or not that important. What about . . . ?
——————Helping developing countries——————Top Important but not Not that
Priority a top priority important
Improving education 53% 35% 11%
Helping out after natural disasters like
earthquakes and tsunamis 50 43 6
Reducing poverty 40 42 16
Promoting the rights of women 39 47 14
Improving health for people in developing countries 37 48 13
Protecting the environment and fighting climate change 37 37 25
Promoting democracy 27 46 24
Source: Kaiser, August 2010.
Q: Do you think the U.S. should or should not put greater pressure on countries in the Middle East, like Saudi Arabia
and Egypt, to become more democratic?
Should Should Not
2003 41% 53%
2004 35 57
2010 38 59
Source: Chicago Council on Global Affairs, latest that of June 2010.
Q: Which comes closest to your view? Some people believe that . . .
National Dems. Inds. Reps.
The US should always support democracyin the Middle East, even it means that the
newly democratic countries may elect
Islamist governments that do not support
our interests 32% 36% 25% 29%
The US should be cautious about supporting
democracy in the Middle East because it
is likely that the newly democratic countries
may elect Islamist governments that do not
support our interests 58 55 56 63
Source: Ipsos/Reuters, February 2011.
Q: How concerned are you . . . ?
Very/somewhat concerned that a new
government in Egypt could be unfriendly
or hostile to the United States 69%
Not very/not at all concerned 28
Source: CBS, February 2011.
(continued from the previous page)

8/7/2019 Political Report February 2011: AEI's Monthly Poll Compilation
http://slidepdf.com/reader/full/political-report-february-2011-aeis-monthly-poll-compilation 5/131150 Seventeenth Street, N.W., Washington, D.C. 20036 202 .862.5800 www.aei.org 5
Political RoundupVirtually every recent poll shows an uptick in positive ratings of President Obama and of Congress. Views of the parties
remain mixed. At this point, most Americans don’t know much about House Speaker John Boehner or Senate Minority
Leader Mitch McConnell personally, so we don’t report their ratings here. Nor do they have firm views about how they
are performing their jobs at this point. Initial reactions to them are more positive than negative. As for the economy,Americans see some green shoots but still believe it will be a long time before the economy fully recovers.
Q: Do you . . . ?
Feb. 2011 Low point in 2010/Fox
(Sept. 2010)
Approve of the job Barack Obama
is doing as president 51% 42%
Disapprove 43 52
Source: Anderson Robbins (D) and Shaw & Company (R) for Fox News, February 2011.
Q: Do you . . . ?
Feb. 2011 Low point in 2010/Fox
(Oct. 2010)*
Approve of the job Congress is doing 31% 17%
Disapprove 60 76
Note: *October 2010 asked of registered voters.Source: Anderson Robbins (D) and Shaw & Company (R) for Fox News, February 2011.
The Parties
Q: Next, we’d like to get your overall opinion of some people in the news. As I read each name, please say if you have a
favorable or unfavorable opinion of these people—or if you have never heard of them. How about . . . ?
The Republican Party The Democratic Party
Favorable opinion 47% 46%
Unfavorable 43 47
Source: Gallup, January 2011.
Q: Just in general, is your overall opinion of . . . ?
The Republican Party The Democratic Party
Favorable overall opinion 43% 47%
Unfavorable 48 46
Source: PSRA/Pew Research Center, February 2011.
Economic IndicatorsThomson Reuters/University of Michigan Index of Consumer Sentiment
February 2011* 75
February 2010 73
February 2009 56
Note: *Preliminary monthly finding.
(continued on the next page)

8/7/2019 Political Report February 2011: AEI's Monthly Poll Compilation
http://slidepdf.com/reader/full/political-report-february-2011-aeis-monthly-poll-compilation 6/131150 Seventeenth Street, N.W., Washington, D.C. 20036 202 .862.5800 www.aei.org 6
Q: Thinking about the condition of the national economy, do you think . . . ?
Feb. 2011 Feb. 2010
The worst is over 48% 37%
The worst is yet to come 48 56
Source: Anderson Robbins (D) and Shaw & Company (R) for Fox News, latest that of February 2011.
Q: Which of these best describes your opinion . . . ?
Feb. 2011 March 2010
The economy is recovering 24% 13%
The economy is not yet recovering but will recover soon 33 37
It will be a long time before the economy recovers 42 48
Source: PSRA/Pew Research Center, latest that of February 2011.
Q: Overall, which of the following best describes how the recession affected your own personal financial situation?
The recession . . .Had a major effect, and your finances have not recovered 36%
Had a major effect, but your finances have mostly recovered 25
It didn’t have a major effect 37
Source: PSRA/Pew Research Center, February 2011.
Regulating RegulationThe public opinion pendu-
lum on government regula-
tion swings back and forth,often in response to news
stories. In its immediate
aftermath of the 2008 finan-
cial crisis, Americans sup-
ported greater government
regulation. But the pendu-
lum has swung again, and
today people are more con-
cerned about too much reg-
ulation. President Obama’s
plan for a government-
wide review of regulation
appears to be in sync with
public opinion.
Q: In general, do you think
there is too much, too little,
or about the right amount
of government regulation
of business and industry?
Too much
49%
Right amount
21%Too little
27%
0%
10%
20%
30%
40%
50%
60%
Mar. 1981
Mar. 1983
Mar. 1985
Mar. 1987
Mar. 1989
Mar. 1991
Mar. 1993
Mar. 1995
Mar. 1997
Mar. 1999
Mar. 2001
Mar. 2003
Mar. 2005
Mar. 2007
Mar. 2009
Source: For 1981, the Los Angeles Times. For 1993–September 2008, August–September 2009, andSeptember 2010, The Gallup Organization. For December 2008 and 2009, CNN and the OpinionResearch Corporation.
Government regulation of business
(continued on the next page)
(continued from the previous page)

8/7/2019 Political Report February 2011: AEI's Monthly Poll Compilation
http://slidepdf.com/reader/full/political-report-february-2011-aeis-monthly-poll-compilation 7/131150 Seventeenth Street, N.W., Washington, D.C. 20036 202 .862.5800 www.aei.org 7
Q: What do you think is the bigger risk . . . ?
Bigger risk is that Obama will put Bigger risk is that McCain will not put
in place too many government regulations enough government regulations in place
40% 2008 45%
Bigger risk is that the Democrats will put Bigger risk is that the Republicans will not put
in place too many government regulations enough government regulations in place
52% 2010 35%
Note: Sample is likely voters.
Source: ABC/ Washington Post , October 2008 and October 2010.
Q: I’m going to read you some pairs of statements that will help us understand how you feel about a number of things.
As I read each pair, tell me whether the first statement or the second statement comes closer to you own views—even
if neither is exactly right. The first pair is . . . .
—–––––––––—-Government regulation of business—–––––––––—-
Is necessary to protect the public interest Usually does more harm than good50% 2008 (Oct.) 38%
47 2008 (Dec.) 43
46 2010 (Dec.) 49
Note: Question wording for the CAP survey was slightly different.Source: PSRA/Pew Research Center, latest that of December 2008; Hart Research Associates for the Center for American Progress (CAP), Decem-ber 2010.
Q: As I read a few statements some people have made about the federal government, please tell me if you . . .
Agree, government has gone too far in regulating business
and interfering with the free enterprise system 58%
Disagree 37
Source: PSRA/Pew Research Center, March 2010.
Q: Do you think there is . . . ?
Too much govern- About the Too
ment regulation right amount little
Of the stock market and
financial institutions
Sept. 2008 26% 21% 50%
Dec. 2008 22 18 59
Dec. 2009 29 23 45
Of business and industry
Sept. 2008 38% 19% 42%
Dec. 2008 39 20 39Dec. 2009 50 18 30
Source: CNN/Opinion Research Corporation, latest that of December 2009.
(continued from the previous page)
(continued on the next page)

8/7/2019 Political Report February 2011: AEI's Monthly Poll Compilation
http://slidepdf.com/reader/full/political-report-february-2011-aeis-monthly-poll-compilation 8/131150 Seventeenth Street, N.W., Washington, D.C. 20036 202 .862.5800 www.aei.org 8
What About Regulation of Specific Industries?In November 2010, Harris asked people whether 17 different industries should be more regulated by government. Thirty
percent said none of them should be. We show below only those industries for which 30 percent or more of those sur-
veyed said there should be more regulation. Fewer than 30 percent said there should be more regulation of airlines (27percent), life insurance companies (27 percent), car manufacturers (26 percent), hospitals (25 percent), packaged food
companies (24 percent), telephone/telecommunications companies (23 percent), online retailers (12 percent), computer
software companies (9 percent), and supermarkets (8 percent).
Q: Which of these industries do you think should be more regulated by government—for example for health, safety or
environmental reasons—than they are now?
2003 2004 2005 2006 2007 2008 2009 2010
Oil companies 52% 48% 55% 54% 53% 53% 47% 47%
Pharmaceutical and drug companies 57 55 51 48 53 49 47 46
Health insurance companies 59 56 46 48 52 49 45 42
Banks 21 20 19 17 20 36 40 34
Managed health care companies,such as HMOs 60 55 43 41 45 39 36 34
Tobacco companies 44 42 36 38 41 31 33 38
Electric and gas utilities - - 43 38 41 34 32 33
Note: Only industries that had a 2010 “more regulation” rating above 30 percent are shown.Source: Harris Interactive, latest that of November 2010.
Public Deliberation on the BudgetIn the mid-February CBS News poll, 31 percent approved of the way President Obama is handling the budget deficit and
58 percent disapproved. His marks on the deficit in this poll and others are among the lowest he receives. At the same
time, however, people are evenly split on whether they trust him or the Republicans in Congress more to make the right
decisions about reducing the deficit.
(continued from the previous page)
Q: In order to reduce the federal budget deficit, do you
think. . . ?
It will be necessary to cut programs that
benefit people like you to lower the deficit 49%
Will not 41
It will be necessary to increase taxes forpeople like you to lower the deficit 37%
Will not 59
Note: Thirty percent of those with household incomes of less than$50,000 said it would be necessary to increase taxes on people likethem to lower the deficit. Forty percent of those with incomes of$50,000 to 100,000 gave that response as did 62 percent of thosewith incomes higher than $100,000.
Source: CBS, February 2011.
Q: Who do you . . . ?
Trust President Obama more to
make the right decisions about
reducing the budget deficit 42%
Trust the Republicans in Congress more 42
Source: CBS, February 2011.

8/7/2019 Political Report February 2011: AEI's Monthly Poll Compilation
http://slidepdf.com/reader/full/political-report-february-2011-aeis-monthly-poll-compilation 9/13
1939
2010
1150 Seventeenth Street, N.W., Washington, D.C. 20036 202 .862.5800 www.aei.org 9
What Should Government Do?The question shown below is the first comprehensive question we have been able to find in the public opinion literature
on the subject. The 1939 survey, conducted by the Roper Organization for Fortune, inquires about sixteen possible gov-
ernment functions. Majorities supported only three. We haven’t been able to find contemporary questions like this. Most
simply ask whether we should spend more or less on various programs.
Q: People feel differently about how far a government should go. Here is a list of things which some people believe in
and some don’t. Let’s take them one at a time. Do you think . . . ?
————–—–—-1939——–—–———-
Government should Should not
Provide an army and navy 96% 2%
Provide for all people who have no other means of subsistence 69 23
Be responsible for seeing to it that everyone who wants to work has a job 61 32
Regulate all public utility rates like electricity, gas, etc. 49 39
Make all decisions in disputes between capital and labor 35 45
Redistribute wealth by heavy taxes on the rich 35 54
Establish a bureau to supervise what should be produced in moving pictures 32 51
Establish a bureau to supervise what should be produced over the radio 27 60Control the price of farm products by controlling production 23 62
Take over and operate all private, public, and parochial schools for children 20 72
Make every adult male spend at least two years in the army 18 76
Confiscate wealth over what people need to live on decently; use it for the public good 16 76
Establish a bureau to supervise what should be printed in newspapers and magazines 15 76
Take over and operate all private colleges and institutions of higher learning 14 75
Take over all the present family duties toward children 5 92
Supervise all religious observances by establishing a national church 4 92
Note: Interviewers were told to tell respondents that this question was about the federal government, not government in general.Source: The Roper Organization for Fortune, March 1939.
Q: Next, I’m going to read a list of functions the federal government could serve. On a 1 to 5 scale, please say how
much responsibility you think the government should have for each—with 1 meaning the government should have noresponsibility at all and 5 meaning the government should have total responsibility in this area. How about . . . ?
——––——––——-Sept. 2010—————––—–––
Government should . . .
. . . have more . . . less
responsibility responsibility
(Pts. 5,4) (3) (2,1)
Protecting Americans from foreign threats 93% 4% 2%
Protecting consumer against unsafe products 76 15 9
Preventing discrimination 66 19 14
Protecting the environment from human action that can harm it 65 20 15
Developing and maintaining the nation’s transportation systems 65 22 12
Making sure that all Americans have adequate health care 57 14 29Making sure that all those who want jobs have them 51 21 27
Providing a minimum standard of living for all 45 21 33
Upholding moral standards among its citizens 39 23 37
Reducing income differences between the rich and poor 34 20 44
Protecting major U.S. corporations that are in danger of
going out of business 19 24 56
Source: Gallup, September 2010.

8/7/2019 Political Report February 2011: AEI's Monthly Poll Compilation
http://slidepdf.com/reader/full/political-report-february-2011-aeis-monthly-poll-compilation 10/131150 Seventeenth Street, N.W., Washington, D.C. 20036 202 .862.5800 www.aei.org 10
Palin’s Popularity Sarah Palin’s favorability ratings have dropped since John McCain tapped her to be his vice-presidential running mate in
August 2008. In four January 2011 polls, half or more had unfavorable views of her. In a January 2011 CNN/Opinion
Research Corporation poll, she had a 70 percent favorable rating among Republicans. Of the 11 possible Republican candi-
dates they inquired about, only Mike Huckabee had a higher favorable rating (72 percent) among Republicans. TrailingPalin were Mitt Romney (64 percent favorable) and Newt Gingrich (59 percent). In a February 2011 poll, Fox News asked
Republicans about 14 potential candidates and whether each would make a good president. Forty percent said Palin would.
She trailed Mike Huckabee who led with 55 percent, Mitt Romney with 54 percent, and Newt Gingrich with 43 percent.
Q: Is your opinion of Sarah Palin favorable, not favorable, undecided, or haven’t you heard enough about Sarah Palin
yet to have an opinion? (CBS/ NYT)
Q: We’d like to get your overall opinion of some people in the news. As I read each name, please say if you have a
favorable or unfavorable opinion of these people or if you have never heard of them. Sarah Palin. (CNN/ORC;
Gallup/ USA Today)
Q: I’m going to read you the names of several public figures and I’d like you to rate your feelings toward each one as
either very positive, somewhat positive, neutral, somewhat negative, or very negative. If you don’t know the name,
please just say so. Sarah Palin. (NBC/ WSJ)
Latest Polls on Palin’s Favorability: January 2011Favorable Unfavorable Undecided
CBS/ NYT 19% 57% 19%
CNN/ORC 38 56 -
Gallup/ USA Today 38 53 -
Positive Negative Neutral
NBC/ WSJ 28% 50% 20%
CBS19%
CNN
NBC
27%
Gallup
38%
10%
20%
30%
40%
50%
60%
Aug. 2008
Oct. 2008
Dec. 2008
Mar. 2009
May 2009
Jul. 2009
Sep. 2009
Nov. 2009
Jan. 2010
Mar. 2010
May 2010
Jul. 2010
Sep. 2010
Nov. 2010
Jan. 2011
Palin’s Favorability

8/7/2019 Political Report February 2011: AEI's Monthly Poll Compilation
http://slidepdf.com/reader/full/political-report-february-2011-aeis-monthly-poll-compilation 11/131150 Seventeenth Street, N.W., Washington, D.C. 20036 202 .862.5800 www.aei.org 11
Tea Party TrendsWe look below at questions from survey organizations that started asking about the Tea Party movement in 2010 and have
also asked about it in 2011. The question wordings differ. Pew gives people the option of choosing the response “don’t you
have an opinion either way,” and many people choose it. Gallup allows people to respond “neither” a supporter nor oppo-
nent, and many choose it. NBC and the Wall Street Journal give people the option of selecting “neutral” as a response, andagain, many select it. When AP/GfK-Roper asks people whether they are supporters or not, six in ten or more say they are not.
Q: From what you know, do you strongly agree, agree, disagree, or strongly disagree with the Tea Party movement, or
don’t you have an opinion either way? (PSRA/Pew) Q: Do you consider yourself to be a supporter of the Tea Party
movement, an opponent of the Tea Party movement, or neither? (Gallup) Q: Now I’m going to read you the names of
several public figures and groups, and I’d like you to rate your feelings toward each one as very positive, somewhat
positive, neutral, somewhat negative, or very negative. (NBC/ WSJ) Q: Do you consider yourself a supporter of the Tea
Party movement, or are you not a supporter of the Tea Party movement? (AP/GfK-Roper) Q: Do you have a favorable or
unfavorable impression of the political movement known as the Tea Party? (ABC/ WP)
PSRA/Pew Gallup NBC/WSJ AP/GfK ABC/WP
Agree/Disagree Supporter/Not Pos/Neg Supporter/Not Fav/Unfav
Feb. 2010 - - - - - - - - 35% 40%Mar. 24% 14% - - 28% 26% 29% 28% 41 39
Apr. - - - - - - 31 60 - -
May 25 18 29% 28% 30 31 27 68 - -
Jun. 24 18 31 30 34 31 27 65 36 50
Jul. 22 18* - - - - - - - -
Aug. 29 26^ 30 27 30 34 28 69 38 45
Sep. - - - - 30 36 28 68 - -
Oct. 29 25+ 26 27 - - 30 37 - -
Nov. 27 22 32 30 - - 30 66 - -
Dec. 22 26 - - - - - - - -
Jan. 2011 24 22 30 25 28 21 31 61 35 52
Feb. 22 22 - - - - - - - -
Note: * Jul.–Aug. 2010, ̂ Aug.–Sept. 2010. + For Oct. 2010 and earlier, the PSRA/Pew responses shown here are based on responses to twoquestions. The first asked people how much they had heard about the Tea Party movement, and then those who had heard a lot or a littlewere asked whether they agreed with it or had no opinion either way.
Races to Watch in 2011In 2011, there will be four governor’s races. At this early stage, two appear in solid shape for the Republicans. Louisiana
governor Bobby Jindal is running for re-election, and there are no declared Democratic candidates at this time. Haley Barbour
is term-limited, but Mississippi is likely to elect another Republican. Our friend, election analyst Charlie Cook rates
Louisiana a solid R, and Mississippi a likely R.
Two other races, Kentucky and West Virginia , could be livelier. Much like the 2010 Senate race in Kentucky, the
Republican primary could be a face-off between the party establishment and a Tea Party-backed candidate. Kentucky
State Senate president David Williams has already announced that he will run, but so has businessman Phil Moffett, who
is more closely aligned with the Tea Party. However, unlike last year’s Senate open-seat contest, the winner of the Repub-
lican primary will face a popular Democratic incumbent, Steve Beshear, who was elected in 2007 by a 17-point margin.
West Virginia will have two elections for governor in as many years. The first is an October 2011 special election to
complete the remainder of Democrat Joe Manchin’s term (Manchin was elected to take the Senate seat of the late Robert
Byrd in 2010). The current acting governor, Democrat Earl Ray Tomblin, has said he will run. The 2012 election will then
allow the candidate who wins in 2011 to run for a full term if he so chooses.

8/7/2019 Political Report February 2011: AEI's Monthly Poll Compilation
http://slidepdf.com/reader/full/political-report-february-2011-aeis-monthly-poll-compilation 12/131150 Seventeenth Street, N.W., Washington, D.C. 20036 202 .862.5800 www.aei.org 12
New Age Technologies by AgeThe tables below look at how people use the Internet and what popular devices they own. With the exception of the GI
generation, between 90 and 100 percent of Internet users use e-mail. Using the Internet for searches is popular among 80
to 90 percent of Gen X-ers, but only 60 to 70 percent of the GI Generation. As for what devices people have, members of
the Millennial generation are more likely to have laptop than desktop computers. Cell phones are by far the most populardevice: around 85 percent of adults own one, including 95 percent of Millennials. Pew found earlier that 90 percent of
young adults who own a cell phone sleep with their cell phones on or have them right next to their beds. Eleven percent
of those polled by Pew had none of these devices.
Percent of Internet users in each generation who engage in these online activities
90–100% 80–90% 70–79% 60–69% 50–59%
Millennials Gen X Younger Boomers Older Boomers Silent Generation GI Generation
(18-34) (35–46) (47–56) (57–65) (66–74) (75+)
Email Email Email Email Email Email
Search Search Search Search Search Search
Health info Health info Health info Health info Health info Health info
Social network sites Get news Get news Get news Get news Buy a product
Watch video Govt website Govt website Govt website Travel reservations Get news
Get news Travel reservations Travel reservations Buy a product Buy a product Travel reservations
Note: Only top six response categories shown.Source: PSRA/Pew Research Center, April–May 2010.
Percent of American adults in each generation who own this device
Younger Older Silent GI
Millennials Gen X Boomers Boomers Generation Generation
(18–34) (35–46) (47–56) (57–65) (66–74) (75+)
Cell phone 95% 92% 86% 84% 68% 48%
Desktop 57 69 65 64 48 28
Laptop 70 61 49 43 30 10
iPod/MP3 player 74 56 42 26 16 3Game console 63 63 38 19 8 3
e-Book reader 5 5 7 3 6 2
Tablet, iPad 5 5 4 3 1 1
None 1 3 8 8 20 43
Source: PSRA/Pew Research Center, August–September 2010.

8/7/2019 Political Report February 2011: AEI's Monthly Poll Compilation
http://slidepdf.com/reader/full/political-report-february-2011-aeis-monthly-poll-compilation 13/13
Our Sputnik Moment, 1957In his State of the Union message, President Obama described the Sputnik launch, saying that “[W]e had no idea how we’d
beat them to the moon. The science wasn’t there yet. NASA didn’t even exist. But after investing in better research and edu-
cation, we didn’t just surpass the Soviets; we unleashed a wave of innovation that created new industries and millions of new
jobs. This is our generation’s Sputnik moment.” We return here to 1957 to look at public opinion. Feelings about Russiawere very negative, and Americans worried that the Eisenhower administration wasn’t doing enough to win the Cold War.
There was great suspicion of Russia’s intentions around the globe, and Americans wanted to spend more to prevent other
countries from going Communist. The answer to the Sputnik challenge, Americans said, was for us to work harder.
Source: The question about the Eisenhower administration was asked by the Opinion Research Corporation. All other questions were asked bythe Gallup Organization.
Q: How would you rate your feelings toward the follow-
ing countries . . . ?
Favorable feelings toward
Russia 3%
Neutral 15
Unfavorable 82
Q: Please tell me whether you think . . .
The Eisenhower administration
leaders are doing a very
good job winning the
Cold War with Russia 15%
Fairly good 42
Poor 28
In October 1957, when Gallup asked people how long it would be before “men in rockets
would reach the moon,” the median response was 20 years. Men were more skeptical thatthis would happen than women were. Older people were more doubtful than younger ones.
Q: What do you think is the most important problem . . . ?
Foreign policy, dealing with Russia is
the most important problem facing
this country today 40%
Q: During recent years, Congress has appropriated about
4 billion dollars each year for countries in other parts of
the world to help prevent their going communistic.
Should . . . ?
Congress should appropriate the
same amount to prevent countries
in other parts of the world to help
prevent their going communistic 58%
Should not 28
Note: In another question about foreign aid in general, 42 percentaid there should be a big cut, but 32 percent said there shouldn’t be.
Q: Why do you think Russia was able to launch the earth
satellite before the U.S. did?
Top response
Russia worked harder on it 24%
Note: No other response reached 10 percent.
Q: Some of our educators say that if we are to compete
with Russia, high school students in this country must be
required to work much harder than they do now. Do
you . . . ?
Agree, if we are to compete with Russia,
high school students must be required to
work much harder than they do now 71%
Disagree 17
Q: Do you think . . . ?
Young people in this country get more physical
exercise than the young people of Russia 31%
Do not 44