political determinants of competition in the mobile telecommunication … · 2018-10-29 ·...
TRANSCRIPT

Political Determinants of Competition in the Mobile Telecommunication Industry
Mara Faccio Purdue University, University of Chicago, ABFER & ECGI
and
Luigi Zingales
University of Chicago, NBER & CEPR
January 2017
New Working Paper Series No. 4
Stigler Center for the Study of the Economy and the State University of Chicago Booth School of Business
5807 S Woodlawn Ave Chicago, IL 60637

POLITICAL DETERMINANTS OF COMPETITION
IN THE MOBILE TELECOMMUNICATION INDUSTRY
Mara Faccio
Purdue University, University of Chicago, ABFER & ECGI
and
Luigi Zingales*
University of Chicago, NBER & CEPR
This Version: January 2017 First Version: June 2016
Abstract
We study how political factors shape competition in the mobile telecommunication sector. We show that the way a government designs the rules of the game has an impact on concentration, competition, and prices. Pro-competition regulation reduces prices, but does not hurt quality of services or investments. More democratic governments tend to design more competitive rules, while more politically connected operators are able to distort the rules in their favor, restricting competition. Government intervention has large redistributive effects: U.S. consumers would gain $65bn a year if U.S. mobile service prices were in line with German ones and $44bn if they were in line with Danish ones.
* We gratefully acknowledge financial support from the Stigler Center at the University of Chicago Booth School of Business. We also thank Sara Bagagli and Andrea Hamaui for their excellent research assistance, as well as Deniz Yavuz, and several participants at seminars at Emory University, Purdue University, the 2016 Global Corporate Governance Colloquia in Stockholm, Tsinghua University, the University of Michigan, the University of Chicago, Wayne State University, and at the 2016 Dawn or Doom Conference at Purdue University for comments. We thank John Fassnacht and Samodya Abeysiriwardane for developing the C# parsing program that was used to identify political connections. We also thank DotEcon for sharing their spectrum auction data. Luigi Zingales was an independent board member of Telecom Italia from April 2007 to April 2014.

1
In 2014 Mexican telecom tycoon Carlos Slim was the richest person in the world with an
estimated wealth of US$79.6 billion. By 2016 Slim had dropped to fourth place in the Forbes
rankings, with his wealth down to only US$47.1 billion, at least in part because the “shares of his
pan-Latin American mobile phone operator, America Movil, took a beating in 2015 and early
2016 in the wake of new Mexican telecom regulations.”1
In 2012, an OECD study found that in Mexico “insufficient competition has resulted in
poor market penetration” and produced a welfare loss of $129.2 billion during the 2005-2009
period. While heavily contested by Hausman and Rios (2013), these conclusions informed a
telecommunication reform, which tried to promote competition. Between 2012 and 2016, the
average revenue per user (ARPU) in Mexico dropped by 47% and traffic increased by 59%.2 At
the same time, Carlos Slim’s wealth dropped by more than $30 bn.
This episode raises several important questions. Is this association between new rules to
promote competition and Slim’s wealth just a coincidence? Can government intervention make
markets more competitive? If it can, why aren’t all governments promoting competition? Why
does the price of the same basket of mobile phone services vary around the world from $10.07 to
$47.25? Why does the price of a 1GB mobile-broadband internet plan vary from $11.24 to
$100.28?3
These questions are not limited to the mobile phone industry. Yet, in this paper we try to
address them in the context of this industry for several reasons. First, the mobile communication
industry is one of the most (if not the most) nationally segmented industries. In every country,
including tiny ones like Andorra and Lichtenstein, national governments have the power to shape
the competitive landscape by defining property rights (number portability), allowing the use of
the Voice over Internet Protocol (VoIP, i.e., phone services over the Internet), and restricting
foreign entry or ownership. Not only is the mobile communication industry highly regulated at
the national level in every country, but it is also heavily dependent upon a scarce resource
controlled by the government: the electromagnetic spectrum used to transmit. Thus, if there is a
1 http://www.forbes.com/profile/carlos-slim-helu/?list=billionaires 2 Based on data from © GSMA Intelligence (2015). 3 These prices correspond respectively to the 5th percentile and the 95th percentile of the distribution of purchasing-power adjusted prices for 2015. The data come from International Telecommunication Union (ITU).

2
sector where the government can affect the degree of competition, the mobile communication
industry is one.
The second reason is the technology underlying this industry is fairly similar across the
world and less affected than most by access to energy, water, or pre-existing conditions.
Nevertheless, we show that the price variability across countries is larger than that normally
observed for other goods and services.
Last but not least, the presence of national and international regulators favors the
availability of data. The International Telecommunication Union (ITU), a U.N. specialized
agency for Information and Communication Technologies, provides cross-country data on prices
and quality of telecommunications; Groupe Speciale Mobile Association (GSMA), an
association of operators and companies in the broader mobile sector, collects data on margins
and concentration.
Therefore, in this paper we study how in the mobile communication industry the
government power to set the rules of the game is used around the world and in whose interest it
is used. Employing ITU and GSMA data in 148 countries, we show that a government’s pro-
competitive policy –from number portability to VoIP– has a significant effect in reducing
concentration and prices. For example, on average, number portability reduces the market share
of the two largest operators in a given country by 4 percentage points, reduces the price of a
mobile-broadband internet plan with a 1GB volume of data by US$10 per month, and reduces
the operators’ EBIDTA margin by 4 percentage points. Israel, whose regulation went from a pro-
competitive (overall) regulatory score of 17.5 in 2010 to one of 52 in 2012, saw the average
revenues per user (ARPU) drop by 33% and the local operators’ EBITDA margin drop by 10
percentage points.4
One hypothesis –often encountered in the lobbying material of the mobile operators– is
that excessive competition reduces not only prices but also the capacity of the industry to invest
in technology. According to this hypothesis, reduced competition enforcement is a policy
variable to obtain more investment and higher quality of service in the mobile sector. In other
words, regulations that restrict competition could reduce market failures by ensuring that
operators provide the socially desirable quality of service and investment (Pigou, 1932). We test
4 Based on data from © GSMA Intelligence (2015).

3
this hypothesis and we find no evidence that a higher degree of competition leads to lower
quality of service or less investments. If anything, the results go in the opposite direction. A
higher degree of competition is also correlated with lower wages, but the effect is not statistically
significant at conventional levels.
A second hypothesis is that governments want to restrict competition so as to maximize
the revenues they raise in spectrum auctions. We test this hypothesis and we find the opposite to
be true: countries with more pro-competition rules raise relatively more money in auctions. The
reason is pretty simple: auctions do not work well with limited numbers of bidders. Pro-
competition regulation reduces concentration and thus allows auctions to raise more funds.
A variation of the above argument is that governments do not want to promote full
competition because they can raise more revenues by taxing monopoly (or oligopoly) profits. If
this motivation was important, it would more likely play a role in countries where it is difficult to
raise other forms of taxes (because of bad administration or tax evasion) or where profits are
taxed more than consumption. We find no evidence in support of any of these implications.
A final alternative is that regulation is the outcome of the pressure of multiple
constituencies (Peltzman, 1976). On the one hand, the operators want to restrict competition to
make more profits. Operators may be able to capture the regulator to extract rents for themselves.
According to this view, by restricting competition and increasing profits, regulations serve the
interest of operators (Tullock, 1967, and Stigler, 1971). On the other hand, consumers want
lower prices. Consistent with this hypothesis, we find that governments tend to favor competition
more in more democratic countries, where citizens’ preferences are likely to carry more weight.
By contrast, we find that rules appear to be tilted more in favor of producers when these
producers are more politically connected.5
Thus far, we only looked at regulatory measures that are easily quantifiable and have
been codified by ITU. In more advanced countries (like the United States), a major role in
5 Existing research has documented various channels through which political connections affect firm value. Those include evidence of preferred access to credit in normal situations and in times of financial distress (Faccio, Masulis and McConnell, 2005, Houston et al., 2014, Khwaja and Mian, 2005); the award of government contracts and licenses (Goldman, Rocholl, and So, 2013, Beckman, 1999, Faccio and Hsu, 2016, Bunkanwanicha and Wiwattanakantang, 2009); and leniency in enforcement (Fulmer, and Knill, 2012; Yu and Yu, 2011). A salient aspect that has not been considered in depth is the impact of political connections on competitive outcomes.

4
shaping competition and prices is played by the Antitrust. Unfortunately, it is more difficult to
codify the level of antitrust activism and use it in empirical analysis. Therefore, we resort to a
mini-case study of countries at very similar levels of economic development and income per
capita, but different levels of antitrust activism. To this end we exploit the Atlantic divide
between the United States and Europe. As shown by the EU antitrust case against Google, the
European Antitrust Authority is more pro-active than its U.S. counterpart. Thus, we compare the
level of prices and quality between the U.S. and the two EU countries with levels of regulation
closest to the United States (76.5): Denmark (76) and Germany (78.5).
The United States exhibits much higher average revenues per unique subscriber ($67.6 vs
$31.01 in Denmark and $23.28 in Germany)6 and a higher price for a standard basket of mobile
phone calls and SMS messages: $35.62 vs $7.50 in Denmark and $17.47 in Germany. If U.S.
consumers could enjoy the Danish (German) level of competition they would gain respectively
$44bn ($65bn) a year. Yet, unlike the case of pro-competition rules, we do find that higher prices
in the United States are associated with better quality. In 2013, in the United States, 4G
connections represented 23.1% of the total and 4G coverage was 95.1%. In Denmark, 4G
connections represented 9.31% of the total and 4G coverage was 92.37%. In Germany, 4G
connections represented 2.7% of the total and 4G coverage was 64.54%. Thus not all of the
computed difference represents a pure transfer: part of it might be a compensation for more
investments.
To check the extent to which higher prices represent a pure transfer we look at the market
capitalization of U.S. operators. Lindenberg and Ross (1981) associate the difference between
the market value of assets and the book value of assets to the abnormal profits a firm can earn as
a result of some stable market power position. We can apply this logic to the four major U.S.
carriers (AT&T, Verizon, T-Mobile, and Sprint) to check whether any part of the transfer is
capitalized in the market valuations. If all the $44bn ($65bn) difference went to shareholders, it
could explain the entire difference between market and book value of the industry with discount
rates between 8.6% and 14.6%. While this is certainly not proof that the entire amount of the tax
imposed on consumers through higher prices is transferred to shareholders, it is certainly
consistent with this hypothesis.
6 Based on data from © GSMA Intelligence (2015).

5
The rest of the paper proceeds as follows. Section 1 presents the data used. Section 2
describes the uniqueness of the mobile communication industry and the abnormal price
variability across countries. Section 3 analyzes how regulatory choices affect concentration,
competition, and prices. Section 4 investigates whether regulatory choices affect the quality of
service, investments, and wages. Section 5 investigates the various hypotheses that could explain
why some countries make regulatory choices that do not foster competition. Section 6 attempts
to estimate the welfare transfer produced by lower competition in the United States. Section 7
concludes.
1. The Data
In this section we present the various datasets used in this study. We restrict our analysis
to countries covered in both the ITU and the GSMA databases. Further, we exclude territories. In
unreported tests, we verify and confirm that our conclusions are robust to including each and
every country or territory with available data.
1.1. Regulatory Data
The regulatory data come from the International Telecommunication Union’s (ITU) ICT
Regulatory Tracker. ITU is the U.N. specialized agency for Information and Communication
Technologies. It relies directly on statistics and information provided by national
telecommunication agencies. The ICT Regulatory Tracker covers various aspects of policy and
regulation in the telecommunication sector in 157 countries and territories (150 countries) for a
period of 11 years, starting in 2003. The regulatory data were collected annually through the
“World Telecommunication/ICT Regulatory Survey”7 and through information gathered by the
ITU via internal research. Data were collected, validated, and harmonized by the ITU, and then
published.
The ICT Regulatory Tracker covers 50 indicators that reflect the answers to the questions
in the regulatory survey. Each answer is codified on a 0 to 2 scale where 0 is given to the most
anticompetitive regulation and 2 to the most competitive one. For example, if a country does not
7 The survey can be retrieved at http://www.itu.int/en/ITU-D/RegulatoryMarket/Documents/ITU_Telecommunication-Regulatory-Survey-2016_E.pdf.

6
require mobile number portability the answer is coded as zero, if a country requires it but it is not
necessarily available to all subscribers, the answer is coded as one. If a country requires it and it
is available to all subscribers, the answer is coded as two.
These indicators need to be interpreted broadly, since the questions in the survey include
the way property rights are allocated (e.g., number portability and auctions), the openness to
foreign competition, the independence of the telecom regulator, and even the degree of
competition. Some of these measures regard the telecommunication industry as a whole, not just
the mobile sector.
The ITU presents an overall regulatory score, which corresponds to the sum of the 50
indicators. We subtract from the overall regulatory score the scores of the answers to questions
37 through 42. We do so because those questions reflect competitive outcomes, rather than
regulatory variables, and/or deal with the (public) ownership of the main fixed line operator. The
variables’ definitions are summarized in Table 1, while the summary statistics are provided in
Table 2.
Following ITU we group the sub-scores into 4 clusters. Cluster 1, which pertains to the
independence of the regulator, includes the answers to questions concerning the existence,
independence, and accountability of the regulator (questions 1-10). Cluster 2 pertains to the
power of the regulator (vs. the power of the government and/or the operators) (questions 11-21).
Cluster 3, which pertains to the economies of scale, includes the answers to questions concerning
the ease of entry in the sector, i.e., regulations that enable the sharing of fixed costs (questions
22-36). Cluster 4, which pertains to foreign competition, includes the answers to questions
concerning whether foreign ownership in facilities-based operators, spectrum-based operators,
local service operators/long-distance service operators, international service operators, internet
service providers, and value-added service providers is allowed (restricted, or forbidden), as well
as two questions concerning the existence of a concept of market dominance and the criteria used
to establish market dominance (questions 43-50). As with the overall regulatory score, the
answers to questions 37 through 42 are ignored when constructing the index for Cluster 4.
Finally, we also compute a Regulatory Score of the Mobile Sector by summing the scores
given to the answers to four questions that are very specific to the mobile sector: (1) whether
mobile number portability is required and available to mobile subscribers, (2) whether users are
allowed to make voice over internet protocol (VoIP) or phone calls through the internet, (3)
7
whether secondary trading of the spectrum is allowed, and (4) whether foreign participation or
ownership in spectrum-based operators is allowed, limited, or forbidden (questions 34, 35, 31,
and 46, respectively).
1.2. Measures of Competition
Data on competition come from Groupe Speciale Mobile Association (GSMA) and ITU.
GSMA is an association of nearly 800 operators and more than 250 companies in the broader
mobile sector. It provides extensive global mobile data for 237 countries and territories: data
cover every mobile operator group, network, and mobile virtual network operator in every
country worldwide. Data are updated daily. The type of information available comprises: prices
of services, operators’ financial data, data traffic, and market data (e.g., market penetration rates,
number of unique subscribers, etc.). GSMA has data available starting in 2000.
©GSMA Intelligence (2015) computes each operator’s market share as “[t]otal
connections at the end of the period, expressed as a percentage share of the total market
connections.” We use this measure to compute (1) C2, the sum of the market shares of the two
largest operators in a given country and quarter,8 and (2) the Herfindahl-Hirschman Index, the
sum of the squared market share across all operators in a given country and quarter. The
Herfindahl-Hirschman Index ranges from 0 to 10,000, where 10,000 denotes a monopoly.
Additionally, the ITU’s ICT Regulatory Tracker reports a classification of the overall
level of competition (i.e., “monopoly,” “partial competition,” or “full competition”) in (i) the
local and long distance fixed line services, (ii) IMT (3G, 4G, etc.) services, (iii) cable modem,
DSL, fixed wireless broadband, (iv) leased lines, and (v) international gateways (questions 37-41
in the ICT Regulatory Tracker). We add up the answers to those 5 questions to construct a
qualitative measure of competition.
1.3. Data on Mobile Phone Prices and Margins
Data on mobile phone prices come from multiple sources. In the main analyses we rely
on data from ITU and ©GSMA Intelligence (2015). The ITU data are collected through an
annual questionnaire addressed to the government agencies responsible for
8 We do not use the perhaps more popular C4, the sum of the market share of the four largest operators, because the mobile phone industry is highly concentrated and C4 has a mean of 96%.

8
telecommunication/ICT industry. Price data that should be submitted refers to those offered by
the largest national operator in terms of market share. A strict set of rules is provided in order to
improve the accuracy and the degree of homogeneity in cross-country comparisons. When there
are missing values (especially for countries that do not reply to the questionnaire), the ITU
collects the information from government agencies’ websites and from the operators’ annual
reports.
From ITU we employ (1) the price of a mobile cellular standard basket consisting of a
“monthly usage for 30 outgoing calls per month (on-net, off-net to a fixed line, and for peak and
off-peak times) in predetermined ratios, plus 100 SMS messages” and (2) the price of “a mobile-
broadband USB/dongle-based postpaid tariffs with 1GB volume of data.” These prices are from
the ITU’s “Measuring the Information Society” annual reports. The first price bundle is
available since 2008. However, due to a change in the composition of the basked implemented
by ITU in 2010, to ensure consistency and comparability we only use data for the 5-year period
2010-2014. The second price bundle is available starting in 2012. A benefit of these price
bundles is that they allow comparing similar baskets of mobile services.
The second source for mobile data prices is GSMA. From this source we gather
operators’ financial data. We focus on two metrics: (1) ARPU (average revenue per user) is the
“[t]otal recurring (service) revenue generated per connection per month in the period. Despite the
acronym, the metric is strictly average revenue per connection, not per subscriber” and (2) the
EBITDA margin, defined as the “[t]otal operating profit in the period, before interest, tax,
depreciation and amortisation, expressed as a percentage of total revenue.” Note that these two
metrics only reflect the revenues and costs for the mobile phone segment; additionally, for
multinational operators the data are reported separately for each country. The GSMA data are
available starting in 2000. These measures reflect the actual demand of mobile services (i.e., they
allow for the number of minutes of calls, number of SMS etc. to vary across countries depending
on actual usage).
To compare the international variability of mobile prices with that of other goods and
services we use Numbeo. 9 With 2,687,888 prices in 5,846 cities, entered by 307,465
contributors, Numbeo claims to be the world’s largest database of user contributed data about
9 http://www.numbeo.com

9
cities and countries worldwide. Data collection relies on users’ inputs and manually collected
data from different sources, like websites of supermarkets, governmental institutions,
newspapers articles, surveys, taxi company websites, etc. In order to control for noise, Numbeo
removes outlier prices observed within a certain area and at a point in time. Numbeo reports
prices for dozens of commodities and services. Two prices that are relevant for our study are (1)
the “Price of 1 min. of Prepaid Mobile Tariff Local (No Discounts or Plans),” and (2) the “Price
of Internet (10 Mbps, Unlimited Data, Cable/ADSL).”
1.4. Quality of Service and Other Outcomes
To measure the quality of the mobile service, we use the percentage of total connections
that are 3G and 4G, as well as the percentage of the total market geographic surface area that is,
at the end of the period, covered with 3G and 4G services. These data come from GSMA. We
supplement them with data on the advertised maximum theoretical download speed, in Mbit/s,
associated with a 1GB USB/dongle-based mobile broadband prepaid plan, as reported in the
ITU’s “World Telecommunication/ICT Indicators Database,” 19th edition, 2015.
From GSMA we also collect data on a number of additional outcomes such as (1) the
“total capital expenditure incurred in the period, including both intangible and tangible assets”,
scaled by the “[t]otal revenue generated in the period, including both recurring (service) and
nonrecurring revenue”; (2) the average number of “[t]otal deployed, and active, base stations on
the network at the end of the period,” scaled by revenues; (3) the number of “[t]otal employed
head count (fulltime equivalent) for the telecoms business at the end of the period, and if
applicable, only within mobile operations,” scaled by revenues; and (4) “[o]perating expenditure
incurred in the period related to the cost of employees, including salary costs,” also scaled by
revenues.
1.5. Auction Data
Spectrum auction data are from DotEcon Ltd, a U.K.-based consulting firm founded and
owned by two former academic economists.10 As of October 18, 2016, The Spectrum Awards
Database assembled by DotEcon covered information on 15,186 licenses from 414 spectrum
awards in 96 countries and territories. Those awards cover the frequency bands between
10 http://www.dotecon.com/
10
300MHz to 300GHz, which include the bands used for mobile telephones (e.g., 2G, 3G, and 4G
services) as well as fixed and broadband wireless access. The database includes information on
the date, type (e.g., auction, beauty contest, etc.) and duration of each license; the license price(s)
in local currency; the spectrum endowment; the names of the license winner(s); a number of
details about the award processes; as well as demographic and economic indicators.
The very first spectrum auction was held by the U.S. Federal Communications
Commission (FCC) in 1994.11 Not surprisingly, “Auction 1 - Nationwide Narrowband (PCS)” is
also the first auction included in the DotEcon database. Based on the information provided in the
DotEcon database we estimate that, globally, governments raised over $800bn from the spectrum
auctions held through the end of 2014.
To compare the revenues raised by governments we rely on the license prices in local
currency as provided by DotEcon. We convert those prices into U.S. dollars using the average
exchange rate for the quarter (or year, if prior to 2000) in which the auction was held. We
assume that a given government raised no revenues from auctions if DotEcon does not report any
spectrum auctions in that given country. Exchange rates for each quarter during 2000-2015 are
from GSMA. Average exchange rates for the years prior to 2000 are from the World Bank’s
“World Development Indicators” and Datastream.
For each country we determine the total revenues (in U.S. dollars) raised from all
spectrum auctions covered in DotEcon through December 2014 (the last year for which we have
data on telecom prices data from ITU). We alternatively consider the total revenues raised since
1999 (when the first 3G auction was held) and since 2011 (when the first 4G auction was held).12
1.6. Institutional Variables
As a measure of democracy we use an additive eleven-point scale (0-10) index from
Polity IV. It captures the presence of institutions and procedures through which citizens can
11 In the U.S., prior to 1982, the FCC used comparative hearings to allocate spectrum licenses. Lotteries were used between 1982 and 1993. 12 We exclude spectrum actions whose only use is Fixed Wireless Access (FWA). Note that while DotEcon attempts to provide comprehensive coverage of spectrum auctions, it does not cover the revenues raised by governments through other allocation mechanisms, such as lotteries, comparative hearings, or private negotiations. While we are unaware of any database that provides comprehensive coverage of those other allocation mechanisms, the data on capital expenditures from GSMA (which includes tangible and intangible capital expenditures) should reflect those (and other) intangible capital expenditures.

11
express effective preferences about alternative policies and leaders, the existence of
institutionalized constraints on the exercise of power by the executive, and the guarantee of civil
liberties to all citizens in their daily lives and in acts of political participation.
As a second, alternative measure of democracy, we use constraints on the executive. This
Polity IV variable refers to the extent of institutionalized constraints on the decision-making
powers of chief executives, whether individuals or collectivities. Such limitations may be
imposed by any “accountability groups” –in Western democracies these are usually legislatures.
Finally, Polity IV’s political competition refers to the extent to which alternative preferences for
policy and leadership can be pursued in the political arena.
From the World Economic Forum (WEF) we gather data on the prevalence of tax evasion
in each country (in 2002). The WEF’s index is based on surveys of corporate executives’
assessments concerning the prevalence of tax evasion in their home countries. We gather data on
the corporate income tax rate and on the value added tax rates applicable to mobile operators
from Deloitte’s “Global Mobile Tax Review 2011” and Wikipedia. From the “Global Mobile
Tax Review 2011” we also obtain data on the overall level of taxes as a proportion of the total
cost of mobile ownership. The taxes reflected in this measure include consumer taxes such as
VAT, GST and custom duties; telecom and/or mobile-specific taxes such as import taxes on
handsets and other mobile devices; taxes for using mobile services; and so forth. The total cost of
mobile ownership includes the cost of the handset, the connection cost, any rental expenses, and
the cost of calls and SMS usage.
As a measure of corruption we use the Heritage Foundation’s measure of corruption. This
is based primarily on Transparency International’s Corruption Perceptions Index (CPI), for 2011.
The CPI is based on a 10-point scale in which a score of 10 indicates very little corruption and a
score of 0 indicates a very corrupt government. In scoring freedom from corruption, the Index
converts the raw CPI data to a scale of 0 to 100 by multiplying the CPI score by 10. For example,
if a country’s raw CPI data score is 5.5, its overall freedom from corruption score is 55. For
countries that are not covered in the CPI, the Heritage Foundation determines the score by using
the qualitative information from internationally recognized and reliable sources. This procedure
considers the extent to which corruption prevails in a country. The higher the level of corruption,
the lower the level of overall economic freedom and the lower a country’s original corruption

12
score. We rescale the index (=100-original index), so that a higher number denotes higher
corruption.
The control variables, such as the logarithm of per capita GDP, the logarithm of
population, the population density, and the rate of inflation are all from the World Bank’s
“World Development Indicators.”
1.7. Political Connections
Extending Faccio (2006), we measure political connections by computing the fraction of
top employees (including executives and board members) of each country’s mobile phone
operators who served as heads of state, government ministers, or members of parliament in their
country, or worked (in the government) for anybody in those positions. To do so, we first obtain
the biographies of individuals covering top corporate positions in any of the
“Telecommunication Services” firms covered in Capital IQ.13 The Capital IQ sample includes
the biographies of 55,656 unique individuals affiliated with 5,890 firms in the
“Telecommunication Services” industry, broadly defined. These include fixed line, mobile, and
internet operators, as well as other firms. Capital IQ does not indicate whether a given company
is a mobile phone operator. Therefore, we manually match the names of the firms in Capital IQ
with the mobile telecom operators in the GSMA database. The matching yields a sample of
6,121 individuals affiliated with 410 mobile telecom operators with bios in Capital IQ, as of July
2015, and financial data in GSMA.
We employ a C# text parsing program to identify whether these individuals have political
experience. To identify chiefs of states and government ministers we use the “political titles”
13 The positions are: Chief Executive Officer; Co-Chief Executive Officer; Chairman of Management Board; Co- Chairman of Management Board; President; Co-President; Vice Chairman of Management Board; Co-Owner; Top Key Executive; Chief Financial Officer; Co- Chief Financial Officer; Chief Operating Officer; Co-Chief Operating Officer; Member of Management Board; Chief Investment Officer; Co-Chief Investment Officer; Chief Accounting Officer; Head of Investment Banking; Head of Corporate Finance; Head of Research; Chief Technology Officer; Chief Information Officer; Chief Scientific Officer; Chief Administrative Officer; Head of Investor Relations; Chief Compliance Officer; Chief Legal Officer; Head of Corporate Communications; Head of Corporate Development; Head of Marketing; Head of Sales; Head of Human Resources; Senior Key Executive; Controller; Secretary; Treasurer; Unit CEO; Unit President; Other Key Executive; Assistant Secretary; Assistant Treasurer; Consultant; Administrative Professional; Corporate Communication Professional; Corporate Development Professional; Equity Analyst; Finance and Accounting Professional; Fixed Income Analyst; Human Resources Professional; Investment Banking Professional; Investment Professional; Investor Relation Professional; Legal Professional; Marketing Professional; Operations Professional; Other Analyst; Other Professional; Sales Professional; and Technology Professional.

13
reported in the “Chiefs of State and Cabinet Members of Foreign Governments” directory
published by the CIA (https://www.cia.gov/library/publications/world-leaders-1/index.html).
Examples of such titles include Emperor, Eternal General Secretary, Eternal President, Secretary
of Commerce, Secretary for Communications, and Supreme Leader. We supplement the CIA
database with the names of all Presidents, Chancellors, Chairmen, and Emirs ruling as of or after
1980, identified from http://www.rulers.org/index.html.
The parsing program extracts any sentence listing the political titles described above. We
then read each of those sentences to verify that the person in question indeed covered a political
position. We include both current and past political roles. Examples of political connections
include (1) Laura D'Andrea Tyson (Board Member of AT&T Inc.) who, according to Capital IQ,
“is a Member of President Barack Obama's Economic Recovery Advisory Board (PERAB)…
[and] served as National Economic Adviser to the President of the United States from 1995 to
1996 and Key Architect of President Clinton's domestic and international policy agenda… [and]
is a member of Secretary Hillary Clinton’s Foreign Affairs Policy Board”; and (2) William E.
Kennard (also Board Member of AT&T Inc.) who, according to Capital IQ, “is a Member of
Secretary of State John Kerry's Foreign Affairs Policy Board and U.S. Department of State
Foreign Policy Advisory Board.”
We use this information to build an indicator denoting whether a given individual held a
political position at any point in her life. For each country, we then compute the fraction of
individuals with political experience across all operators and employ that as a measure of
political connections. Note that this variable is static.
2. Uniqueness of the Mobile Communication Industry
2.1 Why the Mobile Communication Industry Is Different
Inside the European Union there is unrestricted circulation of goods, services, capital, and
people. In the subgroup of EU countries that signed the Schengen Treaty, even border controls
have been removed, so travelling by car from Slovenia to Italy or from France to Belgium
appears as seamless as travelling from Massachusetts to Rhode Island. Yet, there is a major
difference: every time one crosses a national border in Europe the roaming company of the
mobile phone changes. In spite of the European integration process, the mobile communication

14
industry remains segmented at the national level. This is not unique to Europe: throughout the
world, the mobile communication industry remains very much segmented by country.
The historical origins of this segmentation are complex. In part, it is a carryover of the
national regulation of the wireline communication industry. The mobile communication industry
sprouted from the wireline communication in the early 1990s. While the natural monopoly and
military strategic considerations of the wireline industry do not apply to wireless, being part of a
regulated industry caused mobile communication to be regulated as well.
The governments’ desire to collect much-needed tax revenues by auctioning off the right
to use the spectrum played a big role in maintaining regulation of the industry. While the total
number of spectrum bands available is determined by physics, the actual amount available (after
military and police uses have been taken out) is very much a political decision.
Finally, governments like to retain some control of wireless services to facilitate
wiretapping both for military and police purposes.
For all these reasons, the mobile industry tends to be quite heavily regulated. Does this
regulation affect the degree of competition? Before answering this question, we want to show
that this amount of regulation does indeed make the mobile industry different from most others,
at least in terms of price variability across countries.
2.2 International Price Variability
While travelling we have all experienced very different dollar prices for an identical
product (a sandwich or a bottle of water) in different countries. One reason for this is the
difference between flexible wholesale prices and more sticky retail prices, a difference well
illustrated by the The Economist’s “Big Mac” index, which compares the price of the
McDonald’s hamburger around the world as a measure of temporary currency over or
undervaluation.
Another reason is that while water, bread, and meat are tradable goods, a sandwich or a
bottle of water available to individual consumers is a bundle of goods, some tradable (like water,
bread, and meat) and some not (like rent and local labor). Thus, differences in labor cost or in the
costs of some inputs, possibly driven by specific geographical constraints, is another reason for
this price variation.
15
Yet, there is a third reason why prices might be different: the different degree of
competition of local markets. If the production cost is similar across countries, competition
should lead to greater homogeneity of the retail price for the same product.
To illustrate how competitive conditions vary widely around the world, in Table 3 we
compare the international price variability of different product and services, by exploiting the
Numbeo dataset. In column 1 we consider the dollar prices. To account for possible differences
in purchasing power parity, in column 2 we adjust the prices for differences in purchasing power
parity across countries. In column 3 we perform this standardization using the McDonald’s
index, i.e., the local price of a Big Mac. We group all of the goods and services reported by
Numbeo into three categories: tradable, non-tradable non-regulated, and regulated (which are all
non-tradable).
In Table 3 we compute the ratio of the 95th percentile of the distribution of prices for an
item with the 5th percentile and then we average these ratios across commodities. Contrary to the
Law of One Price, we find that prices –even PPP adjusted prices– vary greatly across countries:
the 95th percentile of the distribution is roughly four times the 5th percentile. This is true not
only in the tradable sector, but in the non-tradable sector (3.5) as well. Yet, it is even truer in
regulated sectors: in these sectors the 95/5 ratio is 6.7, while in the telecom sector it is 7.5.
Thus, in regulated industries (and telecom in particular), prices vary more across
countries, even after adjusting for differences in purchasing power parity. Since these differences
cannot be easily explained in terms of differences in adjustment costs, they might be due to
differences in the degree of competition. We will now try to explore where these differences in
the degree of competition come from.
3. Concentration, Prices, and Regulation
In Table 4 we explore how different rules of the game affect concentration, prices, and
margins. As dependent variables in the various columns we have several measures of
concentration, competition, and prices of mobile phone services. Besides some control variables,
as a main explanatory variable we have a measure of how the rules existing in a country promote
competition. Our first of such measures is the original 50-items ITU measure of regulation,
where we have subtracted the answers to questions 37-41, which concern the assessment on the
level of competition, as well as the answer to question 42, regarding the ownership status of the

16
main fixed line operator. The overall regulatory score varies greatly across countries, ranging
between 12 and 84.
In all of the cross-sectional models that follow for each variable we compute the average
during 2010-2014 (or a shorter period, depending on data availability). To mitigate the impact of
outliers, we winsorize the price data and the financial variables at the 5th and 95th percentiles.
(We confirm that the results are robust using the raw data.) To increase comparability in the
international setting that we are employing, in all the analyses that follow, price data are
purchasing power parity adjusted using the World Bank (GDP) conversion factors.
As control variables we use the logarithm of per capita GDP (as a measure of economic
development), the logarithm of population (as a measure of the potential size of the market), the
level of population density (as a measure of the cost of serving the customers), and the level of
inflation. This control is very important when the dependent variable is a nominal price level as
in columns 5 and 6. Since in the cross-sectional specifications we are taking 5-year averages,
nominal variables tend to appear lower in high-inflation countries. Hence we correct for average
inflation. We insert this variable in the other specifications only for consistency, but excluding it
does not change our conclusions.
In Table 4.A we report the cross-sectional OLS results. Higher values of the regulatory
score (i.e., more pro-competition rules) are associated with lower levels of concentration,
whether we measure it as C2 or with the Herfindhal index. The coefficient is statistically
different from zero when concentration is measured with the Herfindhal index, but not when it is
measured as C2 (probably because the lack of variation in this measure). One standard deviation
increase in the regulatory score is associated with 1/7 of a standard deviation decline in the
Herfindhal Index.
More pro-competition rules are also associated with higher levels of competition, as
measured by the ITU. One standard deviation increase in the regulatory score is associated with a
1/3 of a standard deviation increase of the ITU measure of competition. The ITU convention is to
replace an observation with a zero when the answer for a country is missing. We compute the
score with and without this convention (columns 3 and 4), with similar results. This correlation is
not surprising: it is just a check that ITU is measuring rules and outcomes consistently.
The same pattern is present when we use prices or profit margins of the mobile sector as
left hand side variables. Higher values of the regulatory score are associated with lower prices

17
and lower margins. The negative coefficient is statistically different from zero for three of the
four measures. One standard deviation increase in the regulatory score is associated with 1/5 of a
standard deviation decline in the price of mobile internet services. It is perhaps surprising that the
results are significant even for the EBITDA margin, since large corporations tend to redirect
their profits into tax havens. For example, the top 4 U.S. operators all have subsidiaries in
Singapore and Hong Kong. AT&T has additional subsidiaries in the Bermuda, Ireland, and
Switzerland; Sprint has additional subsidiaries in Ireland; and T-Mobile has further subsidiaries
in Switzerland and Luxembourg14 –all of which are well known tax havens. Thus, they are in a
position where they can potentially hide their profits better.
In Table 4.B we use all of the panel data from 2003 to 2013 (for some specific variables
and/or countries the time series is shorter due to lack of data). The specification is the same as in
Table 4A, but we include country fixed effects. The pattern of the results is very similar. In fact,
the statistical significance of the impact of the regulatory score on concentration and competition
is stronger, while that of the impact of the regulatory score on prices and margins is slightly
weaker.
In unreported regressions we rerun the same estimations (both in the cross-section and in
the panel) by using the various subcomponents of the ITU regulatory score: independence of
regulator, power of regulator, economies of scale, and foreign competition. All these sub-
components have effects on concentration, competition, prices, and margins similar to that of the
overall index. The level of statistical significance varies across the various specifications, but we
could not identify any single cluster as more or less important.
We then repeat the same exercise with each single sub-score. The three measures that
appear more important in reducing concentration and enhancing competition are (1) the
portability of the mobile number, (2) the tradability of the spectrum licenses, and (3) the
openness to foreign entry. The three measures that appear more important in reducing prices and
margins are (1) the availability of voice over the internet, (2) the openness to foreign entry, and
(3) number portability. These results are presented in Tables 3C-3F.
14 Based on information from OneSource.

18
4. Is Concentration “Somehow” Good?
In the previous section we have shown that the design of the rules of the mobile industry
appears to affect the degree of concentration, competition, prices, and margins. If this is the case,
is it obvious that every government should try to maximize the ITU regulatory score, i.e.,
promote the maximum level of competition and the lowest level of prices?
In a static framework, it is well known that any deviation from competition creates a
deadweight loss, often referred to as Harberger’s triangle. Yet, Harberger (1964) himself showed
that this triangle is generally small. Furthermore, dynamic considerations may make some
deviations from perfect competition desirable. For example, one version of this argument –often
found in industry lobbying material– is that lower prices lead to lower quality, which hurts
consumers. Another variation is that lower prices lead to lower profits, which lead to lower
investments, which hurts consumers. Thus, the industry does not dispute the kind of evidence
presented in Table 4 (i.e., that rules may reduce concentration, increase competition, and lower
prices)15 it disputes only the welfare consequences of this outcome: in spite of low prices
consumers are worse off because of the low quality of service.
4.1. Concentration and Quality
It is hard to test the welfare implication of this hypothesis, but we can test the impact that
concentration, competition, and prices (or better the changes in concentration, competition, and
prices induced by pro-competition rules) have on the quality of service and investments. This is
what we do in Table 5. The specifications are similar to the ones used in Table 4. The left hand
side variables here are different measures of quality of service: from the percentage of
connections (or coverage) that are at least 3G or 4G to the speed of broadband internet. Besides
the control variables, our main explanatory variable is alternatively a measure of concentration,
competition, prices, or margins. This measure is instrumented by the ITU regulatory score. Thus,
we are interested in assessing the effect of the component of competition due to the impact of
pro-market rules.
As Table 5.A shows, by and large the effect of concentration on quality is negative.
Quality is higher in more competitive markets. We repeat those regressions with the other
15 The result that rules that are more pro-competition lead to lower prices in the telecom industry is not new. In its annual “Measuring the Information Society Report,” ITU (2014) reached a similar conclusion.

19
measures of concentration, competition, and prices (the results are not tabulated to save space).
When we do so we find that the impact of prices and margins on quality is negative and
sometimes statistically significant at conventional levels. Thus, contrary to industry claims,
markets with higher prices tend to exhibit lower, not higher, quality of services. The results are
not super strong. Thus, we would not necessarily conclude that more competition leads to higher
quality, but we can certainly reject the opposite claim: that less competition leads to higher
quality. In particular, there is no evidence suggesting that a government should tilt the rules in a
non-competitive dimension to enhance the quality of services. Thus, this evidence provides little
support to public interest theories.
4.2. Concentration and Investments
We reach the same conclusion when we look at the impact of concentration, competition,
and prices on investments (Table 5.B). The specifications are identical to Table 5.A, only with a
measure of investment intensity (capex over revenues in Table 5.B, or number of base stations
over revenues in Table 5.C) as the left hand side variables. As for Tables 4.B and 4.C the
measures of concentration, competition, prices and margins are instrumented with the ITU
regulatory score. Most of the coefficients in Table 5.B have the opposite sign of what the
industry lobbying theory would suggest (i.e., that high profitability and prices lead to more
investments), albeit no coefficient is statistically different from zero. As before, we cannot
conclude that more competition and lower profits lead to more investments, but we can certainly
reject the opposite claim: that less competition and higher profits leads to more investments.
4.3. Concentration, Employment, and Wages.
Another possible reason why governments might want to reduce competition is to
increase employment or wages. This hypothesis is especially credible in an industry –like the
mobile industry– that has seen dramatic improvements in efficiency and less dramatic growth in
revenues over the last 10 years, and hence has started to fire people. Since it is more difficult to
fire workers in profitable companies, the government can design rules to limit competition in the
hope of preserving employment.
Tables 4.D and 4.E explore this possibility. As with the previous two panels, the
measures of concentration, competition, prices, and margins are instrumented with the ITU
regulatory score. Once again, most of the coefficients have the opposite sign of what the

20
prediction above suggests (i.e., that high profitability and prices lead to higher employment or
higher wages), although no coefficient is statistically different from zero. The results so far are,
instead, broadly consistent with a view of regulation as a mechanism to create rents for the
incumbents and, possibly, politicians.
5. What Shapes the Regulatory Choices?
Given that in the mobile industry the design of the rules appears to affect concentration,
competition, prices, and margins, but does not appear to affect the quality of service,
investments, and employment, what explains regulatory choices that do not foster competition?
5.1. Auctions
An obvious reason why a government may want to restrict competition is that it wants to
maximize the revenues it obtains from auctioning the spectrum. In the unlikely case mobile
operators are able to use first degree price discrimination, this choice is also socially efficient.
But even if it is not socially efficient, a government might want to pursue this strategy because it
is constrained in its tax-raising or because it thinks this form of tax-raising is less politically
costly.
In Table 6 we investigate whether that is the case. In column 1 the dependent variable is
the total fees paid for spectrum auctions held in a given country through the end of 2014, scaled
by aggregate revenues of the mobile operators. In column 2 we restrict our analysis to auctions
held since 1999 (those include all 3G and subsequent auctions). In column 3 we further restrict to
auctions held since 2011 (so as to include all 4G auctions).
Contrary to the revenue raising hypothesis for restricting competition, we find that
auction revenues are higher in countries that have more competition. To put it differently,
allowing competition enables governments to extract higher revenues from the operators through
the spectrum auctions.
The reason is pretty simple: auctions do not work well with limited numbers of bidders.
Pro-competitive rules increase the number of major players in a market and thus the number of
bidders. Hence, the idea that a government should restrict competition to increase its revenues is
both theoretically and empirically wrong.

21
5.2. Taxation Hypothesis
A variation of the above argument is that governments allow concentration, high prices,
and high margins in order to raise more revenues by taxing the incumbent operators. Taxation
does not require multiple operators to be effective, thus this argument has potentially greater
validity than the previous one. If this motivation was important, it would more likely play a role
in countries where it is difficult to raise other forms of taxes (because of bad administration or
tax evasion), or where profits are taxed more than consumption.
We investigate this hypothesis in Table 7, where we employ several proxies for a
country’s ability to raise taxes. In column 1 we estimate a regression where the left hand side
variable is the pro-competitive regulatory score and the right hand side our standard set of
control variables and a measure of tax evasion. Consistent with the “taxation hypothesis,”
countries with poorer ability to raise taxes (measured by a higher level of tax evasion) exhibit a
lower value of the pro-competition regulatory score, but the effect is not statistically significant.
In column 2, we re-estimate the same specification with the level of sales taxes on
telecom operators (inclusive of VAT, GST and custom duties, and mobile-specific taxes) as a
measure of the fiscal benefit of higher prices. Contrary to the “taxation hypothesis,” countries
with higher sales taxes have more pro-competitive regulation and the coefficient is statistically
different from zero at the 1% level.
In column 3, we re-estimate the same specification with the level of corporate taxes as a
measure of the fiscal benefit of higher prices. Consistent with the “taxation hypothesis,”
countries with higher corporate taxes have less pro-competitive regulation, but the coefficient is
not statistically different from zero.
Finally, in column 4, we use the proportion of taxes over the total cost of operating a
mobile phone as a measure of the fiscal benefit of higher prices. Contrary to the “taxation
hypothesis,” countries with higher sales taxes have more pro-competitive regulation and the
coefficient is statistically different from zero at the 5% level. Thus, overall we find no evidence
in support of the “taxation hypothesis.”
5.3. Ideology
In the rest of Table 7 we investigate the role of ideology in the choice of regulation.
Governments strongly influenced by unions might favor concentration because concentration
tends to increase wages and employment. In column 5 we use the percentage of the work force

22
affiliated to labor unions as a right hand side variable (Botero et al., 2004). As expected, the sign
of the coefficient is negative (more union, less pro-competition regulation), but it is not
statistically significant.
In column 6 as a measure of ideology we use the fraction of years between 1928 and
1995 in which “the chief executive and the largest party in the legislature were leftist or centrist.”
As expected, the sign of the coefficient is negative and statistically significant at the 5% level.
In column 7 we restrict the years to the 1975 and 1995 period. As expected, the sign of
the coefficient is negative but not statistically significant. Thus, overall we find only weak
evidence that the ideology matters for regulatory choices.
5.4. Regulatory Capture
If we analyze the regulatory choice from a political economy perspective (Stigler, 1971
and Peltzman, 1976) we obtain some clear predictions. Stronger connections between mobile
industry executives and politicians will favor pro-business regulation, which will tend to limit
competition and new entry. By contrast, in a democratic country, politicians can buy consensus
by introducing a pro-competitive regulation that lowers prices. Thus, we expect regulation to be
more pro-competition in more democratic countries and less pro-competition where there are
more connections between mobile industry executives and politicians.
In Table 8 we regress our measures of regulation on our standard set of controls and our
political economy variables. In columns 1-3 we use various measures of democracy from Polity
IV. Regardless of whether we use the overall measure of democracy, the level of constraints on
the executive, or the degree of political competition, we find that democratic countries are more
likely to have regulation that favors competition in the mobile telecommunication industry.
This finding is further supported by the fact that 4 of the 10 countries with the most anti-
competitive regulatory score (i.e., Kuwait, Belarus, Swaziland, and Cuba) have a democracy
score of 0. By contrast, all 10 countries with the most pro-competition score have a democracy
score of at least 8, with 8 out of 10 having a perfect score. Thus, the evidence is consistent with
the idea that, in democratic countries, politicians cater more to consumers’ interest.
In column 4 we focus on the diffusion of political connections, i.e., the role of operators’
concentrated interests. We find that, when phone operators are more politically connected,

23
regulations are less likely to favor competition.16 A one standard deviation increase in the
frequency of political connection reduces the regulatory score by one fourth of its standard
deviation. The percentage of politically connected employees of mobile operators is 5.35% in the
countries with the most anti-competitive regulations (Belarus ranking first with a percentage of
16.67%), while this fraction is 4.76% in the countries with the most pro-competition regulations
(with Poland having the highest percentage, 13.04%).
In column 5 we focus on the role of corruption. We find that more corrupt countries tend
to have regulations that are less likely to favor competition. To what extent are corruption and
political connections the same thing? To assess whether that is the case, we run a horse race
between these variables. Although political connections are positively correlated with corruption,
the correlation coefficient is surprisingly low (correlation coefficient = 0.0096). Political
connections are on average less prevalent in democratic countries. Further democratic countries
tend to be less corrupt. With this in mind, the results of the “horse race” specification, reported in
column 6, show that political connections remain significant after controlling for corruption (and
democracy).
Overall, the results discussed in this section are most consistent with the view that
regulation is the outcome of different political pressures.
6. Antitrust and Competition
6.1 A Case Study
Thus far, we only looked at regulatory measures that are easily quantifiable and have
been codified by ITU. In more advanced countries (like the United States), the Antitrust
authorities play a major role in shaping competition and prices. It is however more difficult to
codify the level of antitrust activism and use it in empirical analysis. Therefore, we resort to a
mini-case study of countries at very similar level of economic development and income per
capita, but different levels of antitrust activism. To this end we exploit the Atlantic divide
between the United States and Europe. As shown by the E.U. antitrust case against Google, the
16 We are unable to investigate the role of lobbying or campaign contributions as those data are unfortunately available only for a very restricted number of countries.

24
European Antitrust Authority is more pro-active than its U.S. counterpart. Thus, we compare the
level of prices and quality between the U.S. and the two EU countries with the level of regulation
closest to the Unites States (76.5). These are Germany (78.5) and Denmark (76).
The United States exhibits much higher monthly revenues per unique subscriber ($67.6 in
2015:3 vs $23.48 Germany and $31.01 for Denmark), which implies U.S. cellular phone
companies have annual revenues per customers $530 higher than their German counterparts, and
$439 higher than their Danish counterparts. One reason for the large difference could be that the
U.S. carriers tend to subsidize the headsets, while the European carriers do not. The typical
subsidy for an iPhone is $500 dollars (they charge $199 for a phone worth $699). Even factoring
in this difference, each U.S. customer pays $280 a year more than a German customer and $189
a year more than a Danish one. Given the number of U.S. customers (233.2 million in 2015), this
implies that U.S. operators enjoy a transfer of $65.2bn ($44.1bn) vis-à-vis the German (Danish)
benchmark.
Not all of this difference is a pure transfer. We do find better quality of service in the
United States, where in 2013 4G connections represented 23.1% of the total and 4G coverage
was 95.1%. In Germany, 4G connections represented 2.7% of the total 4G coverage was 64.54%,
while for Denmark, 4G connections represented 9.31% of the total and 4G coverage was
92.37%.
To explore to what extent this is a transfer to shareholders we look at the market values
of U.S. operators. At the end of May 2016, the total market capitalization of the top four U.S.
operators amounted to $486bn versus a total book value of $175bn. Lindberg and Ross (1981)
associate the difference between the market value of assets and the book value of assets to the
abnormal profits a firm can earn as a result of some stable market power position. If we apply
this logic to the four major U.S. carriers (AT&T, Verizon, T-Mobile, and Sprint), the capitalized
value of abnormal profits in the U.S. mobile industry should be equal to $311bn.
If we assume that the abnormal profits are equal to the after tax transfer from consumer to
producers, we can easily calculate the implicit rate at which these abnormal profits are
capitalized, assuming they are fixed in perpetuity. These implicit capitalization rates vary
between 8.6% and 14.6%. These are very reasonable rates. Thus, the magnitude of the transfer in
welfare from consumer to producers is very plausible.
6.2 What Does the Antitrust Have to Do With It?

25
The United States’ mobile phone market started the new millennium highly fragmented
as a result of two political decisions: the AT&T breakup of 1984 and the way spectrum was
auctioned off in the late 1990s. As one can see from Figure 1, during the new millennium,
concentration greatly increased thanks to three mergers: Bell Atlantic and GTE that formed
Verizon Wireless in 2000, Cingular Wireless with AT&T in 2004, and Verizon Wireless
Communications with Alltel Corporation in 2008. All three transactions faced the scrutiny of
both the Department of Justice and the Federal Communication Commissions and all three had to
spin off some assets to comply with the requirement. Thus, the consolidation of the U.S. mobile
industry in the 2000s was enabled by a series of antitrust decisions.
The Antitrust was also important for the mergers that did not take place. In 2014 a U.S.
industry source (FierceWireless) reported that a declaration by the Department of Justice that
“any wireless merger among the four Tier 1 carriers would face heightened scrutiny, a strong
hint that any potential deal between Sprint and T-Mobile US would face an uphill battle with the
DOJ.”17 Not surprisingly, this merger, previously rumored, did not take place.
It is difficult to establish a causal link between the higher margins of the mobile service
industry in the United States and the behavior of its Antitrust authority vis-à-vis the United
States. Note, however, that in Denmark an attempt to reduce the number of main operators from
4 to 3 was blocked by the European antitrust in 2015.18 In Germany a similar attempt went
through in 2014, but only after intense pressure by Angela Merkel.19 Interestingly, between
2013:3 and 2015:3 Danish ARPU levels dropped by 28%, in Germany by 20%, and in the United
States by 3%.
7. Conclusions
Is product market competition determined solely by economic factors or is it affected by
political factors as well? In this paper we provide some evidence on the importance of political
factors in the degree of competition in the mobile service industry. In cross-country comparisons
we show that concentration, competition, and prices are affected by the rules of the game
17 http://www.fiercetelecom.com/telecom/report-says-microsoft-close-to-naming-satya-nadella-as-its-new-ceo-chinese-service 18 “Brussels blocks Danish deal in blow to Three's £10.25bn O2 takeover”, Daily Telegraph 11 Sep 2015. 19 Daniel Thomas and Alex Barker “Telecoms: Europe’s scrambled signal”, Financial Times, June 30, 2014

26
designed by local governments. In addition, we show that this design seems to be affected more
by political lobbying than by economic principles.
One interesting byproduct of our analysis is the lack of a negative relation between
market competition and quality of service and level of investment in the mobile industry.
Industry conditions under (partial) control of the government have large redistributive effects
between consumers and producers. The lack of empirical evidence of any benefit in transferring
part of the consumer surplus to the operators should weigh in the current antitrust debate on both
sides of the Atlantic.

27
References Backman, Michael. 1999. Asian Eclipse: Exposing the Dark Side of Business in Asia. Singapore:
Wiley. Botero, Juan C., Simeon Djankov, Rafael La Porta, Florencio Lopez-de-Silanes, and Andrei
Shleifer. 2004. “The Regulation of Labor.” Quarterly Journal of Economics 119(4): 1339-1382.
Bunkawanicha, P. and Y. Wiwattanakantang. 2009. “Big business owners in politics.” Review of Financial Studies 22(6): 2133-2168.
Faccio, Mara, and Hung-Chia Hsu. 2016. “Politically connected private equity and employment.” Journal of Finance forthcoming.
Faccio, Mara, Ronald W. Masulis, and John J. McConnell. 2005. “Political connections and corporate bailouts.” Journal of Finance 61: 2597-2635.
Fulmer, Sarah and April M. Knill. 2012. “Political contributions and the severity of government enforcement.” Working Paper. Florida State University.
Goldman, Eitan, Jorg Rocholl, and Jongil So. 2013. “Political connections and the allocation of procurement contracts.” Review of Finance 13: 1617-1648.
Harberger, Arnold C. 1964. “The measurement of waste.” American Economic Review 54(3): 58-7.
Hausman, Jerry A., and Agustin J. Ros. 2013. “An econometric assessment of telecommunications prices and consumer surplus in Mexico using panel data.” Journal of Regulatory Economics 43(3): 284-304.
Houston, Joel F., Liangliang Jiang, Chen Lin, and Yue Ma. 2014. Political connections and the cost of bank loans. Journal of Accounting Research 52 (1): 193-243.
International Telecommunication Union. 2014. “Measuring the Information Society Report.”http://www.itu.int/en/ITU-D/Statistics/Pages/publications/mis2014.aspx.
Khwaja, A. I., and A. Mian. 2005. “Do lenders favor politically connected firms? Rent-seeking in an emerging financial market.” Quarterly Journal of Economics 120: 1371-1411.
Krueger, Anne. 1974. “The political economy of the rent-seeking society.” American Economic Review 64(3): 291–303.
Lindenberg, Eric B., and Stephen A. Ross. 1981. “Tobin's q Ratio and Industrial Organization." Journal of Business 54:1-32.
OECD. 2012. OECD Review of Telecommunication Policy and Regulation in Mexico. OECD Publishing. http://dx.doi.org/10.1787/9789264060111-en
Peltzman, Sam. 1976. “Toward a more general theory of regulation.” Journal of Law and Economics 19: 211-240.
Pigou, A. C. 1932. The Economics of Welfare. London: Macmillan and Co. Stigler, George J. 1971. “The theory of economic regulation.” Bell Journal of Economics and
Management Science 2: 3-21. Tullock, Gordon. 1967. “The welfare costs of tariffs, monopolies, and theft.” Western Economic
Journal 5(3): 224-232. Yu, Frank, and Xiaoyun Yu. 2011. Corporate lobbying and fraud detection. Journal of Financial
and Quantitative Analysis 46(6): 1865-1891.

28
Figure 1: Increasing Concentration of the U.S. Mobile Industry Q1 2000 through Q3 2015, based on © GSMA Intelligence (2015).
Note: The ranking of a given operator may change over time due to mergers and acquisitions, bankruptcies, etc.
0
0.05
0.1
0.15
0.2
0.25
0.3
0.35
0.420
0020
0120
0220
0320
0520
0620
0720
0820
1020
1120
1220
1320
15
First Operator
Second Operator
Third Operator
Fourth Operator

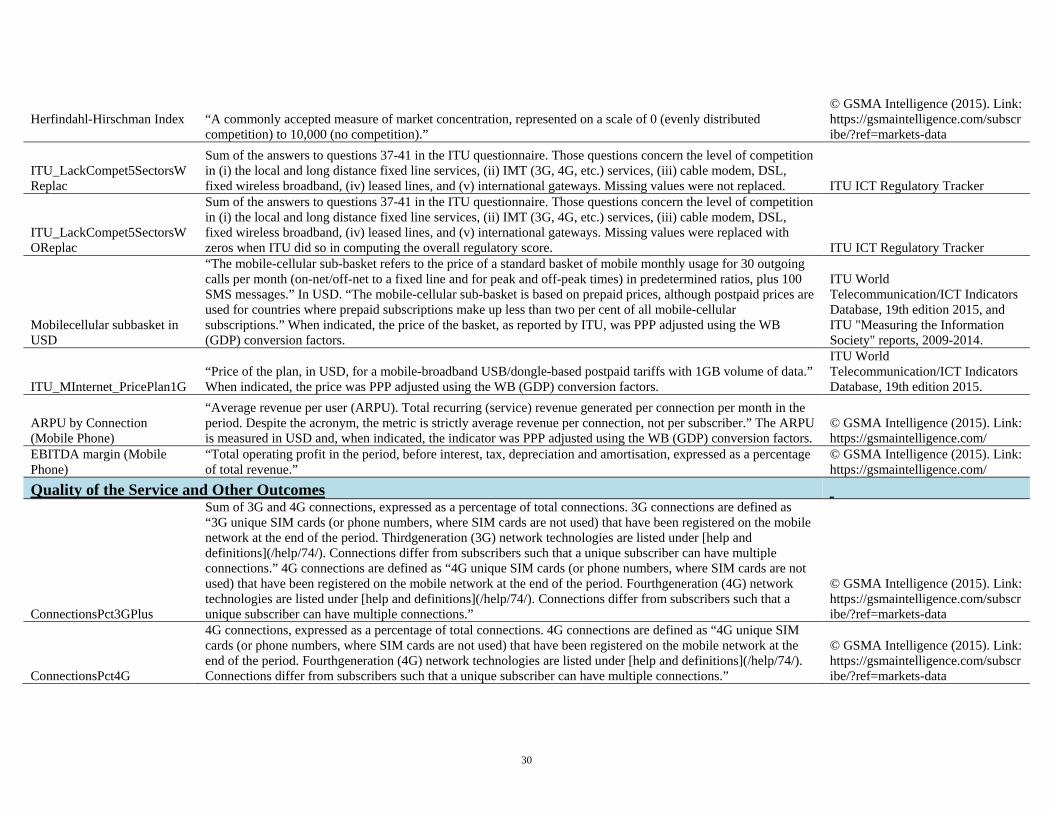
Table 1. Variables Definitions
This table provides definitions and the data sources. The variables are grouped into the following categories: (1) Regulatory variables (2) Competitive structure and pricing; (3) Quality of the service and other outcomes; (4) Spectrum auctions, and (5) Institutional variables.
Variable Name: Definition: Sources: Regulatory Variables
ITU_Regulatory Score
Overall regulatory score. It reflects the answers to 50 questions related to the regulation in place as well as some outcome variables. The questions relate to regulations concerning the fixed phone, mobile phone, internet, and broadcasting. From the original ITU regulatory score, we deducted the answers to questions concerning the level of competition in (i) the local and long distance fixed line services, (ii) IMT (3G, 4G, etc.) services, (iii) cable modem, DSL, fixed wireless broadband, (iv) leased lines, and (v) international gateways (questions 37-41) and the ownership status of the main fixed line operator (question 42) as those represent outcome variables rather than regulatory decisions. ITU ICT Regulatory Tracker
ITU_Cluster 1 (Independence of the Regulator)
Cluster 1 as defined by the ITU. This cluster mostly includes the answers to questions concerning the existence and the independence of the regulator. ITU ICT Regulatory Tracker
ITU_Cluster 2 (Power of the Regulator)
Cluster 2 as defined by the ITU. This cluster mostly includes the answers to questions concerning the power of the regulator (vs. power of the government and/or operators). ITU ICT Regulatory Tracker
ITU_Cluster 3 (Economies of Scale)
Cluster 3 as defined by the ITU. This cluster mostly includes the answers to questions concerning the ease of entry in the sector, i.e., regulations that enable the sharing of fixed costs. ITU ICT Regulatory Tracker
ITU_Cluster 4 (Foreign Competition)
Cluster 4 as defined by the ITU. This cluster mostly includes the answers to questions concerning whether foreign ownership in (i) facilities-based operators, (ii) spectrum-based operators, (iii) local service operators/long-distance service operators, (iv) international service operators, (v) internet service providers, and (vi) value-added service providers is allowed (restricted, or forbidden), as well as two questions concerning the existence of a concept of market dominance and the criteria used to establish market dominance. ITU ICT Regulatory Tracker
ITU_Numberportability “Is number portability required from: b) Mobile operators?/ If yes, is this service currently available to subscribers?” ITU ICT Regulatory Tracker
ITU_IndividualsVoIP “Are individual users allowed to make voice over IP (VoIP) or Internet telephony phone calls?” ITU ICT Regulatory Tracker ITU_SecondaryTradAlwd ‘Is secondary trading allowed?” The question refers to secondary trading of the spectrum. ITU ICT Regulatory Tracker ITU_Foreignparticip “Is foreign participation or ownership limited in the following market segment: Spectrum-based operators?” ITU ICT Regulatory Tracker
ITU_Regulatory Score Mobile
ITU_Numberportability+ITU_IndividualsVoIP+ITU_SecondaryTradAlwd+ITU_Foreignparticip. The score is computed both without replacement of missing values, as well as by replacing missing values with zeros whenever ITU did so when computing the overall regulatory score. ITU ICT Regulatory Tracker
Competitive Structure and Pricing
C2
Market share of the two largest operators in a given country during a given period. Each operator’s market share is the operator’s “Total connections at the end of the period, expressed as a percentage share of the total market connections.”
© GSMA Intelligence (2015). Link: https://gsmaintelligence.com/subscribe/?ref=markets-data
30
Herfindahl-Hirschman Index “A commonly accepted measure of market concentration, represented on a scale of 0 (evenly distributed competition) to 10,000 (no competition).”
© GSMA Intelligence (2015). Link: https://gsmaintelligence.com/subscribe/?ref=markets-data
ITU_LackCompet5SectorsWReplac
Sum of the answers to questions 37-41 in the ITU questionnaire. Those questions concern the level of competition in (i) the local and long distance fixed line services, (ii) IMT (3G, 4G, etc.) services, (iii) cable modem, DSL, fixed wireless broadband, (iv) leased lines, and (v) international gateways. Missing values were not replaced. ITU ICT Regulatory Tracker
ITU_LackCompet5SectorsWOReplac
Sum of the answers to questions 37-41 in the ITU questionnaire. Those questions concern the level of competition in (i) the local and long distance fixed line services, (ii) IMT (3G, 4G, etc.) services, (iii) cable modem, DSL, fixed wireless broadband, (iv) leased lines, and (v) international gateways. Missing values were replaced with zeros when ITU did so in computing the overall regulatory score. ITU ICT Regulatory Tracker
Mobilecellular subbasket in USD
“The mobile-cellular sub-basket refers to the price of a standard basket of mobile monthly usage for 30 outgoing calls per month (on-net/off-net to a fixed line and for peak and off-peak times) in predetermined ratios, plus 100 SMS messages.” In USD. “The mobile-cellular sub-basket is based on prepaid prices, although postpaid prices are used for countries where prepaid subscriptions make up less than two per cent of all mobile-cellular subscriptions.” When indicated, the price of the basket, as reported by ITU, was PPP adjusted using the WB (GDP) conversion factors.
ITU World Telecommunication/ICT Indicators Database, 19th edition 2015, and ITU "Measuring the Information Society" reports, 2009-2014.
ITU_MInternet_PricePlan1G “Price of the plan, in USD, for a mobile-broadband USB/dongle-based postpaid tariffs with 1GB volume of data.” When indicated, the price was PPP adjusted using the WB (GDP) conversion factors.
ITU World Telecommunication/ICT Indicators Database, 19th edition 2015.
ARPU by Connection (Mobile Phone)
“Average revenue per user (ARPU). Total recurring (service) revenue generated per connection per month in the period. Despite the acronym, the metric is strictly average revenue per connection, not per subscriber.” The ARPU is measured in USD and, when indicated, the indicator was PPP adjusted using the WB (GDP) conversion factors.
© GSMA Intelligence (2015). Link: https://gsmaintelligence.com/
EBITDA margin (Mobile Phone)
“Total operating profit in the period, before interest, tax, depreciation and amortisation, expressed as a percentage of total revenue.”
© GSMA Intelligence (2015). Link: https://gsmaintelligence.com/
Quality of the Service and Other Outcomes
ConnectionsPct3GPlus
Sum of 3G and 4G connections, expressed as a percentage of total connections. 3G connections are defined as “3G unique SIM cards (or phone numbers, where SIM cards are not used) that have been registered on the mobile network at the end of the period. Thirdgeneration (3G) network technologies are listed under [help and definitions](/help/74/). Connections differ from subscribers such that a unique subscriber can have multiple connections.” 4G connections are defined as “4G unique SIM cards (or phone numbers, where SIM cards are not used) that have been registered on the mobile network at the end of the period. Fourthgeneration (4G) network technologies are listed under [help and definitions](/help/74/). Connections differ from subscribers such that a unique subscriber can have multiple connections.”
© GSMA Intelligence (2015). Link: https://gsmaintelligence.com/subscribe/?ref=markets-data
ConnectionsPct4G
4G connections, expressed as a percentage of total connections. 4G connections are defined as “4G unique SIM cards (or phone numbers, where SIM cards are not used) that have been registered on the mobile network at the end of the period. Fourthgeneration (4G) network technologies are listed under [help and definitions](/help/74/). Connections differ from subscribers such that a unique subscriber can have multiple connections.”
© GSMA Intelligence (2015). Link: https://gsmaintelligence.com/subscribe/?ref=markets-data

31
NetworkCoverage3GPlus
Sum of 3G and 4G mobile coverage, expressed as a percentage of the total market geographic surface area. “3G mobile coverage, expressed as a percentage of the total market geographic surface area, at the end of the period. Thirdgeneration (3G) network technologies are listed under [help and definitions](/help/74/).” “4G mobile coverage, expressed as a percentage of the total market geographic surface area, at the end of the period. Fourthgeneration (4G) network technologies are listed under [help and definitions](/help/74/).”
© GSMA Intelligence (2015). Link: https://gsmaintelligence.com/subscribe/?ref=markets-data
NetworkCoverage4G “4G mobile coverage, expressed as a percentage of the total market geographic surface area, at the end of the period. Fourthgeneration (4G) network technologies are listed under [help and definitions](/help/74/).”
© GSMA Intelligence (2015). Link: https://gsmaintelligence.com/subscribe/?ref=markets-data
Speed, in Mbit/s “Mobile broadband USB_1GB, prepaid, Speed, in Mbit/s - - Advertised maximum theoretical download speed, and not speeds guaranteed to users associated with a 1GB USB/dongle-based prepaid plan.”
ITU World Telecommunication/ICT Indicators Database, 19th edition 2015.
CapexTotal/Revenues CapexTotal is “Total capital expenditure incurred in the period, including both intangible and tangible assets.” Scaled by “Total revenue generated in the period, including both recurring (service) and nonrecurring revenue.”
© GSMA Intelligence (2015). Link: https://gsmaintelligence.com/subscribe/?ref=markets-data
NumberOfBaseStations*100,000/Revenues
Base stations are “Total deployed, and active, base stations on the network at the end of the period.” Scaled by “Total revenue generated in the period, including both recurring (service) and nonrecurring revenue.”
© GSMA Intelligence (2015). Link: https://gsmaintelligence.com/subscribe/?ref=markets-data
NumberOfEmployees/Revenues
The number of employees is the “Total employed head count (fulltime equivalent) for the telecoms business at the end of the period, and if applicable, only within mobile operations.” Scaled by “Total revenue generated in the period, including both recurring (service) and nonrecurring revenue.”
© GSMA Intelligence (2015). Link: https://gsmaintelligence.com/subscribe/?ref=markets-data
CostOfPersonnel/Revenues
The cost of personnel is the “Operating expenditure incurred in the period related to the cost of employees, including salary costs.” Scaled by “Total revenue generated in the period, including both recurring (service) and nonrecurring revenue.”
© GSMA Intelligence (2015). Link: https://gsmaintelligence.com/subscribe/?ref=markets-data
Spectrum Auctions
Proceeds from all spectrum auctions/Mobile operators' aggregate revenues
Total proceeds raised by a government from all the spectrum auctions run through 2014, divided by the average of the aggregate revenues of mobile operators, during 2010-2014. The operators’ revenues are the “Total revenue generated in the period, including both recurring (service) and nonrecurring revenue.”
DotEcon and © GSMA Intelligence (2015). Links: http://www.dotecon.com/ and https://gsmaintelligence.com/subscribe/?ref=markets-data
Spectrum auction proceeds since 1999/ Mobile operators' aggregate revenues
Total proceeds raised by a government from the spectrum auctions run since 1999 (i.e., since the first 3G auction), divided by the average of the aggregate revenues of mobile operators, during 2010-2014. The operators’ revenues are the “Total revenue generated in the period, including both recurring (service) and nonrecurring revenue.”
DotEcon and © GSMA Intelligence (2015). Links: http://www.dotecon.com/ and https://gsmaintelligence.com/subscribe/?ref=markets-data
Spectrum auction proceeds since 2011/Mobile operators' aggregate revenues
Total proceeds raised by a government from the spectrum auctions run since 2011 (i.e., since the first 4G auction), divided by the average of the aggregate revenues of mobile operators, during 2010-2014.
DotEcon and © GSMA Intelligence (2015). Links: http://www.dotecon.com/ and https://gsmaintelligence.com/subscr

32
ibe/?ref=markets-data
Institutional Variables
Tax Evasion
“Executives' assessment of how important tax evasion is in their country (the lower the measure the more rampant is tax evasion).” As reported by Shleifer. The index was re-ranked so that a higher value denotes less tax evasion.
World Economic Forum. Link: scholar.harvard.edu/files/shleifer/files/tax_data_march2009.xls
Telecom_Sales Tax Rate
Sales Tax Rate applicable to mobile telecom operators from Deloitte's “Global Mobile Tax Review 2011” if available; Otherwise tax rate from Deloitte online page http://www2.deloitte.com/global/en/pages/tax/solutions/global-indirect-tax-rates.html; otherwise tax rate from Wikipedia.
Deloitte "Global Mobile Tax Review" & Wikipedia
Telecom_Corporate Tax Rate
Corporate Tax Rate applicable to mobile telecom operators from Deloitte's “Global Mobile Tax Review 2011” if available; Otherwise tax rate from Deloitte online page http://www2.deloitte.com/content/dam/Deloitte/global/Documents/Tax/dttl-tax-corporate-tax-rates-2012-2016.pdf; otherwise tax rate from Wikipedia
Deloitte "Global Mobile Tax Review" & Wikipedia
Taxes as a proportion of TCMO 2011 (for mobile phone)
Level of tax as a proportion of TCMO in 2011. The total cost of mobile ownership (TCMO) consists of all price components associated with owning a mobile phone and purchasing mobile phone services. These cost components include: (1) Handset cost; (2) Connection cost; (3) Rental costs; and (4) Call and SMS usage rates. Taxes vary from standard consumer taxes such as VAT, GST and custom duty, to include telecom or mobile-specific taxes and include: (1) VAT or GST: these are consumer taxes incurred when purchasing every component of owning and using a mobile phone. These taxes are often expressed as a proportion of the value of the good or service (2) Custom duty and excise taxes on imported goods. In mobile telephony, users in developing countries typically pay import taxes on handsets and other mobile devices. These can either expressed as a proportion of the handset value or as a fixed sum or both; (3) Other telecoms specific taxes: as discussed in the main body of this report, a number of countries still impose specific taxes on consumers for using mobile services. These can include luxury item duties on handsets, SIM activation taxes or other taxes on connection, special communication taxes on mobile usage, and monthly contributions for post-pay customers. These have all been accounted for in these calculations.
Deloitte "Global Mobile Tax Review"
Shleifer_Union density “Measures the percentage of the total work force affiliated to labor unions in 1997. Source: ILO, Laborsta: <http://laborsta.ilo.org>, and The World Bank [2001].”
Botero, Juan, Simeon Djankov, Rafael LaPorta, Florencio López-de-Silanes, and Andrei Shleifer. 2004.

33
Shleifer_LeftWing
“Measures the percentage of years between 1928 and 1995, and, alternatively, between 1975 and 1995, during which both the party of the chief executive and the largest party in congress had left or center orientation. If the country was not independent in the initial year of the period, we use the independence year as the first period. For countries that were part of a larger country in the initial year of the period and subsequently broke-up, we include in calculations the political orientation of the political parties in the mother country in the pre-breakup period. In the case of military regimes, where political affiliations are unclear, we classify the regime based on its policies. Source: Authors’ calculations based on: Political Handbook of the World, Europa Yearbook, World Encyclopedia of Political Systems and Parties, Political Parties of the Americas: Canada, Latin America, and the West Indies, Encyclopedia of Latin American Politics, Political Parties of Europe, Political Parties of Asia and the Pacific, Statesmen database: <http://www.worldstatesmen.org>, Country Reports History: <http://www.countryreports.org>, Rulers database: <http://rulers.org/>, various regional and country sources.”
Botero, Juan, Simeon Djankov, Rafael LaPorta, Florencio López-de-Silanes, and Andrei Shleifer. 2004.
POLIV_democracy
“Institutionalized Democracy: Democracy is conceived as three essential, interdependent elements. One is the presence of institutions and procedures through which citizens can express effective preferences about alternative policies and leaders. Second is the existence of institutionalized constraints on the exercise of power by the executive. Third is the guarantee of civil liberties to all citizens in their daily lives and in acts of political participation. Other aspects of plural democracy, such as the rule of law, systems of checks and balances, freedom of the press, and so on are means to, or specific manifestations of, these general principles. We do not include coded data on civil liberties. The Democracy indicator is an additive eleven-point scale (0-10).”
Polity IV. Link: http://www.systemicpeace.org/polity/polity4.htm
POLIV_xconst
“Executive Constraints (Decision Rules): According to Eckstein and Gurr, decision rules are defined in the following manner: "Superordinate structures in action make decisions concerning the direction of social units. Making such decisions requires that supers and subs be able to recognize when decision-processes have been concluded, especially "properly" concluded. An indispensable ingredient of the processes, therefore, is the existence of Decision Rules that provide basic criteria under which decisions are considered to have been taken." (Eckstein and Gurr 1975, 121) Operationally, this variable refers to the extent of institutionalized constraints on the decision-making powers of chief executives, whether individuals or collectivities. Such limitations may be imposed by any "accountability groups." In Western democracies these are usually legislatures. Other kinds of accountability groups are the ruling party in a one-party state; councils of nobles or powerful advisors in monarchies; the military in coup-prone polities; and in many states a strong, independent judiciary. The concern is therefore with the checks and balances between the various parts of the decision-making process. A seven-category scale is used.”
Polity IV. Link: http://www.systemicpeace.org/polity/polity4.htm

34
POLIV_polcomp
“Political Competition: Concept variable combines information presented in two component variables: PARREG and PARCOMP (see variables 3.5 and 3.6 and Table 4.2 above). Political Competition concepts represent an alternative method for comprehending authority patterns and are explained in detail in Addendum C. “3.5 PARREG (all versions). Regulation of Participation: Participation is regulated to the extent that there are binding rules on when, whether, and how political preferences are expressed. One-party states and Western democracies both regulate participation but they do so in different ways, the former by channeling participation through a single party structure, with sharp limits on diversity of opinion; the latter by allowing relatively stable and enduring groups to compete nonviolently for political influence. The polar opposite is unregulated participation, in which there are no enduring national political organizations and no effective regime controls on political activity. In such situations political competition is fluid and often characterized by recurring coercion among shifting coalitions of partisan groups. A five-category scale is used to code this dimension…” “3.6 PARCOMP (all versions). The Competitiveness of Participation: The competitiveness of participation refers to the extent to which alternative preferences for policy and leadership can be pursued in the political arena. Political competition implies a significant degree of civil interaction, so polities which are coded Unregulated (1) on Regulation of Participation (PARREG, variable 2.5) are not coded for competitiveness. Polities in transition between Unregulated and any of the regulated forms on variable 2.5 also are not coded on variable 2.6. Competitiveness is coded on a five category scale…”
Polity IV. Link: http://www.systemicpeace.org/polity/polity4.htm
Capital IQ_Political Connections (%)
Fraction of the individuals affiliated with a given operator who have experience in the country's government (including as President) or in the parliament. Political “titles” are identified from the “Chiefs of State and Cabinet Members of Foreign Governments” directory published by the CIA (https://www.cia.gov/library/publications/world-leaders-1/SM.html). Names of all Presidents, Chancellors, Chairmen, Emirs ruling as of or after 1980 are identified from http://www.rulers.org/index.html. The experience is based on keyword searched in each person’s biography, as reported in Capital IQ.
CapitalIQ (for bios) and other sources
IEF_corruption
“Corruption erodes economic freedom by introducing insecurity and uncertainty into economic relationships. The score for this component is derived primarily from Transparency International’s Corruption Perceptions Index (CPI) for 2011, which measures the level of corruption in 183 countries. The CPI is based on a 10-point scale in which a score of 10 indicates very little corruption and a score of 0 indicates a very corrupt government. In scoring freedom from corruption, the Index converts the raw CPI data to a scale of 0 to 100 by multiplying the CPI score by 10. For example, if a country’s raw CPI data score is 5.5, its overall freedom from corruption score is 55. For countries that are not covered in the CPI, the freedom from corruption score is determined by using the qualitative information from internationally recognized and reliable sources.1 This procedure considers the extent to which corruption prevails in a country. The higher the level of corruption, the lower the level of overall economic freedom and the lower a country’s original IEF score.” We rescaled the index (= 100-original index), so that a higher number denotes higher corruption
Heritage Foundation. Link: http://www.heritage.org/index/explore?view=byregioncountryyear
WDI_GDPpcPPP
“GDP per capita based on purchasing power parity (PPP). PPP GDP is gross domestic product converted to international dollars using purchasing power parity rates. An international dollar has the same purchasing power over GDP as the U.S. dollar has in the United States. GDP at purchaser's prices is the sum of gross value added by all resident producers in the economy plus any product taxes and minus any subsidies not included in the value of the products. It is calculated without making deductions for depreciation of fabricated assets or for depletion and degradation of natural resources. Data are in current international dollars based on the 2011 ICP round.”
World Bank, "World Development Indicators". Link: http://data.worldbank.org/data-catalog/world-development-indicators

35
WDI_Population “Total population is based on the de facto definition of population, which counts all residents regardless of legal status or citizenship--except for refugees not permanently settled in the country of asylum, who are generally considered part of the population of their country of origin. The values shown are midyear estimates.”
World Bank, "World Development Indicators". Link: http://data.worldbank.org/data-catalog/world-development-indicators
WDI_Inflation
“Inflation as measured by the consumer price index reflects the annual percentage change in the cost to the average consumer of acquiring a basket of goods and services that may be fixed or changed at specified intervals, such as yearly. The Laspeyres formula is generally used.”
World Bank, "World Development Indicators". Link: http://data.worldbank.org/data-catalog/world-development-indicators
WDI_PopulationDensity
“Population density is midyear population divided by land area in square kilometers. Population is based on the de facto definition of population, which counts all residents regardless of legal status or citizenship--except for refugees not permanently settled in the country of asylum, who are generally considered part of the population of their country of origin. Land area is a country's total area, excluding area under inland water bodies, national claims to continental shelf, and exclusive economic zones. In most cases the definition of inland water bodies includes major rivers and lakes.”
World Bank, "World Development Indicators". Link: http://data.worldbank.org/data-catalog/world-development-indicators

Table 2. Summary Statistics
This table displays summary statistics for the variables used in the estimations. Price and financial variables were winsorized at the top/bottom 5%. Prices, all in US$s, are all PPP adjusted using the WB (GDP) conversion factors. Some of the variables are based on data from © GSMA Intelligence (2015). In all panels we report the average of a given variable in a given country during 2010-2014. For the definitions of the variables see Table 1.
Variable No. Obs Mean Std. dev. Min Max
REGULATORY VARIABLES
ITU_Regulatory Score 150 61.36 14.75 12.00 84.00
ITU_Cluster 1 (Independence of Regulator) 150 15.92 3.87 0.00 20.00
ITU_Cluster 2 (Power of Regulator) 150 16.82 3.63 4.00 22.00
ITU_Cluster 3 (Economies of Scale) 150 17.56 6.34 1.00 28.00
ITU_Cluster 4 (Foreign Competition) 150 10.98 5.41 0.00 16.00
ITU_Numberportability 146 0.96 0.86 0.00 2.00
ITU_IndividualsVoIP 141 1.78 0.61 0.00 2.00
ITU_SecondaryTradAlwd 148 0.40 0.75 0.00 2.00
ITU_Foreignparticip 119 1.83 0.42 0.00 2.00
ITU_RegulScoreMobileWRepl 150 4.29 2.18 0.00 8.00
ITU_RegulScoreMobileWORepl 116 5.20 1.74 0.00 8.00
COMPETITIVE STRUCTURE AND PRICING
C2 182 83.30% 13.19% 38.66% 100.00% Herfindahl-Hirschman Index (*10,000) 182 4,498 1,878 1,412 10,000
ITU_LackCompet5SectorsWReplac 150 2.81 2.99 0.00 10.00
ITU_LackCompet5SectorsWOReplac 120 1.85 2.41 0.00 10.00
Mobilecellular subbasket in USD 182 $26.48 $10.64 $10.07 $47.25
ITU_MInternet_PricePlan1G 161 $38.85 $24.73 $11.24 $100.28
ARPU by Connection (Mobile Phone) 182 $20.89 $10.42 $8.35 $48.74
EBITDA margin (Mobile Phone) 110 0.39 0.10 0.24 0.57
QUALITY OF THE SERVICE AND OTHER OUTCOMES
ConnectionsPct3GPlus 110 29.34% 22.51% 0.29% 95.11%
ConnectionsPct4G 110 2.43% 4.32% 0.00% 26.54%
NetworkCoverage3GPlus 173 58.87% 28.40% 10.50% 100.00%
NetworkCoverage4G 104 33.62% 24.96% 1.16% 98.63%
Speed, in Mbit/s 119 16.61 21.99 0.00 149.00
CapexTotal/Revenues 118 0.21 0.11 0.08 0.93
NumberOfBaseStations*100,000/Revenues 111 0.33 0.37 0.017 1.39
NumberOfEmployees*1000/Revenues 131 0.02 0.02 0.00 0.08
CostOfPersonnel/Revenues 58 0.09 0.05 0.03 0.29
SPECTRUM AUCTIONS Proceeds from all spectrum auctions/Mobile operators' aggregate revenues 182 0.08 0.16 0.00 0.55 Spectrum auction proceeds since 1999/ Mobile operators' aggregate revenues 182 0.08 0.15 0.00 0.55
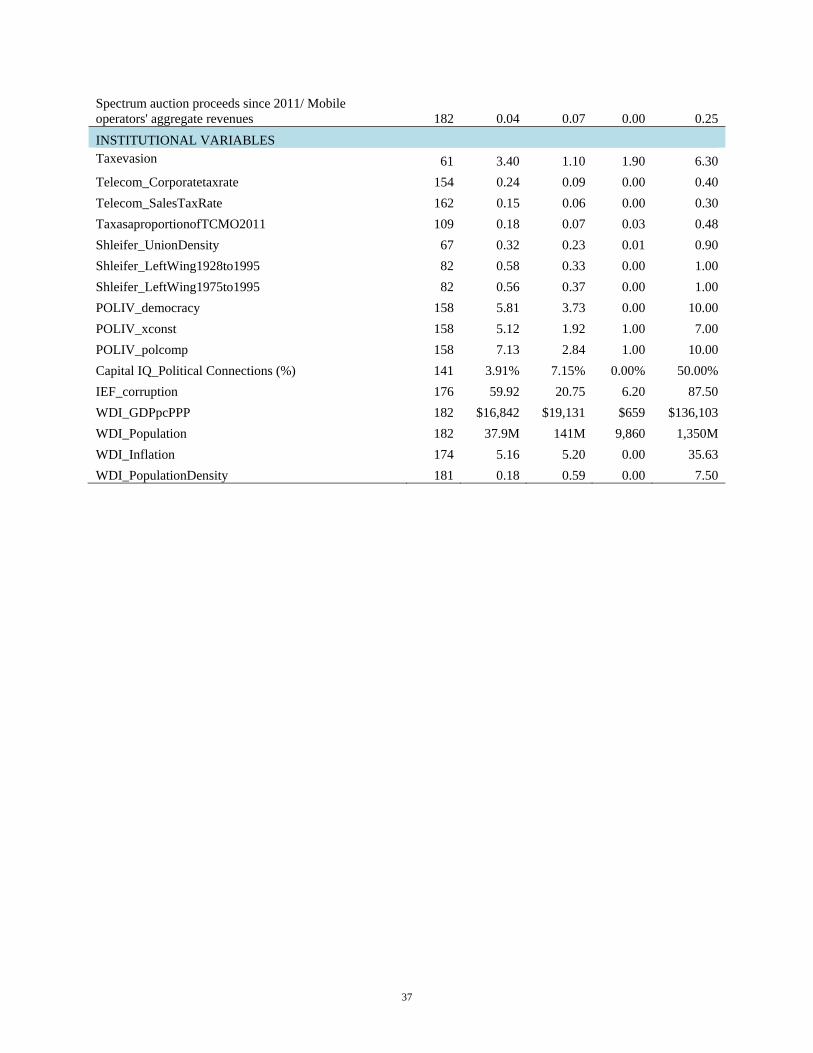
37
Spectrum auction proceeds since 2011/ Mobile operators' aggregate revenues 182 0.04 0.07 0.00 0.25
INSTITUTIONAL VARIABLES Taxevasion 61 3.40 1.10 1.90 6.30
Telecom_Corporatetaxrate 154 0.24 0.09 0.00 0.40
Telecom_SalesTaxRate 162 0.15 0.06 0.00 0.30
TaxasaproportionofTCMO2011 109 0.18 0.07 0.03 0.48
Shleifer_UnionDensity 67 0.32 0.23 0.01 0.90
Shleifer_LeftWing1928to1995 82 0.58 0.33 0.00 1.00
Shleifer_LeftWing1975to1995 82 0.56 0.37 0.00 1.00
POLIV_democracy 158 5.81 3.73 0.00 10.00
POLIV_xconst 158 5.12 1.92 1.00 7.00
POLIV_polcomp 158 7.13 2.84 1.00 10.00
Capital IQ_Political Connections (%) 141 3.91% 7.15% 0.00% 50.00%
IEF_corruption 176 59.92 20.75 6.20 87.50
WDI_GDPpcPPP 182 $16,842 $19,131 $659 $136,103
WDI_Population 182 37.9M 141M 9,860 1,350M
WDI_Inflation 174 5.16 5.20 0.00 35.63
WDI_PopulationDensity 181 0.18 0.59 0.00 7.50

Table 3. International Price Comparisons
For the definitions of the variables see Table 1. All prices are averages 2010-2014. p95/p5 is the ratio between the 95th percentile of the cross country distribution of prices and the 5th percentile. McDonald’s adjusted column is based on prices scaled by the price of a McMeal at McDonald’s (in each country) as reported in Numbeo.
Variable Actual prices PPP adjusted McDonalds adjusted
# Obs. p95/p5 # Obs. p95/p5 # Obs. p95/p5
McMeal at McDonald’s 98 2.9 98 3.2
Tradable20 98 5.5 98 3.9 98 4.4
Non-tradable21 98 5.5 98 3.5 98 3.6
Regulated22 98 11.1 98 6.7 98 7.9
Utilities23 98 5.1 98 3.7 98 5.2
Telecom24 98 10.2 98 7.5 98 7.8
Taxi25 98 17.2 98 8.1 98 9.2
Transportation26 98 13.7 98 6.4 98 9.1
20 Tradable goods include: (1) 1 Pair of Jeans (Levis 501 or Similar); (2) 1 Pair of Men Leather Business Shoes; (3) 1 Pair of Nike Running Shoes (Mid-Range); (4) 1 Summer Dress in a Chain Store (Zara, H&M,…) ; (5) Markets: Apples (1kg); (6) Markets: Chicken Breasts (Boneless, Skinless) (1kg); (7) Markets: Eggs (12); (8) Markets: Lettuce (1 head); (9) Markets: Loaf of Fresh White Bread (500g); (10) Markets: Local Cheese (1kg); (11) Markets: Milk (regular) (1 Liter); (12) Markets: Oranges (1kg); (13) Markets: Pack of Cigarettes (Marlboro); (14) Markets: Potato (1kg); (15) Markets: Rice (white) (1kg); (16) Markets: Tomato (1kg); (17) Markets: Water (1.5 liter Bottle); (18): Gasoline (1 liter); and (19) Volkswagen Golf 1.4 90KW Trendline (or Equivalent New Car). 21 Non-tradable goods include: (1) Restaurants: Cappuccino (regular); (2) Restaurants: Coke/Pepsi (0.33L Bottle); (3) Restaurants: McMeal at McDonald’s (or Equivalent Combo Meal); (4) Restaurants: Meal For 2 People, Mid-Range Restaurant, Three Course; (5) Restaurants: Meal, Inexpensive Restaurant; (6) Restaurants: Water (0.33L Bottle); (7) Cinema, International Release, 1 Seat; (8) Fitness Club, Monthly Fee for 1 Adult; and (9) Tennis Count Rent (1h on Weekend). 22 Regulated goods include: (1) Transportation: Monthly Pass Transport (Regular Price); (2) Transportation: One-way Ticket (Local Transport); (3) Transportation: Taxi 1h Waiting (Normal Tariff); (4) Transportation: Taxi 1km (Normal Tariff); (5) Transportation: Taxi Start (Normal Tariff); (6) Utilities (Monthly): Basic (Electricity, Heating, Water, Garbage) for 82m2 Apartment, (7) Utilities (Monthly): Internet (10 Mbps, Unlimited Data, Cable/ADSL), and (8) Utilities (Monthly): 1 Minute of Prepaid Mobile Tariff Local (No Discounts or Plans). 23 Utilities includes: (1) Utilities (Monthly): Basic (Electricity, Heating, Water, Garbage) for 82m2 apartment. 24 Telecom includes: (1) Internet (10 Mbps, Unlimited Data, Cable/ADSL); and (2) 1 Minute of Prepaid Mobile Tariff Local (No Discounts or Plans). 25 Taxi includes: (1) Taxi 1h Waiting (Normal Tariff); (2) Taxi 1km (Normal Tariff); (3) Taxi Start (Normal Tariff). 26 Transportation includes: (1) Monthly Pass Transport (Regular Price); and (2) One-way Ticket (Local Transport).

39
Table 4. Concentration, Prices, and Regulation
This table shows the effect of regulation on concentration and prices, after controlling for economic and demographic factors. Panel A reports cross-sectional OLS regressions; Panel B reports time-series regressions at the country-level with country fixed effects; Panels C-F report cross-sectional OLS regressions results for the 4 regulatory measures that are most important in explaining concentration and prices. The sample is restricted to countries with available data for the ITU mobile phone basket as well as with available data in GSMA. Territories are excluded from the sample. In the cross-sectional tests, the unit of observation is the 2010-2014 average of each given variable in each country. In the time-series tests, the unit of observation is the annual average of each variable in each country. The sample starts in 2003 as the regulatory score is not available for previous years. Some of the variables are based on data from © GSMA Intelligence (2015). Robust standard errors are reported in parentheses. * p<0.10, ** p<0.05, *** p<0.01.
Panel A. Cross-Sectional Country Level Regressions
C2
Herfindahl-Hirschman
Index
ITU_LackCompet5Sectors
WReplac
ITU_LackCompet5SectorsWOReplac
ITU_Mobilecellular subbasket in USD PPP
ITU_MInternet_PricePlan1G
GSMA ARPU by Connection USD
PPP
GSMA EBITDA margin
lnGDPpc -0.0131 -187.2* -0.0934 0.317 -1.119 -5.862*** 5.857*** -0.0318*** (0.00878) (106.6) (0.19) (0.21) (0.759) (2.012) (0.656) (0.00942)
lnpop -0.0377*** -362.4*** -0.0594 -0.0387 -0.167 -0.634 -0.19 -0.00163 (0.00537) (70.1) (0.1) (0.0936) (0.466) (1.178) (0.386) (0.00583)
WDI_PopulationDensity -0.00790* -40.88 -0.0436 -0.122 -2.499*** -0.73 2.542*** -0.00752 (0.00458) (61.42) (0.104) (0.0796) (0.816) (2.145) (0.604) (0.0244)
WDI_Inflation 0.00194 20.5 0.0495 0.203*** -0.617*** -0.564 -0.269*** -0.000466 (0.00163) (19.84) (0.0372) (0.0424) (0.211) (0.483) (0.0912) (0.00123)
ITU_Regulatory Score -0.00106 -18.52* -0.127*** -0.0916*** -0.0114 -0.322** -0.0992* -0.00106* (0.000701) (11.04) (0.0137) (0.0196) (0.065) (0.137) (0.0508) (0.000584)
Intercept 1.596*** 12717.3*** 12.14*** 4.405* 44.00*** 124.6*** -22.14*** 0.780*** (0.103) (1535.5) (2.548) (2.307) (10.15) (27.7) (8.429) (0.139)
Number of countries 148 148 148 120 148 138 148 94 R-sq 0.363 0.283 0.44 0.402 0.109 0.147 0.505 0.196 F 16.89 8.06 26.63 13.82 4.616 4.649 36.97 3.492
Panel B. Time-Series Country Level Regressions
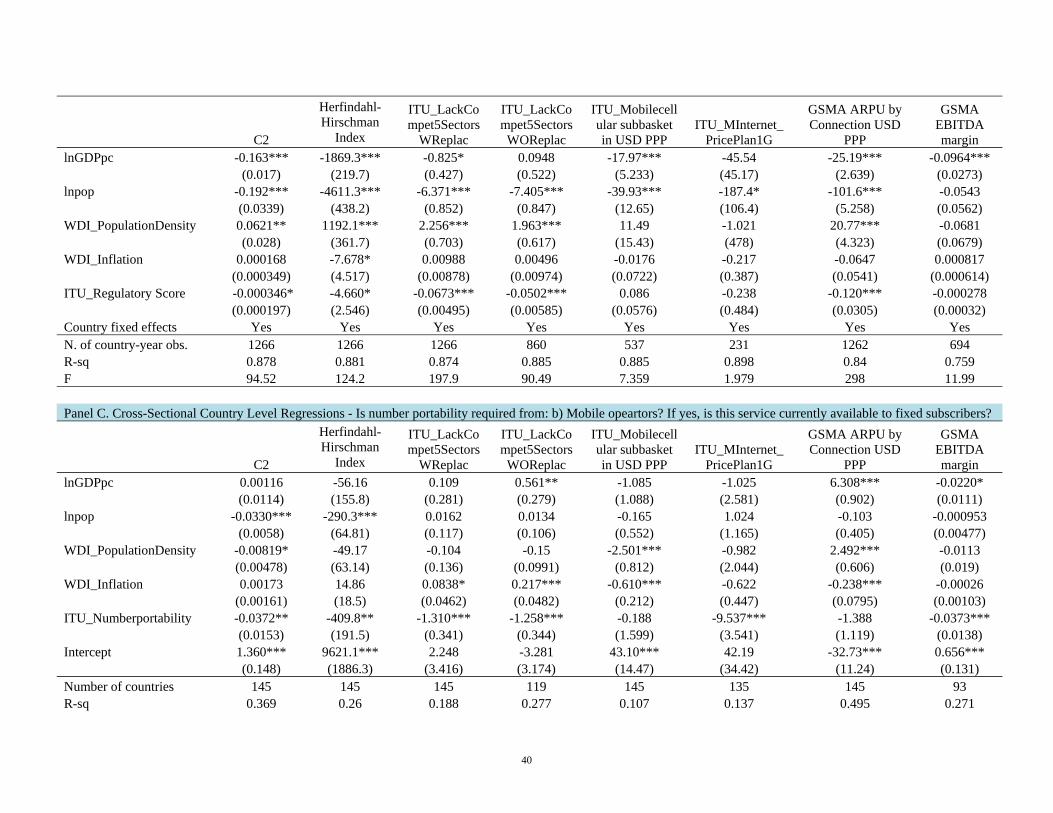
40
C2
Herfindahl-Hirschman
Index
ITU_LackCompet5Sectors
WReplac
ITU_LackCompet5SectorsWOReplac
ITU_Mobilecellular subbasket in USD PPP
ITU_MInternet_PricePlan1G
GSMA ARPU by Connection USD
PPP
GSMA EBITDA margin
lnGDPpc -0.163*** -1869.3*** -0.825* 0.0948 -17.97*** -45.54 -25.19*** -0.0964*** (0.017) (219.7) (0.427) (0.522) (5.233) (45.17) (2.639) (0.0273)
lnpop -0.192*** -4611.3*** -6.371*** -7.405*** -39.93*** -187.4* -101.6*** -0.0543 (0.0339) (438.2) (0.852) (0.847) (12.65) (106.4) (5.258) (0.0562)
WDI_PopulationDensity 0.0621** 1192.1*** 2.256*** 1.963*** 11.49 -1.021 20.77*** -0.0681 (0.028) (361.7) (0.703) (0.617) (15.43) (478) (4.323) (0.0679)
WDI_Inflation 0.000168 -7.678* 0.00988 0.00496 -0.0176 -0.217 -0.0647 0.000817 (0.000349) (4.517) (0.00878) (0.00974) (0.0722) (0.387) (0.0541) (0.000614)
ITU_Regulatory Score -0.000346* -4.660* -0.0673*** -0.0502*** 0.086 -0.238 -0.120*** -0.000278 (0.000197) (2.546) (0.00495) (0.00585) (0.0576) (0.484) (0.0305) (0.00032)
Country fixed effects Yes Yes Yes Yes Yes Yes Yes Yes N. of country-year obs. 1266 1266 1266 860 537 231 1262 694 R-sq 0.878 0.881 0.874 0.885 0.885 0.898 0.84 0.759 F 94.52 124.2 197.9 90.49 7.359 1.979 298 11.99
Panel C. Cross-Sectional Country Level Regressions - Is number portability required from: b) Mobile opeartors? If yes, is this service currently available to fixed subscribers?
C2
Herfindahl-Hirschman
Index
ITU_LackCompet5Sectors
WReplac
ITU_LackCompet5SectorsWOReplac
ITU_Mobilecellular subbasket in USD PPP
ITU_MInternet_PricePlan1G
GSMA ARPU by Connection USD
PPP
GSMA EBITDA margin
lnGDPpc 0.00116 -56.16 0.109 0.561** -1.085 -1.025 6.308*** -0.0220* (0.0114) (155.8) (0.281) (0.279) (1.088) (2.581) (0.902) (0.0111)
lnpop -0.0330*** -290.3*** 0.0162 0.0134 -0.165 1.024 -0.103 -0.000953 (0.0058) (64.81) (0.117) (0.106) (0.552) (1.165) (0.405) (0.00477)
WDI_PopulationDensity -0.00819* -49.17 -0.104 -0.15 -2.501*** -0.982 2.492*** -0.0113 (0.00478) (63.14) (0.136) (0.0991) (0.812) (2.044) (0.606) (0.019)
WDI_Inflation 0.00173 14.86 0.0838* 0.217*** -0.610*** -0.622 -0.238*** -0.00026 (0.00161) (18.5) (0.0462) (0.0482) (0.212) (0.447) (0.0795) (0.00103)
ITU_Numberportability -0.0372** -409.8** -1.310*** -1.258*** -0.188 -9.537*** -1.388 -0.0373*** (0.0153) (191.5) (0.341) (0.344) (1.599) (3.541) (1.119) (0.0138)
Intercept 1.360*** 9621.1*** 2.248 -3.281 43.10*** 42.19 -32.73*** 0.656*** (0.148) (1886.3) (3.416) (3.174) (14.47) (34.42) (11.24) (0.131)
Number of countries 145 145 145 119 145 135 145 93 R-sq 0.369 0.26 0.188 0.277 0.107 0.137 0.495 0.271

41
F 16.91 8.84 7.876 8.768 4.493 3.712 36.63 7.493
Panel D. Cross-Sectional Country Level Regressions - Are individual users allowed to make voice over IP (VoIP) or Internet telephony phone calls?
C2
Herfindahl-Hirschman
Index
ITU_LackCompet5Sectors
WReplac
ITU_LackCompet5SectorsWOReplac
ITU_Mobilecellular subbasket in USD PPP
ITU_MInternet_PricePlan1G
GSMA ARPU by Connection USD
PPP
GSMA EBITDA margin
lnGDPpc -0.0167* -272.3** -0.351 0.168 -0.843 -5.953*** 5.744*** -0.0401*** (0.0085) (114.1) (0.217) (0.161) (0.765) (1.95) (0.59) (0.00905)
lnpop -0.0398*** -392.9*** -0.218* -0.118 -0.0956 -0.871 -0.298 -0.00247 (0.0053) (70.26) (0.117) (0.106) (0.459) (1.18) (0.389) (0.0058)
WDI_PopulationDensity -0.00869* -60.12 -0.0433 -0.0918 -2.368*** -0.616 2.505*** -0.0047 (0.00473) (65.04) (0.184) (0.146) (0.73) (1.858) (0.621) (0.024)
WDI_Inflation 0.0027 32.75 0.0653 0.205*** -0.687*** -0.738* -0.316*** -0.000729 (0.00176) (24.09) (0.0591) (0.05) (0.183) (0.404) (0.101) (0.00121)
ITU_IndividualsVoIP -0.00654 73.47 -1.864*** -1.773*** -2.991* -11.00*** -2.732** -0.0256 (0.0186) (254.7) (0.482) (0.483) (1.555) (3.909) (1.351) (0.0157)
Intercept 1.606*** 12680.9*** 12.21*** 4.336** 44.95*** 129.1*** -20.41** 0.856*** (0.113) (1635.9) (2.832) (2.161) (10.67) (27.63) (8.601) (0.137)
Number of countries 140 140 140 116 140 130 140 89 R-sq 0.373 0.268 0.274 0.341 0.126 0.17 0.509 0.229 F 14.24 7.892 6.513 7.752 6.332 4.432 33.8 4.584
Panel E. Cross-Sectional Country Level Regressions - Is secondary trading (of the spectrum) allowed?
C2
Herfindahl-Hirschman
Index
ITU_LackCompet5Sectors
WReplac
ITU_LackCompet5SectorsWOReplac
ITU_Mobilecellular subbasket in USD PPP
ITU_MInternet_PricePlan1G
GSMA ARPU by Connection USD
PPP
GSMA EBITDA margin
lnGDPpc -0.0107 -202.3* -0.467** -0.0399 -1.343* -6.569*** 5.670*** -0.0298*** (0.00921) (118.1) (0.226) (0.191) (0.789) (2.209) (0.65) (0.0102)
lnpop -0.0370*** -364.9*** -0.182 -0.13 -0.273 -0.943 -0.201 -0.000649 (0.00559) (70.61) (0.126) (0.117) (0.484) (1.243) (0.394) (0.00581)
WDI_PopulationDensity -0.00599 -25.43 -0.0304 -0.0668 -2.611*** -0.689 2.674*** -0.0147 (0.00539) (67.88) (0.136) (0.101) (0.793) (2.113) (0.575) (0.0242)
WDI_Inflation 0.00182 22 0.0994* 0.217*** -0.582*** -0.42 -0.254*** -0.000703 (0.00162) (20.45) (0.0507) (0.0547) (0.208) (0.475) (0.0776) (0.000984)
ITU_SecondaryTradAlwd -0.0258** -256.0** -0.576** -0.441** 0.988 -1.648 -1.33 -0.0289** (0.0117) (111.2) (0.263) (0.209) (1.311) (2.249) (0.897) (0.0119)

42
Intercept 1.508*** 11845.1*** 9.557*** 3.402 46.47*** 115.7*** -26.08*** 0.693*** (0.12) (1634.4) (3.014) (2.547) (10.88) (31.71) (9.156) (0.143)
Number of countries 146 146 146 119 146 136 146 93 R-sq 0.371 0.271 0.161 0.224 0.11 0.111 0.489 0.238 F 18.07 8.972 8.401 8.267 4.844 3.301 40.11 7.365
Panel F. Cross-Sectional Country Level Regressions - Is foreign participation or ownership limited in the following market segment: Spectrum-based operators?
C2
Herfindahl-Hirschman
Index
ITU_LackCompet5Sectors
WReplac
ITU_LackCompet5SectorsWOReplac
ITU_Mobilecellular subbasket in USD PPP
ITU_MInternet_PricePlan1G
GSMA ARPU by Connection USD
PPP
GSMA EBITDA margin
lnGDPpc -0.0217** -357.8*** -0.657*** -0.205 -1.672* -4.839** 5.699*** -0.0510*** (0.00914) (119.3) (0.225) (0.201) (0.98) (1.986) (0.658) (0.00931)
lnpop -0.0433*** -441.3*** -0.279** -0.264** 0.207 -1.606 -0.635 -0.0124** (0.00567) (70.05) (0.119) (0.11) (0.564) (1.136) (0.464) (0.0052)
WDI_PopulationDensity -0.0082 -13.42 0.0383 -0.024 -2.040*** -0.0584 2.445*** -0.0036 (0.00571) (70.99) (0.141) (0.0922) (0.618) (1.482) (0.527) (0.0217)
WDI_Inflation 0.00267 17.3 0.0832* 0.188*** -0.639** -0.219 -0.220** 0.00118 (0.00181) (16.72) (0.0423) (0.0413) (0.277) (0.51) (0.109) (0.0011)
ITU_Foreignparticip -0.0767*** -1690.0*** -2.292*** -2.540*** 2.926 -15.61*** -5.310*** -0.0397* (0.0245) (402.8) (0.506) (0.513) (3.112) (5.909) (1.758) (0.0205)
Intercept 1.835*** 17536.6*** 16.44*** 11.40*** 36.74** 135.1*** -10.65 1.141*** (0.11) (2099.1) (3.249) (2.872) (16.83) (30.02) (11.32) (0.109)
Number of countries 119 119 119 101 119 111 119 78 R-sq 0.415 0.434 0.304 0.467 0.112 0.138 0.54 0.364 F 20.08 10.17 10.37 19.33 5.667 3.063 34.48 17.11

43
Table 5. Quality, Investment, and Employment
This table shows the effect of concentration, competition, and prices on other outcomes. Concentration, competition, and prices are instrumented with the ITU overall regulatory score. In Panel A the quality of the service is the dependent variable; in Panel B investment in capital expenditures is the dependent variable; in Panel C investment in base stations is the dependent variable; in Panel D employment is the dependent variable; in Panel E wages is the dependent variable. The sample is restricted to countries with available data for the ITU mobile phone basket as well as with available data in GSMA. Territories are excluded from the sample. The unit of observation is the 2010-2014 average of each given variable in each country. Some of the variables are based on data from © GSMA Intelligence (2015). Robust standard errors are reported in parentheses. * p<0.10, ** p<0.05, *** p<0.01.
Panel A: Quality - - IV regressions
ConnectionsPct3GPlus ConnectionsPct4G NetworkCoverage3GPlus NetworkCoverage4G Speed, in Mbit/s C2 -1.819 0.0327 -2.955 -0.451 -189.2
(1.533) (0.216) (2.089) (1.135) (269.9) lnGDPpc 0.137*** 0.0202*** 0.134*** 0.174*** -2.494
(0.0302) (0.00459) (0.044) (0.0238) (6.818) Lnpop -0.0385 0.00818 -0.0791 -0.0125 -6.95
(0.0619) (0.00905) (0.0823) (0.0441) (10.98) WDI_PopulationDensity 0.013 0.0110*** -0.0282 0.0279* -1.655
(0.0205) (0.00312) (0.0221) (0.015) (2.708) WDI_Inflation -0.00272 -0.00150* 0.00235 -0.00757*** 0.16
(0.00592) (0.000831) (0.00679) (0.00236) (0.78) Intercept 1.053 -0.323 3.044 -0.754 303.6
(2.364) (0.34) (3.321) (1.748) (450.2)
Number of countries 97 97 145 91 103 R-sq 0.131 0.335 . 0.609 . F 17.46 15.77 19.17 32.66 0.457
Panel B: CapexTotal/Revenues - - IV regressions
lnGDPpc -0.0375 -0.0367* -0.0312*** -0.0298*** -0.0278** -0.0499 -0.00916 -0.133
(0.0239) (0.021) (0.00793) (0.00971) (0.0125) (0.0873) (0.061) (0.537) lnpopulation -0.0213 -0.019 -0.00727 -0.0081 -0.00668 -0.00658 -0.011 -0.0247
(0.0475) (0.0401) (0.00673) (0.00714) (0.00678) (0.00953) (0.0148) (0.115) WDI_PopulationDensity/1000 -0.00294 -0.00186 0.000789 -0.00146 0.00913 0.00216 0.00608 0.02
(0.0149) (0.0117) (0.00629) (0.00584) (0.0252) (0.00608) (0.0147) (0.0809) WDI_Inflation 0.00276 0.00232 0.00214 0.00306 0.00355 -0.000791 0.00112 0.00133

44
(0.00328) (0.00214) (0.00174) (0.00279) (0.00598) (0.0116) (0.00258) (0.00401) C2 -0.37
(1.139) HHIndex -0.0000355
(0.000108) ITU_LackCompet5SectorsWReplac -0.00182
(0.00494) ITU_LackCompet5SectorsWOReplac 0.00359
(0.00788) ITU_Mobilecellular subbasket in USD PPP 0.00357
(0.0115) ITU_MInternet_PricePlan1GPPP -0.00498
(0.0216) GSMA ARPU by Connection USD PPP -0.00329
(0.00944) GSMA EBITDA margin -2.679
(13.68) Intercept 1.19 0.991 0.613*** 0.611*** 0.474 0.942 0.539*** 2.751
(1.883) (1.254) (0.152) (0.15) (0.392) (1.579) (0.191) (11.52)
# observations 105 105 105 87 105 99 105 101 R-sq 0.025 0.02 0.135 0.172 . . 0.077 . F 4.956 4.819 4.668 5.357 3.257 3.788 4.064 0.408
Panel C: NumberOfBaseStations*100,000/Revenues - - IV regressions
lnGDPpc -0.0184 -0.017 -0.0254 -0.0131 -0.0275 -0.101 -0.0196 -0.0476
(0.0338) (0.0505) (0.081) (0.046) (0.113) (0.0966) (0.0248) (0.0362) lnpopulation 0.0915 0.0935 0.0838*** 0.0872*** 0.0850** 0.0799** 0.0843*** 0.0948***
(0.118) (0.146) (0.0268) (0.0317) (0.0359) (0.0342) (0.0304) (0.0286) WDI_PopulationDensity/1000 0.00923 0.00935 -0.00338 0.00934 0.00374 0.272 0.00686 0.0205
(0.0544) (0.0558) (0.141) (0.0401) (0.0495) (0.182) (0.0339) (0.0328) WDI_Inflation 0.00774 0.00774 0.00551 0.00762 0.00863 0.0116 0.00812 -0.00895
(0.0107) (0.0107) (0.041) (0.0066) (0.00683) (0.00713) (0.00659) (0.0127) C2 0.201

45
(2.924) HHIndex 0.0000361
(0.000523) ITU_LackCompet5SectorsWReplac 0.00133
(0.0196) ITU_LackCompet5SectorsWOReplac 0.0567
(0.04) ITU_Mobilecellular subbasket in USD PPP -0.00387
(0.0551) ITU_MInternet_PricePlan1GPPP 0.00189
(0.00994) GSMA ARPU by Connection USD PPP 0.0011
(0.0161) GSMA EBITDA margin 0.131
(2.599) Intercept -1.222 -1.247 -0.754 -1.105 -0.901 -0.144 -0.939 -0.851
(4.422) (4.75) (2.471) (1.045) (0.624) (2.223) (0.607) (0.604)
# observations 96 96 96 91 96 72 96 77 R-sq 0.178 0.184 0.239 0.094 0.169 0.308 0.182 0.193 F 3.031 3.028 3.659 2.665 3.162 6.965 3.203 3.331
Panel D: NumberOfEmployees*1000/Revenues - - IV regressions
lnGDPpc -0.0104 -0.00641** -0.00431*** -0.00452** 0.0038 -0.00866 0.00447 -0.0109
(0.01) (0.00319) (0.0015) (0.00221) (0.026) (0.00606) (0.00575) (0.0131) lnpopulation -0.0112 -0.00577 -0.00229*** -0.00182** -0.0027 -0.00295 -0.00360** -0.00281
(0.0134) (0.00403) (0.00082) (0.000902) (0.00486) (0.00194) (0.00141) (0.00379) WDI_PopulationDensity/1000 -0.0000298 0.00097 0.00128* 0.00142** 0.0193 0.00148 0.00379** 0.00211
(0.00244) (0.000936) (0.000682) (0.000706) (0.0607) (0.00138) (0.00177) (0.00129) WDI_Inflation 0.000425 0.000197 0.000197 0.000135 0.00291 -0.000553 -0.000193 -0.00018
(0.000742) (0.000367) (0.000302) (0.000665) (0.00994) (0.000658) (0.000302) (0.000324) C2 -0.242
(0.335) HHIndex -0.0000109

46
(0.0000108) ITU_LackCompet5SectorsWReplac -0.00114
(0.000737) ITU_LackCompet5SectorsWOReplac -0.000382
(0.00121) ITU_Mobilecellular subbasket in USD PPP 0.00696
(0.0237) ITU_MInternet_PricePlan1GPPP -0.000954
(0.000997) GSMA ARPU by Connection USD PPP -0.00141
(0.000958) GSMA EBITDA margin -0.137
(0.302) Intercept 0.488 0.214 0.0973*** 0.0904*** -0.16 0.181 0.0663** 0.213
(0.571) (0.132) (0.0223) (0.0264) (0.838) (0.116) (0.0268) (0.286)
# observations 116 116 116 95 116 110 116 103 R-sq . . 0.092 0.092 . . 0.005 . F 0.758 2.091 3.887 3.276 0.125 1.092 2.71 1.869
Panel E: CostOfPersonnel/Revenues - - IV regressions
lnGDPpc 0.00542 0.0059 0.00861 0.0146 0.00843 -0.0109 0.021 0.00272
(0.0173) (0.0145) (0.0106) (0.012) (0.0113) (0.13) (0.0439) (0.02) lnpopulation -0.0162 -0.0141 -0.00910*** -0.00760** -0.00887*** -0.00317 -0.00991** -0.00962**
(0.0307) (0.0208) (0.00281) (0.00295) (0.00292) (0.0285) (0.00452) (0.00374) WDI_PopulationDensity/1000 -0.000494 0.000208 0.000952 -0.000162 0.00328 0.0065 0.00268 0.00213
(0.00747) (0.00473) (0.00294) (0.00306) (0.00764) (0.0367) (0.00541) (0.00353) WDI_Inflation 0.00204 0.00215 0.00177 0.00323 0.00184 -0.00436 0.00197 0.000883
(0.00287) (0.00288) (0.00214) (0.00248) (0.00232) (0.0361) (0.00245) (0.00321) C2 -0.169
(0.698) HHIndex -0.0000163
(0.0000635) ITU_LackCompet5SectorsWReplac -0.00109

47
(0.00366) ITU_LackCompet5SectorsWOReplac 0.00086
(0.00577) ITU_Mobilecellular subbasket in USD PPP 0.000948
(0.00338) ITU_MInternet_PricePlan1GPPP -0.00363
(0.0225) GSMA ARPU by Connection USD PPP -0.00144
(0.00484) GSMA EBITDA margin -0.0988
(0.319) Intercept 0.433 0.322 0.155 0.0642 0.128 0.371 0.0779 0.252
(1.186) (0.688) (0.128) (0.143) (0.164) (1.577) (0.277) (0.342)
# observations 51 51 51 45 51 47 51 51 R-sq . 0.013 0.115 0.117 0.063 . 0.081 0.08 F 2.627 3.206 4.53 4.991 3.426 1.051 4.796 4.339

Table 6. Regulation and Proceeds from Spectrum Auctions
This table shows the effect of regulation on the proceeds raised from spectrum auctions. In the first column, all auction proceeds, through 2014, reported in DotEcon are included. The second column only includes proceeds raised since 1999, i.e., when the first 3G auction was held. The last column only includes proceeds raised since 2011, i.e., when the first 4G auction was held. The sample is restricted to countries with available data for the ITU mobile phone basket as well as with available data in GSMA. Territories are excluded from the sample. Some of the variables are based on data from © GSMA Intelligence (2015). Robust standard errors are reported in parentheses. * p<0.10, ** p<0.05, *** p<0.01.
Y1 = Proceeds from all spectrum auctions/Mobile
operators' aggregate revenues
Y2 = Spectrum auction proceeds since 1999/
Mobile operators' aggregate revenues
Y3 = Spectrum auction proceeds since 2011/
Mobile operators' aggregate revenues
lnGDPpc 0.0410*** 0.0398*** 0.0101**
(0.0101) (0.0101) (0.00448)
lnpop 0.0342*** 0.0332*** 0.0115***
(0.00686) (0.00684) (0.00342)
WDI_PopulationDensity -0.00521 -0.00461 0.00379
(0.00748) (0.00756) (0.0052)
WDI_Inflation -0.00271 -0.0026 -0.00182**
(0.00189) (0.00188) (0.000883)
ITU_Regulatory Score 0.00280*** 0.00280*** 0.00118**
(0.00088) (0.000875) (0.000521)
Intercept -0.978*** -0.953*** -0.296***
(0.142) (0.142) (0.0677)
Number of countries 148 148 148
R-sq 0.373 0.362 0.216
F 14.24 13.58 8.281

Table 7. Public Interest and Regulation
This table investigates the impact of public interest related variables on the regulation in place in the telecommunication sector. The dependent variable is the overall regulatory score. For the definitions of the variables see Table 1. Robust standard errors are reported in parentheses. The sample is restricted to countries with available data for the ITU mobile phone basket as well as with available data in GSMA. Territories are excluded from the sample. The unit of observation is the 2010-2014 average of each given variable in each country. Robust standard errors are reported in parentheses. * p<0.10, ** p<0.05, *** p<0.01.
(1) (2) (3) (4) (5) (6) (7) lnGDPpc 8.548*** 4.317*** 4.363*** 6.196*** 5.189*** 3.000*** 3.422***
(1.668) (1.085) (1.141) (1.158) (1.336) (1.03) (0.992) lnpopulation -0.896 1.117** 1.056 0.239 -0.927 -0.799 -0.759
(0.917) (0.531) (0.732) (0.692) (1.205) (0.884) (0.907) WDI_PopulationDensity/1000 -0.275 0.893 0.484 4.12 -0.698 -0.459 -0.488
(0.522) (0.631) (0.613) (3.419) (0.559) (0.484) (0.52) Tax Evasion -2.128
(1.276) Telecom_Sales Tax Rate 46.03***
(15.89) Telecom_Corporate Tax Rate -6.235
(14.52) Taxes as a proportion of TCMO 2011 (for mobile phone) 43.15**
(17.22) Shleifer_UnionDensity -5.572
(6.215) Shleifer_LeftWing1928to1995 -8.334**
(3.66) Shleifer_LeftWing1975to1995 -3.677
(3.565) Intercept 6.989 -2.886 6.34 -4.887 35.54 57.70*** 50.27**
(23.44) (13.74) (14.33) (18.09) (25.44) (18.7) (19.67) # observations 55 140 132 95 61 75 75 R-sq 0.273 0.163 0.136 0.346 0.195 0.203 0.162 F 9.134 7.832 6.377 9.503 4.285 5.535 4.526

50
Table 8. Political Determinants of Regulation
This table investigates the impact of political factors on the regulation in place in the telecommunication sector. For the definitions of the variables see Table 1. Robust standard errors are reported in parentheses. The sample is restricted to countries with available data for the ITU mobile phone basket as well as with available data in GSMA. Territories are excluded from the sample. The unit of observation is the 2010-2014 average of each given variable in each country. Robust standard errors are reported in parentheses. * p<0.10, ** p<0.05, *** p<0.01.
(1) (2) (3) (4) (5) (6) GDPpc 2.746** 3.085*** 3.457*** 4.937*** 1.686 2.895
(1.122) (1.082) (1.038) (1.179) (1.607) (1.929) lnpopulation 1.064* 0.979 1.102* 0.823 1.449** 1.078
(0.621) (0.629) (0.613) (0.564) (0.583) (0.696) WDI_PopulationDensity/1000 2.097*** 2.010*** 2.689*** 1.026 -0.168 2.098**
(0.715) (0.714) (0.797) (0.772) (0.564) (0.823) POLIV_democ 1.579*** 1.215***
(0.399) (0.443) POLIV_xconst 2.879***
(0.744) POLIV_polcomp 2.221***
(0.52) Capital IQ_Political Connections (%) -43.58** -32.72*
(18.98) (19.33) IEF_corruption -0.249*** -0.0562
(0.0784) (0.0795) Intercept 9.484 2.253 -4.428 5.388 37.40* 15.08
(13.58) (13.94) (13.93) (13.92) (19.55) (24.05) # observations 132 132 132 124 148 116 R-sq 0.283 0.264 0.311 0.175 0.222 0.281 F 11.57 10.94 12.42 6.979 14.31 6.773