political apathy? the evolution of political engagement of … could be summed up by the increase of...
TRANSCRIPT

Young People and Political Participation: European Research 125
(1)
This research was possible
thanks to the “Support for
Sociological Research” given by
the Centre for Sociological
Researches in 2006. The original
title of this study is: Young
Spanish people and politics:
methodological analysis and
reflection through surveys
carried out by the CIS (Centre
for Sociological Researches).
(2)
Among others, we can highlight
the activities promoted by the
Council of Europe since 1997
that culminated with the
declaration of the year 2005 as
the “European Year for
Citizenship through Education”
by the European Council of
Ministers. Said declaration, as
well as reports regarding
activities carried out by the
European Commission during
2005 can be found in:
http://www.coe.int/T/E/Cultural_
Co-operation/education/E.D.C/.
The European Union also
considered the need of
promoting active citizenship
among young Europeans
(European Commission, 2003).
Political apathy? The evolution ofpolitical engagement of the Spanishyouth since the 1980’s (1)
It is usual to hear comments about the “political apathy” of the Spanish youth, but several researches
have shown that, in comparison to the rest of the population, young Spanish people are not as
different. This article complements previous studies, as it includes a double comparative perspective:
we analyze political engagement of young Spanish people compared to adults and throughout time.
The results show the need of clarifying the characterization of political engagement of the Spanish
youth. On the one side, it is true that they vote less and move away from political parties. But on the
other side, several indicators like interest in politics and frequency of discussion about political issues
deny the thesis of “political apathy”, or at least they show that young people are not more apathetic
than the rest of the population. We will also show evidences of the limitations of considering young
people as a homogeneous group, as attitudes and forms of participation are quite different when we
consider different age groups of young people.
Key words: political engagement, youth and politics, political attitudes,
political participation, life cycle.
Gema M. García-Albacete. U. Autónoma of Madrid / U. of Mannheim.DOCUMENTS
7
Introduction
The concerns regarding young people moving away from politics, which
several institutions and the media have highlighted, has resulted in numerous
national and international initiatives (2). They confirmed the decrease of
interest in politics of the citizens in general, and the young citizens in
particular, their disaffection towards different democratic institutions and
their apathy regarding traditional forms of participation. At the same time,
we underlined the need of clarifying these results and illustrating them with
regard to the general cultural change that affects the whole society. In the
Spanish context, the introduction of a new subject in schools, “Education in
Citizenship and Human Rights” also insists on the promotion of democratic
knowledge and abilities among the youngest citizens and encourages the
debate around the need of promoting values and democratic participation
of young people.
As we will see, and in spite of the relevance of the relation between the
citizens and the younger citizens, existing researches are very fragmented in
terms of their approaches and even reach very different conclusions. In this
work we will try to contribute to fill the gap with regard to the identification
of the strengths and weaknesses of political engagement of the Spanish
youth. In order to do so, we analyzed political attitudes and behaviours of
young Spanish people using the data provided by different surveys and
comparing commonly used indicators. We will use a double comparative
perspective: throughout time and in comparison to adults at different
moments in time.
The framework of this work is as follows: In the first place, we will present a
summary of the researches that have been carried out about political
attitudes and behaviours of young citizens, in Spain as well as in other
countries. Then we will reflect on the methodology of youth studies used in
Spain, emphasizing samples and available data, and on the suitability of
these data for the needs of age studies. Lastly, we will present and discuss
the results of the analysis carried out about attitudes and political
participation of the Spanish youth.
What do we know about the relation between youngpeople and politics?
In the following paragraphs we will try to present a brief summary of the
main researches carried out (3). In the first place, we will focus on the data
regarding attitudes and forms of political participation of young people in
other Western democracies. Then we will present a summary of the
researches that have studied this relation in Spain. We will present
information about political attitudes and forms of participation of young
Spanish people, several interpretations found in the literature, and the
contribution this article wants to make to this issue.
There are empirical evidences of the decrease of voter participation of
young people in numerous Western democracies (Blais, Gidengil, & Nevitte,
2004; Ellis, Gratschew, Pammett, & Thiessen, 2006; IDEA, 1999; Saha, Print, &
Edwards, 2005). Regarding the attitudes towards politics, and in comparison
to previous generations, young people show higher levels of distrust in the
government and their co-citizens, are less interested in politics and public
issues, their knowledge of political institutions and the democratic process is
deficient, they are less interested in political information and less willing to
participate in elections and other activities (Bennett, 1997; Delli Carpini,
2000; Pirie & Worcester, 1998, 2000). At the same time, younger generations
have been identified as the main actors of the decrease of civic engagement,
one of the key elements of the performance of democratic governments
(Putnam, 2000).
These results correspond to studies carried out in the United States, Great
Britain and Canada. In the European context, the EUYOUPART project has
studies the attitudes of young people towards politics in eight European
countries (4). The conclusions of this study show a great diversity –in
terms of the levels of psychological engagement, as well as in the forms
and levels of participation– depending on the analyzed country. In general,
young people in Europe share distrust in political parties and politicians,
although a high percentage of young people say they feel close to one or
another political party. Regarding participation, they consider the act of
voting as the most efficient way to influence on the decisions of society,
followed by contacting the media and the collaboration with NGO’s
(EUYOUPART, 2005).
The context of these studies offers a similar profile of the new generations:
they are not interested in politics, distrust traditional political institutions
–specially the political parties– and are less willing to make use of
conventional participation, above all, of voting. The conclusion of all these
126 YOUNG PEOPLE’S STUDIES MAGAZINE ‡ june 08 |nº 81
(3)
This bibliographic summary
does not try to be a
comprehensive analysis of the
published literature; on the
contrary, it tries to provide
information about studies
carried out in other countries.
We mean to confirm or identify
certain hypothesis that will
allow us to interpret the results
of this work. A thorough
revision can be found in Martin
& Garcia, 2006.
(4)
These countries are: Austria,
Estonia, Finland, France,
Germany, Italy, Slovakia and
United Kingdom. Information
about this research project and
a final report can be found in:
http://www.sora.at/de/start.asp
?b=236

studies could be summed up by the increase of political apathy among
young people. This apathy affects the two dimensions of the analysis in this
paper: attitudes and behaviour.
Which is the reason for these changes? Different –even conflicting–
interpretations have been provided. There are those that say that there is not
a crisis of political citizen engagement among the new generations
(Gauthier, 2003; Henn, Weinstein, y Forrest, 2005; Kovacheva, 2005; O’Toole,
Lister, Marsh, Jones, y McDonagh, 2003), and those who think these
transformations have to be analyzed in terms of the effect of social change
of values and culture of the citizenship in post-industrial countries (Bennet,
1998; Inglehart, 1990) and the appearance of new forms of political
participation and engagement (Michele Micheletti, Follesdal, y Stolle, 2004;
M. Micheletti y Stolle, 2005). We also cannot forget the classical
interpretation of political participation: the participation of young people is
different due to the life-cycle effect. As they become adults, their levels of
political participation and engagement will increase. However, several studies
already showed that young people’s participation is different from adults’
participation (Barnes y Kaase, 1979; Jennings y van Deth, 1989; Kaase, 1986;
Milbrath, 1965).
Lastly, some authors have pointed out specific reasons. Among them,
distrust in political parties is mentioned numerous times. The role of the
“agency” in political mobilization has been studied in detail. People
participate in politics not only for who they are, but also as a result of
political options and offered incentives (Verba, Scholzman & Brady, 1995).
Political parties play a fundamental role as instruments of political
participation, mediation and mobilization. We know that the decrease of
affiliation and identification with a political party is general in all democratic
societies, particularly among young people (Dalton, 2000: 31). Some authors
think that political parties have failed to promote incentives directed to
young people (Henn et al., 2005). The professionalization of political parties
and the importance of the media are the main causes. Political campaigns
and marketing specifically directed to key voter groups have left young
voters outside. Therefore, politicians and the media have promoted young
people’s perception of political parties and democratic institutions as being
irrelevant for their personal life.
And Spain?
There are many studies that state that a majority of the young Spanish
population is not interested in politics and that their level of civic
engagement is very low (INJUVE, 2003, 2005a, 2005b; Valls, 2006). During
the last 20 years feelings of distrust, indifference and annoyance towards
politics and especially towards politicians have increased (INJUVE, 2005b).
Some studies provide a more complex view of the relation between young
people and politics (Megías, Rodriguez & Navarro, 2005). These types of
study are very useful in order to understand the relation between young
Spanish people and politics, but they need to be more exhaustive if we want
to reach relevant conclusions. With the high levels of political disaffection
and the low levels of citizen participation of Spanish people, we could think
that youth is not too engaged with politics in general terms, but let us
compare young people’s engagement to the rest of the Spanish population
before we make any assumptions.
Young People and Political Participation: European Research 127

The indicators of legitimacy of the democratic system in Spain show great
stability in spite of the extraordinary social, economic and, above all, political
changes, but they also show high levels of political disaffection (5) (Bonet,
Martín, y Montero, 2004; Montero et al., 1998).
Several studies show that there are no evidences of the fact that new
generations that where socialized –or even born– in democracy are more
committed to politics than previous generations. According to Martín
(2004), the analysis of the interest in politics and the patterns of
participation of younger cohorts and the comparison to older cohorts of the
same age show a clear pattern: interest in politics is lower among today’s
young generations than among young generations in the past (6).
Feelings of disaffection towards politics, or cynicism, have frequently been
interpreted as a possible reason for the decrease of political activism (Norris,
2002). Truth is that levels of participation in Spain are lower than in other
European countries. However, non-conventional participation is not as low as
the levels of disaffection might make us think. Levels of non-conventional
participation, particularly participation in demonstrations, are higher than
expected, and show potential for political mobilization (Ferrer, 2005; Ferrer,
Medina, y Torcal, 2007; Fraile, Ferrer, y Martín, 2007). Although a detailed
analysis of the participation in demonstrations shows us that it is mostly the
students, that is, a specific group of the population, who go to
demonstrations (Caínzos, 2006).
On the other side, Morales (2005) concludes that available data do not
prove this lower participation of today’s young generation in comparison to
previous generations, rather the opposite, although their participation is
focused on the collaboration with organizations that have less political
objectives. In general, we cannot say that youth is so different in comparison
to the rest of the population regarding patterns of political participation
(Ferrer, 2006).
With this brief summary of the different studies we wanted to show the
fragmentation and the contradictions in this field of research. In this article,
we aim to include a different comparative perspective of the relation
between youth and politics. If we want to understand to what extent political
engagement of today’s generations of young people is different, we have to
compare them to previous generations of the same age.
Some methodological considerations about studies of age
When studying the relation between age and political culture and
behaviour we have to take into account several methodological problems.
Among the empirical analysis of surveys, the greatest challenge is to
distinguish and identify three effects: the life-cycle effect, the cohort effect
and the period effect (7). Ideally, the identification of these three effects
requires panel data of different moments in time of the same individuals
and during long periods of time. In this sense, the discontinuity of the
surveys greatly limits the possibilities of carrying out comparisons and
studying the evolution of political attitudes and behaviours. Lastly,
representative youth studies rarely include indicators that allow studying
levels of political participation beyond voting. This implies working with
representative samples of the population, which usually do not include a
128 YOUNG PEOPLE’S STUDIES MAGAZINE ‡ june 08 |nº 81
(5)
These authors understand
political disaffection as the
following group of attitudes:
lack of interest, inefficiency,
cynicism, distrust,
disconnection, frustration,
rejection, hostility and
alienation towards politics and
political institutions (Montero,
Gunther & Torcal, 1998: 25)
(6)
Moral (2003) reaches the same
conclusion regarding young
people’s interest in politics.
(7)
The first effect refers to the
differences related to the stage
of life in which the individual is,
as interests and attitudes are
not always the same during
youth, adulthood or after
retirement. The cohort effect
refers to the existence of age
groups, or generations, with
differentiated attitudes due to
different political socialization
contexts. Lastly, the period
effect is related to the influence
of certain historical events on
individual attitudes that have
different consequences for
each group or age cohort or
even within the same group.

sufficient number of cases to establish distinctions between age groups.
Therefore, we tried to combine several representative surveys of the
Spanish population with specific youth surveys.
At the same time, there are also a series of conceptual limitations: the
delimitation of youth as a stage of the life cycle. Frequently, the definition of
young people in studies about political participation is pretty arbitrary;
sometimes, young people are defined as people between 18 and 29 years of
age, or between 18 and 25, or even between 15 and 24. The definition is
usually limited by the size of the sample. In this article, we have tried to
avoid the definition of young people as a homogeneous group, for several
reasons. In the first place, we know that political participation is related to
the life cycle of the individual and therefore, defining young people as
people between 18 and 29 years of age could hide some important
differences. We cannot assume that young people who are still in the
education system will have the same attitudes and disposition towards
participation as those who have been working for years now. But we can
assume that the engagement of young people who only recently acquired
civic rights like voting will be different than the engagement of those who
already had the opportunity of participating in several elections.
The second reason is related to the dynamism of the concept itself. Does it
mean the same to be young today than 20 years ago? Well, it is acceptable
to say no. The changes in this stage of life have been significant: longer
periods in the education system, delay of the access to the labour market,
the flexibilization of the labour market, etc. Also the conditions of
socialization have changed. In the case of Spain, previous generations
acquired their rights a lot later than today. Another relevant difference in the
field of studies about political participation is the level of education, that is,
the percentage of young people with higher education levels is a lot higher
than among previous generations.
On the other side, although we do not try –in the framework of this article–
to carry out a generational study, the data presented in the following
paragraphs could be used to find a possible definition of new generations for
future researches. Studies carried out in Spain using a generational approach
(8) usually only include young people who were already socialized in
democracy. This is a consequence of the limitations and the range of the
available data. As years pass, we will have to face the challenge of
identifying new generations, as already happened in other countries (Pirie,
1998) (9). For example, if we consider those young people between 18 and
29 years of age today, all of them were born in democracy, but their political
socialization took place during a period of 10 years, therefore we cannot
assume that the events during their socialization were the same or that they
were affected by them in the same way (10).
Another weakness of some studies about young people and politics is the
fact that they focus whether on attitudes or behaviour, but many times
they directly link these concepts to “political apathy”. Although the
relation between attitudes and political participation can be ambiguous,
making it difficult to distinguish between cause and effect –or precisely for
that reason– we can assume that there are differences between young
people and adults. Therefore, and again highlighting the descriptive
character of this work, we have decided to analyze attitudes as well as
forms of participation.
Young People and Political Participation: European Research 129
(8)
Among them, we should
highlight: Martín (2004),
Morales (2005) and Montero,
Gunther & Torcal (1998).
(9)
In this sense, after the
generation X, researchers
identified a “millennium”
generation in Great Britain.
(10)
In Spain, a recent study has
identified and conceptualized
two generations of young
people socialized in democracy:
generation X (those born
between 1972 and 1980) and
generation Y (born between 1981
and 1988) (Fraile et al., 2007).

Considerations about the data and the design of the study
After a comprehensive study of numerous available surveys we found that
there was certain diversity in the formulation of questions and the categories
of answers. In spite of it we have made an effort to develop temporal series
of several indicators (11).
With regard to the selection of indicators we tried to include the highest
possible number of political attitudes and behaviours, which also was limited
by the data available. In any case, we developed indicators for most of the
dimensions that interested us, with one important exception: feeling of
internal and external efficiency of citizens. Regarding the attitudes towards
democratic institutions, only two of the studies included questions about this
issue and the formulation of the questions did not coincide, which made us
leave this dimension out of the analysis.
The independent variable of this study is obviously age. To select the
categories of age we took into account the already mentioned
methodological considerations, as well as some limitations imposed by the
selected datasets (12). A way to overcome these limitations and avoid treating
youth as a homogeneous group was to divide young people into four groups
(15 to 17, 18 to 21, 22 to 25 and 26 to 29 years of age). That way, although not
having data for all groups throughout time, the meaning of the indicators is
not distorted. With regard to adults, they were divided into two groups, those
between 30 and 64 years of age, and those over 65. This last differentiation
aims to control the relation between the life-cycle effect and political
participation that, as we know, usually shows an inverted curved relation.
Political culture of young people in Spain: Persistence or change?
We underlined the importance of political attitudes to explain citizen
engagement. Almond and Verba (1970) defined “civic culture” as the group
of political orientations that contribute more to the support and
development of the democratic system. In the following sections we will
analyze three types of attitudes: legitimacy of the democratic regime,
interest in politics and attitudes towards political parties.
Attitudes towards democracy: legitimacy
An important indicator for every study about political culture is the legitimacy
of the political system. As proven by previous studies, support of democracy is
very high among the Spanish population and presents high levels of stability
throughout time (Montero et al., 1998). Are there differences regarding the
opinion about democracy between young people and adults? Chart 1 shows
that support of democracy in Spain has increased during the last two decades
among all age groups, but there are also differences between the young
people and the rest of the population. The support of democracy increases
among older people. Especially significant is the difference between young
people under 18 and the rest, as many of them are in accordance with the
statement “to people like me it does not matter”. This difference can be found
in the data available for the years 1994, 2000 and 2003.
If we focus on the evolution of the feeling of legitimacy towards the political
system we can see how support of democracy is no longer inversely related
130 YOUNG PEOPLE’S STUDIES MAGAZINE ‡ june 08 |nº 81
(11)
Due to different formulations of
the questions, the temporal
evolution of some indicators
has to be interpreted with
caution. In these cases, we have
highlighted and presented each
of the different results. In any
case, comparison between
different age groups at
different moments in time was
not affected by this problem.
(12)
Specifically, while youth surveys
and studies include young
people between 15 and 29
years of age, studies by the CIS
only include people over 18.
Furthermore, the only study
with a representative sample of
young people and a survey for
the whole Spanish population is
divided in two datasets, and
the one referring to young
people only includes
interviewees between 15 and 24
years of age (CIS n. 2105).

to age, as in 1980, but shows a curved relation. This change is not the
consequence of less support by young people, but more support by adults
and, above all, the decrease of the percentage of those who answer: “Do not
know” or “Do not answer”.
Young People and Political Participation: European Research 131
(13)
The interest in politics in 2000
could be overrepresented, as
the question was about
“interest in national politics”. In
any case, results are very
similar in 2000 and 2005.
Chart 1. Attitudes towards democracy. Evolution 1980-2003
Source: CIS (several surveys; 1989 (CIS1788/CIS1813), 1994 (CIS 2105/CIS2107)
y 2000(CIS2370/CIS2387)
Therefore, we can conclude that young people support democracy the same
way as adults do, although this feeling develops with age. We have also seen
that there are significant differences between young people, especially
among people under 18: around 20% of them state that “it does not matter
for someone like me”.
Attitudes towards politics: interest
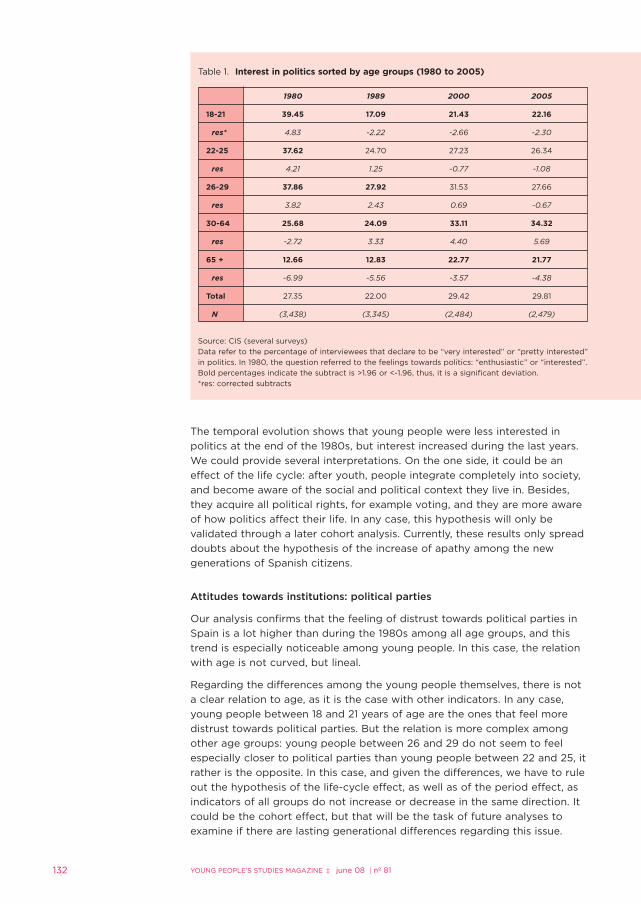
Interest in politics is the most used indicator of psychological engagement in
studies about political culture. In this case, we analyze subjective political
interest (Van Deth, 1989). As shown in previous studies, interest in politics in
Spain is low (Martín, 2004; Montero et al., 1998). Available data show that
the percentages of interviewees that are very or pretty interested in politics
never exceed 35% (see Table 1). Young people are also less interested in
politics than adults, but here we also have to add some riders. The evolution
of this indicator shows that the interest in politics of young people was much
higher during the first years of democracy, in the 1990’s it decreased, but
recently (2000 and 2005) data show certain increase among all age groups,
also among young people (13). Besides, we can see interesting differences
between groups of young people. Young people between 18 and 21 are less
interested in politics and speak less about politics with family and friends,
but as age increases their psychological engagement seems to increase. The
interest in politics of young people between 22 and 29 is then similar to the
interest of the rest of the population.
132 YOUNG PEOPLE’S STUDIES MAGAZINE ‡ june 08 |nº 81
The temporal evolution shows that young people were less interested in
politics at the end of the 1980s, but interest increased during the last years.
We could provide several interpretations. On the one side, it could be an
effect of the life cycle: after youth, people integrate completely into society,
and become aware of the social and political context they live in. Besides,
they acquire all political rights, for example voting, and they are more aware
of how politics affect their life. In any case, this hypothesis will only be
validated through a later cohort analysis. Currently, these results only spread
doubts about the hypothesis of the increase of apathy among the new
generations of Spanish citizens.
Attitudes towards institutions: political parties
Our analysis confirms that the feeling of distrust towards political parties in
Spain is a lot higher than during the 1980s among all age groups, and this
trend is especially noticeable among young people. In this case, the relation
with age is not curved, but lineal.
Regarding the differences among the young people themselves, there is not
a clear relation to age, as it is the case with other indicators. In any case,
young people between 18 and 21 years of age are the ones that feel more
distrust towards political parties. But the relation is more complex among
other age groups: young people between 26 and 29 do not seem to feel
especially closer to political parties than young people between 22 and 25, it
rather is the opposite. In this case, and given the differences, we have to rule
out the hypothesis of the life-cycle effect, as well as of the period effect, as
indicators of all groups do not increase or decrease in the same direction. It
could be the cohort effect, but that will be the task of future analyses to
examine if there are lasting generational differences regarding this issue.
Table 1. Interest in politics sorted by age groups (1980 to 2005)
1980 1989 2000 2005
18-21 39.45 17.09 21.43 22.16
res* 4.83 -2.22 -2.66 -2.30
22-25 37.62 24.70 27.23 26.34
res 4.21 1.25 -0.77 -1.08
26-29 37.86 27.92 31.53 27.66
res 3.82 2.43 0.69 -0.67
30-64 25.68 24.09 33.11 34.32
res -2.72 3.33 4.40 5.69
65 + 12.66 12.83 22.77 21.77
res -6.99 -5.56 -3.57 -4.38
Total 27.35 22.00 29.42 29.81
N (3,438) (3,345) (2,484) (2,479)
Source: CIS (several surveys)
Data refer to the percentage of interviewees that declare to be “very interested” or “pretty interested”
in politics. In 1980, the question referred to the feelings towards politics: “enthusiastic” or “interested”.
Bold percentages indicate the subtract is >1.96 or <-1.96, thus, it is a significant deviation.
*res: corrected subtracts

For now, we can take a closer look at other attitudes towards political
parties that may help us interpreting said differences (14). First, there are
two positive indicators of the role played by political parties: political parties
as the key element for democracy and their role as agents to facilitate
participation of citizens. And second, two clearly negative attitudes:
“political parties only divide people” and “political parties criticize each
other, but they are all the same”.
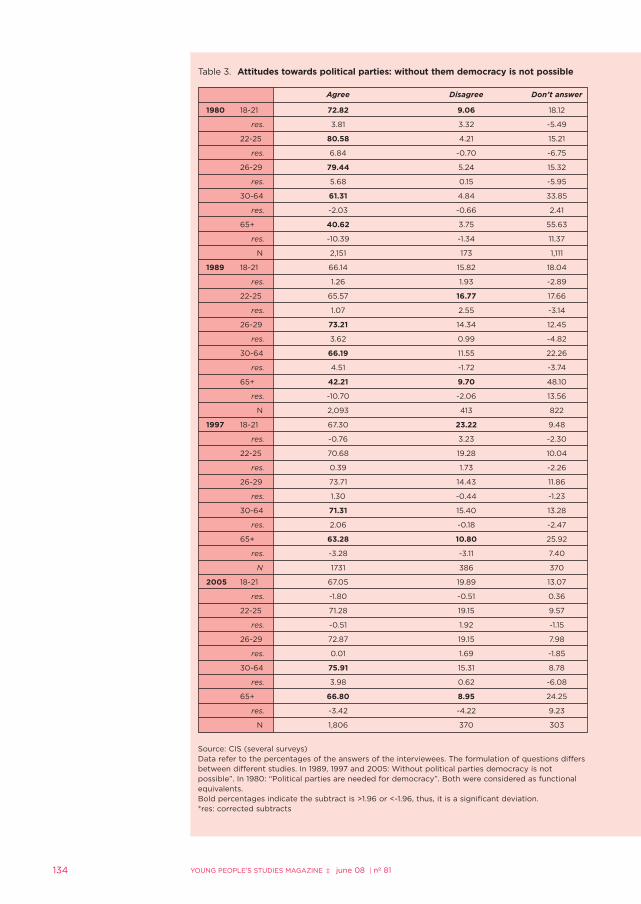
Most interviewees consider that, since the first years of democracy, political
parties have been fundamental for democracy (see Table 3). This attitude is
stable throughout time and there are no significant differences between age
groups.
The assessment of the role of political parties as instruments of political
participation shows different opinions. Although most interviewees since the
1980s assess them positively, they do it less today than in the past and there are
differences depending on the age group. Young people are now very critical.
There are significant differences among all groups of young people in 1997 and
2005 that point into that direction. Data corresponding to 2005 indicate that
this is not necessarily a consequence of the life-cycle effect, as young people
between 18 and 21 years of age and those between 26 and 29 are clearly
pessimistic in this sense, while young people between 22 and 25 are not. This is
the same pattern as when we analyzed feelings towards and identification with
political parties. Disillusionment with the role of political parties as instruments
for participation could be the reason of the distrust by young people.
On the other side, the percentage of people that agree with the statements
“political parties only divide people” and “political parties only criticize each
Young People and Political Participation: European Research 133
Table 2. Identification with political parties
1980 1989 2000 2005
18-21 68.56 49.21 29.38 23.86
res 4.08 -2.97 -2.20 -3.35
22-25 66.13 62.39 34.94 33.51
res 3.25 2.08 -0.49 -0.59
26-29 71.49 62.55 31.96 26.60
res 4.66 1.89 -1.33 -2.65
30-64 56.57 58.26 39.10 37.57
res -1.29 1.61 3.14 2.50
65 + 40.40 51.32 34.05 37.77
res -7.87 -2.91 -1.15 1.19
Total 57.43 57.06 36.36 35.50
N 3,441 3,349 2,489 2,479
Source: CIS (several surveys)
Data refer to the percentage of interviewees that identify with political parties. In 1997 and 2005
there is a direct question: Do you identify with a political party? In 1980 the question referred to how
close interviewees felt to certain political parties. The percentages reflect those how said they felt
close to a certain political party. In 1989, the same question was used, but distinguishing five
categories (including “neither close nor distant”).
Bold percentages indicate the subtract is >1.96 or <-1.96, thus, it is a significant deviation.
*res: corrected subtracts
(14)
Previous researches focused on
biased feelings against political
parties in southern Europe,
showing that we can distinguish
two attitudinal dimensions:
biased cultural feelings and
reactive biased feelings, both
with different impact on
participation (Torcal, Montero &
Gunter, 2003). Unfortunately,
the variability of the used
questions does not allow us to
use these two dimensions.
However, we analyze each of
the indicators separately.
134 YOUNG PEOPLE’S STUDIES MAGAZINE ‡ june 08 |nº 81
Table 3. Attitudes towards political parties: without them democracy is not possible
Agree Disagree Don’t answer
1980 18-21 72.82 9.06 18.12
res. 3.81 3.32 -5.49
22-25 80.58 4.21 15.21
res. 6.84 -0.70 -6.75
26-29 79.44 5.24 15.32
res. 5.68 0.15 -5.95
30-64 61.31 4.84 33.85
res. -2.03 -0.66 2.41
65+ 40.62 3.75 55.63
res. -10.39 -1.34 11.37
N 2,151 173 1,111
1989 18-21 66.14 15.82 18.04
res. 1.26 1.93 -2.89
22-25 65.57 16.77 17.66
res. 1.07 2.55 -3.14
26-29 73.21 14.34 12.45
res. 3.62 0.99 -4.82
30-64 66.19 11.55 22.26
res. 4.51 -1.72 -3.74
65+ 42.21 9.70 48.10
res. -10.70 -2.06 13.56
N 2,093 413 822
1997 18-21 67.30 23.22 9.48
res. -0.76 3.23 -2.30
22-25 70.68 19.28 10.04
res. 0.39 1.73 -2.26
26-29 73.71 14.43 11.86
res. 1.30 -0.44 -1.23
30-64 71.31 15.40 13.28
res. 2.06 -0.18 -2.47
65+ 63.28 10.80 25.92
res. -3.28 -3.11 7.40
N 1731 386 370
2005 18-21 67.05 19.89 13.07
res. -1.80 -0.51 0.36
22-25 71.28 19.15 9.57
res. -0.51 1.92 -1.15
26-29 72.87 19.15 7.98
res. 0.01 1.69 -1.85
30-64 75.91 15.31 8.78
res. 3.98 0.62 -6.08
65+ 66.80 8.95 24.25
res. -3.42 -4.22 9.23
N 1,806 370 303
Source: CIS (several surveys)Data refer to the percentages of the answers of the interviewees. The formulation of questions differsbetween different studies. In 1989, 1997 and 2005: Without political parties democracy is notpossible”. In 1980: “Political parties are needed for democracy”. Both were considered as functionalequivalents.Bold percentages indicate the subtract is >1.96 or <-1.96, thus, it is a significant deviation. *res: corrected subtracts

Young People and Political Participation: European Research 135
Table 4. Attitudes towards democracy: Thanks to political parties people can participate in the political life of the country
Agree Disagree Don’t answer
1980 18-21 63.98 14.67 21.35
res. 4.25 2.41 -5.94
22-25 64.96 13.81 21.23
res. 4.71 1.80 -6.02
26-29 63.38 14.92 21.70
res. 3.64 2.24 -5.19
30-64 51.45 10.41 38.14
res. -1.13 -0.68 1.60
65+ 33.09 4.91 62.00
res. -8.69 -4.27 11.72
N 1,794 366 1,275
1989 18-21 61.32 20.74 17.93
res. -0.18 2.22 -1.78
22-25 67.61 20.78 11.61
res. 2.29 2.26 -4.72
26-29 61.74 24.01 14.25
res. 0.00 3.50 -3.14
30-64 65.37 15.27 19.37
res. 4.86 -1.98 -3.95
65+ 45.58 11.14 43.28
res. -8.33 -3.55 12.98
N 2,068 550 731
1997 18-21 57.35 33.18 9.48
res. -3.29 4.24 -0.67
22-25 65.86 29.72 4.42
res. -0.58 3.25 -3.44
26-29 62.89 29.38 7.73
res. -1.42 2.72 -1.46
30-64 71.24 19.42 9.34
res. 4.43 -3.01 -2.68
65+ 63.79 15.52 20.69
res. -1.88 -3.56 7.55
N 1,679 539 270
2005 18-21 60.23 27.84 11.93
res. -2.90 2.05 1.76
22-25 69.68 25.53 4.79
res. -0.07 1.33 -1.85
26-29 62.77 31.38 5.85
res. -2.22 3.35 -1.31
30-64 72.05 22.33 5.62
res. 2.70 0.88 -5.78
65+ 69.98 12.72 17.30
res. 0.04 -5.47 8.07
N 1,733 538 208
Sources: CIS (several surveys)Data refer to the level of agreement or disagreement with the statement: “thanks to political partiespeople can participate in the political life of the country.”Bold percentages indicate the subtract is >1,96 or <-1.96, thus, it is a significant deviation. *res: corrected subtracts

136 YOUNG PEOPLE’S STUDIES MAGAZINE ‡ june 08 |nº 81
Table 5. Attitudes towards political parties: “political parties only divide”
Agree Disagree Don’t answer
1980 18-21 28.50 47.88 23.62
res. 1.86 3.09 -4.81
22-25 22.53 57.52 19.95
res. -0.73 6.72 -6.18
26-29 26.28 55.75 17.97
res. 0.84 5.42 -6.27
30-64 24.04 38.31 37.65
res. -0.13 -1.98 2.13
65+ 21.49 19.12 59.39
res. -1.39 -9.57 10.97
N 831 1,361 1,247
1989 18-21 35.26 48.61 16.13
res. 1.16 0.54 -2.02
22-25 25.87 59.71 14.42
res. -2.72 4.87 -2.87
26-29 30.21 56.46 13.33
res. -0.81 3.22 -3.04
30-64 33.87 48.34 17.79
res. 2.02 1.64 -4.37
65+ 30.89 29.17 39.93
res. -0.83 -9.03 12.14
N 1,089 1,576 684
1997 18-21 37.44 55.45 7.11
res. 0.42 0.91 -2.06
22-25 30.52 61.45 8.03
res. -1.93 2.99 -1.77
26-29 38.66 54.12 7.22
res. 0.77 0.48 -1.92
30-64 33.60 56.46 9.93
res. -2.88 4.41 -2.58
65+ 44.83 33.84 21.34
res. 4.34 -8.91 7.45
N 898 1,305 284
2005 18-21 40.91 47.73 11.36
res. 0.22 -0.99 1.38
22-25 42.02 53.19 4.79
res. 0.55 0.54 -1.92
26-29 45.21 50.53 4.26
res. 1.48 -0.22 -2.19
30-64 37.22 56.95 5.83
res. -3.44 6.53 -5.63
65+ 45.53 36.18 18.29
res. 2.76 -7.60 8.75
N 995 1,272 212
Source: CIS (several surveys)Data refer to the level of agreement or disagreement with the statement: “political parties onlydivide”. Bold percentages indicate the subtract is >1.96 or <-1.96, thus, it is a significant deviation. *res: corrected subtracts

Young People and Political Participation: European Research 137
Table 6. Attitudes towards political parties: “political parties criticize each other, butthey are all the same”
Agree Disagree Don’t answer
1980 18-21 9.51 72.08 18.52
res. -2.27 7.09 -5.83
22-25 11.84 67.88 20.39
res. -0.95 5.61 -5.23
26-29 17.37 66.78 16.05
res. 1.66 4.61 -6.07
30-64 14.13 50.98 34.88
res. 0.80 -2.14 1.68
65+ 14.14 28.25 57.65
res. 0.29 -11.08 11.49
N 471 1,795 1,155
1989 18-21 47.61 35.32 17.03
res. 0.16 0.75 -1.10
22-25 46.27 42.80 10.84
res. -0.31 3.80 -4.14
26-29 47.02 39.45 13.48
res. 0.00 2.12 -2.53
30-64 48.53 34.18 17.28
res. 1.75 1.05 -3.48
65+ 42.72 20.84 36.48
res. -2.25 -6.72 10.87
N 1,582 1,121 648
1997 18-21 61.61 32.23 6.16
res. 0.21 0.66 -1.43
22-25 57.03 38.55 4.42
res. -1.33 3.02 -2.59
26-29 64.43 30.41 5.15
res. 1.04 0.06 -1.88
30-64 60.88 31.09 8.03
res. -0.06 1.05 -1.58
65+ 61.42 22.20 16.38
res. 0.24 -4.17 6.34
N 1,516 752 220
2005 18-21 63.07 30.11 6.82
res. -0.02 -0.34 0.72
22-25 70.21 27.13 2.66
res. 2.09 -1.27 -1.83
26-29 65.96 29.26 4.79
res. 0.84 -0.62 -0.51
30-64 62.01 34.13 3.86
res. -1.35 3.58 -4.39
65+ 62.62 25.84 11.53
res. -0.26 -2.94 6.47
N 1,565 775 139
Source: CIS (several surveys)Data refer to the level of agreement or disagreement with the statement: “political parties criticizeeach other, but they are all the same”. The formulation was different in 1980: “All political parties arethe same”.Bold percentages indicate the subtract is >1,96 or <-1.96, thus, it is a significant deviation. *res: corrected subtracts

other, but they are all the same” have increased dramatically during these
years, and nearly uniformly among all groups (see Table 5 and Table 6). And
differences between adults and young people and between the young
people themselves are not significant.
To conclude we can highlight that attitudes towards political parties in Spain
show a process of convergence between different age groups. In general terms,
data support the hypothesis that young people generally reject political parties.
It is important to underline that they agree even less with the role of political
parties as instruments for political participation. Of all the attitudes analyzed so
far, this aspect could be the main reason for the rejection of political parties by
young people, and the fact that most of them do not identify with political
parties. In this sense, it would be interesting for future researches to focus on
the failure of political parties as mobilization agents among young people.
Political participation of young Spanish people (15)
Political discussions
One of the indicators of political engagement is also frequency of political
discussion. This indicator is not always considered as adequate to analyze
political participation (Parry, Moiser & Day, 1992), but we think that it is a
good indicator to measure the presence of politics in everyday life of
citizens. Besides, the lack of other data to analyze the evolution of other
“conventional” political activities forces us to complement the information
about this type of behaviour beyond voting.
In opposition to what happens with voting, young people are the ones who
discuss more with family and friends about political issues (see Table 7). The
138 YOUNG PEOPLE’S STUDIES MAGAZINE ‡ june 08 |nº 81
(15)
Considerations about the
selection of indicators: the
discontinuity of the studies has
forced certain limitations on our
analysis. On the one side, the
formulation of questions has
different temporal limits. The
most common question refers
to the participation in political
activities throughout time, but
some studies limit this question
to the last 5 years or the 12
months. The first case is
directly related to age, as older
people will have had more
opportunities to participate
than young people. With regard
to our results, this is the case
for all studies, with the
exception of the data
corresponding to 2005. This
implies that we will have to be
cautious when it comes to
analyze the temporal evolution
of different indicators, but at
the same time we will be able
to trust the representativeness
of the differences between
young people and adults for
this last year. Besides, available
data does not include
indicators of the so-called “new
forms of political participation”,
with the exception of the 2005
survey.
Table 7. Frequency of political discusión sorted by age
Age 1980 1989 2000
18-21 36.50 23.80 58.00
res 6.4 -1.4 -0.2
22-25 34.00 37.20 68.80
res 5.4 4.3 3.2
26-29 34.10 39.90 64.60
res 4.9 4.9 1.7
30-64 19.10 28.10 62.00
res -4.8 1.5 3.6
65 + 8.40 12.70 40.30
res -7.1 -8.1 -8.3
Total 21.70 27.10 58.70
N 3,340 3,321 2,285
Source: CIS (several surveys)
Data refer to the percentage of people who discuss about politics “frequently” or “very frequently”.
The 2000 study included three questions: frequency of political discussion with friends, family and
co-workers.
Bold percentages indicate the subtract is >1.96 or <-1.96, thus, it is a significant deviation.
*res: corrected subtracts

type of indicator we use does not allow us to compare levels of participation
of the year 2000 to previous years, and we will have to limit our analysis to
the interpretation of the evolution of differences between different moments
in time. (16)
In this sense, it is interesting to highlight the change among young people: in
the first 1980s, young people between 18 and 21 years of age were the ones
that discussed more about politics, in 1989 and 2000 it were the young
people between 22 and 29 who discussed more about politics.
We also have to underline that the increase of the frequency of political
discussion among adults between 30 and 64 years of age is quite
remarkable. This evolution is probably the consequence of the higher
education levels of the population in general, which is one of the proven
reasons of the increase (Topf, 1995a: 66). These results corroborate the
results on the European level: age is not an indicator for the frequency of
discussion, but in some countries like Spain and Portugal young people carry
out this activity more frequently than adults (Topf, 1995a).
Voter participation (17)
As is well known, voting is the most important form of political participation
in democracy. For two fundamental reasons: on the one side, it is the
political activity that most citizens carry out, and on the other side it is a
needed element to elect governments. Therefore, it is a necessity for the
correct development of democratic regimes (Anduiza, 1999). Furthermore, it
legitimates the political system and the rest of the democratic process.
According to Dalton “voting is the activity that links individuals to the
political system and legitimates the rest of the democratic process” (cited by
Topf, 1995b: 26, translation by the author).
The relation between age and voter participation is well known. Besides
education, age is probably the most common factor to explain political
participation in general and voter participation in particular. Several studies
have shown that voter participation increases with age, to again decrease
among people over 60 or 65. This relation is usually interpreted in terms of
the life cycle. As they mature, citizens acquire important resources regarding
participation, status, political information, social position, and development
of ideological identifications. Voter participation is, as already mentioned,
especially important. Plutzer (2002) has proven that voting is a habit that
can be learned (or not) during the education of the citizens, that is, during
their youth, and has found out that people who have voted once will
probably vote again.
In countries like Canada and the United States the explanation for not voting
is beyond the life-cycle effect. It is probably related to generational
differences (Blais et al., 2004; Schlozman, Verba, Brady, & Erkulwater, 1999).
Other studies have been carried out in several countries (IDEA, 1999) and
different initiatives have been developed to promote voting among young
people: campaigns in the media, conferences, events, and the use of new
technologies to reach the young people, etc (Ellis et al., 2006). (18)
How is voter participation of young Spanish people? The relation between
electoral participation and age in Spain changed from a curved relation to a
lineal relation (see Table 8). That means that while in the first elections
participation increased with age until the 65 year olds, since 1993
Young People and Political Participation: European Research 139
(16)
We have to be cautious when
analyzing this increase in the
frequency of political
discussion in the year 2000, as
it could be overrepresented due
to the type of indicator used. In
1980 and 1989 the question
referred to the frequency of
discussion with other people,
while in 2000 the same
question was asked, but
distinguishing between friends,
family and co-workers. To
create an equivalent indicator
we developed an index
combining these three
distinctions. Therefore, the
presented information should
be equivalent, but the increase
could also be a consequence of
the more specifically asked
question. This phenomenon is
common among other
indicators, such as interest in
politics.
(17)
In order to analyze voter
participation in all general
elections since 1982 we used
post-electoral studies carried
out by the Centre for
Sociological Researches.
(18)
Several campaigns have been
carried out in North-American
universities, like “The National
Campaign for Political and Civic
Engagement”. Other initiatives
used new technologies, such as
blogs and free-to-download
videos like “Rock the vote
(www.rockthevote.com, or
www.rockthevote.ca).
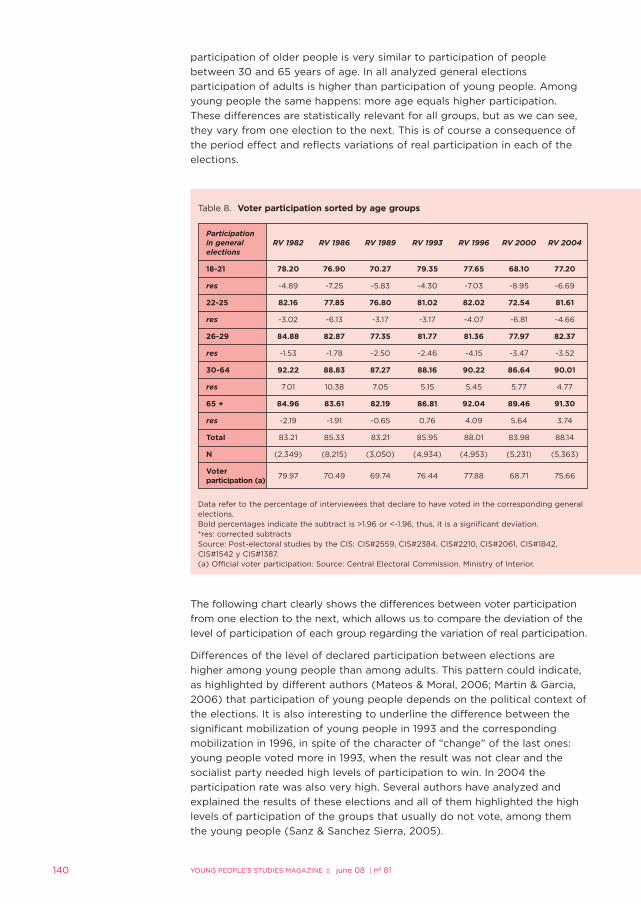
participation of older people is very similar to participation of people
between 30 and 65 years of age. In all analyzed general elections
participation of adults is higher than participation of young people. Among
young people the same happens: more age equals higher participation.
These differences are statistically relevant for all groups, but as we can see,
they vary from one election to the next. This is of course a consequence of
the period effect and reflects variations of real participation in each of the
elections.
The following chart clearly shows the differences between voter participation
from one election to the next, which allows us to compare the deviation of the
level of participation of each group regarding the variation of real participation.
Differences of the level of declared participation between elections are
higher among young people than among adults. This pattern could indicate,
as highlighted by different authors (Mateos & Moral, 2006; Martin & Garcia,
2006) that participation of young people depends on the political context of
the elections. It is also interesting to underline the difference between the
significant mobilization of young people in 1993 and the corresponding
mobilization in 1996, in spite of the character of “change” of the last ones:
young people voted more in 1993, when the result was not clear and the
socialist party needed high levels of participation to win. In 2004 the
participation rate was also very high. Several authors have analyzed and
explained the results of these elections and all of them highlighted the high
levels of participation of the groups that usually do not vote, among them
the young people (Sanz & Sanchez Sierra, 2005).
140 YOUNG PEOPLE’S STUDIES MAGAZINE ‡ june 08 |nº 81
Table 8. Voter participation sorted by age groups
Participationin general RV 1982 RV 1986 RV 1989 RV 1993 RV 1996 RV 2000 RV 2004elections
18-21 78.20 76.90 70.27 79.35 77.65 68.10 77.20
res -4.89 -7.25 -5.83 -4.30 -7.03 -8.95 -6.69
22-25 82.16 77.85 76.80 81.02 82.02 72.54 81.61
res -3.02 -6.13 -3.17 -3.17 -4.07 -6.81 -4.66
26-29 84.88 82.87 77.35 81.77 81.36 77.97 82.37
res -1.53 -1.78 -2.50 -2.46 -4.15 -3.47 -3.52
30-64 92.22 88.83 87.27 88.16 90.22 86.64 90.01
res 7.01 10.38 7.05 5.15 5.45 5.77 4.77
65 + 84.96 83.61 82.19 86.81 92.04 89.46 91.30
res -2.19 -1.91 -0.65 0.76 4.09 5.64 3.74
Total 83.21 85.33 83.21 85.95 88.01 83.98 88.14
N (2,349) (8,215) (3,050) (4,934) (4,953) (5,231) (5,363)
Voter79.97 70.49 69.74 76.44 77.88 68.71 75.66
participation (a)
Data refer to the percentage of interviewees that declare to have voted in the corresponding generalelections. Bold percentages indicate the subtract is >1.96 or <-1.96, thus, it is a significant deviation. *res: corrected subtractsSource: Post-electoral studies by the CIS: CIS#2559, CIS#2384, CIS#2210, CIS#2061, CIS#1842,CIS#1542 y CIS#1387.(a) Official voter participation: Source: Central Electoral Commission. Ministry of Interior.

The exceptionality of the events around these elections does not allow us
to reach conclusions about whether this mobilization can happen again in
a context of “political normality”. Lastly, we cannot rule out that there are
generational effects that point towards a generational replacement and,
therefore, a decrease of the total voter participation.
Participation in demonstration
The participation in demonstrations is the most common form of political
participation after voter participation regarding the percentage of people
in Spain that participate in such activities. Besides, we know that young
people participate more in protest actions than adults (Barnes, Kaase, y al,
1979; Ferrer, 2005; Kaase, 1986; Milbrath, 1965; Norris, 2003; Parry et al.,
1992). Spanish youth is not an exception in this sense (see Table 9). But, as
in other countries, demonstrations are no longer an exclusive redoubt of
youth. In the case of Spain, we should emphasize the important role of
political parties for the mobilization of citizens in the context of this type
of actions.
Young People and Political Participation: European Research 141
Figure 2. Differences in voter participation in every election with regard to previouselections. (1982 to 2004). Age groups
Own elaboration. Sources: Post-electoral Studies by the CIS: CIS#2559, CIS#2384, CIS#2210,CIS#2061, CIS#1842, CIS#1542 y CIS#1387(a) “Real voter participation” shows the difference in participation according to the official dataprovided by the Ministry of Interior.

Although differences between young people and adults regarding this type
of participation have decreased in the last years, a survey carried out in
2005 –which limits the question to participation during the last 12 months –
shows that differences are still very important among all groups of young
people, but especially among young people between 22 and 29 years of age.
Lastly, we would like to mention that participation of young people under 18
is quite lower.
Signing petitions
Signing petitions, as well as other forms of political protest activities, is more
common among young people than among adults. Young people between
22 and 29 are the ones that sign more petitions, while young people
between 15 and 21 participate less than adults regarding the data of 1994
and 2000.
As well as in the previous case, the differences with the group of adults,
although significant, seem to have decreased, which would again point
towards a wider repertoire of political actions of the citizens.
142 YOUNG PEOPLE’S STUDIES MAGAZINE ‡ june 08 |nº 81
Table 9. Participation in demonstrations sorted by age groups (1980 to 2005)
Age 1980 1989 1994* 2000 2005
15-17 24.30
res n.a
18-21 42.61 43.51 35.70 42.58 35.80
res 8.38 6.93 n.a 1.58 2.03
22-25 45.00 38.91 38.00 40.69 43.09
res 9.32 5.2 n.a 1.05 4.39
26-29 36.12 39.46 35.30 46.04 38.50
res 4.99 4.79 n.a 2.61 2.94
30-64 18.27 24.72 29.50 42.16 31.62
res -7.56 -3.13 n.a 5.22 3.2
65 + 4.76 9.84 11.00 17.02 10.93
res -8.63 -9.33 n.a -10.28 -10.05
Total 22.76 26.87 37.51 29.10
N 3,033 3,212 (2,146 a 2,198) 2,458 2,470
Source: CIS (several surveys)
Data refer to the percentage of interviewees that declare to have participated in a demonstration.
Los datos de 2005 reflejan, sin embargo, el porcentaje de entrevistados que ha participado en este
tipo de acción en los últimos doce meses.
*los datos correspondientes a 1994 están construidos a partir de dos encuestas diferentes, una
representativa de los jóvenes (entre 15 y 25 años) y otra representativa de la población (a partir de 25
años) por lo tanto no es posible comparar los estadísticos.
Bold percentages indicate the subtract is >1.96 or <-1.96, thus, it is a significant deviation.
*res: corrected subtracts

Other protest activities
Other series of protest activities have usually been associated to young
people. Due to the difficulties to find equivalent indicators, the following
table shows the percentage of individuals in every age group that have
participated in some of the following activities: graffiti paintings, occupation
of buildings or factories, damaging public goods, blocking the traffic or
carrying out violent actions (19).
Due to the diversity of questions included in the different studies we
cannot reach relevant conclusions about the evolution of participation in
this type of activities –for example, the survey carried out in 1994 includes
more questions, and therefore participation is higher– but we can see that
the young people are the ones that participate more in this type of
actions. Besides, in 2005, we get a more real view of participation in this
type of actions depending on age, as the question is limited to the last
twelve months. In fact, participation of young people is a lot higher than
adults’ participation, at least regarding the indicators included in said
survey: occupation of buildings, blocking the traffic, graffiti painting and
damaging public goods. Besides, participation in this type of action is no
longer as significant among people over 25 years of age. We can also say
that only a minority uses this type of participation, as the participation
rate is only 1.4%.
Young People and Political Participation: European Research 143
Table 10. Signing petitions sorted by age groups (1980 to 2000)
Age 1980 1989 1994*** 2005
15-17 20.00
res -7.3
18-21 37.46 35.83 34.70 22.99
res 4.05 2.8 3.4 0.73
22-25 46.93 40.37 36.40 28.49
res 7.71 4.81 3.6 2.68
26-29 45.61 41.31 36.70 25.67
res 6.47 4.58 2 1.7
30-64 23.37 28.52 32.80 23.90
res -6.18 -0.59 3.5 4.38
65 + 12.68 12.25 18.20 6.76
res -6.57 -8.94 -5.7 -8.71
Total 27.26 28.93 20.82
N
Source: CIS (several surveys)
Data refer to the percentage of interviewees that declare to have participated in a strike.
Los datos de 2005 reflejan, sin embargo, el porcentaje de entrevistados que ha participado en este
tipo de acción en los últimos doce meses.
Bold percentages indicate the subtract is >1.96 or <-1.96, thus, it is a significant deviation.
*res: corrected subtracts
***Los datos referentes al año 1994 están construidos a partir de dos encuestas diferentes, por los
tanto, los estadísticos utilizados solo pueden compararse entre 15 años y 25 para los jóvenes y de 26
en adelante para los adultos.
(19)
The questions and the number
of questions are different in
every study. In 1980: graffiti
paintings, occupation of
factories or buildings, blocking
the traffic, damaging public
goods. 1989: occupation of
factories and violent actions.
The 1994 study included the
questions of the 1980 and 1989
studies. 2005: two indicators, 1
occupation of buildings,
blocking the traffic 2 graffiti
paintings and damaging public
goods.

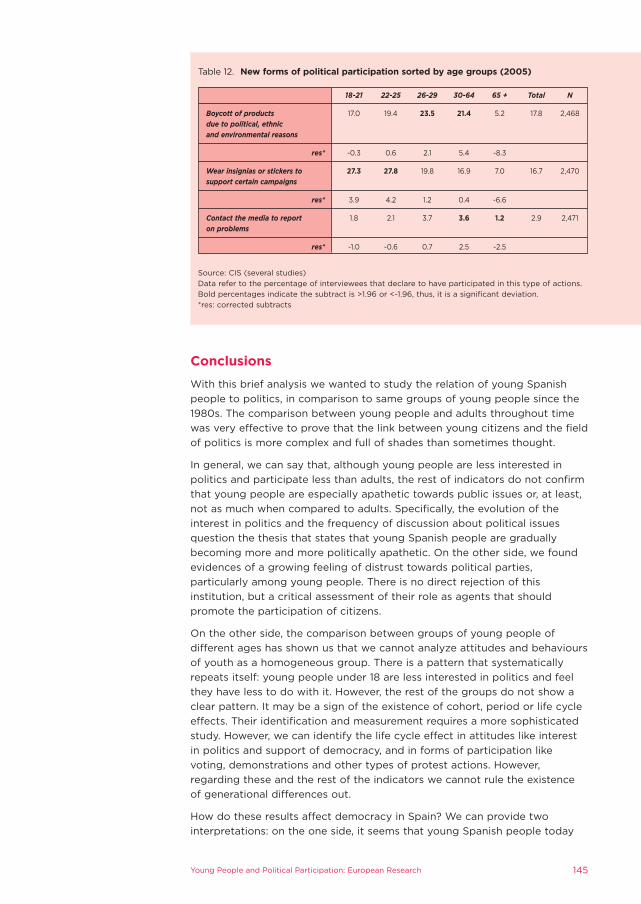
New forms of political participation?
In order to complete the analysis of the forms of political participation, and
to empirically prove the hypothesis of the higher levels of participation of
young people in new forms of participation, we have analyzed three types of
action, but, sadly, only one of the studies, the one carried out in 2005,
includes this type of actions.
The results show that participation in the three so-called “new forms of
participation” (20) is uneven depending on the age group: while young
people wear insignias and stickers more often than adults, the results are
different when we analyze the consumption or boycott of certain products
due to political reasons, or the use of the media to report on a problem. In
the case of consumption or boycott for political reasons, adults and young
people over 26 are the ones that participate more, when it comes to use the
media to report on problems participation is marginal (2.6%) and higher
among adults.
144 YOUNG PEOPLE’S STUDIES MAGAZINE ‡ june 08 |nº 81
(20)
In a certain way, these actions
cannot be considered “new”,
but several studies have
included them defining them as
new (Micheletti et al., 2004). In
any case, participation of young
people is higher regarding this
type of action.
Table 11. Other protest activities (graffiti painting, blocking the traffic, damaging publicgoods, violent actions)
Age 1980 1989 1994*** 2005
15-17 15.10
res -3
18-21 13.30 4.70 19.20 2.80
res 5 0.4 0.2 1.7
22-25 16.60 6.70 22.50 4.30
res 7.3 2.4 2.7 3.5
26-29 12.50 6.20 12.50 1.10
res 3.9 1.7 1.9 -0.4
30-64 4.20 4.00 10.10 1.30
res -6.4 -0.5 3 -0.7
65 + 0.80 1.80 2.60 0.40
res -4.5 -2.9 -4.9 -2.2
Total 6.40 4.20 1.40
N 3,900 3,187 (2,146 a 2,198) 2,462
Source: CIS (several surveys)
**Data refer to the percentage of interviewees that declares to have participated in this type of action
throughout their life. Las acciones son distintas para cada estudio: 1980: pintadas, ocupar fábricas o
edificios, bloquear tráfico, causar daños. 1989: ocupar fábricas o acciones violentas. 1994: 1980+1989.
2005: dos indicadores: 1 ocupar edificios, encierros, cortar tráfico y 2 hacer pintadas o causar daños
Los datos de 2005 reflejan, sin embargo, el porcentaje de entrevistados que ha participado en este
tipo de acción en los últimos doce meses.
Bold percentages indicate the subtract is >1.96 or <-1.96, thus, it is a significant deviation.
*res: corrected subtracts.
***Data referring to 1994 were provided by two different surveys, therefore not all age groups are
comparable (only the 15 to 25 year olds for young people and the people over 26 years of age for
adults).
Young People and Political Participation: European Research 145
Table 12. New forms of political participation sorted by age groups (2005)
18-21 22-25 26-29 30-64 65 + Total N
Boycott of products 17.0 19.4 23.5 21.4 5.2 17.8 2,468
due to political, ethnic and environmental reasons
res* -0.3 0.6 2.1 5.4 -8.3
Wear insignias or stickers to 27.3 27.8 19.8 16.9 7.0 16.7 2,470
support certain campaigns
res* 3.9 4.2 1.2 0.4 -6.6
Contact the media to report 1.8 2.1 3.7 3.6 1.2 2.9 2,471
on problems
res* -1.0 -0.6 0.7 2.5 -2.5
Source: CIS (several studies)
Data refer to the percentage of interviewees that declare to have participated in this type of actions.
Bold percentages indicate the subtract is >1.96 or <-1.96, thus, it is a significant deviation.
*res: corrected subtracts
Conclusions
With this brief analysis we wanted to study the relation of young Spanish
people to politics, in comparison to same groups of young people since the
1980s. The comparison between young people and adults throughout time
was very effective to prove that the link between young citizens and the field
of politics is more complex and full of shades than sometimes thought.
In general, we can say that, although young people are less interested in
politics and participate less than adults, the rest of indicators do not confirm
that young people are especially apathetic towards public issues or, at least,
not as much when compared to adults. Specifically, the evolution of the
interest in politics and the frequency of discussion about political issues
question the thesis that states that young Spanish people are gradually
becoming more and more politically apathetic. On the other side, we found
evidences of a growing feeling of distrust towards political parties,
particularly among young people. There is no direct rejection of this
institution, but a critical assessment of their role as agents that should
promote the participation of citizens.
On the other side, the comparison between groups of young people of
different ages has shown us that we cannot analyze attitudes and behaviours
of youth as a homogeneous group. There is a pattern that systematically
repeats itself: young people under 18 are less interested in politics and feel
they have less to do with it. However, the rest of the groups do not show a
clear pattern. It may be a sign of the existence of cohort, period or life cycle
effects. Their identification and measurement requires a more sophisticated
study. However, we can identify the life cycle effect in attitudes like interest
in politics and support of democracy, and in forms of participation like
voting, demonstrations and other types of protest actions. However,
regarding these and the rest of the indicators we cannot rule the existence
of generational differences out.
How do these results affect democracy in Spain? We can provide two
interpretations: on the one side, it seems that young Spanish people today

are not significantly different from previous young generations regarding
their relation to politics. On the other side, and due to the low levels of
political engagement in Spain, it is really surprising that young people with
higher levels of education, with more resources for participation and whose
political socialization was carried out during democracy, do not show more
political engagement than previous generations. Maybe the democratic
experience does not promote engagement of citizens by itself, and the
institutions will have to find instruments to promote active citizenship.
REFERENCES
Anduiza, E. (1999). ¿Individuos o sistemas? Las razones de la abstención en Europa Occidental. Madrid:
Centro de Investigaciones Sociológicas.
Barnes, S. H., y Kaase, M. (1979). Political action: Mass participation in Five Western Democracies.
Beverly Hills: Sage.
Barnes, S. H., Kaase, M., y al, e. (1979). Political Action. Mass Participation in Five Western Democracies.
London: Sage.
Bennett, S. E. (1997). Why Young Americans Hate Politics, and What We Should Do about It. Ps-
Political Science y Politics, 30(1), 47-53.
Bennett, W. L. (1998). The UnCivic culture: Communication, identity, and the rise of lifestyle politics. Ps-
Political Science y Politics, 31(4), 741-761.
Blais, A., Gidengil, E., y Nevitte, N. (2004). Where does turnout decline come from? European Journal
of Political Research, 43(2), 221-236.
Bonet, E., Martín, I., y Montero, J. R. (2004). Actitudes políticas de los españoles: un enfoque
comparado en el tiempo y en el espacio. Madrid: Working Papers Series 36/2004. Departamento de
Ciencia Política y Relaciones Internacionales. Universidad Autónoma de Madrid.
Caínzos, M. A. (2006). Participación de los jóvenes españoles en manifestaciones. Comparación con los
jóvenes europeos y análisis de sus determinantes. Revista de estudios de juventud, 75, 121-153.
Dalton, R. J. (2000). The Decline of Party Identifications. En R. J. Dalton y M. P. Wattenberg (Eds.),
Parties without Partisans. Oxford: Oxford University Press.
Delli Carpini, M. X. (2000). Gen.Com: Youth, Civic Engagement, and the New Information Environment.
Washington: Center for Communication y Civic Engagement, University of Washington.
Ellis, A., Gratschew, M., Pammett, J. H., y Thiessen, E. (2006). Engaging the Electorate: Initiatives to
Promote Voter Turnout from Around the World. Stockholmo: IDEA (International Institute for
Democracy and Electoral Assistance).
EUYOUPART. (2005). Political Participation of Young People in Europe - Development of Indicators for
Comparative Research in the European Union. Retrieved Febrero, 2006, from
http://www.sora.at/de/start.asp?b=14
Ferrer, M. (2005). Participación política. En M. Torcal, L. Morales y S. Pérez-Nievas (Eds.), España:
sociedad y política en perspectiva comparada. Valencia: Tirant lo Blanch.
Ferrer, M. (2006). Jóvenes, participación y actitudes políticas en España, ¿son realmente tan diferentes?
Revista de estudios de juventud, 75, 195-206.
Ferrer, M., Medina, L., y Torcal, M. (2007). La participación política: factores explicativos. En
Ciudadanos, asociaciones y participación en España. Madrid: Centro de Investigaciones Sociológicas.
Fraile, M., Ferrer, M., y Martín, I. (2007). Jóvenes, conocimiento político y participación (Vol. 58).
Madrid: CIS: Centro de Investigaciones Sociológicas.
García Albacete, G. (2006). Jóvenes españoles y política. Análisis y reflexión metodológica a partir de
las encuestas del CIS. Madrid: Informe correspondiente a la «Ayuda a la Investigación Sociológica»
presentado al Centro de Investigaciones Sociológicas.
Gauthier, M. (2003). The inadequacy of concepts: the rise of youth interest in civic participation in
Quebec [1]. Journal of Youth Studies, 6(3), 265-276.
Henn, M., Weinstein, M., y Forrest, S. (2005). Uninterested Youth? Young People’s Attitudes towards
Party Politics in Britain. Political Studies, 53(3), 556-578.
IDEA, I. (1999). Youth Voter Participation: Involving Today’s Young in Tomorrow’s Democracy.
Stockholm: International Institute for Democracy and Electoral Assistance.
Inglehart, R. (1990). Culture shift in advanced industrial society. Princeton: Princeton University Press.
INJUVE. (2003). Percepticón generacional, valores y actitudes, asociacionismo y participación. Sondeo
de opinión y situación de la gente joven. Madrid: INJUVE.
146 YOUNG PEOPLE’S STUDIES MAGAZINE ‡ june 08 |nº 81

INJUVE. (2005a). Percepción generacional, valores y actitudes, asociacionismo y participación. Sondeo
de opinión y situación de la gente joven. Madrid: INJUVE.
INJUVE. (2005b). Sondeo participación y cultura polítca. Principales conclusiones. Madrid: INJUVE,
Ministerio de Trabajo y Asuntos Sociales.
Jennings, M. K., y van Deth, J. W. (1989). Continuities in Political Action. Berlin, Nueva York: De Gruyter.
Justel, M. (1992). Edad y cultura política. Revista Española de Investigaciones Sociológicas, 58, 57-96.
Kaase, M. (1986). Mass Participation. En M. K. Jennings y J. W. van Deth (Eds.), Continuities in Political
Action (pp. 23-64). Berlin, Nueva York: de Gruyter.
Kovacheva, S. (2005). Will youth rejuvenate the patterns of political participation. En J. Forbrig (Ed.),
Revisiting youth political participation (pp. 19-29). Strasbourg: Council of Europe Publishing.
Martin, I. (2004). Los orígenes y significados del interés por la política en dos nuevas democracias:
España y Grecia. Madrid: Instituto Juan March.
Martin, I., y Garcia, G. (2006). Conceptual and methodological issues about young people and politics.
Paper presented at the ECPR Joint Sessions. Workshop Nb. 5: Studying Forms of Participation, Nicosia.
Martín, I., y García, G. (2005). Civic Education in Spain: state of the art and research proposal. Paper
presented at the 3ª Conferencia del European Consortium for Political Research (ECPR) 8 al 10
September 2005., Budapest.
Megías, E., Rodríguez, E., Megías, I., y Navarro, J. (2005). Jóvenes y política. El compromiso con lo
colectivo. Madrid: INJUVE y FAD.
Micheletti, M., Follesdal, A., y Stolle, D. (2004). Politics, products, and markets : exploring political
consumerism past and present. New Brunswick, N.J.: Transaction Publishers.
Micheletti, M., y Stolle, D. (2005). The Market as an Arena for Transnational Politics. Retrieved 9
marzo, 2006, from http://ya.ssrc.org/transnational/Micheletti_Stolle
Milbrath, L. W. (1965). Political participation. How and why do people get involved in politics? Chicago:
Rand Mcnally College.
Montero, J. R., Gunther, R., y Torcal, M. (1998). Actitudes hacia la democracia en España: legitimidad,
descontento y desafección. Revista Española de Investigaciones Sociológicas, 83, 9-49.
Morales, L. (2005). ¿Existe una crisis participativa? La evolución de la participación política y el
asociacionismo en España. Revista Española de Ciencia Política, 13, 51-87.
Norris, P. (2002). Theories of political activism. En Democratic phoenix. Reinventing political activism
(pp. 290). Cambridge: University Press.
Norris, P. (2003). Young People y Political Activism: From the Politics of Loyalties to the Politics of
Choice. Strasbourg: Council of Europe Symposium «Young people and democratic institutions: from
disillusionment to participation.
O’Toole, T., Lister, M., Marsh, D., Jones, S., y McDonagh, A. (2003). Tuning out or left out? Participation
and non-participation among young people. contemporary Politics, 9(1), 45-61.
Parry, G., Moiser, G., y Day, N. (1992). Political participation and democracy in Britain. Cambridge:
Cambridge University Press.
Pirie, M., y Worcester, R. M. (1998). The Millennian Generation. London: Adam Smith Institute.
Pirie, M., y Worcester, R. M. (2000). The Big Turn-Off. Attitudes of young people to government,
citizenship and community. London: Adam Smith Institute.
Plutzer, E. (2002). Becoming a Habitual Voter: Inertia, Resources, and Growth in Young Adulthood.
American Political Science Review, 96(1), 41-55.
Putnam, R. D. (2000). Bowling alone : the collapse and revival of American community. New York:
Simon y Schuster.
Saha, L. J., Print, M., y Edwards, K. (2005). Youth, Political Engagement and Voting (No. 2). Sydney:
Youth Electoral Study.
Sanz, A., y Sánchez-Sierra, A. (2005). Las elecciones generales de 2004 en España: política exterior,
estilo de gobierno y movilización. Madrid: Working Papers Online Series. Estudio 48/2005. Universidad
Autónoma de Madrid.
Schlozman, K. L., Verba, S., Brady, H., y Erkulwater, J. (1999). Why Can’t They Be Like We Were?:
Understanding the Generation Gap in Participation. Retrieved February, 2006, from
http://www.iog.ca/policity/CP/Public%20Library/references.htm
Topf, R. (1995a). Beyond Electoral Participation. En H.-D. Klingemann y D. Fuchs (Eds.), Citizens and the
State (pp. 53-91). New York: Oxford University Press.
Topf, R. (1995b). Electoral Participation. En H.-D. Klingemann y D. Fuchs (Eds.), Citizens and the State
(pp. 27-51). New York: Oxford University Press.
Torcal, M., Montero, J. R., y Gunther, R. (2003). Ciudadanos z partidos en el sur de Europa: los
sentimientos antipartidistas. Revista Española de Investigaciones Sociológicas, 101, 9-48.
Young People and Political Participation: European Research 147

Valls, M. (2006). Jóvenes y política. En P. González Blasco (Ed.), Jóvenes Españoles 2005 (pp. 305-
343). Madrid: Fundación Santa María.
van Deth, J. W. (1989). Interest in Politics. En M. K. Jennings y J. W. van Deth (Eds.), Continuities in
Political Action (pp. 275-312). New York: de Gruyter.
Verba, S., Schlozman, K. L., y Brady, H. E. (1995). Voice and Equality. Civic voluntarism in american
politics. (2ª edición, 1998 ed.). Cambridge: Harvard University Press.
148 YOUNG PEOPLE’S STUDIES MAGAZINE ‡ june 08 |nº 81
