polish stock market and some foreign markets – … · badania operacyjne i decyzje nr 2 2008...
TRANSCRIPT
B A D A N I A O P E R A C Y J N E I D E C Y Z J E
Nr 2 2008
Henryk GURGUL*,Roland MESTEL**,Robert SYREK***
POLISH STOCK MARKET AND SOME FOREIGN MARKETS– DEPENDENCE ANALYSIS BY COPULAS
By applying copulas the examination was carried out to find out whether trading volume, stockreturn and return volatility are pairwise dependent. In the investigations it was shown that there existsa close relationship between these variables on the domestic market and between Polish stock returnsand the returns of foreign stock market indexes. A similar significant relationship concerns alsotrading volumes. In addition, stock returns (returns volatility) of the Austrian and especially of theGerman stock market influence Polish trading volume. The lack of significant DJIA returns impacton the trading volume on WSE on the same day is probably caused by the fact that changes of DJIAlead changes on the European stock markets.
Keywords: Copulas, dependences, stock returns, trading volume
1. Introduction
In the literature it is widely accepted that stock prices reflect investor’s beliefsabout possible future of company development. The level of prices is based on theavailable information about the respective firm (Gurgul et al. (2003a), Gurgul et al.(2003b), Mestel et al. (2003)), Mestel and Gurgul (2003). The new pieces of informa-tion change investors expectations and cause price movements. Usually investors
* Department of Economics and Econometrics, Faculty of Management, University of Science and
Technology, Al. Mickiewicza 30, 30-059 Kraków, Poland, e-mail: [email protected]** Institute of Banking and Finance, University of Graz, Universitaetsstr.15/F2, A-8010 Graz,
Austria, e-mail: [email protected]*** Department of Quantitative Methods, School of Economics and Computer Science, ul. Św. Filipa
17, 31-150 Kraków, Poland, e-mail: [email protected]

H. GURGUL et al.18
differ in their evaluation of new information. Therefore pieces of information whichreach the stock market might have no effect on stock prices. This can take place ifsome investors interpret the same news quite differently or if they start from differentexpectations. Thus, it is easy to derive from these facts that prices represent the aver-age reaction of investors to incoming information. Changes in prices therefore reflectthe average reaction of investors to news (Clark (1993), Copeland (1976)). As in thecase of prices, trading volume and trading volume changes adjust mainly to theavailable set of relevant information on the market. Contrary to stock prices, a revi-sion in investor’s expectations always leads to an increase in trading volume. Tradingvolume reflects the sum of investor’s reactions to news. Therefore investigation of thejoint behaviour of stock prices and trading volume improves the understanding of themicrostructure of a stock market. This fact can also have implications for research onoptions and futures markets.
A proper answer to the question as to whether knowledge of some variables onone financial market (e.g. volatility) can support short-run forecasts of others isvery important not only for researchers but also for market participants (Gallantet al. [11]). The short-run forecasts of one variable by mean of another variable area function of the level of dependency between these two variables. Therefore it isnot surprising that there has recently been published an increased number of con-tributions concerning the level of dependence between trading volume, stock re-turn and return volatility. Previous empirical contributions have focused on thecontemporaneous relationship between price changes and volume (see overviewby Karpoff [18])1. The contributors investigated a contemporaneous relationshipbetween trading volume and volatility approximated by absolute value or squaredstock returns. They observe positive feedback between trading volume and stockprices, i.e. high trading volume is associated with an increase in stock prices andvice versa. In this context the literature widely disccusses an asymmetry in stockprice response to good and bad news. Empirical evidence that supports such anasymmetry in market reactions e.g. on the Austrian stock market, can be alsofound in Gurgul et al. [13], Gurgul et al. [14], Mestel et al. [21], Ariel [1], Frech[9], Jain and Joh [16] and Jennings et al. [17]. Some of the earlier studies look atcontemporaneous and dynamic price–volume relationships and the impact of onemarket on another market2.
Applying linear and nonlinear Granger causality tests (Granger [12]) to daily DowJones stock returns, and percentage changes in NYSE trading volume, Hiemstra andJones [15] established a significant bi-directional nonlinear causality between returns
1 In this extensive review of theoretical and empirical research concerning the price-volume relation,
Karpoff [18] gives several causes why this relationship is important.2 A few previous studies explicitly test for causality between stock prices and trading volume, e.g.
Rogalski [24], Smirlock and Starks [25], Jain and Joh [16].

Polish stock market... 19
and volume3. The contribution by Chordia and Swaminathan [4] provides evidencethat the daily returns of stock with high trading volume outperform the daily returnsof stock with low trading volume. The authors tried to convince the reader that thereason for this observation is the tendency of stock with a high trading volume to re-spond promptly to rewly released information. These studies focus on domestic rela-tionships in a dynamic context between trading volume and stock returns. The contri-bution of Lee and Rui [19] gives new insight into this subject by examining inter-country dynamic relations for the three largest stock markets, namely US, UK andJapanese. The authors established that US financial market variables have predictivepower for UK and Japanese financial market variables.
At the end of the 80s Poland started the transition process from a centrally plannedeconomy to a market economy. It was the first transformation of this kind in historyand there was no economic theory of such a process. The early 90s were extremelydifficult for Poland and other central European countries.
Stock quotations on the WSE started on 16th April, 1991. One can assume that onthis day the WSE was re-established (after more than a 50-year break) as the exclu-sive place of trading on the Polish stock market. Continuous trading begun in 1996,but only the most liquid stocks were included in this system. The question ariseswhether on the Polish stock market the same mechanisms can be identified as on adeveloped capital market and a subsequent question about the degree of dependenceof the Polish stock market on three developed stock markets, namely US (DJIA),German (DAX) and Austrian (ATX).
The question of dependency among stock markets at the time of globalization isquite an important topic. The level of dependence between the stock markets can bemeasured through such variables as stock return, trading volume and volatility. Be-cause of deficiences in traditional dependency measures like correlation, in the recentfinance literature copulas are applied. The shortcomings of correlation which can beavoided by means of copula application are briefly listed in paragraph 3.2.
Applying copulas, in this paper we examine whether trading volume depends onstock return as well as return volatility based on data which come from the WarsawStock Exchange (WSE). Besides domestic relationships between stock returns andtrading volume and volatility, we are also interested in the question of relationshipsbetween WIG and the foreign stock markets mentioned above. We checked if WIGreturns (logvolume of WIG) are somewhat related to stock returns (logvolumes) of theUS, German and Austrian stock markets. In addition, we tested the impact of returns(volatility) from the US, German and Austrian stock markets on the trading volume ofthe Polish stock market. We found a significant relationship between trading volume
3 These results seem to be not in line with the empirical work of Gallant et al. [11], who findsa strong nonlinear impact of lagged stock returns on current and future trading volume, but only weaknonlinear effects from lagged trading volume to current and future stock returns by using daily S&P 500index stock returns and NYSE trading volume.

H. GURGUL et al.20
from Warsaw Stock Exchange and Vienna Stock Exchange returns (volatility), andmore especially German returns (volatility).
The remainder of this paper is organized as follows, Sections 2 and 3 containa brief description of our data set and an outline of the methodology applied. In Sec-tion 4 test results for dependence between trading volume and return and volatility,both domestically and internationally, are presented. Section 5 concludes the paper.
2. Data
Our data set comprises the daily market price index (WIG), and trading volume meas-ured by the number of shares traded within one trading day on the WSE. Additionally, weincluded in our sample the daily market price index and trading volume for three foreignstock exchanges, namely New York (DJIA), Frankfurt (DAX) and Vienna (ATX). Theinvestigation covers the period 22/06/1998–05/11//2004. Each variable contains 1648 ob-servations. The sources of these data include the data banks collected by PARKIET,REUTERS, BLOOMBERG, DEUTSCHE BOERSE and additional publications of WSE.All these series are matched.
We applied continuous stock returns given by:
),1(~)],1(1log[)log()log( 1 ttrttrPIPIR ttt −=−+=−= − (1)
where PIt stands for the value of a price index on date t, PIt–1 stands for the value ofa price index on date t – 1, and log denotes the natural logarithm. As can be easilyjustified, ),1(~ ttr − is an approximation of the theoretical definition of returns givenby discrete stock returns. Taking Maclaurin’s expansion of (1) by the order of two, wecan state that this formula undervalues the exact return (i.e. discrete stock return). Inspite of this we decided to compute stock returns by using continuous returns (equa-tion (1)), because the use of a natural logarithm improves some statistical propertiesof financial time series distribution. Furthermore, since the logarithmic transformationbelongs to the Box–Cox transformation, it can stabilize the variance.
3. Methodology
3.1. Stationarity and expected trading volume
We applied a methodology based on copula theory. Any inference on the basis ofthis theory rests on the assumption that the variables to which this methodology is
Polish stock market... 21
applied are stationary. Therefore in the first phase of our study we tested the hypothe-sis whether the time series of trading volume, returns and return volatility can be as-sumed to be stationary. In consistence with the empirical work of Gallant et al. [11],who documented evidence of both linear and nonlinear time trends in trading volumeseries, we made attempts to estimate the regression defined by equations (2) to checkwhether trading volume series need to be detrended.
tt taaV ε++= 10
tt tataaV ε+++= 2210 (2)
where Vt is raw trading volume, t = 1, ..., N (N stands for the number of observa-tions).
After controlling the presence of linear and nonlinear trends in trading volume se-ries, we continued the testing of stationarity by using an augmented Dickey-Fuller(ADF) test. This test is based upon the regression:
∑=
−− +Δ++=Δk
itititt yyy
1110 εδαα (3)
where y denotes the respective time series.The unit root test is carried out by testing the null hypothesis α1 = 0 against the
one-sided alternative α1 < 0. It is not surprising that the t-Student statistic of the esti-mated parameter α1 does not have a conventional t-distribution under the null hy-pothesis of a unit root. Instead of this, we use the critical values recommended byCharemza and Deadman [3]. If the ADF t-statistic for α1 lies to the left of these val-ues, the null can be rejected.
Conducting ADF tests for each time series of stock returns and trading volume in-cluded in our sample, we find parameter α1 to be negative and statistically significantat common significance levels. Hence we come to the conclusion that our time seriescan be assumed to be stationary.
The considered financial return series exhibit some degree of autocorrelationand, more importantly, heteroskedasticity (detected by Engle’s ARCH test). Copulamodelling requires that the data are approximately independent and identically dis-tributed (i.i.d.). We use ARMA models to describe conditional means,GARCH/GJR for conditional variances of returns and volatilities and EGARCH forconditional variances of detrended trading volumes (see Appendix A for a formula-tion of these models, the estimation results are available upon request from theauthors). Standardized (by the corresponding conditional standard deviations) re-siduals from the models applied are approximately i.i.d. and are used for modellingthe structure of dependence by copulas.

H. GURGUL et al.22
3.2. Copulas
Classic correlation as a dependence measure exhibits some shortcomings; thevariances of X and Y must be finite or the linear correlation is not defined. This isnot ideal for a dependency measure and causes problems when we work withheavy-tailed distributions. Moreover, the independence of two random variablesimplies that they are uncorrelated, but zero correlation does not in general implyindependence. Only in the case of multivariate normal distribution there is a lack ofcorrelation equivalent to independence. In addition, linear correlation has the an-other serious deficiency. It is not invariant under nonlinear strictly increasing trans-formations, i.e. if T: IR → IR, then for two real-valued random variables X and Y itdoesn’t in general holds true that
),())(),(( YXYTXT ρρ ≠ .
Correlation is also a source of statistical problems. It is not a robust measure. Thismeans that a single observation can have an arbitrarily high influence on the linearcorrelation. In addition the correlation is defined if variances of both random vari-ables are finite.
A low dependency between two markets implies a good opportunity for an investorto diversify their investments risk. Suppose that the annual returns in a domestic marketand in a foreign market have a linear correlation coefficient of 0.10. Under the normaldistribution assumption, the probability that returns in both markets are in their lowest5th percentiles is less than 0.0025. Thus, based on the Gaussian assumption, an investorcan significantly reduce his risk by balancing his portfolio with stocks from a foreignstock market. However, it has been observed that market crashes and financial crisesoften happen in different countries in about the same time period, even if the depend-ency measured by correlation is very low between these markets. Researchers haveraised the question of a different dependence structure between markets with the same(pairwise) correlations. These dependence structures could increase or decrease thediversification benefit compared to the normal distribution assumption.
Another approach that has been used in empirical studies is computing conditionalcorrelation. It is well known that correlations calculated with different conditionscould exhibit essential differences. It has been found that correlations conditional onlarge price or trading volume movements are higher than those conditional on smallmovements. This observation is known in the literature as “correlation breakdown”.As Bouye et al. [2] stressed, in these situations the correlation coefficient does notexplain the actual dependency. The reason is that even in the case of normal distribu-tion a stronger dependence is forecasted in hectic periods and a weaker dependence inquiet periods. To conclude, although conditional correlation provides more informa-tion concerning dependence between market variables than unconditional, the results
Polish stock market... 23
of correlation analysis should be evaluated with caution. These results may be con-fusing and misleading.
In order to take into account the structure of the stochastic dependence between fi-nancial variables have been frequently used in recent years copulas. The copulas reflectthe structure of dependence between variables, whereas classical correlation coefficientsdo not (see e.g. Embrechts et al. [7], Embrechts et al. [8], Frees and Valdez [10]).
From a mathematical point of view copulas are multidimensional cumulative dis-tribution functions with a uniform distribution on [0, 1] margins. Copulas are invari-ant in respect to strict monoton and continuous transformations.
In the following part we are concerned with 2-dimensional copulas. The definitionand properties of d-dimensional copulas, where d > 2 are quite similar to those for the2-dimensional copula.
Now, we give a definition of 2-dimensional copula function.Definition 1. A two-dimensional copula (or briefly, a copula) is a function with
the following properties:1. For every u1, u2 in [0, 1]
),0(0)0,( 21 uCuC == .
2. For every u1, u2 in [0, 1]
11 )1,( uuC = and 22 ),1( uuC = .
3. For every u
u11, u12, u21, u22 in [0, 1] such that 1211 uu ≤ and 2221 uu ≤ , the fol-lowing condition is satisfied:
0),(),(),(),( 2111221121122212 ≥+−− uuCuuCuuCuuC .
From this definition it follows that a 2-dimensional copula C is a distributionfunction defined on [0.1]2 with uniformly distributed margins on [0, 1]. Property 1says that C is grounded, property 3 is called 2-increasing. These properties regardedtogether imply that copula C satisfies the Lipschitz condition (so copulas are uni-formly continuous). The most important result regarding copulas is Sklar’s Theorempresented below (see Nelsen [22], Embrechts et al. [8]):
Theorem 1. Let H be a joint distribution function with margins F1 and F2. Thenthere exists a copula C such that for all x1 and x2 in R
))(),((),( 221121 xFxFCxxH = . (4)
If F1 and F2 are continuous, then C is unique; otherwise, C is uniquely determined on21 RanRan FF × . Conversely, if C is a copula and F1 and F2 are distribution functions,
then the function H defined by (1) is a joint distribution with margins F1 and F2.Corollary 1. Let H be a distribution function with margins F1 and F2 and cop-
ula C. Then for every ),( 21 uu in [0, 1]2

H. GURGUL et al.24
))(),((),( 21
211
121 uFuFHuuC −−= ,
where 1−iF are quantile functions.
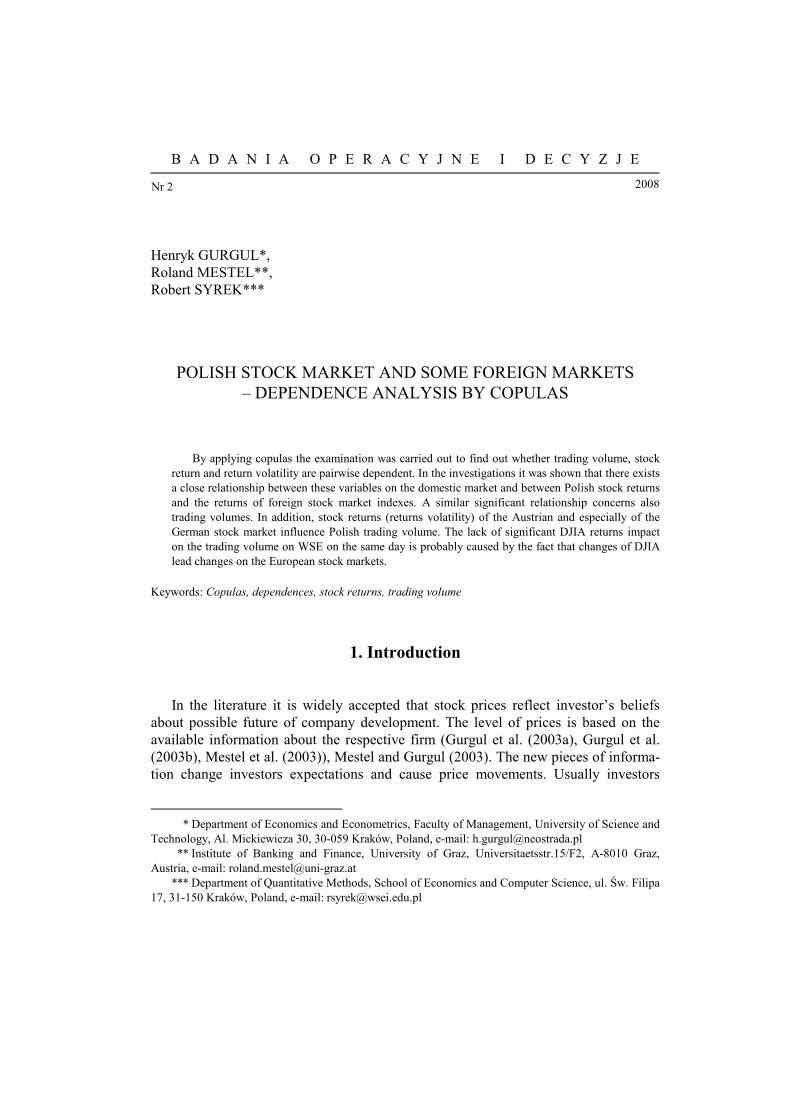
There are three special copulas mentioned in the literature. 2121 ),( uuuu =Π iscalled the product copula (copula of independency). The functions W(u1, u2) = max(u1
+ u2 – 1.0) and ),min(),( 2121 uuuuM = are called Fréchet–Hoeffding bounds and inthe case of bivariate copulas represent perfect negative and perfect positive depend-encies, respectively. In Figure 1 we present the contours of these copulas.
Fig. 1. Contours of W (top), M (centre) and Π (bottom)
Now, we give a lower and upper restriction for each copula C(u1, u2)Theorem 2. Let C be a copula. Then for every u1, u2 in [0, 1]
),(),(),( 212121 uuMuuCuuW ≤≤ .
Copula modelling is a natural way to study the tail dependence of multivariatedistributions. Thus, tail dependences structures are often modelled by copulas. They
Polish stock market... 25
briefly describe the limiting proportion that one margin exceeds a certain thresholdgiven that the second margin has already exceeded that threshold. Below we defineupper and lower tail dependence in terms of copulas (see e.g. Patton [23]).
Definition 2. If a bivariate copula C is such that
Uu uuuCu λ=
−+−
↑ 1),(21lim
1
exists, then C has upper tail dependence if ]1,0(∈Uλ , and upper tail independence if0=Uλ .
If a bivariate copula C such that
Lu uuuC λ=
↓
),(lim0
exists, then C has a lower tail dependence if λL ∈ (0, 1], and a lower tail independenceif λL = 0.
In the literature some classes of copulas are delineated. One of the most importantclasses are called the elliptical copula. Two important examples of elliptical copulasare a normal copula based on Gaussian distribution and a t-copula based on t-Studentdistribution.
A normal copula is described by the equation
));(),((),( 21
11
21 RuΦuΦΦuuC RGaR
−−= ,
where ΦR denotes the joint distribution of the 2-variate standard normal distributionfunction with linear correlation matrix R and Φ denotes the distribution function ofthe univariate standard normal distribution.
For t-copula the equality
),);(),((),( 21
11
,21, νυυυυ RututtuuC RtR
−−= ,
holds true. In this equality tR,v denotes the 2-dimensional t-Student distribution charac-terized by correlation matrix R, and ν degrees of freedom, tv stands for the univariatedistribution function of t-Student distribution with ν degrees of freedom.
Another important class we discuss in this paper are Archimedean copulas.Before we define these copulas we give a definition of pseudo-inverse function.Definition 3. Let∞ϕ be given a continuous, strictly decreasing function from[0, 1] to [0, ∞], such that ϕ (1) = 0. The pseudo-inverse of ϕ is the function
]1,0[],0[:]1[ →∞−ϕ given by
H. GURGUL et al.26
⎩⎨⎧
∞≤≤≤≤
=−
−
.)0(0)0(0),(1
]1[
ttt
ϕϕϕϕ (5)
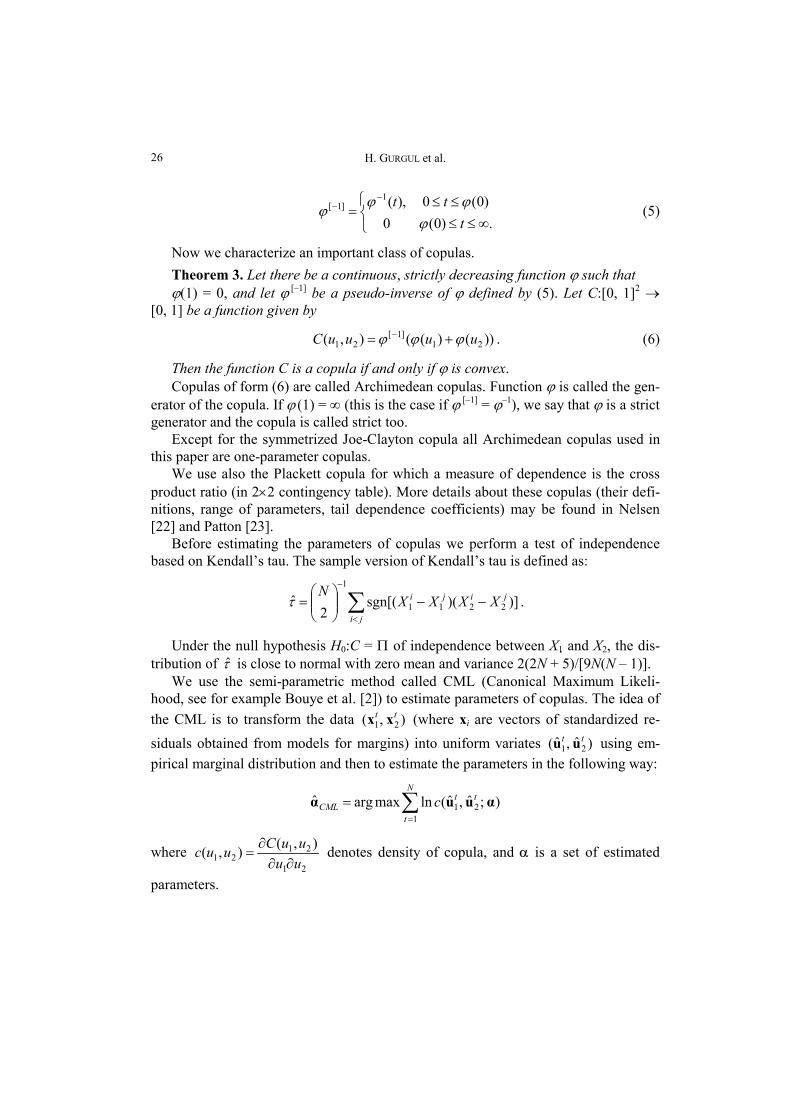
Now we characterize an important class of copulas.Theorem 3. Let∞ϕ there be a continuous, strictly decreasing function ϕ such thatϕ(1) = 0, and let ϕ [–1] be a pseudo-inverse of ϕ defined by (5). Let C:[0, 1]2 →
[0, 1] be a function given by
))()((),( 21]1[
21 uuuuC ϕϕϕ += − . (6)
Then the function C is a copula if and only if ϕ is convex.Copulas of form (6) are called Archimedean copulas. Function ϕ is called the gen-
erator of the copula. If ϕ (1) = ∞ (this is the case if ϕ [–1] = ϕ–1), we say that ϕ is a strictgenerator and the copula is called strict too.
Except for the symmetrized Joe-Clayton copula all Archimedean copulas used inthis paper are one-parameter copulas.
We use also the Plackett copula for which a measure of dependence is the crossproduct ratio (in 2×2 contingency table). More details about these copulas (their defi-nitions, range of parameters, tail dependence coefficients) may be found in Nelsen[22] and Patton [23].
Before estimating the parameters of copulas we perform a test of independencebased on Kendall’s tau. The sample version of Kendall’s tau is defined as:
∑<
−
−−⎟⎟⎠
⎞⎜⎜⎝
⎛=
ji
jiji XXXXN
)])(sgn[(2
ˆ 2211
1
τ .
Under the null hypothesis H0:C = Π of independence between X1 and X2, the dis-tribution of τ̂ is close to normal with zero mean and variance 2(2N + 5)/[9N(N – 1)].
We use the semi-parametric method called CML (Canonical Maximum Likeli-hood, see for example Bouye et al. [2]) to estimate parameters of copulas. The idea ofthe CML is to transform the data ),( 21
tt xx (where xi are vectors of standardized re-siduals obtained from models for margins) into uniform variates )ˆ,ˆ( 21
tt uu using em-pirical marginal distribution and then to estimate the parameters in the following way:
);ˆ,ˆ(lnmaxargˆ 211
αuuα ttN
tCML c∑
=
=
where 21
2121
),(),(uuuuCuuc
∂∂∂
= denotes density of copula, and α is a set of estimated
parameters.

Polish stock market... 27
After having estimated the parameters of the copulas, we selected the copulathat fitted best the data set using Akaike (AIC) and Bayesian (BIC) informationcriteria.
4. Empirical results
At the very beginning of empirical investigations we computed descriptive statis-tics. In Table 1 we present these statistics. One can easily see that the time series ofreturns, trading volume and volatility are highly nonnormal.
They exhibit particularly considerable kurtosis and skewness.
Table 1. Descriptive statistics of data
PANEL A : Daily stock returnsWIG ATX DAX DJIA
1 2 3 4 5Mean 0.000297 0.000235 –0.0002 0.000107SD 0.015156 0.010071 0.018106 0.012044Kurtosis 6.620991 6.758212 4.763626 5.347789Skewness –0.21151 –0.61766 –0.09723 –0.01333Min –0.09974 –0.06426 –0.08875 –0.065781st Quartile –0.00789 –0.00483 –0.01025 –0.00655Median 0.000435 0.000528 0.000322 0.0001593rd Quartile 0.008089 0.005468 0.010182 0.006739Max 0.078933 0.042064 0.075527 0.061547PANEL B: Daily detrended trading volume
WIG ATX DAX DJIAMean 5.60E-10 2.29E-10 3.40E-09 2.42E-08SD 3322606 890952.4 25731298 67034711Kurtosis 7.912583 92.02762 56.36092 6.070101Skewness 1.606895 6.98681 4.997853 1.150952Min –6449467 –1161424 –8.4E+07 –2E+081st Quartile –2224637 –476888 –1.2E+07 –4.9E+07Median –691630 –136136 –2817399 –90837323rd Quartile 1443311 256911.7 7348702 37316790Max 23313005 14899104 3.65E+08 4.27E+08

H. GURGUL et al.28
cd. tab. 1
PANEL C: Daily volatility (absolute values of returns)WIG ATX DAX DJIA
Mean 0.010872 0.007216 0.013455 0.008914SD 0.01056 0.007027 0.012113 0.008098Kurtosis 11.4549 11.43908 7.173584 8.958387Skewness 2.206391 2.288446 1.732841 1.922723Min 5.18E-06 0 9.23E-06 01st Quartile 0.003474 0.002395 0.004622 0.003073Median 0.007942 0.00519 0.010193 0.0066823rd Quartile 0.015207 0.009887 0.018327 0.012403Max 0.099741 0.064261 0.088747 0.065782
The dataset covers the period 22/06/1998–05/11/2004. Each variable con-sists of 1648 observations. The sources of these data include the data banks col-lected by PARKIET, REUTERS, BLOOMBERG, DEUTSCHE BOERSE andadditional publications of WSE. All these time series are matched. The descrip-tive statistics of daily stock returns, log-volume and volatility exhibit significantkurtosis and skewness. This indicates non-normality of the listed variables.
4.1. Domestic market
The empirical procedure in this section tests the relation between stock returns and trad-ing volume, and the relation between volatility and trading volume on Warsaw Stock Ex-change (WSE). We find Kendall’s tau equal to 0.1308 and 0.1813, respectively. This indi-cates that dependence between returns and trading volume is essentially smaller than betweentrading volume and volatility. We reject the hypothesis of independence at a significancelevel of 5% in both cases. Table 2 reports results of copula estimation procedures.
Table 2. Relationships on Polish stock market (WSE)
Relationship “Best” copula Parameter(s) λL λU
R ↔ V symmetrized Joe-Clayton 0.2310 0.0000 0.0000 0.2310|R | ↔ V rotated Clayton 0.3801 0.0000 0.1615
The best copulas fitted to the domestic data of the pairs returns – trading volume andvolatility – trading volume show some dependence asymmetry. Result exhibit upper tail de-pendence and lower tail independence. SJC stands for symmetrized Joe-Clayton copula.
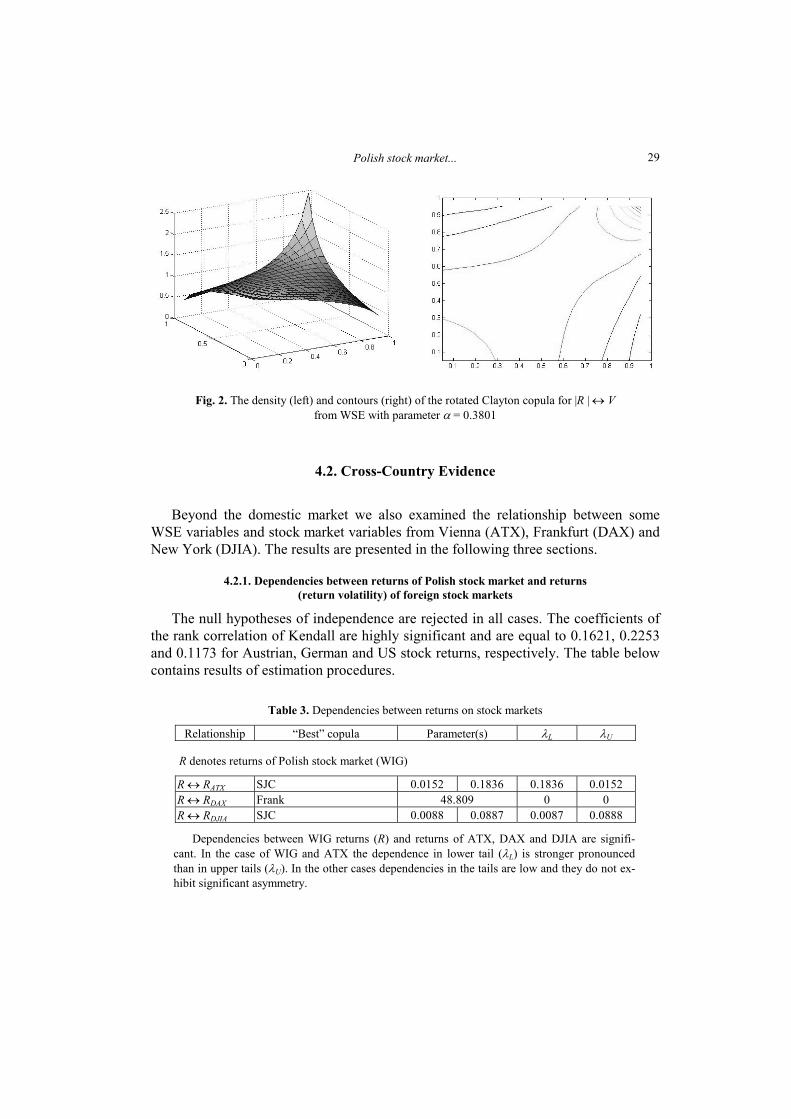
In Figure 2 the density and contours of the rotated Clayton copula are presented.It follows from this table that returns and trading volume are dependent in the
upper tail. The same is true for trading volume and volatility dependence.
Polish stock market... 29
Fig. 2. The density (left) and contours (right) of the rotated Clayton copula for |R | ↔ Vfrom WSE with parameter α = 0.3801
4.2. Cross-Country Evidence
Beyond the domestic market we also examined the relationship between someWSE variables and stock market variables from Vienna (ATX), Frankfurt (DAX) andNew York (DJIA). The results are presented in the following three sections.
4.2.1. Dependencies between returns of Polish stock market and returns(return volatility) of foreign stock markets
The null hypotheses of independence are rejected in all cases. The coefficients ofthe rank correlation of Kendall are highly significant and are equal to 0.1621, 0.2253and 0.1173 for Austrian, German and US stock returns, respectively. The table belowcontains results of estimation procedures.
Table 3. Dependencies between returns on stock markets
Relationship “Best” copula Parameter(s) λL λU
R denotes returns of Polish stock market (WIG)
R ↔ RATX SJC 0.0152 0.1836 0.1836 0.0152R ↔ RDAX Frank 48.809 0 0R ↔ RDJIA SJC 0.0088 0.0887 0.0087 0.0888
Dependencies between WIG returns (R) and returns of ATX, DAX and DJIA are signifi-cant. In the case of WIG and ATX the dependence in lower tail (λL) is stronger pronouncedthan in upper tails (λU). In the other cases dependencies in the tails are low and they do not ex-hibit significant asymmetry.

H. GURGUL et al.30
In Figure 3 we present the density and contours of symmetrized Joe-Clayton (SJC)copula for R ↔ RATX (see Table 3).
Fig. 3. Density (left) and contours of density of symmetrized Joe-Clayton copulawith α = [0.0152; 0.1836]
The shape of best copulas and values of parameters λL and λU convinced us thatdependencies of returns are significant and approximately symmetric in lower andupper tails (except for ATX data, where dependence in lower tail is stronger).
4.2.2. Trading volume of Polish stock market versus trading volumes of foreign stock markets
This section contains results of testing dependencies between Polish trading vol-ume and the trading volumes of some developed stock markets. We find that signifi-cant rank correlations (even at 1% level) between the volume of WIG and ATX,DAX, DJIA volumes, respectively exist. The coefficients of Kendall’s tau are rathersmall and amount to 0.0455, 0.0861 and 0.1479, respectively. The copulas that fitthese relationships best are reported in the table below.
Table 4. Dependencies between trading volumes on stock markets
Relationship “Best” copula Parameter(s) λL λU
V denotes trading volume of Polish stock market (WIG)
V ↔ VATX Plackett 1.2299 0 0V ↔ VDAX t-student 0.2281 21.065 0.0012 0.0012V ↔ VDJIA Plackett 1.4761 0 0
The volume dependencies do not differ in lower (λL) and upper (λU) tails. These empiricalobservations follow also from theoretical properties of the “best fit” copulas, which are symmet-ric by definition.
We visualize the relationship between WIG and DJIA volumes by Figure 4.

Polish stock market... 31
Fig. 4. Density (left) and contours of density of Plackett copula for V ↔ VDJIA with α = 1.4761
These results concerning trading volume dependencies are symmetric in lower andupper tails. In Figure 4 we can see symmetric independence in the tails.
4.2.3. Polish trading volume and foreign stock returns (returns volatilities) dependencies
In this paragraph the relationship between the returns (volatilities) of foreign stockmarkets and the volume of the Polish stock market is modelled. The coefficients ofKendall’s tau between the volume of WIG and ATX stock returns (ATX volatility) isequal to 0.0558 and is significant at a 5% level (0.0319, significant at a 10% level) asin the case of the German market (coefficients are 0.0449 and 0.0322, respectively).In the case of the DJIA index we cannot reject the null hypotheses of independence.Kendall’s tau coefficients are equal to 0.014933748 and 0.004200046 (with p-valuesof 0.3636 and 0.7983, respectively).
Table 5. Dependencies between Polish trading volume (V) and foreign returns (volatilities)
Relationship “Best” copula Parameter(s) λL λU
R denotes returns of Vienna Stock Exchange (ATX)R ↔ V Plackett 1.2867 0 0|R| ↔ V Plackett 1.1582 0 0
R denotes returns of Frankfurt Stock Exchange (DAX)R ↔ V rotated Clayton 0.0908 0 0.0005|R| ↔ V Plackett 1.1573 0 0
R denotes returns of New York Stock Exchange (DJIA)R ↔ V normal 0.0240 0 0|R| ↔ V normal 0.0138 0 0
Polish trading volume depends (from statistical point of view) weakly on ATX and DAX re-turns and returns volatility and does not depend on DJIA returns and returns volatility. All relationsare symmetric in the ranges of the market variables considered (compare (λL) and (λU)).
H. GURGUL et al.32
Conclusions
This study analyses the relationships between trading volume and stock returnsand return volatility for the Polish stock market and its dependence on three devel-oped stock markets, namely the US, German and Austrian.
Applying a dependence measure based on copulas, we observed:• a significant relationship between returns and trading volume on the domestic
stock market,• a significant relationship between volatility and trading volume on the domestic
market,• a significant relationship between Polish stock returns and the returns of foreign
stock market indexes,• a significant relationship between Polish trading volume and the trading vol-
umes of the foreign markets under study,• a significant relationship between Polish trading volume and stock return and
stock return volatility from the German (DAX) and Austrian (ATX) stock markets,• the lack of a significant relationship between Polish trading volume (WIG) and
stock return and stock return volatility on the American stock market (DJIA).In our opinion there are good reasons why in the case of the Warsaw Stock Exchange a
significant relationship between return volatility and trading volume takes place. Consid-ering the size of the Polish stock market and the well-known fact that initial stock pricemovements attract additional equity investments on the WSE, we come to the conclusionthat the significant relationship between volatility and trading volume is quite obvious.
It results from our investigations that there exists a close relationship between Polishstock returns and the returns of foreign stock market indexes. A similar significant rela-tionship concerns trading volumes. In addition, stock returns (return volatility) of theAustrian and especially the German stock market considerably influence Polish tradingvolume. The lack of significant DJIA impact on the WSE on the same day is probablycaused by the fact that changes of DJIA lead changes on the European stock markets.
Since trading volumes data exhibits significant autocorrelation it follows from ourfindings that knowledge of stock price movements on the German as well as the Aus-trian stock market can improve short–run forecasts of the current and future tradingvolume of the Polish stock market. This may be important for so called noisy traderswho make investment decisions solely upon the observations of prices movementsand trading volume development on domestic and foreign stock markets.
In addition, the similar level of impact of the German and Austrian stock marketson the Polish stock market is not a surprise although the Frankfurt Stock Exchange ismuch bigger than the Vienna Stock Exchange. The fact is that the Austrian stock mar-ket depends very strongly on the German stock market. A very important reason forthe close relation between these stock markets is the significant dependence of the

Polish stock market... 33
Austrian economy on the German economy (i.e. exports from Austria to Germany in2006 amounted to 32% of total Austrian exports).
Our investigations are based on reliable data which come from the period22/06/1998–05/11//2004. Future investigations should be concerned with the stabilityover time of the relations between domestic and foreign stock market variables takinginto account more recent data.
References
[1] ARIEL R., High stock returns before holidays: Existence and evidence on possible causes, Journal ofFinance, 1990, Vol. 45, 1611–1626.
[2] BOUYE E., DURRLEMAN V., NIKEGHBALI A., RIBOULET G., RONCALLI T., Copulas for finance –A reading guide and some applications, Groupe de Recherche Operationnelle, Credit Lyonnais,Working Paper, 2000.
[3] CHAREMZA W., DEADMAN D., New directions in econometric practice, 2nd ed. Edward Elgar, Chel-tenham 1997.
[4] CHORDIA T., SWAMINATHAN B., Trading volume and cross–autocorrelations in stock returns, Journalof Finance, 2000, Vol. 55, 913–935.
[5] CLARK P., A subordinated stochastic process model with finite variance for speculative prices,Econometrica, 1973, Vol. 41, 135–155.
[6] COPELAND T.E., A model of asset trading under the assumption of sequential information arrival,Journal of Finance, 1976, Vol. 31, 1149–1168.
[7] EMBRECHTS P., LINDSKOG F., MCNEIL A.J., Modelling Dependence with Copulas and Applicationsto Risk Management, [in:] Handbook of Heavy Tailed Distributions in Finance, S. Rachev (ed.), El-sevier, Chapter 8, 2003, 329–384.
[8] EMBRECHTS P., MCNEIL A.J., STRAUMANN D., Correlation and dependency in risk management:properties and pitfalls, [in:] Risk Management: Value at Risk and Beyond, M.A.H. Dempster (ed.),Cambrige Univeristy Press, Cambrige 2002.
[9] FRECH K., Stock returns and the weekend effect, Journal of Financial Economics, 1980, Vol. 8, 55–59.[10] FREES E.W., VALDEZ E.A., Understanding relationships using copulas, North American Actuarial
Journal, 1998, Vol. 2, 1–25.[11] GALLANT R., ROSSI P., TAUCHEN G., Stock prices and volume, Review of Financial Studies, 1992,
Vol. 5, 199–242.[12] GRANGER C.W.J., Investigating causal relations by econometric models and cross – spectral meth-
ods, Econometrica, 1969, Vol. 37, 424–438.[13] GURGUL H., MESTEL R., SCHLEICHER C., Stock Market Reactions to Dividend Announcements: Em-
pirical Evidence from the Austrian Stock, Financial Markets and Portfolio Management, 2003, Vol.17, No. 3, 332–350.
[14] GURGUL H., MAJDOSZ P., MESTEL R., On the Empirical Linkages between Stock Prices and TradingActivity on the German Stock Market, [in:] H. Fleuren, D. Hertog, P. Kort (eds.), Operations Re-search Proceedings, 2004 (Selected Papers), Springer-Verlag, Tilburg 2005, 288–296.
[15] HIEMSTRA C., JONES J., Testing for linear and nonlinear Granger causality in the stock price – vol-ume relation, Journal of Finance, 1994, Vol. 49, 1639–1664.
[16] JAIN P., JOH G., The dependence between hourly prices and trading volume, Journal of Financial andQuantitative Analysis, 1988, Vol. 23, 269–283.

H. GURGUL et al.34
[17] JENNINGS R., STARKS L., FELLINGHAM J., An equilibrium model of asset of trading with sequentialinformation arrival, Journal of Finance, 1981, Vol. 36, 143–161.
[18] KARPOFF J., The relation between price changes and trading volume: A survey, Journal of Financialand Quantitative Analysis, 1987, Vol. 22, 109–126.
[19] LEE B.-S., RUI O., The dynamic relationship between stock returns and trading volume: Domesticand cross-country evidence, Journal of Banking and Finance, 2002, Vol. 26, 51–78.
[20] MESTEL R., GURGUL H., ARIMA Modeling of Event Induced Stock Price Reactions in Austria, Cen-tral European Journal of Operations Research, Springer-Verlag, 2003, Vol. 11, No. 4, 317–333.
[21] MESTEL R., GURGUL H., SCHLEICHER C., Capital Market Efficiency – An Empirical Analysis of theDividend Announcement Effect for the Austrian Stock Marke, Operations Research, 2002, Springer-Verlag, Berlin, Heidelberg, New York, Hong Kong, London, Milan, Paris, Tokyo 2003, 315–320.
[22] NELSEN R., An Introduction to Copulas, Springer-Verlag, New York 1999.[23] PATTON A., Modelling asymmetric exchange rate dependence, International Economic Review,
2006, 47 (2), 527–556.[24] ROGALSKI R., The dependence of prices and volume, Review of Econometrics and Statistics, 1978,
Vol. 36, 268–274.[25] SMIRLOCK M., STARKS L., An empirical analysis of the stock price – volume relationship, Journal of
Banking and Finance, 1988, Vol. 12, 31–41.
Polski rynek akcji a wybrane rynki zagraniczne– analiza zależności za pomocą kopul
W literaturze finansowej zajmowano się w znacznie mniejszym stopniu związkami między wielkościąobrotów, stopami zwrotu i ich wariancją warunkową w przypadku rynków „wschodzących” niż w przy-padku rozwiniętych rynków kapitałowych. Do pomiaru zależności pomiędzy zmiennymi finansowymistosuje się przede wszystkim współczynniki korelacji: Pearsona, Spearmana i Kendalla.
Okazuje się, że są to miary, które w przypadku rynków kapitałowych nie oddają struktury zależnościmiędzy zmiennymi finansowymi. W przypadku tych samych rozkładów brzegowych współczynniki ko-relacji są takie same. Obserwuje się, że mimo nieistotnej lub słabej korelacji między różnymi rynkamifinansowymi dochodzi na nich do niekiedy bardzo poważnych kryzysów dokładnie w tym samym czasie.Można stąd wysnuć hipotezę, że prawdopodobnie zależności w tzw. ogonach rozkładów stóp zwrotu,zwłaszcza w lewym ogonie (ang. left tail) są znacznie silniejsze niż można by wnioskować z wartościglobalnych współczynników korelacji. Poza tym w przypadku zarówno współczynnika korelacji Pearsonajak i rangowych współczynników korelacji wartość zerowa tych współczynników nie oznacza na ogółbraku zależności. Dlatego w ostatnich latach coraz powszechniej stosuje się alternatywne miary zależno-ści między zmiennymi finansowymi, przede wszystkim kopule. Stosując teorię kopul autorzy tej pracystarali się odpowiedzieć na pytanie, czy na podstawie wielkości stóp zwrotu i ich zmienności (ang. vola-tility) można wnioskować o wielkości obrotów? Przedstawione wyniki pozwalają na wyciągnięcie wnio-sku, że znajomość ruchu cen pozwala w krótkim okresie przewidzieć, przynajmniej w pewnym stopniu,wzrost obrotów. Poza badaniem związków między obrotami, stopami zwrotu i ich zmiennością na rynkukrajowym zbadano związek stóp zwrotu i ich zmienności na rynkach zagranicznych z wielkością obro-tów na Warszawskiej Giełdzie Papierów Wartościowych dla okresu 22.06.1998–05.11.2004. Wykorzy-stano indeksy giełdowe WIG, ATX, DAX oraz DJIA. Taki związek (wpływ na wielkość obrotów spółekobjętych WIG) został potwierdzony statystycznie w przypadku rynków niemieckiego i austriackiego.
Słowa kluczowe: kopule, zależności, stopy zwrotu, obroty
Polish stock market... 35
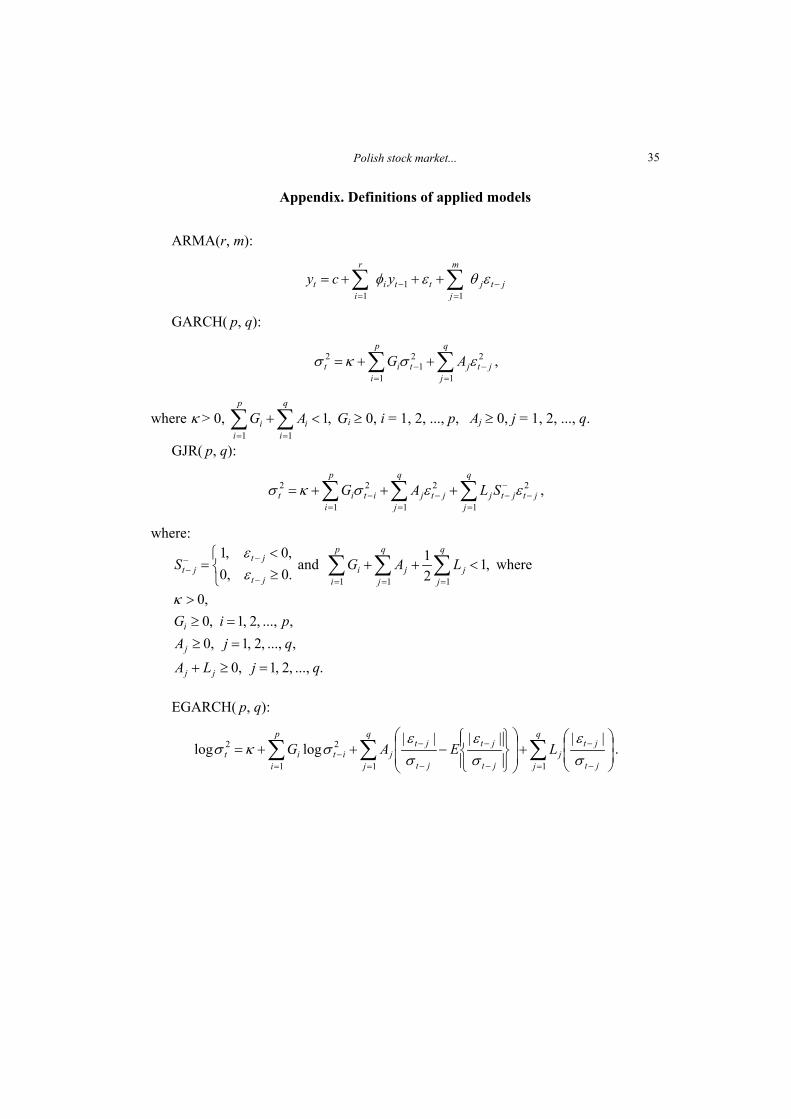
Appendix. Definitions of applied models
ARMA(r, m):
jtj
m
jtti
r
it ycy −
=−
=∑∑ +++= εθεφ
11
1
GARCH( p, q):
2
1
21
1
2jt
q
jjt
p
iit AG −
=−
=∑∑ ++= εσκσ ,
where κ > 0, ,111
<+∑∑==
q
ii
p
ii AG Gi ≥ 0, i = 1, 2, ..., p, Aj ≥ 0, j = 1, 2, ..., q.
GJR( p, q):
2
1
2
1
2
1
2jt
q
jjtjjt
q
jjit
p
iit SLAG −
=
−−−
=−
=∑∑∑ +++= εεσκσ ,
where:
⎩⎨⎧
≥<
=−
−−− .0,0
,0,1
jt
jtjtS
εε
and ,121
111
<++ ∑∑∑===
q
jj
q
jj
p
ii LAG where
....,,2,1,0
,...,,2,1,0,...,,2,1,0
,0
qjLA
qjApiG
jj
j
i
=≥+
=≥=≥
>κ
EGARCH( p, q):
∑∑∑= −
−
= −
−
−
−−
=⎟⎟⎠
⎞⎜⎜⎝
⎛+
⎟⎟
⎠
⎞
⎜⎜
⎝
⎛
⎪⎭
⎪⎬⎫
⎪⎩
⎪⎨⎧
−++=q
j jt
jtj
q
j jt
jt
jt
jtjit
p
iit LEAG
11
2
1
2 ||||||loglog
σε
σε
σε
σκσ .