policy positions in mixed member electoral systems ... · positions of the liberal democratic party...
TRANSCRIPT

Policy Positions in Mixed Member Electoral Systems:
Evidence from Japan∗
Shigeo Hirano† Kosuke Imai‡ Yuki Shiraito§ Masaki Taniguchi¶
Preliminary draft
August 25, 2011
Abstract
Do mixed member electoral systems provide the “best of both worlds”? We examine whether
candidates in the proportional representation (PR) tier of these systems take policy stances
closer to their party’s position while candidates in the single member district (SMD) tier adopt
policy positions to appeal to their districts preferences. We exploit a comprehensive panel survey
of all candidates for the Japanese Upper and Lower House elections between 2003 and 2010 and
estimate the policy positions of each candidate over time using Bayesian item response theory
model. Our analysis suggests that candidates’ policy positions vary substantially within parties.
In addition, the two major parties appear to converge in the economic policy dimension during
this period. In general, we find limited evidence consistent with the “best of both worlds”
hypothesis. In the economic policy dimension, there is tentative evidence that Lower House
SMD candidates are responding to their districts’ preferences while PR candidates are closer
to the position of the median party member. In the main foreign/security policy dimension,
however, SMD candidates are not particularly responsive to their districts’ preferences.
∗An early version of this paper was presented at the Yale Japan Conference in August 2010. We thank Mari
Mizoguchi and Shunsuke Hirose for excellent research assistance on that earlier version. Financial support from the
NSF grant (SES–0849715) is acknowledged.†Assistant Professor, Department of Political Science, Columbia University, New York, NY 10027. Phone: 212–
854–3704, Email: [email protected]‡Assistant Professor, Department of Politics, Princeton University, Princeton NJ 08544. Phone: 609–258–6610,
Email: [email protected], URL: http://imai.princeton.edu§Ph.D. student, Department of Politics, Princeton University, Princeton NJ 08544. Email: [email protected].¶Professor, Graduate Schools for Law and Politics, The University of Tokyo, 7–3–1 Hongo, Bunkyo, Tokyo 113–
0033. Phone: +81–3–5841–3131, Email: [email protected], URL: http://www.masaki.j.u-tokyo.ac.jp

1 Introduction
Mixed member electoral systems have traditionally been idealized as having the “best of both
worlds” (Shugart and Wattenberg, 2001). According to this view, with legislators elected from
both single member districts and party lists, such electoral systems should have legislators who
focus on representing geographically narrow interests as well as those who would appeal to a wider
range of voters for the common good of the party. The empirical literature provides conflicting
evidence as to whether or not such systematic differences in the behavior of legislators elected under
single member districts (SMDs) and proportional representation (PR) systems actually exists. For
example, surveys of legislators in Germany and Hungary show that those elected in an SMD tend
to focus more on constituency services than the ones elected from the PR list (e.g., Lancaster and
Patterson, 1990; Judge and Ilonszki, 1995).1 In contrast, studies of roll call voting behavior in the
Russian Duma (Haspel et al., 1998; Remington and Smith, 1998) and Ukrainian Verkhovna Rada
(Herron, 2002) find little systematic difference in party cohesion between legislators elected from
SMDs versus off the PR list.
In this paper, we analyze what may be the most comprehensive panel survey of legislative
candidates from Japan to test whether mixed member electoral systems can indeed achieve the “best
of both worlds.” These surveys are taken just prior to the elections with the expectation that some
of the responses will be made public through a widely circulated national newspaper. Specifically,
we analyze an on-going panel survey of Japanese Upper and Lower House candidates between 2003
and 2010. This survey, which was conducted by the University of Tokyo in collaboration with
the Asahi Newspaper (Asahi-Todai Elite Survey (ATES)), has the following unique and attractive
features: (1) all candidates including both incumbents and challengers were surveyed prior to
each of the six elections that occurred between 2003 and 2010, (2) extremely high response rates
(over 85% on average) were achieved when compared with other similar elite surveys, (3) the same
set of policy questions were used over multiple survey waves and for politicians across different
chambers, and (4) surveys were conducted for the same set of legislators during election and non-
election years. A set of common policy questions asked in the surveys allow us to examine whether
the policy positions of candidates in the SMD component differ from those elected in the PR
component and how these patterns change over time. We use Bayesian item response theory model
1Committee assignments in Germany also appear to reflect the differences in incentives of the two types of
legislators (e.g., Stratmann and Baur, 2002).
1

to estimate policy positions of legislative candidates at each time period (Quinn, 2004; Treier and
Jackman, 2008).
In addition to the availability of the high-quality data, the Japanese electoral politics during
the last decade offers a substantively interesting case. In theory, certain aspects of Japan’s mixed
member system, such as the dual SMD and PR candidacies, are expected to favor candidates
who cater to the interests of their district constituents (e.g. Bawn and Thies, 2003; McKean and
Scheiner, 2000). On the other hand, the recent extraordinary fluctuations in Japanese electoral
outcomes has led many to argue that Japanese politics has become much more party centered
with the major parties following the median voter of the country (Reed et al., 2009; Kabashima
and Steel, 2010).2 This literature often points to the introduction of the mixed member system in
the Japanese Lower House, as an important factor facilitating the rise of party-centered electoral
competition (e.g., Rosenbluth et al., 2009; Rosenbluth and Thies, 2010; Taniguchi, 2011). Our
analysis of the ATES data should shed light on how the mixed member system influenced Japanese
electoral politics during this turbulent period.
Our findings suggest that the Japanese candidates, at least on the main dimension of policy
conflict, are not behaving in a manner consistent with legislators in the “best of both worlds.” While
we do find that despite the strict party discipline in the legislature candidates’ policy positions vary
substantially within a party, there exists no systematic difference between candidates competing in
the SMDs and those who are only on the PR lists. In fact, Japanese candidates across the electoral
institutions and even across the chambers appear to take similar policy positions. Moreover, there
does not appear to be much convergence in the policy positions of the candidates competing in the
SMDs, which suggests that the candidates’ policy positions are not clearly responding the policy
preferences of their constituencies. These results are consistent with the aforementioned existing
findings regarding the lack of systematic differences in roll call voting between legislators elected in
SMDs and from the PR list in the Russian Duma and Ukrainian Verkhova Rada. They are also in
agreement with the recent Japanese politics literature discussed above, which points to an increase
2At the turn of the 21st century, the Liberal Democratic Party (LDP) held just under half of the seats in the
Lower House of the Diet, while the Democratic Party of Japan (DPJ) held just over a quarter of the seats. With the
2003 election the pendulum moved in the DPJ’s direction as the DPJ’s seat share rose to close to forty percent. The
2005 election brought about a swing back to LDP as the ruling party secured over sixty percent of the Lower House
seats. The DPJ seat share dropped once again to around a quarter of the seats. By the end of the decade, the LDP
and DPJ’s positions the Lower House were reversed. The LDP holds only a quarter of the seats and the DPJ holds
well over sixty percent of the Lower House seats.
2

in party-centered electoral politics despite the institutional incentives to cultivate personal votes.
However, when we separate the economic policy dimension from the main ideological dimension
(closely aligned with foreign/security policies), we find substantial movement over time in the
positions of the Liberal Democratic Party (LDP) and Democratic Party of Japan (DPJ) candidates.
We present some preliminary evidence that SMD members may have been more responsive to their
districts’ economic policy preferences than the foreign/security policy preferences. This is perhaps
not surprising given the economic turmoil in Japan during this time period. Towards the end of the
paper, we provide tentative discussions about why Japanese SMD candidates are not responsive
to their district preferences along the main dimension of policy conflict but may be responsive to
their districts’ economic preferences.
The rest of the paper is organized as follows. In Section 2, we briefly discuss the “best of both
worlds” hypothesis and present theoretical expectations for the Japanese case. In Section 3, we
describe the ATES data in detail and briefly discuss the statistical method we use to analyze the
data. Section 4 presents the estimated policy positions of Japanese politicians and compare them
with alternative measures. In Section 5, we empirically examine the effect of the mixed member
system on Japanese electoral politics. Finally, Section 6 gives concluding remarks.
2 Best of Both Worlds?
Mixed member systems are often characterized as offering the “best of both worlds.” In this view,
legislators elected in single member districts (SMDs) are responsive to local interests while those
elected from proportional representation (PR) lists respond to the broader interests of the party.
Of course, the behavior of political actors and voters in the two tiers are unlikely to be independent
(e.g. number of parties competing in the SMD tier is affected by the need to gain votes in the
PR tier).3 Numerous scholars have argued that the degree to which the electoral incentives of
one tier is favored over the other is a function of the specific institutional features of the mixed
member electoral systems (e.g. Shugart and Wattenberg, 2001; Moser and Scheiner, 2004; Bawn
and Thies, 2003; Thamas and Edwards, 2006) Thus, we now briefly describe the unique features
of the Japanese mixed-member electoral system and present some theoretical expectations about
candidates’ policy positions under this particular system.
3The linkage between tiers if often referred to as contagion. See Crisp (2007) for a review of this literature.
3
2.1 The Japanese Mixed Member Electoral System
Japan first introduced a type of mixed member system for the Upper House of the Diet in the
1983 election (Shiratri, 1984). 100 out of the 252 Upper House seats were elected by proportional
representation. The remainder of the seats were elected in multi-member single non-transferable
vote districts (MMD/SNTV). Prior to this election, Upper House Diet members were elected by a
combination of a nationwide district and MMD/SNTV. Similarly, the mixed member system was
not introduced into the Lower House until the 1996 elections. In the first election, 200 seats were
elected by proportional representation (the PR seats were divided among 11 blocs) and 300 single
member districts. The number of PR seats was reduced to 180 by the 2000 election. Prior to 1996
all of the Lower House seats were elected by MMD/SNTV.
The current mixed member system for Japanese Lower House elections would arguably favor
the electoral incentives of the SMDs rather than the PR. Specifically, the electoral system for
Lower House is a mixed member majoritarian system where the number of seats a party can win
is determined by both the electoral success in the SMD and PR tiers. In contrast, other countries
such as Germany employs a mixed member proportional systems under which the number of seats
a party receives is determined by the PR lists votes. Moreover, relative to many other mixed
member majoritarian systems, a greater number of legislators are elected via SMDs rather than
the PR list.4
In addition to being a mixed member majoritarian system, most of Japan’s SMD candidates
are also competing for a position on their party’s PR list. Candidates who lose in their SMD
can still be elected from a PR depending upon the PR vote and the candidate’s rank on the
list. Rank on the PR list is largely determined by the candidates’ success in the SMD. Thus, it
has been pointed out that this feature of Japan’s mixed member system creates an even stronger
incentive for candidates to be responsive to the interests of their SMD constituents (e.g. McKean
and Scheiner, 2000; Bawn and Thies, 2003). In particular, Pekkanen et al. (2006) find that the
LDP used committee assignments to help the “zombie” legislators – i.e. those who lost in their
SMD race but won a seat off the PR list – be more responsive to their SMD constituents.
In sum, these features of the Japanese mixed member system suggest that political parties
in Japan should have a strong incentive to allow SMD candidates to be responsive to their local
constituencies’ interests. Of course, as previous scholars have noted, other forces, such as the
4Of the seven mixed member majoritarian systems listed in Moser and Scheiner (2004, p. 579) only Macedonia
elected a higher ratio of SMD to PR members.
4

candidate selection process, the parliamentary system and the electoral laws, may also influence
the ability of candidates to take independent actions to be responsive to their constituents (e.g.
Crisp, 2007; Moser and Scheiner, 2004; Estevez-Abe, 2006).
2.2 Responsiveness to Local Interests under the Mixed Member Systems
While the SMD tier of mixed member systems is supposed to increase responsiveness to local
interests, there are different ways in which such a pattern may present itself in candidates’ behavior.
Much of the existing literature has focused on the willingness of legislators elected from SMDs to
engage in constituency services (e.g., Stratmann and Baur, 2002) or serve on committees that are
related to their district interests (e.g., Lancaster and Patterson, 1990). There is mixed evidence,
primarily from studies of roll call voting data, as to whether SMD legislators are more likely to take
positions different from the party position and presumably closer to their own district preferences
(e.g. Thames jr., 2001; Herron, 2002; Haspel et al., 1998).
In contrast, we use candidates’ responses to survey questions just prior to the election in order
to assess the degree of responsiveness to local interests in SMD constituencies. While a legislator’s
roll call vote often incorporates a multitude of non-electoral factors (e.g. party pressure, cameral
rules, log rolling, strategic voting), the survey responses are a relatively costless way for candidates
to communicate their policy positions to their constituents. Perhaps for this reason, in the existing
literature, the empirical studies of legislators using elite survey tends to find evidence that SMD
candidates are more responsive to local interests as compared to PR candidates in mixed member
systems. This suggests that our study is more likely to capture responsiveness of SMD candidates
to their local interests in their districts.
To empirically test the above theoretical expectations, we use two different measures based
on our estimates of candidates’ policy positions obtained from the ATES data. The first measure
examines the difference in the dispersion of candidates’ policy positions within each tier. Assuming
that there is significant heterogeneity in preferences across SMD constituencies, then we should
expect the policy positions of SMD candidates to be more dispersed than PR candidates. The
second measure investigates the similarity of candidates’ policy positions who are competing within
the same SMDs. This approach assumes the Downsian model of spatial competition where the two
major candidates in SMDs will converge towards the median voter in their district. Before we
present the main empirical evidence of this paper in Section 5, we describe the details of the ATES
data and the statistical methods as well as our estimates of candidates’ policy positions.
5

Wave 1 2 3 4 5 6 7 8Year 2003 2003 2004 2005 2007 2008 2009 2010
Lower or Upper House Lower Lower Upper Lower Upper Lower Lower UpperPre-election survey? No Yes Yes Yes Yes No Yes Yes# of policy questions 13 22 14 19 18 20 35 36# of politicians 476 1159 482 1132 533 884 1333 558
incumbents 418 90 457 84 463 448 83challengers 741 230 671 293 421 885 312
(Unit) Response rate 0.82 0.95 0.76 0.91 0.81 0.83 0.98 0.82
Table 1: The Asahi-Todai Elite Survey (ATES). The survey consists of a total of eight wavesstarting in 2003, of which six are conducted right before Upper or Lower House elections. All ofincumbents and challengers running in these elections were asked to fill out questionnaires andthe (unit) response rate exceeds 85% on average. The sixth wave of the survey was conductedin anticipation of an early Lower House election, and both incumbents and challengers who wereexpected to run for offices were surveyed. However, the Diet was not dissolved until July 2009.
3 Data and Methods
In this section, we first describe the Asahi-Todai Elite Survey, and briefly explain the statistical
methodology we use to analyze the data.
3.1 The Asahi-Todai Elite Survey (ATES)
The data we analyze in this paper come from the Asahi-Todai Elite Survey (ATES), which has been
made publicly available at http://www.masaki.j.u-tokyo.ac.jp/ats/atpsdata.html. This sur-
vey was conducted by Ikuo Kabashima and Masaki Taniguchi of the University of Tokyo (a.k.a.
Todai) in collaboration with the Asahi Shimbun, the second most circulated national newspaper
in Japan.
Several unique features of the ATES data allow us to estimate politicians’ policy positions
over time and across chambers. First, as shown in Table 1, the ATES consists of eight waves, six
of which were conducted immediately before Upper or Lower House elections. Thus, the coverage
includes all national elections held in Japan since 2003, allowing us to examine how policy positions
of parties and politicians change over time. The investigators of the survey plan to continue it in
the future, suggesting that we will be able to investigate even longer term patterns of change in
Japanese electoral and legislative politics than what we present below.
Second, except for the first wave in which only incumbent Lower House members were surveyed,
all candidates running for each election were surveyed. This enables the investigation of policy
6

positions for both incumbents and challengers who run for the same offices. Note that in 2008
the sixth wave of the survey was conducted in anticipation of a Lower House election, and both
incumbents and challengers who were expected run for offices were surveyed. However, the diet
was not dissolved until July 2009.
Third, a majority of these politicians responded to the survey with the average response rate
exceeding 85% (ranging from 76% to 95%). This is an exceptionally high response rate for an elite
survey. For example, the Parliamentary Elites of Latin American (PELA) project has conducted
four waves of surveys in the lower chambers of 18 Latin American countries since 1994, and yet
the average response rate is only 57% with the lowest response rate of 25% in Brazil and Mexico
(Saiegh, 2009). Similarly, the 2000 and 2006 surveys of members of European Parliament resulted in
the response rate of 32% and 37%, respectively (Farrell et al., 2006). This unusually high response
rate is achieved in part because the results of the ATES, including some individual responses and
nonresponses, are published right before the election in the Asahi Shimbun, which has over ten
million circulations with morning and evening editions combined. This may also suggest that
politicians take the survey seriously as a way to signal their policy positions to voters, which will
increase the credibility of our estimates from the ATES data.
In addition to the above advantages, the ATES data contain policy questions that are asked in
several waves, permitting us to compare policy positions of the same or even different politicians
over time and across chambers (see Appendix for the translation of these and other policy questions
we use in our analysis). Figure 1 displays twelve policy questions that are asked at least in five
out of eight waves where the horizontal and vertical axes represent survey waves and politicians,
respectively. A gray thin horizontal line indicates the survey waves in which a politician answered
the policy question. The figure shows that these questions are asked to many candidates of both
lower and upper house elections across different survey waves.
Figure 2 further demonstrates the ability of the ATES data to compare politicians’ policy
positions across chambers and time periods. The left plot shows the number of common questions
asked to pairs of ATES respondents in the same wave. Since each wave is administered only
to one of the chambers, all of these respondents are candidates for offices in the same chamber.
Compare this distribution with those in the middle and right plots where we count the number of
shared questions for pairs of politicians within the same chamber but across waves and for those
pairs between chambers and across waves, respectively. The comparison shows that the number of
shared questions remains relatively high even for pairs of politicians who are not running for offices
7

Small Government
010
0020
0030
00
1 2 4 6 7 3 5 8
Lower House Upper House
Public Enterprise
010
0020
0030
00
1 2 4 6 7 3 5 8
Lower House Upper House
Keynesian Fiscal Policy
010
0020
0030
00
1 2 4 6 7 3 5 8
Lower House Upper House
Lifetime Employment
010
0020
0030
00
1 2 4 6 7 3 5 8
Lower House Upper House
Defense
010
0020
0030
00
1 2 4 6 7 3 5 8
Lower House Upper House
Constitution
010
0020
0030
00
1 2 4 6 7 3 5 8
Lower House Upper House
Preemptive Attack
010
0020
0030
00
1 2 4 6 7 3 5 8
Lower House Upper House
United Nations
010
0020
0030
00
1 2 4 6 7 3 5 8
Lower House Upper House
US−Japan Treaty
010
0020
0030
00
1 2 4 6 7 3 5 8
Lower House Upper House
North Korea
010
0020
0030
00
1 2 4 6 7 3 5 8
Lower House Upper House
Safety
010
0020
0030
00
1 2 4 6 7 3 5 8
Lower House Upper House
Foreigners' Voting Right
010
0020
0030
00
1 2 4 6 7 3 5 8
Lower House Upper House
Survey Waves (1−8)
Num
ber
of C
andi
date
s
Figure 1: Most Frequently Asked Policy Questions in the Asahi-Todai Elite Survey (ATES) Data.The vertical axis indicates all politicians in the ATES data whereas the horizontal axis representsthe survey waves. A gray thin holizontal line indicates the survey waves in which a politiciananswered the policy question. These questions allow us to compare policy positions of politiciansacross chambers and over time.
8

Within−chamber/Within−wavePairs
0 10 20 30 40 50
0.00
0.05
0.10
0.15
0.20
0.25
Within−chamber/Between−wavePairs
0 10 20 30 40 50
0.00
0.05
0.10
0.15
0.20
0.25
Between−chamber/Between−wavePairs
0 10 20 30 40 50
0.00
0.05
0.10
0.15
0.20
0.25
Number of Shared Questions
Den
sity
Figure 2: The Number of Questions Shared by Different Pairs of Politicians. The histogramssummarize the number of common questions shared within each type of politician pair. A “Within-wave” (“Between-wave”) pair represents two candidates who are surveyed in the same (different)survey wave, whereas a “Within-chamber” (“Between-chamber”) pair represents two candidateswho run for the offices in the same (different) chamber. By definition, between-chamber pairs do notinclude a pair of politicians who are surveyed in the same wave. The second and third histogramsimply that for many pairs of candidates at different time periods and in different chambers severalcommon questions are asked, facilitating the comparison of their policy positions over time andacross chambers.
in the same chamber and are surveyed at different time periods.
3.2 The Statistical Methodology
We estimate a separate policy position for each candidate for each time period. A total of the
ninety policy questions (see the Appendix) are reduced to a single policy dimension using Bayesian
factor analysis for ordinal data (Quinn, 2004; Treier and Jackman, 2008). We exploit the fact that
about a dozen of the questions were asked repeatedly in all eight waves to help make the estimates
of candidates’ positions comparable across time periods. Specifically, we assume that parameters
for policy questions are fixed over these time periods, which allows us to estimate policy positions
of candidates over time. Substantively, the assumption implies that these policy questions are
interpreted in the same way across survey waves.
We fit both one-dimensional and two-dimensional models. To help identify these models, we
include several restrictions. For the one-dimensional model, we constrain the signs of factor loadings
for the two questions regarding defensive power and preemptive defense. For the two-dimensional
model, we constrain factor loadings for some of the most frequently asked questions presented in
9

Figure 1. Specifically, we assign questions about defensive power, preemptive defense, the UN
Security Council, the US-Japan Security arrangement, and North Korea to the first dimension
and those concerning small government, public works, lifetime employment system, and increasing
spending to the second dimension by setting the factor loadings for the other dimension to zero.
This specification allows us to construct the estimates of policy positions along with the two
dimensions that are often thought as shaping Japanese legislative politics; the first dimension is
about foreign and security policies while the second dimension concerns economic policies.
Formally, let N denote the number of politicians in the data, while J represents the number
of surveys with the sequence of survey waves J = {1, 2, . . . , J}. Suppose that there are K survey
questions and that politician i was surveyed Ji times across the time periods where Ji ≤ J .
Furthermore, let ji denote the jith survey wave in which politician i appears where j = 1, . . . , Ji.
That is, ji indexes the location in the sequence of surveys J . Since not all of K questions were asked
in each survey, we use Kj to denote the number of questions asked in survey j where Kj ≤ K, while
kj represents the kjth question of survey j where k = 1, . . . ,Kj . That is, kj indexes the location
in the sequence of questions K = {1, . . . ,K}. Finally, let yijikji denote politician i’s answer to
question kji in survey ji, which is recorded as a 5-cateogry ordered variable (except budget related
variables, which are binary). In the ATES data we analyze, we have N = 3025, J = 8, and K = 90.
Given this setup, we consider the following standard item response model where we use xiji to
denote politician i’s latent policy position at the time of survey ji and y∗ijikjiis the latent response
variable for ordered probit model,
y∗ijikji∼ N (αkji
+ β>kjixiji , 1)
where (αk, βk) is item parameters for question k constant across surveys. We consider two models
where the dimensionality of policy position xiji is either one or two. The model is completed by
the proper conjugate prior distributions, i.e., (αk, βk) ∼ N ((ak, bk), Sk) and xi ∼ N (m, v) for
i = 0, 1, . . . , N , and k = 1, . . . ,K. The independent uniform prior distribution is placed for each of
cut points. To fit the model, we use the MCMCordfactanal() function in MCMCpack by A. Martin
and K. Quinn.
4 Estimated Policy Positions of Japanese Politicians
In this section, we present two sets of estimates for the policy positions of Japanese politicians based
on our analysis of the ATES data (the one-dimensional and two-dimensional models, respectively).
10

Year of Survey
Est
imat
ed P
olic
y P
ositi
on (
Par
ty M
edia
n)
●●
●
● ● ● ●
2003 2004 2005 2007 2008 2009 2010
−2
−1
01
2
LDP
DPJCGP
JCP
LDP
DPJCGP
JCP
Year of Survey
Est
imat
ed P
olic
y P
ositi
on (
Par
ty M
edia
n)
●
●
●
●● ●
2003 2004 2005 2007 2009 2010
−2
−1
01
2
LDP
DPJCGP
JCP
LDP
DPJCGP
JCP
Winning Candidates OnlyAll Candidates
Figure 3: Estimated Party Medians of Policy Positions over Time Based on the One-DimensionalModel. The figure shows the median policy positions of major parties based on the one-dimensionalmodel. The left panel shows the estimated party medians using all candidates, while the right paneldisplays those based on winning candidates only. Vertical lines represent the 95% credible intervals.The squares, circles, triangles, and diamonds symbols represent Liberal Democratic Party (LDP),Democratic Party of Japan (DPJ), Clean Government Party (CGP), and Japanese CommunistParty (JCP), respectively.
We conduct simple descriptive analyses and compare our estimates with other alternative measures
of policy positions.
4.1 Estimates from the One-Dimensional Model
First, we present the estimated policy positions from the one-dimensional model where a politician’s
responses to all policy questions during each time period are summarized as a scalar estimate of
his/her overall policy position. Figure 3 presents the estimated party medians of policy positions
over time based on the one-dimensional model. As expected, we see that the LDP (squares) is the
most conservative while the JCP (diamonds) is the most liberal. It is also noteworthy that each
party’s position changes little over time although the LDP is becoming slightly more conservative
in recent years. Moreover, estimated party medians are not significantly different even when we
focus on winning candidates only. This suggests that the winning and losing candidates in each
party are taking similar positions. Thus, it was not the case that the LDP was losing SMD seats
in more “liberal districts” where its candidates were also taking more “liberal” positions.
Next, we compare our estimates of policy positions with the self-reported ideology of politicians
themselves. In the ATES, politicians are asked to locate themselves on the ten point-scale ideologi-
11
All Candidates
Correlation = 0.82
12
34
56
78
910
−2 −1 0 1 2
Liberal Democratic Party
12
34
56
78
910
−2 −1 0 1 2
●
●
●
●
●
●
●
●
●
● ●
●
●
●
●
●
●●
●
●
●
●
●
●
●●
●
●
●●
●
●
●
●●
●
●
●
●
●
●●
●
●
●
●
●
●
●●
●
●
●
●●
●
● ●
●
●
●
●
●
●
●
●●
●
●
●
●●
●
●
●
●
●
●
●
●
●
●
●●
●●●
●
●
●
●
●
●
●●
●
●
●
●
●
●
●
●● ●
●
●
●●
●
● ●
●
●
●
●
●●
●
●
●
●●
●
●● ●
●
●●
●
●
●
●
●
●
●
●
●
●●
●
●
●●
●●
●
●
●
●
●
●●
●
●
●
●
●
●
●
●
●●
●
●
●
●
●
●
●
●
●
●
●
●
●
●● ●
●
●
●
●
● ●
●●
●
●
●●
●
●
●
●
●●
●
●●
●
●
●
●
●
●
●
●
●
●
●
●
●
●
●●
●
●●
●
●
● ●
●
● ●
●
●●
●
●
●
●
● ●
●
●
●
●●
●
●
●
●
●
●
●
●
●
●
● ●
●
●
●● ●
●
●
●
●
●
●●
●
●●
●
●
●
●
●
●
●
●
●
●
●
●
●
●
●
●
●
●
●
●
●
●
●
●
●
●●
●
●
●
●●
●●
●●
●
●
●●
●
●
●
●●
●●
● ●
●
●
●
●
●
●
●
●
● ●
●
●
●
● ●
●
●
●
●
●
●
●
●
●
●
●
●
●●●
●
●
●
●
●
●
●
●
●
●
●●
●
●
●
●
●
●
●
●
●
●
●
● ●
●
●
●●
●
●
●●
●
●
●
●
●●
●
●
●
●●
● ●●
●
●●
●
●
●
●
●
●
● ●
●●
●
● ●●
●
●
●
●
●
●
●
●
●
●
●
●
●
●
●
●
●
●
●
●
●
●
●
●
●
●
●
●●
●
●
●●
●
●
●
●●
●
●
●
●
●
●
●
●
●
●
●
●
● ●●●●
●
●
●
●●
●
●
●●
●
●
●
●
●
●
●
●
●●●
●
●●
●
●
●
●
●
●
●
●
●●
●
●
●
●
●●
●
●●
●
●
●●
●
●
●
●
●
●
●
● ●
●
●
●
●
●
●
●
●● ●
●
●
●
●●
●●
●●
●
●
●
●
●
●
●
●
●
●
●
●
●
●
●
●
●
●
●
● ●
●
●
●
●
●●
●●
●
●
●●
●
●
●
●
●
●
●
●●
●
●
●
●
●
●
●
●
●
●
●
●
●●
●
●
●
●●●
●
●
●
●●
●
●
● ●
●
●
●
●
●
●
●
●
●
●
●
●
●
●
●
●
●
●
●
●●
●
●
●
●
●
●
●
●
●
●
● ●
●
●
●
●
●
●
●
●
●●
●
●
●
●
●
●●
●
●
●
●●
●
●
●
●
●
●
●
●
●
●
●
●
●
●
● ●●
●
●
●
● ●●
●
●●
● ●
●
●
Democratic Party of Japan
12
34
56
78
910
−2 −1 0 1 2
Clean Government Party
12
34
56
78
910
−2 −1 0 1 2
Japanese Communist Party
12
34
56
78
910
−2 −1 0 1 2
Estimated Policy Position (First Dimension)
Sel
f−re
port
ed Id
eolo
gy
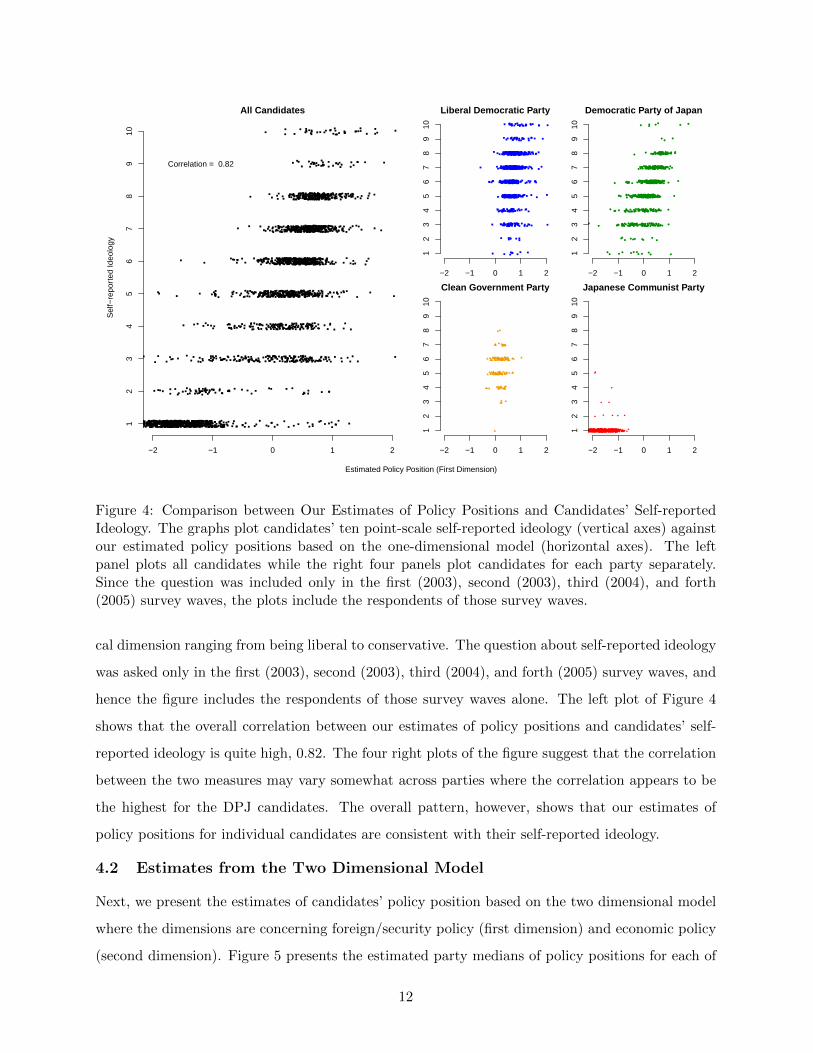
Figure 4: Comparison between Our Estimates of Policy Positions and Candidates’ Self-reportedIdeology. The graphs plot candidates’ ten point-scale self-reported ideology (vertical axes) againstour estimated policy positions based on the one-dimensional model (horizontal axes). The leftpanel plots all candidates while the right four panels plot candidates for each party separately.Since the question was included only in the first (2003), second (2003), third (2004), and forth(2005) survey waves, the plots include the respondents of those survey waves.
cal dimension ranging from being liberal to conservative. The question about self-reported ideology
was asked only in the first (2003), second (2003), third (2004), and forth (2005) survey waves, and
hence the figure includes the respondents of those survey waves alone. The left plot of Figure 4
shows that the overall correlation between our estimates of policy positions and candidates’ self-
reported ideology is quite high, 0.82. The four right plots of the figure suggest that the correlation
between the two measures may vary somewhat across parties where the correlation appears to be
the highest for the DPJ candidates. The overall pattern, however, shows that our estimates of
policy positions for individual candidates are consistent with their self-reported ideology.
4.2 Estimates from the Two Dimensional Model
Next, we present the estimates of candidates’ policy position based on the two dimensional model
where the dimensions are concerning foreign/security policy (first dimension) and economic policy
(second dimension). Figure 5 presents the estimated party medians of policy positions for each of
12

Year of Survey
Est
imat
ed P
olic
y P
ositi
on (
Par
ty M
edia
n)
●●
●
●● ●
●
2003 2004 2005 2007 2008 2009 2010
−2
−1
01
2
LDP
DPJCGP
JCP
LDP
DPJCGP
JCP
Year of Survey
Est
imat
ed P
olic
y P
ositi
on (
Par
ty M
edia
n)
●
● ●
●
●
● ●
2003 2004 2005 2007 2008 2009 2010
−2
−1
01
2
LDP
DPJ
CGP
JCP
LDPDPJ
CGP
JCP
Year of Survey
Est
imat
ed P
olic
y P
ositi
on (
Par
ty M
edia
n)
●
●
●
●
●●
2003 2004 2005 2007 2009 2010
−2
−1
01
2
LDP
DPJ
CGP
JCP
LDP
DPJ
CGP
JCP
Year of Survey
Est
imat
ed P
olic
y P
ositi
on (
Par
ty M
edia
n)
●
● ●
●
● ●
2003 2004 2005 2007 2009 2010
−2
−1
01
2
LDP
DPJ
CGP
JCP
LDPDPJ
CGP
JCP
Win
ning
Can
dida
tes
Onl
yA
ll C
andi
date
sFirst Dimension Second Dimension
Figure 5: Estimated Party Medians of Policy Positions over Time Based on the Two-DimensionalModel. The figure shows the median policy positions of major parties based on the two-dimensionalmodel where the first dimension (left column) represents foreign/security policy and the seconddimension (right column) is concerned about economic policy. The upper plots show the estimatedparty medians using all candidates, while the bottom plot display those based on winning candi-dates only. Vertical lines represent the 95% credible intervals. The squares, circles, triangles, anddiamonds symbols represent Liberal Democratic Party (LDP), Democratic Party of Japan (DPJ),Clean Government Party (CGP), and Japanese Communist Party (JCP), respectively.
the two dimensions where the plots in the upper and lower panels represent the estimates based on
all candidates and winning candidates, respectively. The estimates for the foreign/security policy
dimension (left column) closely resemble those based on the one-dimensional model. Indeed, the
individual level correlation is 0.99, suggesting that the main policy dimension of Japanese politics
primarily reflects the differences in foreign/security policy. Similar to Figure 3, there is a slight
trend towards the conservative direction for the LDP, but in general the party positions are stable
over time. Again, we find little difference in policy positions between winning and losing candidates.
These findings imply that the foreign / security policy continues to be the main policy dimension in
Japanese politics despite the end of the Cold War and the collapse of the LDP dominance (Budge
13

et al., 1987).
While the foreign/security policy (first) dimension is remarkably stable over time, the plots
in the right column show significant movements of party positions over time for the economic
policy (second) dimension (see also Okawa, 2011). One of the striking patterns in Figure 5 is the
convergence in the economic policy positions of the LDP and DPJ starting in 2005. In the analyses
in Section 5 we investigate the degree to which LDP and DPJ candidates were also converging in
their policy positions within districts. Although determining the cause of this movement is beyond
the scope of this paper, the overall pattern of the movement is consistent with changes in the
economic conditions and the views of the parties’ leaders, which suggest that the second dimension
may well be the main policy dimension of electoral competition.
According to the estimates in Figure 5, the LDP had a more “liberal” economic policy than the
DPJ at the start of the decade and then moved to the “conservative” direction and converged to
the DPJ position in 2005. This movement of the LDP is consistent with the highly publicized intra-
party conflict over economic policies during the first half of the decade. In 2001 LDP Diet member
Junichiro Koizumi became prime minister. Koizumi soon became popularly known for challeng-
ing traditional LDP economic policies by supporting wide spread privatization, deregulation, and
government spending cuts. In the first years of his administration Koizumi had substantial pub-
lic support, but he had faced the strong resistance to his economic agenda from the established
leadership. This changed in during the 2005 election. Japan’s economic situation appeared to be
improving, which relieved some of the demand for government expenditures. Koizumi was able to
make support of postal privatization and small government the central issue during the campaign.
He purged the LDP of the politicians who opposed postal privatization immediately before the
election and recruited candidates to challenge the former LDP members into their SMDs. Through
this election, the LDP became to be seen as the “new” LDP in terms of economic policies (Hiwatari,
2005, 2006).
The shift in the LDP’s and DPJ’s positions toward the “liberal” direction after the 2005 con-
vergence in economy policy shown in Figure 5 is also in accordance with the economic and political
conditions. The slow down of the Japanese economy after 2005 coincided with a return of LDP
leadership favoring government spending to stimulate the economy. The ousted LDP politicians
returned to the party one year after the election. In addition, the LDP government implemented
a 750 billion dollar stimulus package after the global financial crisis in 2008. The movement in the
DPJ’s economic policy position is also consistent with the DPJ leadership’s increasing focus on
14

First Dimension and Foreign/Security Policy
Estimated Policy Position (First Dimension)
Exp
erts
' Per
cept
ion
of F
orei
gn/S
ecur
ity P
olic
y
●
●
●
05
1015
20
−1.5 −1.0 −0.5 0.0 0.5 1.0 1.5
LDP
DPJ
CGP
JCP
Second Dimension and Economic Policy
Estimated Policy Position (Second Dimension)
Exp
erts
' Per
cept
ion
of E
cono
mic
Pol
icy
●●
●
05
1015
20
−1.5 −1.0 −0.5 0.0 0.5 1.0 1.5
LDP
DPJ
CGP
JCP
Figure 6: Comparison between the Estimated Party Medians based on the Two-dimensional Modeland the Estimates of Party Positions from the Expert Survey (Kato and Laver, 1998, 2003). The left(right) panel plots the expert survey based estimates of party positions concerning foreign/security(economic) policy against our two-dimensional model estimates of party medians for the first (sec-ond) dimension for the second (2003), forth (2005), and seventh (2009) survey waves where thearrows indicate the order of survey waves. The squares, circles, triangles, and diamonds symbolsrepresent Liberal Democratic Party (LDP), Democratic Party of Japan (DPJ), Clean GovernmentParty (CGP), and Japanese Communist Party (JCP), respectively.
expanding spending on social programs over the decade.
To further validate our interpretation of the two dimensions, we compare our estimates of the
party medians with the estimates of the party locations from expert surveys (Kato and Laver, 1998,
2003).5 These expert surveys have been conducted in each Lower House election year since 1996.
Experts are asked to locate major Japanese parties on ten different policy questions using twenty
point scale. For example, one question asks experts to locate each Japanese party from “promote
reduced defense spending” (1; most liberal) to “promote increased defense spending” (20; most
conservative). For the sake of comparison, we calculate the sample averages of experts’ responses
to the questions that correspond to the two policy dimensions of our estimates. Specifically, for
foreign/security policy dimension, we use the questions about the US-Japan relations and defense
spending. For economic policy dimension, we calculate the average response to questions about
public services spending, deregulation, and issuing of deficit bonds. If our estimates based on the
two-dimensional model capture foreign/security and economic policy dimensions, respectively, they
5The data are available at http://www.katoj.j.u-tokyo.ac.jp/
15
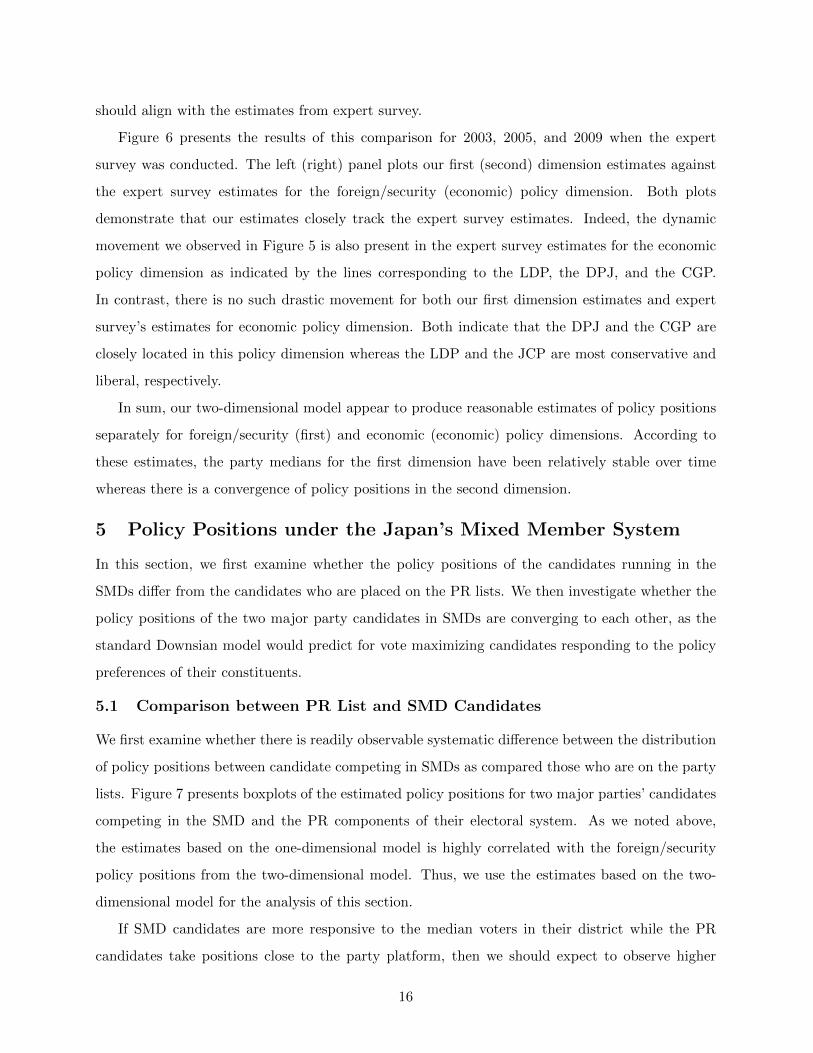
should align with the estimates from expert survey.
Figure 6 presents the results of this comparison for 2003, 2005, and 2009 when the expert
survey was conducted. The left (right) panel plots our first (second) dimension estimates against
the expert survey estimates for the foreign/security (economic) policy dimension. Both plots
demonstrate that our estimates closely track the expert survey estimates. Indeed, the dynamic
movement we observed in Figure 5 is also present in the expert survey estimates for the economic
policy dimension as indicated by the lines corresponding to the LDP, the DPJ, and the CGP.
In contrast, there is no such drastic movement for both our first dimension estimates and expert
survey’s estimates for economic policy dimension. Both indicate that the DPJ and the CGP are
closely located in this policy dimension whereas the LDP and the JCP are most conservative and
liberal, respectively.
In sum, our two-dimensional model appear to produce reasonable estimates of policy positions
separately for foreign/security (first) and economic (economic) policy dimensions. According to
these estimates, the party medians for the first dimension have been relatively stable over time
whereas there is a convergence of policy positions in the second dimension.
5 Policy Positions under the Japan’s Mixed Member System
In this section, we first examine whether the policy positions of the candidates running in the
SMDs differ from the candidates who are placed on the PR lists. We then investigate whether the
policy positions of the two major party candidates in SMDs are converging to each other, as the
standard Downsian model would predict for vote maximizing candidates responding to the policy
preferences of their constituents.
5.1 Comparison between PR List and SMD Candidates
We first examine whether there is readily observable systematic difference between the distribution
of policy positions between candidate competing in SMDs as compared those who are on the party
lists. Figure 7 presents boxplots of the estimated policy positions for two major parties’ candidates
competing in the SMD and the PR components of their electoral system. As we noted above,
the estimates based on the one-dimensional model is highly correlated with the foreign/security
policy positions from the two-dimensional model. Thus, we use the estimates based on the two-
dimensional model for the analysis of this section.
If SMD candidates are more responsive to the median voters in their district while the PR
candidates take positions close to the party platform, then we should expect to observe higher
16

Estimated Policy Position
DPJ/PR
DPJ/SMD
LDP/PR
LDP/SMD
−2 −1 0 1 2
●
●
●
●
●● ●● ●
●● ●● ●
●● ●● ●●●
2003Second Dimension
●
●
●
●
●● ●● ●●
●●
● ●●
2005Second Dimension
−2 −1 0 1 2
●
●
●
●
●●● ●
●●
●●●●
2009Second Dimension
DPJ/PR
DPJ/SMD
LDP/PR
LDP/SMD
●
●
●
●
●●● ●● ●● ●● ●
●
● ● ●● ●●●●
2003First Dimension
−2 −1 0 1 2
●
●
●
●
●●●●●●●● ● ●● ●●●
● ●
● ●●● ●● ●●●● ● ●
2005First Dimension
●
●
●
●
●
●● ●● ●
●●
2009First Dimension
Figure 7: Comparison of Estimated Policy Positions between SMD and PR Candidates. For eachof the two major parties, LDP and DPJ, the boxplots show the distribution of estimated policypositions for candidates running for SMD and PR components immediately prior to the three Lowerhouse elections (2003, 2005, and 2009). The policy positions are based on the two-dimensionalmodel. The SMD candidates include those who are running for both SMD and PR.
variance in the policy positions of the SMD candidates as compared to the candidates on the
PR lists (assuming there exist heterogeneity of voters across districts). As is evident in Figure 7,
the median PR and SMD candidates’ positions for both the LDP and DPJ are similar on both
the foreign/security policy (first) dimension and the economic policy (second) dimension. On the
foreign /security policy dimension, we do not observe significant differences in variance between
the SMD and PR candidates’ policy positions for the LDP. For the DPJ candidates, however, there
appears to be some differences especially in the 2003 and 2005 elections. However, this finding is
compromised by the fact that there are a small number of DPJ candidates who ran only on the
PR list in these elections.6 Thus, overall, there appears to be little difference between SMD and
6In 2003, we have only 6 responses from DPJ candidates who were only competing on the PR lists. In 2005,
the number of candidates drops to 3. However, in 2009 we have survey response from 39 candidates who were only
17

PR candidates for the foreign/security policy dimension.
On the economic policy dimension, on the other hand, we do find some evidence suggesting
that the estimated policy positions for the SMD candidates have higher variances than the PR
candidates. This pattern is observed for DPJ candidates in all of the three elections and for LDP
candidates in the 2003 and 2009 elections. This is at least consistent with what we would expect if
the SMD candidates were more likely to deviating from their parties’ official policy in responding
to the economic preferences in their districts as compared to the candidate on the PR lists. Given
the convergence in the economic policy positions of the party medians in Figure 5, this is the area
where we might expect to observe more responsiveness in the SMD candidates’ policy positions.
5.2 Policy Positions of SMD Candidates within Districts
Next, we exploit the fact that we have survey responses for both incumbents and challengers in
order to examine whether the SMD candidates’ policy positions were converging to the median
voter of their districts as Downsian models of spatial competition would predict (Downs, 1957).
If there were Downsian convergence, then we would expect the two major candidates to take the
same or at least relatively similar policy positions in each districts.
In Figure 8, we plot the estimated policy positions of the LDP (vertical axes) and DPJ (hori-
zontal axes) candidates in each SMD for the 2003, 2005, and 2009 Lower House elections. If the two
parties’ candidates were converging to the median voter of their district, then we would expect the
points to line up along the 45 degree line. The first row of scatterplots are for the foreign/security
policy dimension. Different symbols represent whether the LDP or DPJ candidate is an incumbent
(circles and crosses, respectively, where triangles represent the other cases).
As noted above, the estimates of candidates’ positions on the foreign/security policy dimension
are essentially the same as the estimates of their positions in a one-dimensional factor model. In
these scatterplots, there is no clear relationship between the LDP and DPJ candidates’ policy
positions within each SMD. Most of the LDP candidates’ are taking more conservative positions
relative to the DPJ candidates. This is consistent with the patterns for the party positions presented
in Figure 3. Thus, there is little evidence from these scatter plots that candidates in the SMD
districts are competing to respond to the median voters’ preferences in each district.
In the second row of the figure, we examine the convergence in the economic policy dimension.
Given the salience of economic policies during the period under investigation, it is possible that this
competing on a PR list.
18

●
●●●
●
●
●
●
●
●●●
●● ●
●
●●●
● ●
●
● ●
● ●●
●
●
●
●●
●
●●
●●
● ●
●
●
●
●
●
●●●
●●
●
●
●
●
●
●●
●●
●
●
●
−2 −1 0 1 2
−2
−1
01
2
DPJ candidates
LDP
can
dida
tes
−2 −1 0 1 2
−2
−1
01
2
−2 −1 0 1 2
−2
−1
01
2
● LDP−incumbent/DPJ−challengerLDP−challenger/DPJ−incumbentOthers
●●
● ●
●● ●
●●
● ●●
●●
●● ●
●
●
●●●
●●
●
●●
●
●
●
●
●
●
●
● ●●
●●●
●
●●●
●
●
●
●
●
●●
●
●
●
●
●
●●
●
●●
●●
●●
●●
●
●
●
●
●
●
●●
●
●●
●●
●
●
●
●
●
−2 −1 0 1 2
−2
−1
01
2
DPJ candidatesLD
P c
andi
date
s
−2 −1 0 1 2
−2
−1
01
2
−2 −1 0 1 2
−2
−1
01
2
●
●●
●
●
●●
●
●●
●●
●
●●
●
●●
●
●
●
●
●
●
●
●●
●●
●
● ● ●●
●●● ●
●●
●
●● ●●●
●
●
● ●
●
●
●
●
●
●
●
●●
●
●
●
●
●●
●●
●
●●● ●●
●● ●●
●
●
●● ●
●
●
●●●
●●
●
●●●
●●●●●
●●
●
●●●
●
●
●●
●
●
●●●
●●●
●●●
●
●●
●● ●● ●
●●
●
●
●● ●
●
●
●
●
●● ●●
●
●
●●
−2 −1 0 1 2
−2
−1
01
2
DPJ candidates
LDP
can
dida
tes
−2 −1 0 1 2
−2
−1
01
2
−2 −1 0 1 2
−2
−1
01
2
●
●
●
●
●
●
●
●●●
●
●
●●●
●
●
●
● ●
●●●●●
●
●
●
●
●
●
●
●
●●
●
●
●
●
●
●
●●
●
●
●
●
●
●
●
●
●
●
●
●
●
●
●
●
●●
−2 −1 0 1 2
−2
−1
01
2
DPJ candidates
LDP
can
dida
tes
−2 −1 0 1 2
−2
−1
01
2
−2 −1 0 1 2
−2
−1
01
2
●
●
●
●
●
●
●
●
●●
●
●
●
●
●
●●
●
●
●●
●●
●●
●●
●
●
●
●
●●
● ●
●
●●
●
●
●
●
● ●●
●●
●
●
● ●
●
●●
●
●●
●
●
●
●
●
●
●
●
●●
●
●
●
●
●● ●
●
● ●
●
●
●
●
●●
●●
−2 −1 0 1 2
−2
−1
01
2
DPJ candidates
LDP
can
dida
tes
−2 −1 0 1 2
−2
−1
01
2
−2 −1 0 1 2
−2
−1
01
2
●
●
●
●
●●
●
●●●
●
●
●●
●
●
●
●
●
●
●
●
●
●
●
●
●
●
●
●
●●
●●
●●
●
●●
●
●
●
●
●●
●
●
●
●
●
●●
●
●●
●
●●●
●
●
●●
●
●●
● ●
●
●●●
●
●
●
●●
●
●
●
●
●
●
● ●
●
●
●
●
●
●●
●
●●●
●●
●
●
●●
● ●
●●●
●
●
● ●●
●●●
● ●●
●
●
●
●
●
●
●●
●
●
●
●
●
●
●
●●
●●
● ●
●
●
●
●
●
●
●
−2 −1 0 1 2
−2
−1
01
2
DPJ candidatesLD
P c
andi
date
s
−2 −1 0 1 2
−2
−1
01
2
−2 −1 0 1 2
−2
−1
01
2
2003 2005 2009F
irst D
imen
sion
Sec
ond
Dim
ensi
on
Figure 8: Estimated Policy Positions of the LDP and DPJ Candidates in Single Member Districts.Each panel plots the estimated policy positions of LDP Lower House candidates running for SMDs(vertical axes) against those of DPJ candidates (horizontal axes) running for the same districts.The upper panels are the plots for the first dimension while the lower panels are the plots for thesecond dimension. Circles (crosses) represent the SMDs where the LDP candidate is the incumbent(a challenger)‘ and the DPJ candidate is a challenger (the incumbent). Triangles represent the othercases.
is the main policy dimension of electoral competition. During the 2003 Lower House election, the
DPJ candidates for the most part are taking more conservative economic positions than the LDP
candidates. As illustrated in Figure 5, in the 2005 and 2009 Lower House elections, the positions
of the median LDP and DPJ candidates appear to be converging. However, there is no obvious, at
least in the scatterplots, pattern of convergence in the positions of two parties’ candidates within
SMDs. The overall correlation is somewhat high, 0.36, but within each election, the correlation is
at most 0.1 in 2005.
Of course, the lack of a clear pattern of convergence to the district medians does not necessar-
ily mean that legislators competing in SMDs are unresponsive to the policy preferences of their
constituents. The Downsian model of convergence to the median voter assumes a single policy
19

dimension and only two competing actor. The Japanese policy space seems to have both economic
and foreign/security policy dimensions. Moreover, as numerous scholars point out, the “contagion”
from the PR tier to the SMD often leads to multi-party competition in the SMD districts. The two
major party candidates may also need to respond to the positions of these minor party candidates.7
It is also possible that there exists asymmetry across parties in how responsive candidates are
to median voter in their district. It may not be surprising to find that LDP candidates are less
responsive to their constituencies’ policy interests. For most of the period of LDP dominance,
the conventional wisdom was that Japanese voters cared much more about constituency services
and provision of government projects than the policy positions of the parties or candidates. In
discussing the politics of this period, Reed (1986) writes, “Each area prefers a representative who
can deliver a bigger share of the benefits being distributed to one who represents them on the issues
of the day” (p. 35). Thus, the LDP incumbents who were raised during this period and who have
access to government and personal resources may continue to expect that policy positions are not
highly salient for election outcomes. The DPJ candidates who do not have the same experiences
and who, in general, do not have the same amount of resources as the LDP candidates may be
more sensitive to their constituents’ policy preferences.
The lack of convergence in candidates’ policy positions to their district medians is perhaps not
too surprising. Convergence to the median voter in the district is perhaps an unrealistic standard
for assessing the responsiveness of SMD candidates. A number of theoretical models explore the
different conditions under which candidates’ positions will not converge on the preferences of the
median voter in their district (e.g. Aranson and Ordeshock, 1972; Londregan and Romer, 1993;
Enelow and Hinich, 1981; Calvert, 1985; Wittman, 1983; Groseclose, 2001; Palfrey, 1984). Even
in U.S. with no viable third party candidates and congressmen who are believed to be responsive
to their district preferences, the policy positions of candidates from the two major parties do not
appear to completely converge within districts (e.g. Ansolabehere et al., 2001). However, Hug and
Martin (2009) find evidence that in Switzerland SMD candidates tend to converge more towards
the median voters of their district than PR candidates.
7Umeda (2010) finds some evidence that the presence of minor parties have influence the positions of the major
party candidates in Japan.
20

6 Concluding Remarks
Are mixed member electoral systems the “best of both worlds”? Some argued that the mixed
member systems can blend SMD and PR institutions in a way that candidates in each institution
behave as if they are responding independently to the incentives of each institutional arrangement
(e.g. Crisp, 2007). In general, however, our empirical findings based on the analysis of surveys of
Japanese politicians do not support this view. It does not appear that SMD candidates in Japanese
Diet elections take policy positions responsive to their SMD preferences while PR candidates take
positions reflecting the preferences of the party elite.
While we find substantial within-party variation in candidates’ policy positions, for the for-
eign/security policy dimension, the amount of this variation for Lower House candidates on the
PR lists is similar to that for those competing in the SMDs. If SMD candidates take positions in
response to their district preferences while PR candidates take positions to match the preferences
of the party leaders, then we would have expected less cohesion in the policy positions among the
SMD candidates. However, we do find some evidence that the variance of SMD candidates is larger
than that for PR candidates in the economic policy dimension, which was perhaps more electorally
salient during the period under investigation. Nevertheless, there is little evidence that candidates
in the SMDs are converging towards their district medians. Assuming simple Downsian spatial
competition among the two major party candidates, we would have expected the LDP and DPJ
candidates to take similar policy positions within districts.
These findings beg the question as to why candidate policy positions vary so much within polit-
ical parties in Japan. These positions may simply reflect the candidates’ own personal preferences
or incentives within the political party organizations. To further rule out the role of electoral incen-
tives, additional work must be carried out in order to measure voter preferences within districts and
to connect these preferences to candidates’ policy positions. We plan to conduct such an analysis
in the future by exploiting the fact that the ATES data also contain surveys of voters.
Finally, even on these surveys, which parties presumably exert much less pressure on the candi-
dates’ responses as compared to roll call votes, the policy positions of Japanese candidates appear
to be relatively cohesive at least in so far as the party members’ positions move together over
time. This was most evident in movement of the party medians along the economic dimension.
The median economic policy position for both the LDP and DPJ candidates appears to have been
converging during the last decade. The same shifts are evident for various kinds of candidates,
21

e.g., PR candidates, SMD candidates, incumbents, challengers, Upper House and Lower House
candidates. In particular, the fact that incumbents are also adjusting their positions suggests that
the changes are not simply due to mechanisms parties use to select candidates.
The policy movement in the economic dimension raises an interesting question regarding why
the candidates within Japanese parties adjusted their the policy positions during the first decade
of the 21st century. In particular, how much of this movement was in response to changes in the
electorate versus changes in the policy positions of the political party elites. To make the electoral
connection requires a measure of voter preferences. This exactly is our next step in this project.
22

References
Ansolabehere, S. D., M., S. J. J., and Stewart III, C. (2001). Candidate positioning in u.s. house
elections. American Journal of Political Science 45, 1, 136–159.
Aranson, P. H. and Ordeshock, P. C. (1972). Spatial strategies for sequential elections. In R. G.
Niemi and H. F. Weisberg, eds., Probability Models of Collective Decision Making, 298–331.
Charles E. Merrill.
Bawn, K. and Thies, M. F. (2003). A comparative theory of electoral incentives: Representing
the unorganized under pr, plurality and mixed-member electoral systems. Journal of Theoretical
Politics 15, 1, 5–32.
Budge, I., Robertson, D., and Hearl, D. (1987). Ideology, Strategy, and Party Change: Spatial
Analysis of Post-War Election Programmes in 19 Democracies. Cambridge University Press,
New York.
Calvert, R. L. (1985). Robustness of the multidimensional voting model: Candidate motivations,
uncertainty and covergence. American Journal of Political Science 29, 1, 69–95.
Crisp, B. F. (2007). Incentives in mixed-member electoral systems: General election laws, candidate
slection procedures, and cameral rules. Comparative Political Studies 40, 12, 1460–1485.
Downs, A. (1957). An Economic Theory of Democracy. Harper, New York.
Enelow, J. M. and Hinich, M. J. (1981). A new approach to voter uncertainty in the downsian
spatial model. American Journal of Political Science 25, 3, 483–493.
Estevez-Abe, M. (2006). Japan’s shift toward a westminster system: A structural analysis of the
2005 lower house election and its aftermath. Asian Survey 46, 4, 632–651.
Farrell, D. M., Hix, S., Johnson, M., and Scully, R. (2006). A survey of MEPs in the 2004-09
European parliament. Presented at the 2006 Annual Meeting of the American Political Science
Association.
Groseclose, T. (2001). Model of candidate location when one candidate has a valence advantage.
American Journal of Political Science 45, 4, 862–886.
23

Haspel, M., Remington, T. F., and Smith, S. S. (1998). Electoral institutions and party cohesion
in the russian duma. Journal of Politics 60, 2, 417–439.
Herron, E. S. (2002). Causes and consequences of fluid faction membership in ukraine. Europe-Asia
Studies 54, 4, 625–639.
Hiwatari, N. (2005). Japan in 2004: “courageous” koizumi carries on. Asian Survey 45, 1, 41–53.
Hiwatari, N. (2006). Japan in 2005: Koizumi’s finest hour. Asian Survey 46, 1, 22–36.
Hug, S. and Martin, D. (2009). How electoral systems affect mps’ positions. Unpublished
Manuscript.
Judge, D. and Ilonszki, G. (1995). Member-constituency linkages in the hungarian parliament.
Legislative Studies Quarterly 20, 2, 161–176.
Kabashima, I. and Steel, G. (2010). Changing Politics in Japan. Cornell University Press, Ithaca.
Kato, J. and Laver, M. (1998). Theories of government formation and the 1996 general election in
Japan. Party Politics 4, 2, 229–252.
Kato, J. and Laver, M. (2003). Policy and party competition in Japan after the election of 2000.
Japanese Journal of Political Science 4, 1, 121–133.
Lancaster, T. D. and Patterson, W. D. (1990). Comparative pork barrel politics: Perceptions from
the west german bundestag. Comparative Political Studies 22, 4, 458–477.
Londregan, J. and Romer, T. (1993). The polarizing personal vote. In W. A. Barnett, N. Schofield,
and M. Hinich, eds., Political Economy: Institusions, Competition, and Representation. Cam-
bridge University Press, New York.
McKean, M. and Scheiner, E. (2000). Japan’s new electoral system: La plus ca change... Electoral
Studies 19, 447–477.
Moser, R. G. and Scheiner, E. (2004). Mixed electoral systems and electoral system effects: Con-
trolled comparison and cross-national analysis. Electoral Studies 23, 4, 575–599.
Okawa, C. (2011). Jiminto-tai-minshuto (ldp vs. dpj). Kokka Gakkai Zasshi 124, 1–64.
Palfrey, T. R. (1984). Spatial equilibrium with entry. Review of Economic Studies 51, 1, 139–156.
24

Pekkanen, R., Nyblade, B., and Krauss, E. S. (2006). Electoral incentives in mixed-member sys-
tems: Party, posts, and zombie politicians in japan. American Political Science Review 100, 2,
183–193.
Quinn, K. M. (2004). Bayesian factor analysis for mixed ordinal and continuous responses. Political
Analysis 12, 4, 338—353.
Reed, S. (1986). Japanese Prefectures and Policymaking. Pittsburgh University Press, Pittsburgh.
Reed, S., Scheiner, E., and Thies, M. F. (2009). New ballgame in politics. The Oriental Economist
October, 8.
Remington, T. F. and Smith, S. S. (1998). Theories of legislative institutions and the organization
of the russian duma. American Journal of Political Science 42, 2.
Rosenbluth, F., Saito, J., and Yamada, K. (2009). Electoral adaptation in Japan: Party strategy
after electoral rule change. Department of Political Science, Yale University.
Rosenbluth, F. M. and Thies, M. F. (2010). Japan Transformed: Political Change and Economic
Restructuring. Princeton University Press, Princeton.
Saiegh, S. M. (2009). Recovering a basic space from elite surveys: Evidence from latin america.
Legislative Studies Quarterly 34, 1, 117–145.
Shiratri, R. (1984). The introduction of a proportional representation system in japan. Electoral
Studies 3, 2, 151–170.
Shugart, M. S. and Wattenberg, M. P., eds. (2001). Mixed-Member Electoral Systems: The Best of
Both Worlds? Oxford University Press, New York.
Stratmann, T. and Baur, M. (2002). Plurality rule, proportional representation, and the german
bundestag: How incentives to pork-barrel differ across electoral systems. American Journal of
Political Science 46, 3, 506–514.
Taniguchi, M. (2011). Seido-kaikaku (institutional reforms). In T. Sasaki and M. Shimizu, eds.,
Zeminar-gendai-nihon-seiji (Seminar in Contemporary Japanese Politcs), 225–261. Nihon Keizai
Shimbun Shuppan.
25

Thamas, F. C. and Edwards, M. S. (2006). Differentiating mixed-member electoral systems: Mixed-
member majoritarian and mixed-member proportional systems and government expenditures.
Comparative Political Studies 39, 7, 905–927.
Thames jr., F. C. (2001). Legislative voting behavior in the russian duma: Understanding the
effect of mandate. Europe-Asia Studies 53, 6, 869–884.
Treier, S. and Jackman, S. (2008). Democracy as a latent variable. American Journal of Political
Science 52, 1, 201–217.
Umeda, M. (2010). Moving the mountain: Strategic small-party nominations to shift major-party
policy position under plurality electoral system. Typescript. University of Michigan.
Wittman, D. (1983). Candidate motivation: A synthesis of alternative theories. American Political
Science Review 77, 1, 142–157.
26

Appendix: The List of Policy-Related Questions in the Asahi-Todai
Elite Survey (ATES)
In this appendix, we present the English translation of all policy questions in the ATES we analyze
for this paper. For each question, the numbers in parentheses indicate the survey waves in which
the question is used (see Table 1). The questions that are in bold letters are the ones which are
most frequently used and are displayed in Figure 1.
1. The constitution should be revised (2, 4-8).
2. Do you think that the constitution should be revised (6)?
3. Japan’s defensive power should be increased (1-8).
4. Japan should not own a nuclear weapon (1).
5. Japan should own a nuclear weapon (3).
6. The Three Non-Nuclear Principles should be maintained (5-8).
7. The US-Japan Security arrangement should be strengthened (1-5, 8).
8. A: The US-Japan alliance is the linchpin of Japan’s foreign policy. B: Japan’s foreign policy
should be UN-centered (7).
9. A: Japan’s foreign policy should be “the US first” from now on. B: Japan’s foreign policy
should be “Asia first” from now on (8).
10. It is compelling that Air Station Futenma is moved to the inside of Okinawa prefecture (8).
11. Japan should have the right to preemptive defense when it feels there is a legit-
imate threat to its safety (1-7).
12. Japan should become a permanent member of the UN Security Council and fulfill
its international responsibilities (1-7).
13. Japan should apply pressure to North Korea and try to force regime change (2).
14. Japan should apply pressure to North Korea rather than have a dialogue with
them (3-8).
15. The Self-Defense forces should be deployed to help rebuild Iraq (2).
16. Japan should deploy the Self-Defence Forces overseas in support of the UN operations (6-8).
17. Japan should exercise the right to collective defense (5-8).
18. The government should change the interpretation of the constitution in order to exercise the
right to collective defense (2, 4).
27

19. Either the constitution or the interpretation of it should be changed so that the government
exercise the right to collective defense (3).
20. The Prime Minister should visit Yasukuni Shrine (3).
21. Even if government social services suffer, Japan should strive to have small gov-
ernment (1-8).
22. A: In order to provide for the aging population, the burden on our current workforce will
have to increase. B: It is inevitable that social services for the aging population is reduced
in order not to increase the burden on our current workforce (7).
23. A: It is the responsibility of the youth, not the government, to get the youth a job. B: It is
the responsibility of the the government, not the youth, to get the youth a job (7, 8).
24. A: Improving economic competitive power should be prioritized even if there is a bit of the
social inequality. B: Correcting the social inequality should be prioritized even if economic
competitive power is sacrificed (8).
25. The government should adopt special policies designed to allow women into higher-status,
better jobs (2, 5).
26. Japanese companies should keep the lifetime employment system (1-8).
27. Provincial/ rural employment should be boosted by public works (1-8).
28. Instead of focusing on fiscal austerity, Japan needs to boost its economy through
increased spending (1-8).
29. The budget for road maintenance needs to be kept stable (6-8).
30. A: Because the government bonds are stably sold in the financial market, fiscal deficit is not a
cause for concern. B: Because fiscal deficit is at the crisis level, the government bonds should
be reduced (8).
31. Consumption tax should be increased for fiscal reform (1).
32. The consumption tax should be increased in order to create a sustainable pension system (2).
33. Do you support raising the consumption tax in order to pay for social programs or for fiscal
reform? (4)
34. Consumption tax should be increased (5, 6).
35. Consumption tax has to be increased in five years (7, 8).
36. The basic pension fund should be paid for through the treasury only (2).
28

37. Do you think the basic pension should be supported by both insurance fees and taxes, or by
taxes alone (4)?
38. The basic pension should be financed from taxes alone (6, 7).
39. The effective rate of corporate tax should be decreased (8).
40. The postal services should be privatized (2).
41. The privatization of the postal services should be promoted (8).
42. The public highway corporations should be privatized (2).
43. Instead of building new highways, existing highway tolls should be eliminated (2).
44. Existing highway tolls should be eliminated (8).
45. The child allowance should abolished (8).
46. Small farmers should be protected (8).
47. A: The government needs to protect domestic corporations. B: The government should
promote trade and investment liberalization (7, 8).
48. The budget needs to be increased for public works (7).
49. The budget needs to be increased for economic/employment plans (7).
50. The budget needs to be increased for medical/welfare (7).
51. The budget needs to be increased for education/culture (7).
52. The budget needs to be increased for technological development (7).
53. The budget needs to be increased for environmental conservation (7).
54. The budget needs to be increased for defense (7).
55. The budget needs to be increased for international aid/assistance (7).
56. The budget needs to be increased for agriculture/food supply (7).
57. The budget needs to be decreased for public works (7).
58. The budget needs to be decreased for economic/employment plans (7).
59. The budget needs to be decreased for medical/welfare (7).
60. The budget needs to be decreased for education/culture (7).
61. The budget needs to be decreased for technological development (7).
29

62. The budget needs to be decreased for environmental conservation (7).
63. The budget needs to be decreased for defense (7).
64. The budget needs to be decreased for international aid/assistance (7).
65. The budget needs to be decreased for agriculture/food supply (7).
66. A: In order to preserve the environment, living standards may have to fall. B: Preserving the
environment is not so important that living standars have to fall (7).
67. Individual freedoms and privacy should be restricted for greater public safety (2,
4-8).
68. Permanent foreign residents should be given the right to vote in local elections
(2-4, 6-8).
69. Japan needs to attract immigrant workers, and should take steps to do so (6-8).
70. Education should emphasize tradition more than fostering individuality (5-7).
71. The youth should be required to participate in volunteer activities (5).
72. Moral education should be expanded (8).
73. The death penalty should be abolished (7, 8).
74. A: In general, public safety and crime are getting worse, and the law needs to become severer
in its punishments. B: In general, public safety and crime are not getting worse, and the
government have to refrain from making criminal punishments severer (7).
75. A: The family should be comprised of a married couple and their children, not other arrange-
ments such as single mothers or DINKS. B: The form of families may be diverse such as single
mothers and DINKS (7).
76. The prime minister should be steady-handed rather than adjusting (5).
77. Corporations should be forbidden from making political donations to parties (2).
78. A: Corporations and organizations have the freedom of political action. B: Corporations
should be forbidden from making political donations (7, 8).
79. Subsidies to the rural provinces should be stopped (2, 3).
80. The government should stop distributing money to the provinces and instead let the provinces
handle revenue (1).
81. Government should promote to merge cities (1).
30

82. Japan should go back to the mid-sized electoral district system (7, 8).
83. In general, the existence of the change of government makes the politics better (7, 8).
84. The practice of amakudari (bureaucratic retirement nepotism) should be completely stopped
(7).
85. The House of Representative’s powers should be strengthened vis-a-vis those of the House of
Councilors (7).
86. Political realignment is needed in the near future (7, 8).
87. The number of diet members should decrease by half (8).
88. The children of politicians should not be allowed to run for office and create a dynasty. B:
The children of politicians have the freedom of choice in employment (7).
89. A: Politicians need to confront and subjugate the bureaucracy. B: Politicians need to coop-
erate with and make full use of the bureaucracy (7, 8).
90. A: The ruling party should not change its manifesto after the election. B: The ruling party
may change its manifesto without elections (8).
31