policy note 1 - mof.gov.eg and... · policy note 1 fiscal and public debt sustainability egypt...
TRANSCRIPT

Policy Note 1
Fiscal and public debt sustainability
Egypt Public Expenditure ReviewJuly 2005
Social and Economic Development GroupMiddle East and North Africa RegionThe World Bank

Copyright © 2005by the International Bank for Reconstruction and Development/THE WORLD BANK
Designed, edited, and produced by Communications Development Incorporated, Washington, D.C.
About this Policy NoteThis Policy Note is part of the analytical work supporting the Public Expenditure Review (PER) in Egypt, a collaborative effort between the Government of Egypt and the World Bank. The PER is led by Richard Allen, Lead Public Sector Specialist, MNSED.
This Note is the first in a series being prepared during 2005 and 2006. It assesses the sustainability of Egypt’s public debt based on recent fiscal trends.
The note was prepared by Sherine Al-Shawarby, Senior Economist, MNSED, and Farrukh Iqbal, Lead Economist, MNSED. Peer review comments were received from Anand Rajaram and Edgardo Favaro.
For a list of other Policy Notes in this series, see http://web.worldbank.org/WBSITE/ EXTERNAL/COUNTRIES/MENAEXT/EGYPTEXTN/0,,contentMDK: 20601542~pagePK:141137~ piPK:141127~theSitePK:256307,00.html.

f iscal and Publ ic dEbt susta inabil i t y i
contents
Abbreviations and acronyms iii
Summary 1
1 Fiscal trends in Egypt 3
2 Recent trends in public debt 6
3 Fiscal sustainability analysis 8
The debt-stabilizing primary surplus approach 8
The fiscal accounting approach 9
Annex 1 Egypt’s main budget items 11
Annex 2 Base case assumptions 13
Annex 3 What is the appropriate debt threshold? 15
Notes 16
References 17
Figures
1 Fiscal deficit-to-GDP ratio 3
2 Fiscal operations of consolidated budget 4
3 Growth rate and tax ratios 4
4 Current and capital expenditures of consolidated budget 4
5 Various current expenditure components of consolidated budget 5
6 Financing consolidated deficit 5
7 Total public debt 7
8 Domestic and external debt paths 7
9 Consolidated total net public debt as % of GDP under different growth rate assumptions 10
10 Consolidated total net public debt as % of GDP under different interest rate assumptions 10
11 Consolidated total net public debt as % of GDP under different fiscal revenues assumptions 10
tables
1 Evolution of Egypt’s primary balances (FY99–04) 4

ii f iscal and Publ ic dEbt susta inabil i t y
2 Financing requirements under various budget definitions 5
3 Egypt’s public debt (various definitions) 7
4 Primary balance required to maintain net public debt at 129 percent of GDP 9
5 Primary balance required to maintain net public debt at 88 percent of GDP 9
Box
1 Assessing fiscal sustainability 6

f iscal and Publ ic dEbt susta inabil i t y iii
Abbreviations and acronyms
cBe Central Bank of EgypteA Economic AuthorityeGPc Egyptian General Petroleum CorporationGASc General Authority of Supply CommoditiesGDP gross domestic productMoF Ministry of FinanceNiB National Investment BankSiF Social Insurance Funds


f iscal and Publ ic dEbt susta inabil i t y 1
Recent fiscal trends have produced a debt burden in Egypt higher than is considered prudent by international norms. Different definitions yield ratios of debt varying from 88 percent of gross domestic product (GDP) to 129 percent. Even the low end of this range compares unfavorably with the norm of 60 percent often used as a threshold for concern.1
Analysis for this Policy Note suggests that the primary surpluses required to stabilize the debt at 129 percent of GDP would be higher than those achieved by Egypt in recent years for most combinations of real growth and interest rates. So the current level of debt must be considered unsustainable by this measure.
If transfers from the Social Insurance Funds (SIFs) are considered intragovernmental, the public debt would be lower (at 88 percent of GDP) and the associated primary surplus requirements would fall within the range achieved by Egypt in recent years. But even this is not satisfactory, because recent surpluses have been achieved by cuts in public investment expenditures that may undermine the basis for higher growth over the long run. And even with the lower debt, simulations show no ten-dency for the debt-to-GDP ratio to decline in a scenario that assumes average economic growth
of 5 percent over the next 10 years. Instead, it stays flat.
The institutional characteristics of Egypt’s public debt suggest that the debt-to-GDP ratio can be managed in an orderly fashion. More than half the debt is held by domestic public sector institutions rather than external agents, reducing the likelihood of a sudden halt to new financings and rollovers. Also reducing that risk: the external debt is long term and held by official sources rather than commercial banks or bondholders.
Note that the analysis here does not consider the fiscal or debt consequences of any contingent public sector liabilities, such as those arising, say, from the financial sector or from the pension system. The effect of such liabilities and fiscal risks could be substantial and provide even more reason for adopting a cautious stance for public debt. This issue will be the subject of a forthcoming Policy Note.
Summary


f iscal and Publ ic dEbt susta inabil i t y 3
1 Fiscal trends in egypt
Egypt adopted a new fiscal reporting system in the fiscal year 2000–01 (FY00), using three definitions of the public sector. The first and narrowest definition cov-ers only the central government, local administration, and public service authorities. The second also includes the fiscal accounts of the General Authority of Supply Commodities (GASC)2 and the National Investment Bank (NIB).3 The third in-corporates the SIFs.4 For this note, we have worked with the last two definitions of the deficit, using “broad” for the second definition and “consolidated” for the third. In FY04 the fiscal deficit was 7.6 percent of GDP under the broad definition and 2.7 percent under the consolidated. The corresponding net public debt levels were 129.3 percent and 87.9 percent. The consolidated definition yields lower deficit and debt levels because the SIFs are, at least at present, a net source of financing.
The fiscal deficit began deteriorating after FY98, following a long period of improve-ment. Strict fiscal measures undertaken in the context of the Economic Reform and Structural Adjustment Program reduced the fiscal deficit from 15 percent in FY91 to about 1 percent between FY95 and FY98. Thereafter, regard-less of the definition, the fiscal deficit started to increase rapidly (figure 1).
Disaggregating the fiscal accounts shows that recent deficits have been driven by declin-ing public revenues rather than rising public expenditures. Total public expenditures have remained stable at about 30 percent of GDP while revenues declined from 30 percent to 27 percent of GDP between FY99 and FY04 (fig-ure 2). Furthermore, analysis of revenue trends from as early as 1991 suggests that, in general, tax and nontax revenues (as ratios to GDP) have not moved in line with economic growth (fig-ure 3). The low buoyancy of revenues during the 1990s indicates that structural weaknesses (nar-row tax base and inefficient tax administration) were at work.
Constancy in the level of total expendi-tures has been achieved by a sharp decline in capital spending, offsetting an equivalent increase in current spending. Capital expendi-tures declined to 3.7 percent of GDP in FY04, down from 5.8 percent in FY99. Meanwhile, despite some fluctuations, current expenditures increased from 22 percent of GDP in FY99 to 24 percent in FY04 (figure 4). This upward trend

4 f iscal and Publ ic dEbt susta inabil i t y
has been driven by wages and salaries, domestic interest payments, pension contributions, and subsidies. These items collectively represent 58 percent of total expenditure in the FY04 budget and almost 18 percent of GDP (figure 5).
Since FY99 the primary balance has been pos-itive. The primary balance, or the deficit before adjusting for interest payments, has been posi-tive in Egypt since FY99 for both the broad and the consolidated concepts (table 1). The average surplus has been 2.4 percent and 3.5 percent, respectively.5
Financing needs have typically been larger than the budget deficits. In recent years, financ-ing requirements have been larger than the over-all deficit under both definitions of the budget (table 2). This is because arrears and adjustments
Ratio of balance to GDP (%)
FY99 FY00 FY01 FY02 FY03 FY04
Broad primary balance
3.8 2.5 2.1 1.8 2.0 23.0
Consolidated primary balance
4.7 3.6 3.0 2.8 3.4 3.3
Source: Calculated from MoF data published by CBE in the Statistical Monthly Bulletin.
Table 1 Evolution of Egypt’s primary balances (FY99–04)

f iscal and Publ ic dEbt susta inabil i t y 5
for errors are shown in the financing tables but not in the budget tables. When these two cat-egories are taken into consideration, the total financing requirement is about 2 percent of GDP higher than the reported deficit, regard-less of the budget definition.
Domestic banks are the main holders of domestic debt. The domestic banking system, including the Central Bank of Egypt CBE), has been the main financing source for the Govern-ment (figure 6). During the past four years, the Government has raised on average 5.5 percent of GDP from domestic banks. CBE publica-tions provide data on the outstanding domes-tic debt stock by holder only for treasury bills. These data show that more than 95 percent of the treasury bill stock is held by the banking sys-tem, of which more than 70 percent is held by the publicly owned banks.
Ratio of balance to GDP (%)
FY99 FY00 FY01 FY02 FY03 FY04
Broad overall deficit
–4.5 –6.0 –6.9 –7.5 –8.0 –7.6
Consolidated overall deficit
–0.1 –1.2 –2.2 –2.5 –2.4 –2.7
Adjustment to cash/errors and omissions: broad
0.3 –0.9 –1.2 –0.8 –1.1 –0.7
Adjustment to cash/errors and omissions: consolidated
0.2 –0.9 –0.9 –0.8 –1.1 –0.7
Arrears –0.4 –1.2 –1.3 –1.5 –1.0 –0.9
Financing requirements: broad deficit
–4.7 –8.0 –9.5 –9.8 –10.2 –9.2
Financing requirements: consolidated deficit
–0.3 –3.3 –4.5 –4.9 –4.5 –4.3
Source: Calculated from MoF data published by CBE in the Statistical Monthly Bulletin.
Table 2 Financing requirements under various budget definitions

6 f iscal and Publ ic dEbt susta inabil i t y
Recent trends in public debt
An accurate assessment of fiscal sustainability calls for measuring public debt comprehensively (box 1). For this, information is needed on all parts of the public sector that are linked together by actual and contingent liabilities. Conducting such a comprehensive analysis for Egypt is difficult, given the lack of consistent and reliable information. In particular, data are lacking for the contingent liabili-ties involved in the pension system and the financial sector. Published data allow only a calculation of the explicit debts of the government sector (central and local administrative units and service authorities), the NIB, Economic Authorities,6 and SIFs.
After declining steadily through the 1990s, the net public debt of Egypt has been rising since FY00. According to the consolidated def-inition of the public sector, the total net public debt rose from 64.7 percent of GDP in FY00
to 87.9 percent in FY04 (table 3 and figure 7). Both the external and domestic components of the debt have contributed to the rising trend (figure 8). The rise in the external debt compo-nent is largely due to the several devaluations experienced by Egypt over the period FY00–04, since the government has generally main-tained a cautious policy with respect to acquir-ing new external debt.
The levels of public debt discussed here are not adjusted for transactions from the “ blocked” account. This account was established under a Paris Club agreement to reschedule Egyptian external debt in 1991. An amount currently equal to about LE 70 billion is available in this account at the Central Bank for eventual repayment of the rescheduled external obligations. Without access to the repayment schedule, it was dif-ficult to incorporate it in this analysis. If this amount were subtracted from the FY04 level of the debt, the resulting public debt would be close to 73 percent of GDP.
2
One approach to assessing debt sustainability requires determining the debt-
stabilizing primary fiscal surplus for a given combination of growth and interest
rates. This measure can be expressed as:
ps = (I – g)d
where ps is the primary surplus (as a ratio to GDP) required to stabilize the debt-
to-GDP ratio for a given steady real interest rate (I), long-run growth rate of real
GDP (g), and initial stock of debt (d). This indicator can help assess a given current
fiscal policy by judging whether the existing primary balance is consistent with a
stable debt-to-GDP ratio and indicating how much effort is required to achieve a
stable debt ratio. The debt stock would be judged unsustainable if the ratio implies
the need for adjustment efforts beyond those observed in the country’s historical
performance.
In the second approach, different categories of the fiscal balance sheet
(wages, subsidies, interest payments, taxes, and so on) are calibrated for a base
year and then projected on the basis of historical trends or other assumptions.
Implied fiscal deficits are calculated, which then allows for an estimate of the
implied change in the debt stock assuming that all financing is done through bor-
rowing. This framework can be used to examine the sensitivity of the debt-to-GDP
ratio to changes in the most important budget categories and macroeconomic
variables.
Box 1 Assessing fiscal sustainability

f iscal and Publ ic dEbt susta inabil i t y 7
FY00 FY01 FY02 FY03 FY04
Gross domestic debt (LE billion)
Government and NIB + 256.1 337.1 397.1 470.9 566.6
Government, NIB, and SIFs + 136.3 200.8 242.4 296.1 370.5
Net domestic debt (LE billion)
Government and NIB + 245.5 290.8 329.8 370.6 434.8
Government, NIB, and SIFs + 125.7 154.4 175.1 195.8 238.7
Public external debt ($ billion) 27.4 26.1 28.1 28.5 28.8
Public external debt (LE billion) 94.4 100.7 126.8 174.0 178.0
Total net public debt (LE billion)
Government and NIB + 339.9 391.5 456.6 544.6 613.3
Government, NIB, and SIFs + 220.1 255.1 302.0 369.8 417.1
GDP 340.1 358.7 378.5 417.5 474.8
Total net public debt as a share of GDP (percent)
Broad total net public debt* 100.0 109.1 120.6 130.4 129.3
Consolidated total net public debt* 64.7 71.1 79.8 88.6 87.9
+ This sign means that the debt of Economic Authorities is added.* Broad and consolidated refer to the two definitions of the public sector: Government + NIB + GASC, and Government + NIB + GASC + SIFs.
Table 3 Egypt’s public debt (various definitions)

8 f iscal and Publ ic dEbt susta inabil i t y
Fiscal sustainability analysis
Fiscal policies are considered sustainable if they ensure a country’s solvency, given the costs of financing in the market and without having to take unrealistically large future corrective measures. By solvency, we mean the country’s present and future ability to service its debt obligations on time—that is, without rescheduling or repudiation.
The goal of fiscal sustainability analysis is to form a view about how the out-standing net stock of a government’s debt is likely to evolve over time. The starting point of common approaches to measuring debt sustainability is the current period budget constraint of the government. But these approaches differ in how they use this constraint. For this Policy Note, two tests of sustainability are used. The first calculates the debt-stabilizing primary surplus, the second the number of years be-fore the debt ratio exceeds a danger threshold.
For the debt-stabilizing primary surplus approach, it is necessary to start with the initial level of debt that is to be stabilized and assume a steady-state growth rate for the economy and a steady-state level for the real interest rate (see box 1). In the fiscal accounting approach, differ-ent categories of the fiscal balance sheet (wages, subsidies, interest payments, taxes, and so on) are calibrated for a base year and then pro-jected on the basis of historical trends or other assumptions.
The debt-stabilizing primary surplus approach
We use the debt ratio of FY04 as the initial level of debt that has to be stabilized. Note that this does not necessarily imply that this level is sus-tainable. Indeed, current levels of public debt in Egypt are higher than considered prudent for developing countries and higher than the level at which many countries experience severe macroeconomic instability. Our immediate
objective is to determine what sort of primary surplus effort will be required to maintain the debt at the level already reached.
We assume that the growth rate and the real interest rate will range between the minimum and maximum values witnessed in the past four years, between 3 percent and 6 percent, and 2 percent and 8 percent, respectively. Because the focus is on total net debt, we have calculated and used the values of the weighted average of both external and domestic interest rates. Combinations with interest rates lower than growth rates are ignored (though they are possible, at least over the short run, in some high-growth economies). This is because a sustainability analysis should not be based on assumptions that by themselves solve the debt sustainability problem, as would be the case if real interest rates were consistently lower than output growth rates.
The results are cause for concern. The primary surplus required to maintain the “ broad”
3
f iscal and Publ ic dEbt susta inabil i t y 9
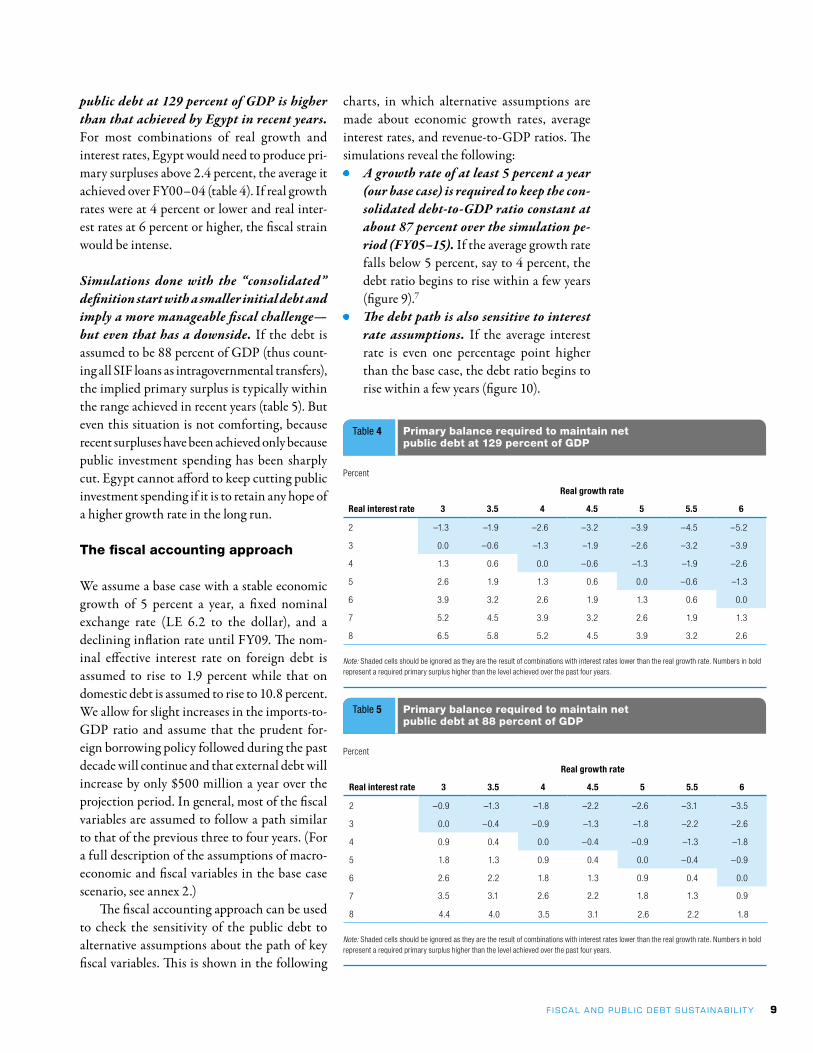
public debt at 129 percent of GDP is higher than that achieved by Egypt in recent years. For most combinations of real growth and interest rates, Egypt would need to produce pri-mary surpluses above 2.4 percent, the average it achieved over FY00–04 (table 4). If real growth rates were at 4 percent or lower and real inter-est rates at 6 percent or higher, the fiscal strain would be intense.
Simulations done with the “consolidated” definition start with a smaller initial debt and imply a more manageable fiscal challenge—but even that has a downside. If the debt is assumed to be 88 percent of GDP (thus count-ing all SIF loans as intragovernmental transfers), the implied primary surplus is typically within the range achieved in recent years (table 5). But even this situation is not comforting, because recent surpluses have been achieved only because public investment spending has been sharply cut. Egypt cannot afford to keep cutting public investment spending if it is to retain any hope of a higher growth rate in the long run.
The fiscal accounting approach
We assume a base case with a stable economic growth of 5 percent a year, a fixed nominal exchange rate (LE 6.2 to the dollar), and a declining inflation rate until FY09. The nom-inal effective interest rate on foreign debt is assumed to rise to 1.9 percent while that on domestic debt is assumed to rise to 10.8 percent. We allow for slight increases in the imports-to-GDP ratio and assume that the prudent for-eign borrowing policy followed during the past decade will continue and that external debt will increase by only $500 million a year over the projection period. In general, most of the fiscal variables are assumed to follow a path similar to that of the previous three to four years. (For a full description of the assumptions of macro-economic and fiscal variables in the base case scenario, see annex 2.)
The fiscal accounting approach can be used to check the sensitivity of the public debt to alternative assumptions about the path of key fiscal variables. This is shown in the following
charts, in which alternative assumptions are made about economic growth rates, average interest rates, and revenue-to-GDP ratios. The simulations reveal the following:• A growth rate of at least 5 percent a year
(our base case) is required to keep the con-solidated debt-to-GDP ratio constant at about 87 percent over the simulation pe-riod (FY05–15). If the average growth rate falls below 5 percent, say to 4 percent, the debt ratio begins to rise within a few years (figure 9).7
• The debt path is also sensitive to interest rate assumptions. If the average interest rate is even one percentage point higher than the base case, the debt ratio begins to rise within a few years (figure 10).
Percent
Real interest rate
Real growth rate
3 3.5 4 4.5 5 5.5 6
2 –0.9 –1.3 –1.8 –2.2 –2.6 –3.1 –3.5
3 0.0 –0.4 –0.9 –1.3 –1.8 –2.2 –2.6
4 0.9 0.4 0.0 –0.4 –0.9 –1.3 –1.8
5 1.8 1.3 0.9 0.4 0.0 –0.4 –0.9
6 2.6 2.2 1.8 1.3 0.9 0.4 0.0
7 3.5 3.1 2.6 2.2 1.8 1.3 0.9
8 4.4 4.0 3.5 3.1 2.6 2.2 1.8
Note: Shaded cells should be ignored as they are the result of combinations with interest rates lower than the real growth rate. Numbers in bold represent a required primary surplus higher than the level achieved over the past four years.
Table 5 Primary balance required to maintain net public debt at 88 percent of GDP
Percent
Real interest rate
Real growth rate
3 3.5 4 4.5 5 5.5 6
2 –1.3 –1.9 –2.6 –3.2 –3.9 –4.5 –5.2
3 0.0 –0.6 –1.3 –1.9 –2.6 –3.2 –3.9
4 1.3 0.6 0.0 –0.6 –1.3 –1.9 –2.6
5 2.6 1.9 1.3 0.6 0.0 –0.6 –1.3
6 3.9 3.2 2.6 1.9 1.3 0.6 0.0
7 5.2 4.5 3.9 3.2 2.6 1.9 1.3
8 6.5 5.8 5.2 4.5 3.9 3.2 2.6
Note: Shaded cells should be ignored as they are the result of combinations with interest rates lower than the real growth rate. Numbers in bold represent a required primary surplus higher than the level achieved over the past four years.
Table 4 Primary balance required to maintain net public debt at 129 percent of GDP

10 f iscal and Publ ic dEbt susta inabil i t y
• Fiscal adjustment through higher revenue collections can improve the debt ratio. A one-point increase in the revenues-to-GDP ratio relative to the base case generates a falling debt path. By the same token, an equivalent deterioration in the revenue ratio makes the debt path unsustainable (figure 11).Beyond the present assessment, further
research could be undertaken to estimate the size of contingent liabilities and assess their impact on fiscal sustainability in Egypt. The analysis of explicit debt alone may not be sufficient for an adequate assessment. By their nature, contingent liabilities take a wide variety of forms and are therefore difficult to measure. But some important sources of contingent liabilities are relatively tractable. Among these, financial sector and pension system contingent liabilities are most likely to pose substantial risks for Egypt.

f iscal and Publ ic dEbt susta inabil i t y 11
ANNex 1
egypt’s main budget items
Old Series
FY91 FY92 FY93 FY94 FY95 FY96 FY97 FY98
Total revenue 29.0 35.0 29.6 29.9 28.6 26.4 24.9 24.1
Tax on income and business profits 6.5 8.4 7.0 6.8 6.2 5.9 5.6 5.4
Sales tax 3.4 5.3 4.6 4.6 4.8 4.5 4.4 4.6
Customs duties 3.3 3.9 3.2 3.5 3.6 3.4 3.1 3.2
Profits transfers from Economic Authorities
7.1 7.5 5.9 5.2 5.4 4.8 4.4 3.8
Capital revenues 3.0 3.0 1.9 1.8 1.4 1.4 1.4 1.4
Total expenditure 46.2 40.2 33.1 32.0 29.9 27.7 25.8 25.1
Wages 7.2 6.8 6.2 6.3 6.4 6.1 5.9 6.0
Public debt interest 7.1 8.0 8.4 9.4 7.6 7.0 6.0 5.3
Local 4.2 5.4 5.9 6.7 5.7 5.3 4.8 4.3
Foreign 2.9 2.7 2.5 2.7 1.9 1.6 1.2 1.0
Subsidies 5.6 6.1 2.6 1.9 2.0 1.9 1.6 1.5
Capital expenditure 16.1 9.6 6.9 5.8 5.4 5.2 5.2 5.4
Primary surplus 24.3 13.2 11.9 11.5 8.9 8.3 6.9 6.3
Deficit/surplus –17.2 –5.2 –3.5 –2.1 –1.3 –1.3 –0.9 –1.0
New Series: The Budget Sector
FY99 FY00 FY01 FY02 FY03 FY04
Total revenue and grants 23.1 22.2 21.2 20.9 20.7 20.4
Current revenue 21.8 21.3 20.3 19.6 19.5 19.7
Tax revenue 15.1 14.6 14.3 13.7 13.8 13.8
Income taxes 5.4 5.9 5.9 5.7 5.6 5.8
Goods and services 6.0 5.9 5.8 5.4 5.5 5.4
International trade 3.6 2.7 2.6 2.5 2.7 2.5
Nontax revenue 6.7 6.7 6.0 5.9 5.7 5.6
Capital revenue 0.7 0.3 0.5 0.3 0.5 0.4
Total expenditure and net lending 26.0 26.1 26.8 26.7 26.8 26.1
Total expenditure 25.6 25.4 26.7 26.6 26.8 26.0
Current expenditure 19.9 20.5 22.5 22.6 22.8 23.2
Wages and salaries 6.4 6.5 7.0 7.5 7.6 7.4
Interest payments 5.3 5.5 5.8 6.1 6.4 6.6
Domestic 4.6 4.9 5.3 5.4 5.9 6.1
Foreign 0.8 0.5 0.5 0.6 0.6 0.5
Capital expenditure 5.7 4.9 4.2 4.0 4.0 3.7
Lending minus repayments 0.4 0.6 0.0 0.1 0.0 0.1
Primary surplus 2.4 1.6 0.3 0.2 0.3 0.8
Deficit/surplus –2.9 –3.9 –5.6 –5.9 –6.1 –5.7
LE billions
12 f iscal and Publ ic dEbt susta inabil i t y
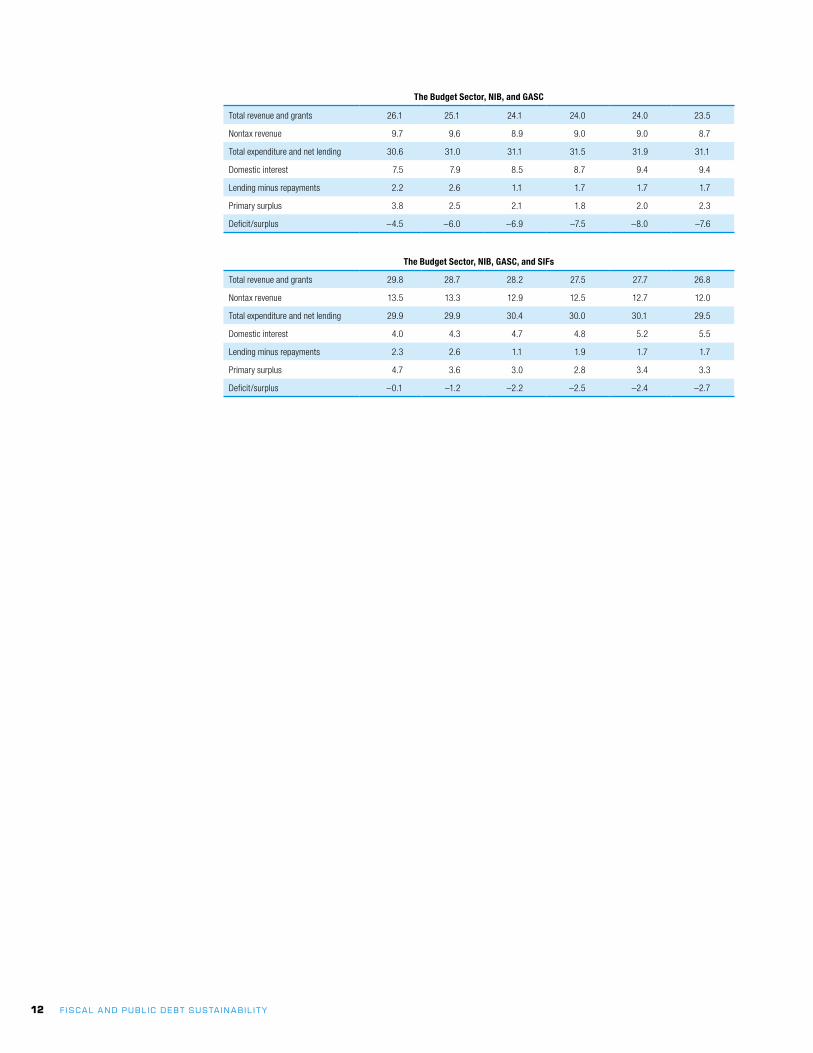
The Budget Sector, NIB, and GASC
Total revenue and grants 26.1 25.1 24.1 24.0 24.0 23.5
Nontax revenue 9.7 9.6 8.9 9.0 9.0 8.7
Total expenditure and net lending 30.6 31.0 31.1 31.5 31.9 31.1
Domestic interest 7.5 7.9 8.5 8.7 9.4 9.4
Lending minus repayments 2.2 2.6 1.1 1.7 1.7 1.7
Primary surplus 3.8 2.5 2.1 1.8 2.0 2.3
Deficit/surplus –4.5 –6.0 –6.9 –7.5 –8.0 –7.6
The Budget Sector, NIB, GASC, and SIFs
Total revenue and grants 29.8 28.7 28.2 27.5 27.7 26.8
Nontax revenue 13.5 13.3 12.9 12.5 12.7 12.0
Total expenditure and net lending 29.9 29.9 30.4 30.0 30.1 29.5
Domestic interest 4.0 4.3 4.7 4.8 5.2 5.5
Lending minus repayments 2.3 2.6 1.1 1.9 1.7 1.7
Primary surplus 4.7 3.6 3.0 2.8 3.4 3.3
Deficit/surplus –0.1 –1.2 –2.2 –2.5 –2.4 –2.7

f iscal and Publ ic dEbt susta inabil i t y 13
ANNex 2
Base case assumptions
The following table describes the assumptions characterizing important variables in the base case scenario. Variables that are not included are assumed to take the average of or continue the trend of the previous three years.
Variable(s) Assumption
Macroeconomic variables:
Real GDP growth rate To remain constant at 5 percent over the projection period. The growth rate in the first quarter of FY05 was officially estimated at 4.8 percent and is expected to reach 5 percent for the whole year.
GDP inflation rate To decline to 5.7 percent in FY05, then gradually to 3.4 percent in FY09, remaining at this level in the following years.
Exchange rate (end of period) To remain at LE 6.2 to the dollar.
Nominal effective interest rate on foreign debt
To remain at 1.9 percent during the entire projection period. The assumed rate is the average of the previous three years’ rates.
Nominal interest rate on domestic debt To keep increasing—though marginally—until FY09 and then to remain constant at 10.8 percent.
Average effective tariff rate To decrease proportionally to the reduction in the weighted average tariff rate (as announced by the Minister of Finance). The so calculated tariff rate is applied over the whole projection period except for FY05, when the new rate started to be effective in the second quarter of the year.Note that the availability of data on average old effective tariff rates, new tariff rates, and collected customs for different bands would make the calculated average tariff rate more certain.
Imports of goods in LE as percentage of GDP To keep increasing marginally during the projection period to reach 17.7 percent in FY13, up from 14.7 percent in FY04.
Fiscal variable(s):
Direct tax revenues
Individuals To decline as a share of GDP from 1.4 percent in FY05 (FY04) to 1.1 percent in FY06. According to the proposed income tax law, tax rates will be reduced and family burden exemptions will increase. Also, partnerships will be moved to corporate tax items. The average tax rate is therefore assumed to decrease from 20 percent to 15 percent, and the tax base to narrow by 40 percent. This would translate into a decline in the share to GDP of individuals’ tax revenue from 1.4 percent in FY04 and FY05 to 1.1 percent in FY06. Due to the expected tax system reforms, this share is assumed to creep up to 1.3 percent in FY09 and remain constant afterward.
Egyptian General Petroleum Corporation, Suez Canal, and CBE
To remain constant (as a share of GDP) at the average of the previous four years. The new tax law does not change the tax treatment of these entities.
Other corporate taxes To increase slowly from 1.4 percent in FY04 to 1.7 percent in FY10 and remain constant afterward. Despite cuts in corporate tax rates from 30–40 percent to a flat rate of 20 percent, the share of this item relative to GDP is assumed to go up due to an expected increase in revenue from abolishing the tax exemption that used to be provided to capital depreciation amounts, higher tax arrears (given the generous amnesty proposed by the MoF), higher tax revenues caused by the move of partnerships to this line, and an expected broader tax base.N.B.: Assumptions would be more accurate if the following data were made available:• Tax rates and tax bases corresponding to individual income brackets.• Tax arrears, estimates for forgone tax revenue from exempting capital depreciation, and shares
of different tax brackets in total corporate tax revenues.
Sales tax revenues To increase from 5.4 percent of GDP in FY04 to 5.5 percent in FY05 (the average of the previous three years), and to 5.6 percent in the following years.

14 f iscal and Publ ic dEbt susta inabil i t y
Variable(s) Assumption
Non-tax revenue
Property income To increase from 4 percent in FY04 to 4.1 percent in the years after. This is based on the official estimate of an increase of 1 billion in EGPC revenues after the diesel price increase in August 2004.
Administrative fees To grow by 1 percent annually over the whole projection period. Although this is apparently marginal growth, it is reasonable given the wide fluctuations this item has undergone over the last four years.
SIF revenues To continue to decline relative to GDP to 2.8 percent in FY05 from 3.3 percent in FY04 and remain constant afterward. The share in FY05 is forecast based on the share’s level in the previous four years.
Defense, pensions, and central government net lending
To remain constant in shares of GDP over the projection period at the level of the three previous years’ average share.
Wages and salaries To remain constant in shares of GDP at the level of FY04 for the projection period.
Subsidies To grow by the minimum growth rate of the FY01–FY05 period. For FY05, the MoF provided an estimate of LE 10.6 billion.
Budgetary investment To decline gradually to reach 3.1 percent of GDP by FY13 from 3.7 percent in FY04.
Other purchases To decline from 1.7 percent in FY04 to 1.3 percent in FY08, and remain constant thereafter.
Domestic gross debt of Economic Authorities To keep growing at the average growth rate of the previous four years over the projection period.

f iscal and Publ ic dEbt susta inabil i t y 15
ANNex 3
What is the appropriate debt threshold?
Choosing an appropriate threshold for assessing whether a country’s debt is sus-tainable is often a difficult part of sustainability analysis. As the literature on early warning systems has shown, assessing prudent debt levels necessarily involves a large degree of judgment. International standards (such as those applied under the Maas-tricht Treaty) and the experience of countries encountering debt-servicing problems can inform this judgment.
Empirical literature examining episodes of “debt distress” suggests that 40 percent is a use-ful benchmark for external debt sustainability. However, countries are likely to differ in their ability to sustain a given external debt level. Countries with weaker institutions and poli-cies are likely to experience debt distress at a 30 percent debt-to-GDP ratio, while countries with strong policies have the same risk of dis-tress at 60 percent of GDP (IMF and World Bank 2004).
Although domestic public debt has become a serious issue in a number of developing coun-tries, no firm empirical thresholds are available to assess this component of total public debt.8 This is because the assessment of domestic debt depends on a variety of country-specific fac-tors, including the debt’s purpose, cost, and coverage.
Domestic debt instruments are issued for different reasons. For example, in a small number of strongly performing countries, domestic debt has been accumulated in response to large external inflows to ensure that the inflows do not lead to excessive appreciation pressures on the domestic currency (as was the case in the 1990s in Egypt). In many cases issuance of domestic debt ref lects a government’s attempts to foster the development of domestic financial markets, which can make it easier to eventually issue such debt at a reasonable
cost in domestic currency. Governments may also issue domestic debt to sterilize liquidity created by supporting public sector banks that are experiencing financial difficulties or to recapitalize insolvent banks (as recently done in Egypt).
Also, different degrees of coverage of public debt in developing countries make it difficult to make inter-country comparisons. Not only are data often unavailable in developing countries, but also—when available—they reflect different definitions of what constitutes public sector debt. In most cases, data cover central government debt only and exclude debt contracted by other important public entities.
Nevertheless, given its importance for macroeconomic stability, domestic debt needs to be monitored. The benefits of such debt must be carefully weighed against the potentially heavy burden it imposes on the budget. For most developing countries, domestic debt tends to be issued at shorter maturities and is therefore more vulnerable to rollover risks. It is also usually issued at market interest rates. Therefore it is much more vulnerable to changes in the macroeconomic environment and is currently a costlier form of financing compared with highly concessional external funds—even after exchange-rate risks are taken into account (IMF 2004).

16 f iscal and Publ ic dEbt susta inabil i t y
Notes
1. Although the threshold is arbitrary, re-search shows that 55 percent of debt defaults during the past 30 years were in countries with debt ratios below 60 percent of GDP and as much as 35 percent of defaults were in countries with debt ratios below 40 percent (IMF 2003a).
2. The GASC is the Economic Authority re-sponsible for providing subsidized commodities to the Egyptian public. In addition to its revenue from the sale of the commodities, the GASC also receives trans-fers from the budget sector to fund the price subsidy.
3. The National Investment Bank (NIB) is to-tally owned by the government and is mandated to finance public investment projects included in the national plan. It borrows largely from the SIFs and lends largely to the Government and to Economic Authorities.
4. SIFs are legally considered semi-public funds, providing pensions to eligible retirees from both the public and private sectors. Besides contri-butions from participating employees and employers, SIFs receive annual transfers from the Government to cover cost of living increases in pensions. SIFs in-vest their reserves almost entirely in Government or NIB liabilities. In this fashion, SIF resources are used to fund public sector expenditures, either directly or through the NIB. Currently, the Gov-ernment and Economic Authorities jointly borrow about 70 percent of NIB’s resources, while the SIFs transfer to the NIB represents almost 70 percent of the NIB’s resources.
5. Larger primary surpluses were run in the mid-1990s as the deficit was brought down. Between FY94 and FY98, the surplus ranged between 7.3 per-cent and 4.3 percent of GDP. However, these figures,
which are calculated from the old presentation of the budget, are not comparable with those of the new presentation.
6. Economic Authorities are public entities with budgets separate from the annual state budget. Part of their debt is guaranteed by the Government and the rest—although formally not guaranteed—can be assumed to be underwritten by the Govern-ment in practice. This is because of the implicit social commitment of the Government to ensure the provi-sion of the services and goods delivered by these en-tities. Given their public nature, it is appropriate to include them in the consolidated definition of public sector debt. However, we have excluded those Eco-nomic Authorities that were converted into holding companies because—by law—they are not techni-cally part of the public sector.
7. The IMF estimates Egypt’s net domes-tic debt to be at 45.7 percent of GDP (lower than our estimate of 50.3 percent). The lower estimate is based on adjustments made by IMF staff using more detailed information on fiscal transactions among government entities than the figures published by the CBE, the source used in this note. According to the IMF, official statistics tend to overestimate some components of gross domestic public debt, and un-derestimate banks’ loans to the general government. In addition, the IMF estimates include the blocked accounts on rescheduled Paris Club debt held at the CBE. However, while the initial level of net public debt is lower than the one calculated in this note, the trajectory of the projected domestic debt to GDP ratio is similar to that derived here.
8. For a discussion of the main considerations to guide this decision, see IMF (2003a).

f iscal and Publ ic dEbt susta inabil i t y 17
References
Alba, Pedro, Sherine Al-Shawarby, and Farrukh Iqbal. 2004. “Fiscal and Debt Sustainability in Egypt.” Working Paper 38. World Bank, Wash-ington, D.C.
International Monetary Fund. 2003a. “Debt Sustainability in Low-Income Countries—Towards a Forward-Looking Strategy.” Policy Development and Review Department. Wash-ington, D.C.
———. 2003b. “Sustainability—Review of Applica-tion and Methodological Refinements.” Policy Development Review Department. Washing-ton, D.C.
Izquierdo, A., and U. Panizza. 2003. “Fiscal Sustainability: Issues for Emerging Market Countries.” ECES Working Paper 91. Egyptian Center for Economic Studies. Cairo, Egypt.
Mendoza, Enrique G., and Marcelo P. Oviedo. 2004. “Fiscal Solvency and Macroeconomic Un-certainty in Emerging Markets: The Tale of the Tormented Insurer.” University of Maryland and NBER, Iowa State University.
