policy-effective financial knowledge and attitude … · policy-effective financial knowledge and...
TRANSCRIPT
Policy-effective Financial Knowledge and Attitude Factors in Latin America
Gabriel Garber and Sergio Mikio Koyama
December 2017
469

ISSN 1518-3548CGC 00.038.166/0001-05
Working Paper Series Brasília no. 469 DecDecembermber
2017 p. 1-42

Working Paper Series
Edited by the Research Department (Depep) – E-mail: [email protected]
Editor: Francisco Marcos Rodrigues Figueiredo – E-mail: [email protected]
Co-editor: José Valentim Machado Vicente – E-mail: [email protected]
Editorial Assistant: Jane Sofia Moita – E-mail: [email protected]
Head of the Research Department: André Minella – E-mail: [email protected]
The Banco Central do Brasil Working Papers are all evaluated in double-blind refereeing process.
Reproduction is permitted only if source is stated as follows: Working Paper no. 469.
Authorized by Carlos Viana de Carvalho, Deputy Governor for Economic Policy.
General Control of Publications
Banco Central do Brasil
Comun/Divip
SBS – Quadra 3 – Bloco B – Edifício-Sede – 2º subsolo
Caixa Postal 8.670
70074-900 Brasília – DF – Brazil
Phones: +55 (61) 3414-3710 and 3414-3565
Fax: +55 (61) 3414-1898
E-mail: [email protected]
The views expressed in this work are those of the authors and do not necessarily reflect those of the Banco Central do
Brasil or its members.
Although the working papers often represent preliminary work, citation of source is required when used or reproduced.
As opiniões expressas neste trabalho são exclusivamente do(s) autor(es) e não refletem, necessariamente, a visão do Banco Central do Brasil.
Ainda que este artigo represente trabalho preliminar, é requerida a citação da fonte, mesmo quando reproduzido parcialmente.
Citizen Service Division
Banco Central do Brasil
Deati/Diate
SBS – Quadra 3 – Bloco B – Edifício-Sede – 2º subsolo
70074-900 Brasília – DF – Brazil
Toll Free: 0800 9792345
Fax: +55 (61) 3414-2553
Internet: http//www.bcb.gov.br/?CONTACTUS
Non-technical summary
Financial literacy is a key element for the adequate use of financial services, which
should lead to an increase in population welfare. In this paper we address two central
concerns of the financial literacy literature.
The first is to use information obtained from surveys of individuals of four Latin
American countries to produce measures of financial knowledge and attitude. The second is
to provide guidance about which of the survey questions are associated to
knowledge/attitudes on which the use of financial products depends the most. The idea is that
these pieces of knowledge and attitudes could be the most effective in increasing population´s
welfare, which should be taken into account in the cost-benefit analysis carried on to choose
those that should be the focus of dissemination efforts.
We estimate a model in which financial behavior, understood as the use of financial
products and services, is explained by measures of knowledge, attitudes, and by the profile
of the surveyed individuals.
We use data gathered by the Development Bank for Latin America, from Bolivia,
Colombia, Ecuador and Peru. It is the first time that this technique is used in a setting with
many countries. We show that the composition and the importance of variables vary from
one country to another. However, the importance of attitude variables stands out in all
countries, especially regarding the setting of long-term financial goals by individuals.
3
Sumário Não Técnico
A Alfabetização Financeira é reconhecidamente um elemento chave para o uso
adequado dos serviços financeiros, proporcionando um aumento de bem-estar da
população. Neste artigo, abordamos duas questões centrais da literatura de alfabetização
financeira.
A primeira é usar informações recolhidas utilizando entrevistas a cidadãos de vários
países da América Latina para produzir indicadores de conhecimento e de atitudes
financeiras. A segunda é fornecer orientação sobre quais das questões avaliadas nessas
entrevistas estão associadas a conhecimentos/atitudes dos quais depende mais a utilização de
produtos financeiros. A ideia é que esses conhecimentos/atitudes poderiam trazer resultados
mais efetivos sobre o bem-estar da população, o que deveria ser levado em conta na análise
de custo-benefício para escolher quais conhecimentos/atitudes devem ter sua disseminação
como foco de esforços.
Estimamos um modelo em que o comportamento financeiro, considerado como o uso
de produtos e serviços, é explicado por medidas de conhecimento, atitude e perfil dos
entrevistados.
Utilizamos dados do Banco de Desenvolvimento para a América Latina, da Bolívia,
Colômbia, Equador e Peru. É a primeira vez que esta técnica é usada em um contexto que
inclui vários países. Mostramos que a composição e a importância do conjunto de
conhecimentos e atitudes mais relevantes variam de um país para outro. No entanto, a
importância das atitudes se destaca em todos os países, especialmente no que se refere à
definição de metas financeiras de longo prazo por parte de indivíduos.
4
Policy-effective Financial Knowledge and Attitude Factors in
Latin America
Gabriel Garber**
Sergio Mikio Koyama**
Abstract
In this paper we implement a technique that produces measures of financial
knowledge and attitudes by combining variables with weights that capture their
impact on financial behavior variables, thus providing guidance to policy design.
We use data gathered by CAF-Development Bank of Latin America in Bolivia,
Colombia, Ecuador, and Peru. It is the first time that this technique has been used
in a cross-country setting. We show that the composition and the weight vary
from one country to another. However, the importance of attitude variables stands
out in all countries, especially regarding the setting of long-term goals by
individuals.
Keywords: financial inclusion, financial literacy, financial knowledge, factors, scores
JEL Classification: D83, G29, A20, D12, D14, I28
The Working Papers should not be reported as representing the views of the Banco Central do Brasil.
The views expressed in the papers are those of the author(s) and do not necessarily reflect those of the
Banco Central do Brasil.
** Research Department, Central Bank of Brazil. For comments or suggestions write to
[email protected] or [email protected] . We thank Euler Pereira Goncalves de Mello,
Christiano Arrigoni, María José Roa García, André Minella, Carlos Viana de Carvalho, Nelson Ramirez, Ana
María Yaruro, Daisy Pacheco, Jose Ricardo da Costa e Silva, Raquel de Freitas Oliveira, Toni Ricardo E. dos
Santos, Tony Takeda, the Financial Education Department from BCB and the participants of the CEMLA Joint
research project on Households’ Financial Decision-Making for their support and comments. We also thank
Sergio Alexander Chambergo Valencia for research assistance and Jeff Cott, Justin Lee, Lejla Custo and Lena
Episalla for text editing.
5
1 - Introduction
The promotion of welfare enhancement through access to and adequate use of
financial products by citizens is a worldwide goal. In fact, 6 out of the 17 United Nations
Sustainable Development Goals to be achieved until 20301 explicitly include financial
services in the list of targets they rely on. There are several supply issues in the markets that
provide such services (e.g. competition and adequate product design), but, on the demand
side, financial literacy2 is the key element to enable the pursuit of these objectives.
The assessment of the financial literacy of a population generally relies on the use of
survey instruments with sets of questions not only about financial knowledge, but also about
attitudes. The emerging literature seems to have reached some degree of consensus about
which are the main facets of financial literacy to be assessed. The set of questions stemming
from Lusardi & Mitchell (2008) has been ubiquitously employed by researchers,
governments and other stakeholders.
Once the dimensions to assess are largely agreed upon, it is natural to look for
benchmarks that make possible some adequacy diagnose, aimed at producing policy
recommendations. A very natural strategy for finding these benchmarks is the comparison of
different populations. In 2009, a group of specialists from OECD/INFE developed the first
version of a survey aimed at measuring the degree of financial education in populations of
different countries. The core of the survey inquires about financial knowledge, attitudes and
behavior regarding several aspects of financial education and includes questions about
household budget, money management, short- and long-run financial planning, as well as
financial products choice process. The initial number of 14 countries collecting this data
increased to 30 in 2015, and the toolkit is consistently employed as a starting point by
countries and by researchers that pursue independent data gathering.
1 See http://www.un.org/sustainabledevelopment/sustainable-development-goals/ . The goals - and targets by
2030 - that rely partially on financial services are: (1) No Poverty; (2) No Hunger; (3) Good Health and Well-
Being; (5) Gender Equality; (8) Decent Work and Economic Growth; and (9) Industry. 2 See Lusardi & Mitchell (2014) for definition.
6

Figure 1 reproduces a comparison of financial knowledge among the countries, from
the first OECD data collection. The scale used there for comparison is the percentage of
surveyed individuals in each country who answered correctly at least 6 of 8 questions3. This
score conveys in a simple manner a comparison between countries and the readers may grasp
where, among these countries, she is likely to find the gravest problems in terms of financial
knowledge. Scales such as this one are widespread in the literature and have the priceless
characteristics of being simple and transparent.
However, in this paper we argue for the need of a different type of scale when we
reorient our goal from making a general diagnosis to crafting policy to be applied to a specific
population. When we face the problem of spending limited resources in order to enhance a
population´s financial knowledge or to improve its financial attitudes, we expect this to have
an impact on adequate use of financial services4, because in the end this should improve
3 Actually a right answer to the compound interest rate question was only taken into account if the individual
had a right answer in the (easier) simple interest rate question. We also adopt this strategy below. 4 These elements also affect the economic cost of access to financial services.
Figure 1 - Financial knowledge: Percentage scoring 6 or more out of 8 questions.
Source: Atkinson & Messy(2012). Lighter shaded columns indicate countries where fewer
than 50% achieved a score of 6 or more.
7

welfare (for example, by the adequate use of financial products by small farmers and
entrepreneurs). Thus, we develop a procedure that uses the predicted impact of financial
knowledge and financial attitude variables on behavior to assign the weights that they should
have in measures used for policy purposes. This is carried out using a system of equations to
predict several behavioral outcomes that are regarded as important goals.
There is nothing intrinsic in the questions that causes the different pieces of
knowledge assessed by the questions behind the comparison in figure 1 to have the same
effect on behaviors that policymakers wish to promote. We provide evidence that it is not the
case and that these effects change from country to country. Consequently, addressing policy
design in the context of internationally comparable scales seems to be suboptimal usage of
information and policy funding resources. The main questions may be the same, but their
effects on behavior and thus welfare, vary from one country to another.
Yet, the literature that investigates the impact of financial literacy on the behavior of
particular populations seems to be reluctant to forsake some simplicity in order to obtain
measures that are better predictors of behavior and that could shed light on the selection of
specific contents of educational interventions that could yield the highest behavioral change
payoff.
In previous work, the authors implemented a new technique to address this issue,
using Brazilian data gathered using the INFE-OECD toolkit and along some additional
questions. Results implied that the effectiveness of variables reflecting financial knowledge
in predicting policy objectives should be taken into account in the design of financial literacy
programs, especially given that they are quite heterogeneous and that several variables do
not seem to have an effect on financial inclusion at all.
In this study, we explore data gathered by the CAF (Development Bank for Latin
America)5 from four Latin American countries – Bolivia, Colombia, Ecuador and Peru - with
the same technique and explore the differences and similarities among them. We find that the
knowledge and attitude variables combine differently when we aim at producing factors
5 Household surveys were gathered in 2013/2014 and are representative at national level. For the dataset and
full description of “Encuesta de Medición de Capacidades Financieras en los Países Andinos” see
http://scioteca.caf.com/handle/123456789/743
8

correlated with behavior. However, there are attitude variables that stand out recurrently (i.e.,
in more than one country).
The paper continues as follows. In section 2, we make a brief literature review,
concentrated on measures and methodological techniques. In section 3, we explain the
econometric modeling we use to bring policy objectives into the computation of financial
knowledge and attitudes factors. Section 4 presents the results and we conclude our study in
section 5.
2 - Literature
Lusardi & Mitchell (2014) provide a comprehensive survey of the literature
concerning several aspects of financial literacy. Our work relates to the literature that
investigates whether high financial knowledge and positive financial attitude measures
predict desirable behavioral outcomes. In short, several studies show that the level of
financial knowledge (measured in different ways) relates to holding precautionary savings,
planning for retirement, using less costly financing and avoiding fees.
In this section, we focus on another aspect: how the literature translated responses to
survey questions into measures of knowledge and attitude. In the case of financial knowledge,
there are two direct ways of doing this. First, authors have used a dummy variable that takes
on the value of one if the individual gets all the questions right and zero otherwise. This
approach is taken, for example, in Lusardi & Mitchell (2011)6. Since this is generally applied
to a short list of questions (the first three questions that appear in Lusardi & Mitchell, 2008,
have become classics), which address the pillars of financial knowledge, it makes sense to
give zero to anyone who is unable to get all the questions right. The main caveat is that while
everyone being assigned one has the exact same answers, there is heterogeneity in the group
receiving zero, which is lost by this method of measurement.
This calls for the other widely applied method of turning answer profiles into scores:
giving one point for every questions properly answered. Atkinson and Messy (2012) and
6 Check Lusardi & Mitchell (2014), table 2, for a list of papers that employed this approach around the world.
9
Finke, Howe and Huston (2011) compute measures based on this scoring method7. This
approach preserves heterogeneity and is more appealing to surveys with longer lists of
questions. Thus, an individual who scored a zero could be separated from an individual who
scored a nine, just short of perfect, on a ten question survey. The problem with this way of
computing scores is that all questions are weighted equally. Then, the same score is attributed
to everyone that gets four correct answers, no matter which subset of financial knowledge
the individual displays knowledge of.
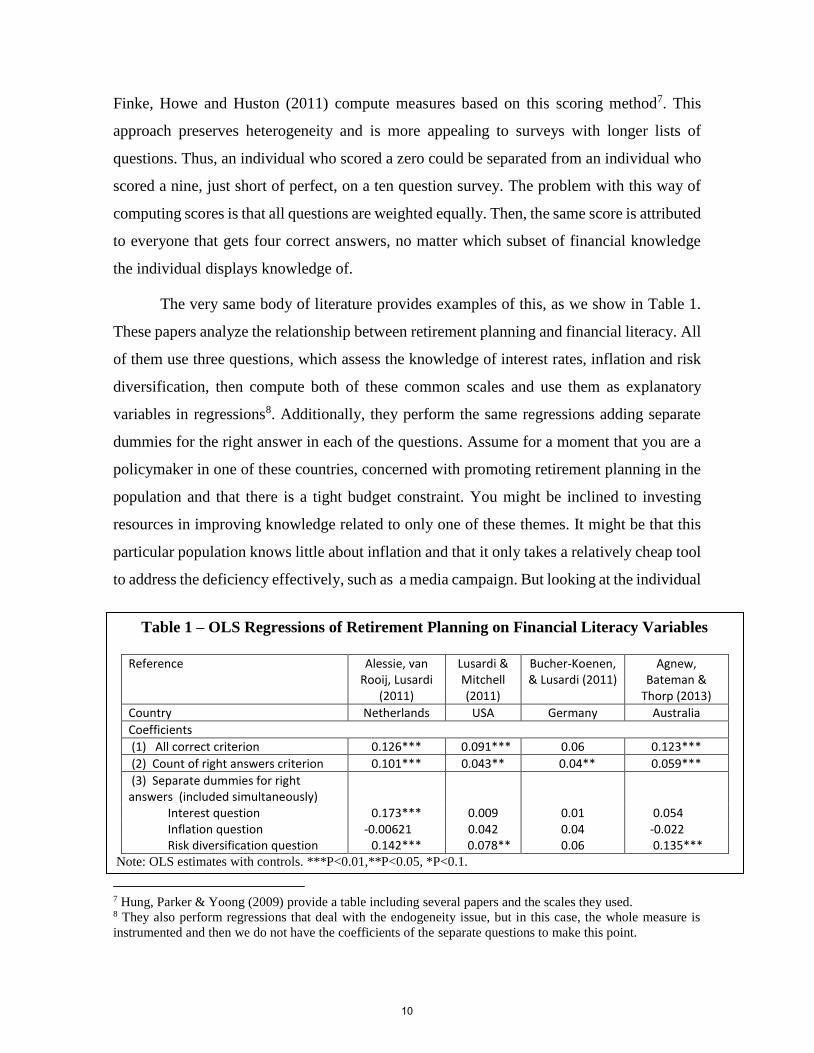
The very same body of literature provides examples of this, as we show in Table 1.
These papers analyze the relationship between retirement planning and financial literacy. All
of them use three questions, which assess the knowledge of interest rates, inflation and risk
diversification, then compute both of these common scales and use them as explanatory
variables in regressions8. Additionally, they perform the same regressions adding separate
dummies for the right answer in each of the questions. Assume for a moment that you are a
policymaker in one of these countries, concerned with promoting retirement planning in the
population and that there is a tight budget constraint. You might be inclined to investing
resources in improving knowledge related to only one of these themes. It might be that this
particular population knows little about inflation and that it only takes a relatively cheap tool
to address the deficiency effectively, such as a media campaign. But looking at the individual
7 Hung, Parker & Yoong (2009) provide a table including several papers and the scales they used. 8 They also perform regressions that deal with the endogeneity issue, but in this case, the whole measure is
instrumented and then we do not have the coefficients of the separate questions to make this point.
Table 1 – OLS Regressions of Retirement Planning on Financial Literacy Variables
Reference Alessie, van
Rooij, Lusardi (2011)
Lusardi & Mitchell (2011)
Bucher-Koenen, & Lusardi (2011)
Agnew, Bateman &
Thorp (2013)
Country Netherlands USA Germany Australia
Coefficients
(1) All correct criterion 0.126*** 0.091*** 0.06 0.123***
(2) Count of right answers criterion 0.101*** 0.043** 0.04** 0.059***
(3) Separate dummies for right answers (included simultaneously)
Interest question 0.173*** 0.009 0.01 0.054 Inflation question -0.00621 0.042 0.04 -0.022 Risk diversification question 0.142*** 0.078** 0.06 0.135***
Note: OLS estimates with controls. ***P<0.01,**P<0.05, *P<0.1.
10
question estimates could prevent what would probably be a policy mistake, since people that
know relatively more about inflation do not perform better in retirement planning than the
others, holding everything else constant9. Unfortunately, many papers do not present
disaggregate questions coefficients.
Still, a line of reasoning could be that these question only capture a noisy signal from
an inherent non-observable stock of financial literacy and, thus, the analysis of individual
questions does not result in anything meaningful. However, the common measures we
presented before are not fit for these analyses. Although this path has been less frequent,
some studies have used factor analysis as way to group questions that are correlated, for
example, Lusardi & Mitchell (2007b) and van Rooij et al (2011)10. This is useful since it
avoids arbitrarily summing points and, at the same time, can indicate whether the answers
result from similar or different pieces of underlying knowledge. However, this approach
emphasizes commonality among variables, which could be a drawback if we are interested
in behavioral outcomes, because if all variables are highly correlated (which is good as far as
factor analysis is concerned), it could mean that other uncorrelated dimensions might add
discriminatory and explanatory power11. Behrman et al.(2012) made an interesting progress
on this issue, proposing a measure of financial knowledge based on a two-step procedure:
the first step generates weights that punish more intensely the individuals who get wrong
something that most of other get right, while the second uses principal components analysis
to take into account correlation between questions.
We propose that it is more useful to have a measurement of financial knowledge that
can combine different and potentially uncorrelated indicators of knowledge and weight them
according to their coefficients in equations that predict behavior.
9 In the case of all right criterions, one could argue that the different pieces of knowledge one matter in the
presence of one another. To pursue the testing of this hypothesis, one should compare the all right dummy
results with those single question dummies plus their interactions. 10 Huston, Finke & Smith (2012) use this approach to compute a financial sophistication proxy. 11 One alternative to address this issue in line with what we propose in this paper would be to use canonical
correlations to produce knowledge and attitude factors by maximizing correlation with behavior outcomes.
11

3 - Methodology
3.1- Model and Econometric Implementation
In order to illustrate our approach, consider again the second column of Table 1. We
argued that the sum of points through all three questions is not an adequate measure if we are
to design an intervention on financial knowledge. However, the estimation with separate
dummies suggests a natural indicator: give weights according to the estimated coefficients to
the variables that are significant, and exclude the variables that are not. Thus, we would
obtain a measure (𝐼𝑘) given by:
𝐼𝑘 = 0.173Dinterest + 0.142Ddiversification ,
where Dinterest assumes value one if the interest question is answered right, and Ddiversification is
the analogous variable for risk diversification.
What we do is to transfer this interpretation to a context with several policy objectives
instead of only one12. We depart from an unrestricted system with equations similar to those
used in the papers referred in Table 1. In system (1), there are 𝑚 equations, one for each of
the financial behavior goals, 𝑦𝑖. The regressors are a vector of ones, a matrix of demographic
controls (𝐷), a matrix of attitude variables (𝐴 ). In order to simplify the explanation of the
technique, we show the knowledge variables, 𝑘𝑗, directly. The disturbances are represented
by 𝜀𝑖:
𝑦1 = 𝐶0,1 + 𝐷𝛽𝐷,1 + [𝛽𝑘,1,1𝑘1 + 𝛽𝑘,1,2𝑘2 + 𝛽𝑘,1,3𝑘3 + ⋯ + 𝛽𝑘,1,𝐽𝑘𝐽] + 𝐴𝛽𝑎,1 + 𝜀1
𝑦2 = 𝐶0,2 + 𝐷𝛽𝐷,2 + [𝛽𝑘,2,1𝑘1 + 𝛽𝑘,2,2𝑘2 + 𝛽𝑘,2,3𝑘3 + ⋯ + 𝛽𝑘,2,𝐽𝑘𝐽] + 𝐴𝛽𝑎,2 + 𝜀2 ( 1 )
⋮
𝑦𝑚 = 𝐶0,𝑚 + 𝐷𝛽𝐷,𝑚 + [𝛽𝑘,𝑚,1𝑘1 + 𝛽𝑘,𝑚,2𝑘2 + 𝛽𝑘,𝑚,3𝑘3 + ⋯ + 𝛽𝑘,𝑚,𝐽𝑘𝐽] + 𝐴𝛽𝑎,𝑚 + 𝜀𝑚
12 In Garber and Koyama (2016), we show that the technique used in the present study can be viewed as a way
to simplify the policymakers’ decision making process by rendering the subjective weight attributed to different
financial inclusion policy goals irrelevant. As a result, all efforts can be directed to a simple cost-benefit analysis
of the different contents that could be a focus of financial literacy programs and interventions.
12
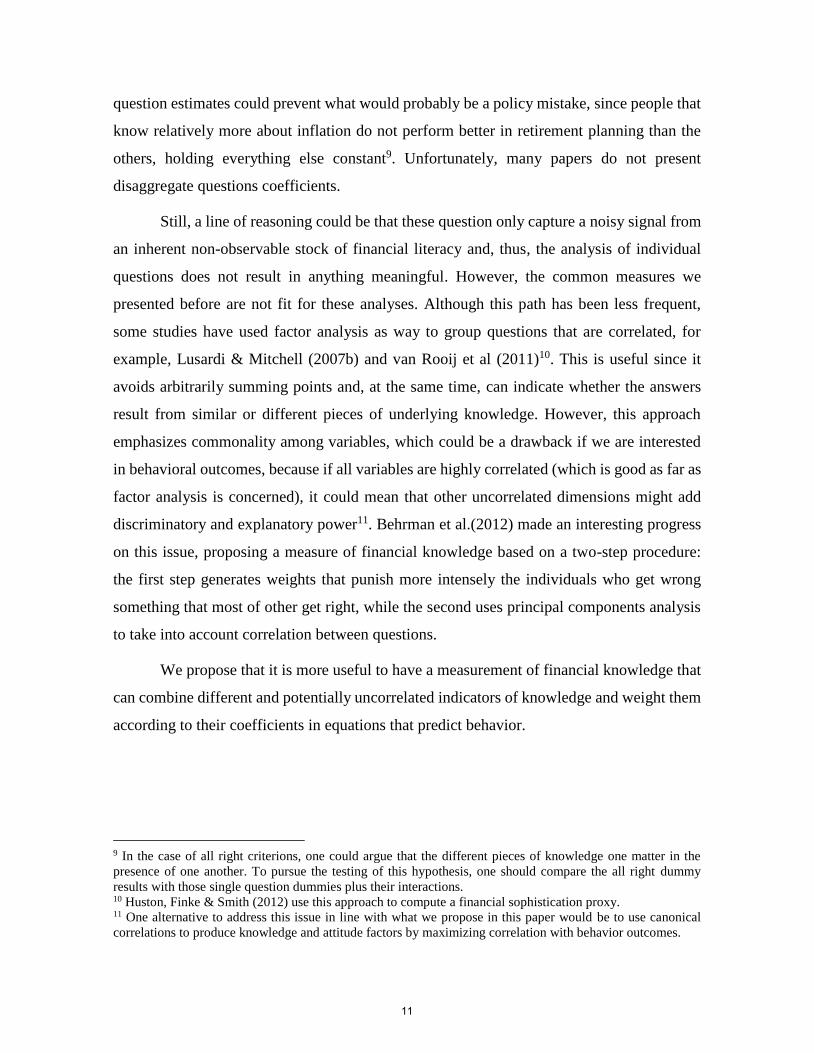
This would result in a different 𝐼𝑘 index for each outcome 𝑦𝑖. In order to obtain only
one weight for each of the variables considered, we need to impose restrictions on the
estimation. The ideal result would be a system like (2), in which we have, in the brackets, the
same linear combination of the knowledge variables in all equations, with an unrestricted
coefficient multiplying it in each one of them13. We call this linear combination a policy-
effective knowledge factor.
𝑦1 = 𝐶0,1 + 𝐷𝛽𝐷,1 + 𝑔1[𝑓1𝑘1 + 𝑓2𝑘2 + 𝑓3𝑘3 + ⋯ + 𝑓𝐽𝑘𝐽] + 𝐴𝛽𝑎,1 + 𝜀1
𝑦2 = 𝐶0,2 + 𝐷𝛽𝐷,2 + 𝑔2[𝑓1𝑘1 + 𝑓2𝑘2 + 𝑓3𝑘3 + ⋯ + 𝑓𝐽𝑘𝐽] + 𝐴𝛽𝑎,2 + 𝜀2 ( 2 )
⋮
𝑦𝑚 = 𝐶0,𝑚 + 𝐷𝛽𝐷,𝑚 + 𝑔𝑚[𝑓1𝑘1 + 𝑓2𝑘2 + 𝑓3𝑘3 + ⋯ + 𝑓𝐽𝑘𝐽] + 𝐴𝛽𝑎,𝑚 + 𝜀𝑚
The drawback of substituting (2) for (1) is that some of the many restrictions implied
by (2) might be rejected by the data. In order to test them explicitly, we use an iterative
procedure to specify the model that is as close as possible to (2), without the imposition of
restrictions that are rejected. We start by estimating a system including only controls and
search for the knowledge variables that would be significant in the largest possible set of
equations. Then we test if the coefficients of these variables are proportional along
equations14, which allow us to define a factor. The inclusion of other knowledge variables in
this factor is tested subsequently, until there are no variables left which could be included in
the factor and would have a significant coefficient if included in it. We allow the specification
of more than one factor and, after considering all the knowledge variables, we start the
process with attitude variables.
We estimate the system using nonlinear seemingly unrelated regressions (NLSUR),
with robust standard errors. The testing and imposition of restrictions in the estimation make
necessary the simultaneous estimation of the system, thus there is no reason not to explore
efficiency gains. Although we nest our approach in a linear probability model, a nonlinear
13 Identification requires fixing one of these coefficients.
14 i.e. 𝐻0: 𝛽𝑘,1,1/𝛽𝑘,2,1 = 𝛽𝑘,1,2/𝛽𝑘,2,2 , … , 𝛽𝑘,1,1/𝛽𝑘,𝑚,1 = 𝛽𝑘,1,2/𝛽𝑘,𝑚,2
13
estimator is necessary to obtain the factors, since there is coefficient multiplication. This
allows us to directly implement Wald restriction tests to verify if the coefficients of a
knowledge (or attitude) variable are proportional to the coefficients of another variable along
the equations of the system.
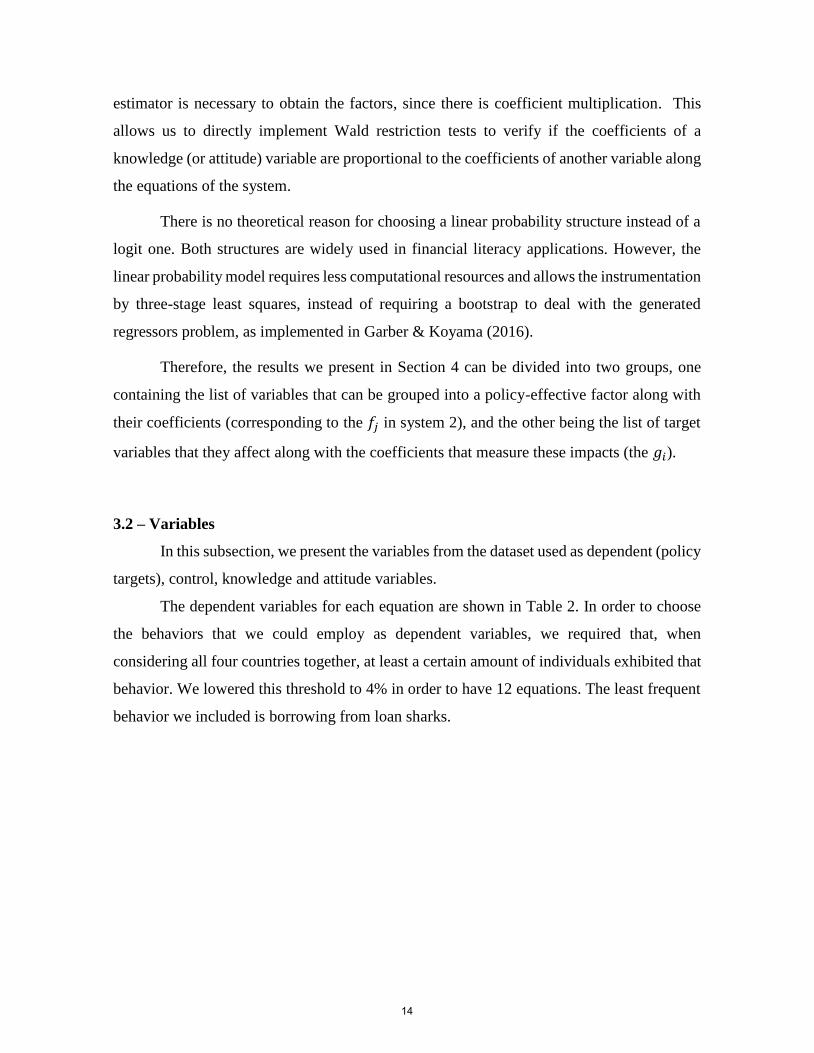
There is no theoretical reason for choosing a linear probability structure instead of a
logit one. Both structures are widely used in financial literacy applications. However, the
linear probability model requires less computational resources and allows the instrumentation
by three-stage least squares, instead of requiring a bootstrap to deal with the generated
regressors problem, as implemented in Garber & Koyama (2016).
Therefore, the results we present in Section 4 can be divided into two groups, one
containing the list of variables that can be grouped into a policy-effective factor along with
their coefficients (corresponding to the 𝑓𝑗 in system 2), and the other being the list of target
variables that they affect along with the coefficients that measure these impacts (the 𝑔𝑖).
3.2 – Variables
In this subsection, we present the variables from the dataset used as dependent (policy
targets), control, knowledge and attitude variables.
The dependent variables for each equation are shown in Table 2. In order to choose
the behaviors that we could employ as dependent variables, we required that, when
considering all four countries together, at least a certain amount of individuals exhibited that
behavior. We lowered this threshold to 4% in order to have 12 equations. The least frequent
behavior we included is borrowing from loan sharks.
14
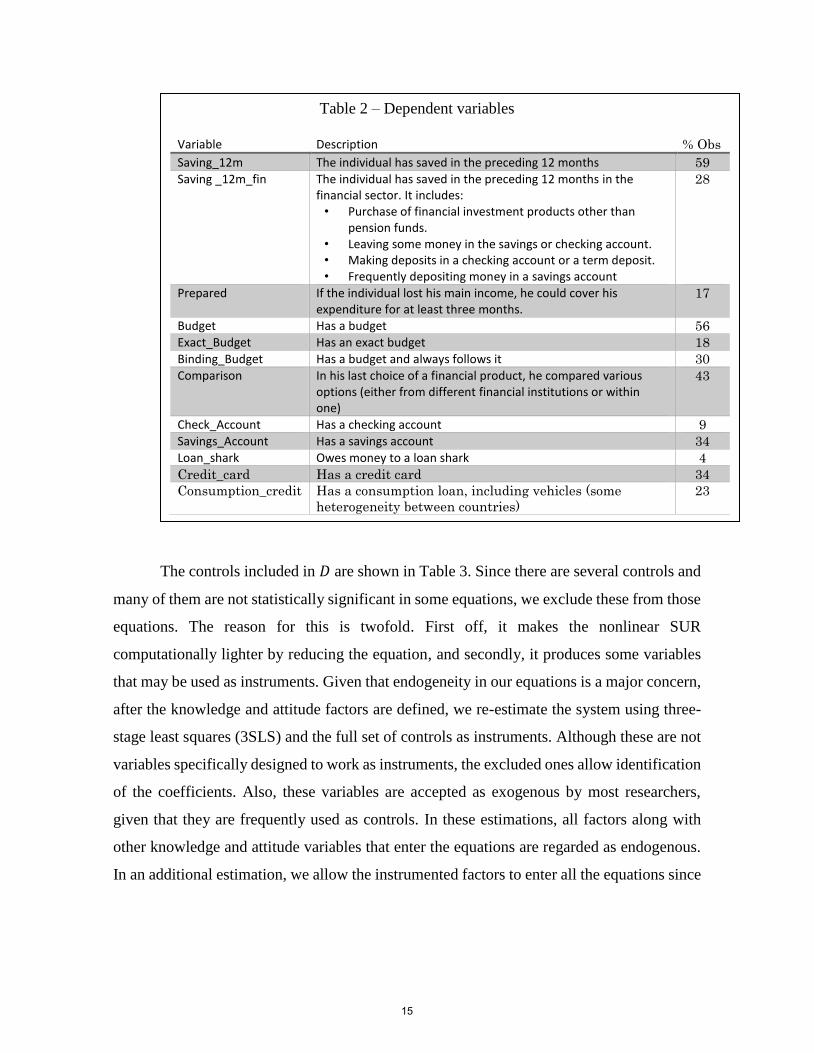
The controls included in 𝐷 are shown in Table 3. Since there are several controls and
many of them are not statistically significant in some equations, we exclude these from those
equations. The reason for this is twofold. First off, it makes the nonlinear SUR
computationally lighter by reducing the equation, and secondly, it produces some variables
that may be used as instruments. Given that endogeneity in our equations is a major concern,
after the knowledge and attitude factors are defined, we re-estimate the system using three-
stage least squares (3SLS) and the full set of controls as instruments. Although these are not
variables specifically designed to work as instruments, the excluded ones allow identification
of the coefficients. Also, these variables are accepted as exogenous by most researchers,
given that they are frequently used as controls. In these estimations, all factors along with
other knowledge and attitude variables that enter the equations are regarded as endogenous.
In an additional estimation, we allow the instrumented factors to enter all the equations since
Table 2 – Dependent variables
Variable Description % Obs
Saving_12m The individual has saved in the preceding 12 months 59
Saving _12m_fin The individual has saved in the preceding 12 months in the financial sector. It includes: • Purchase of financial investment products other than
pension funds. • Leaving some money in the savings or checking account. • Making deposits in a checking account or a term deposit. • Frequently depositing money in a savings account
28
Prepared If the individual lost his main income, he could cover his expenditure for at least three months.
17
Budget Has a budget 56
Exact_Budget Has an exact budget 18
Binding_Budget Has a budget and always follows it 30
Comparison In his last choice of a financial product, he compared various options (either from different financial institutions or within one)
43
Check_Account Has a checking account 9
Savings_Account Has a savings account 34
Loan_shark Owes money to a loan shark 4
Credit_card Has a credit card 34
Consumption_credit Has a consumption loan, including vehicles (some
heterogeneity between countries)
23
15
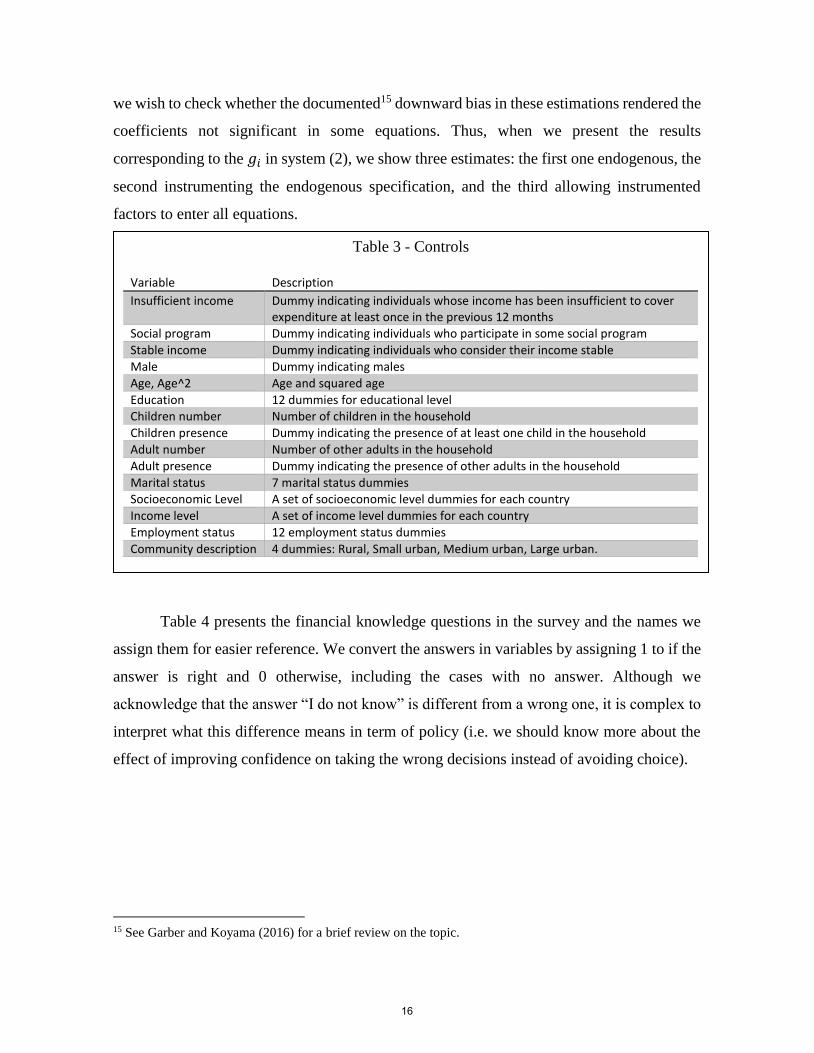
we wish to check whether the documented15 downward bias in these estimations rendered the
coefficients not significant in some equations. Thus, when we present the results
corresponding to the 𝑔𝑖 in system (2), we show three estimates: the first one endogenous, the
second instrumenting the endogenous specification, and the third allowing instrumented
factors to enter all equations.
Table 4 presents the financial knowledge questions in the survey and the names we
assign them for easier reference. We convert the answers in variables by assigning 1 to if the
answer is right and 0 otherwise, including the cases with no answer. Although we
acknowledge that the answer “I do not know” is different from a wrong one, it is complex to
interpret what this difference means in term of policy (i.e. we should know more about the
effect of improving confidence on taking the wrong decisions instead of avoiding choice).
15 See Garber and Koyama (2016) for a brief review on the topic.
Table 3 - Controls
Variable Description
Insufficient income Dummy indicating individuals whose income has been insufficient to cover expenditure at least once in the previous 12 months
Social program Dummy indicating individuals who participate in some social program
Stable income Dummy indicating individuals who consider their income stable
Male Dummy indicating males
Age, Age^2 Age and squared age
Education 12 dummies for educational level Children number Number of children in the household
Children presence Dummy indicating the presence of at least one child in the household
Adult number Number of other adults in the household
Adult presence Dummy indicating the presence of other adults in the household
Marital status 7 marital status dummies Socioeconomic Level A set of socioeconomic level dummies for each country
Income level A set of income level dummies for each country
Employment status 12 employment status dummies
Community description 4 dummies: Rural, Small urban, Medium urban, Large urban.
16
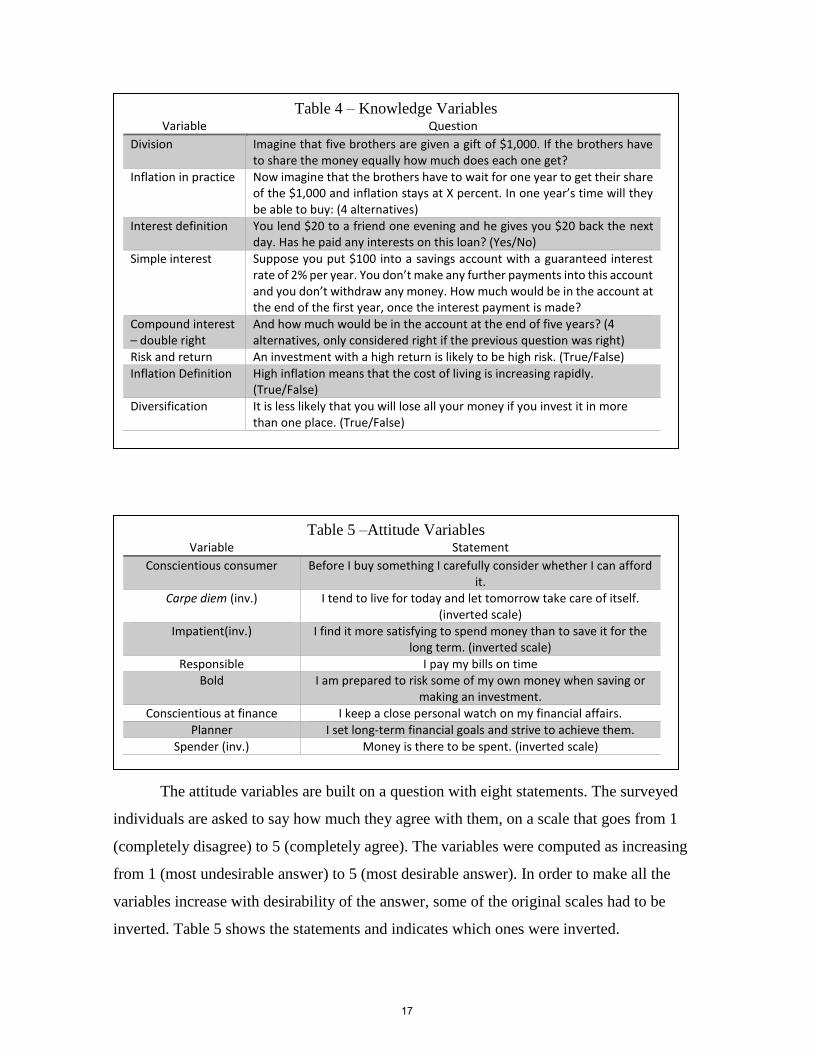
The attitude variables are built on a question with eight statements. The surveyed
individuals are asked to say how much they agree with them, on a scale that goes from 1
(completely disagree) to 5 (completely agree). The variables were computed as increasing
from 1 (most undesirable answer) to 5 (most desirable answer). In order to make all the
variables increase with desirability of the answer, some of the original scales had to be
inverted. Table 5 shows the statements and indicates which ones were inverted.
Table 4 – Knowledge Variables Variable Question
Division Imagine that five brothers are given a gift of $1,000. If the brothers have to share the money equally how much does each one get?
Inflation in practice Now imagine that the brothers have to wait for one year to get their share of the $1,000 and inflation stays at X percent. In one year’s time will they be able to buy: (4 alternatives)
Interest definition You lend $20 to a friend one evening and he gives you $20 back the next day. Has he paid any interests on this loan? (Yes/No)
Simple interest Suppose you put $100 into a savings account with a guaranteed interest rate of 2% per year. You don’t make any further payments into this account and you don’t withdraw any money. How much would be in the account at the end of the first year, once the interest payment is made?
Compound interest – double right
And how much would be in the account at the end of five years? (4 alternatives, only considered right if the previous question was right)
Risk and return An investment with a high return is likely to be high risk. (True/False)
Inflation Definition High inflation means that the cost of living is increasing rapidly. (True/False)
Diversification It is less likely that you will lose all your money if you invest it in more than one place. (True/False)
Table 5 –Attitude Variables Variable Statement
Conscientious consumer Before I buy something I carefully consider whether I can afford it.
Carpe diem (inv.) I tend to live for today and let tomorrow take care of itself. (inverted scale)
Impatient(inv.) I find it more satisfying to spend money than to save it for the long term. (inverted scale)
Responsible I pay my bills on time Bold I am prepared to risk some of my own money when saving or
making an investment.
Conscientious at finance I keep a close personal watch on my financial affairs.
Planner I set long-term financial goals and strive to achieve them.
Spender (inv.) Money is there to be spent. (inverted scale)
17
4 - Results
In this section we present the results of the country level factor specification and
estimation. The weights of the variables included in each factor should be understood as
relative weights, since their levels depend on the equation that is chosen to fix the factor
coefficient as a unit, for normalization and identification. After the estimation, all factors
were standardized to be representable in a scale ranging from 0 to 100. For this
standardization the theoretical (not necessarily equal to the observed) minimum and
maximum values of the factors were used to center a rescale values.
As we show below, in two countries (Peru and Bolivia) the methodology combined
variables into factors that seem to capture most of the impact of financial knowledge and
especially of financial attitudes on financial behaviors. In Ecuador and Colombia, only a
factor of attitudes combining two variables was found and it was significant in a smaller
number of equations. This does not invalidate the analysis, since it reflects characteristics of
the different populations. It indicates, however, that policymakers in these countries will not
have available a single factor which affects several behavior variables simultaneously, as far
as our technique is concerned. Thus, these policymakers face the problem of defining which
financial behavior variables are the most important ones when they design interventions.
For all the countries, we analyze how the factors found vary along observable
characteristics. However, we should point out that for Ecuador and Colombia this analysis is
less important, since most of the information about attitudes could not be incorporated into
them. In the conclusion of this section, we comment on regular patterns found among
countries.
18
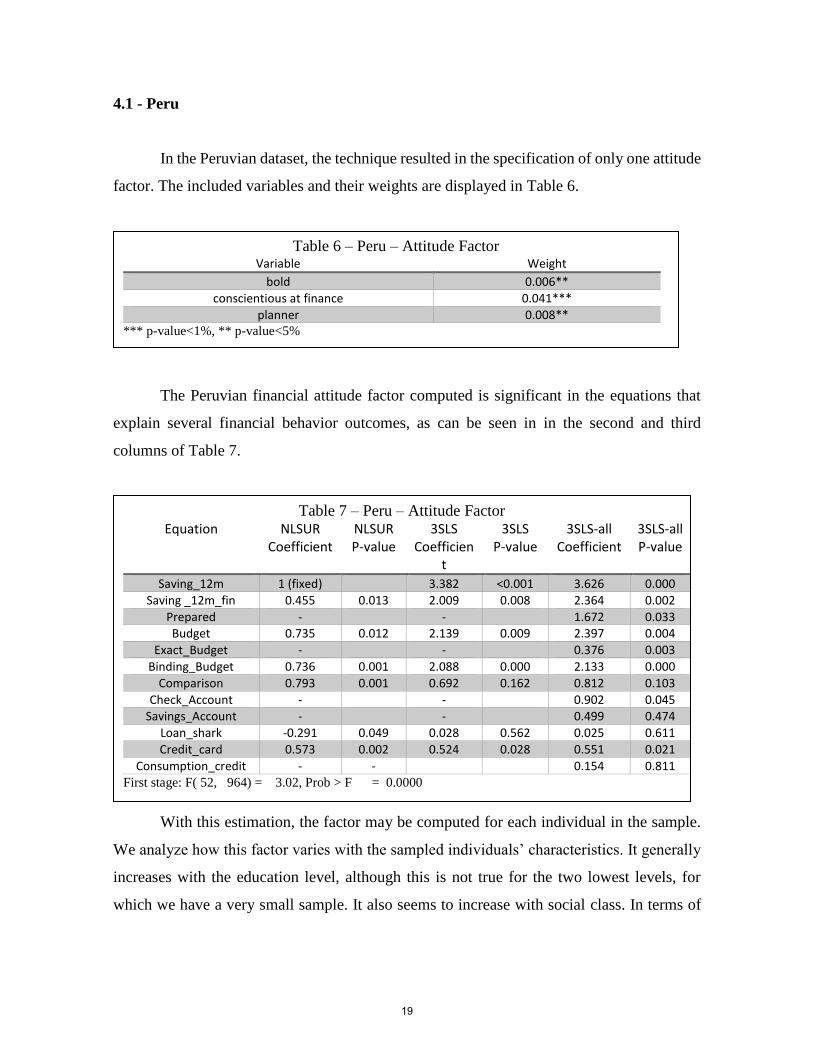
4.1 - Peru
In the Peruvian dataset, the technique resulted in the specification of only one attitude
factor. The included variables and their weights are displayed in Table 6.
The Peruvian financial attitude factor computed is significant in the equations that
explain several financial behavior outcomes, as can be seen in in the second and third
columns of Table 7.
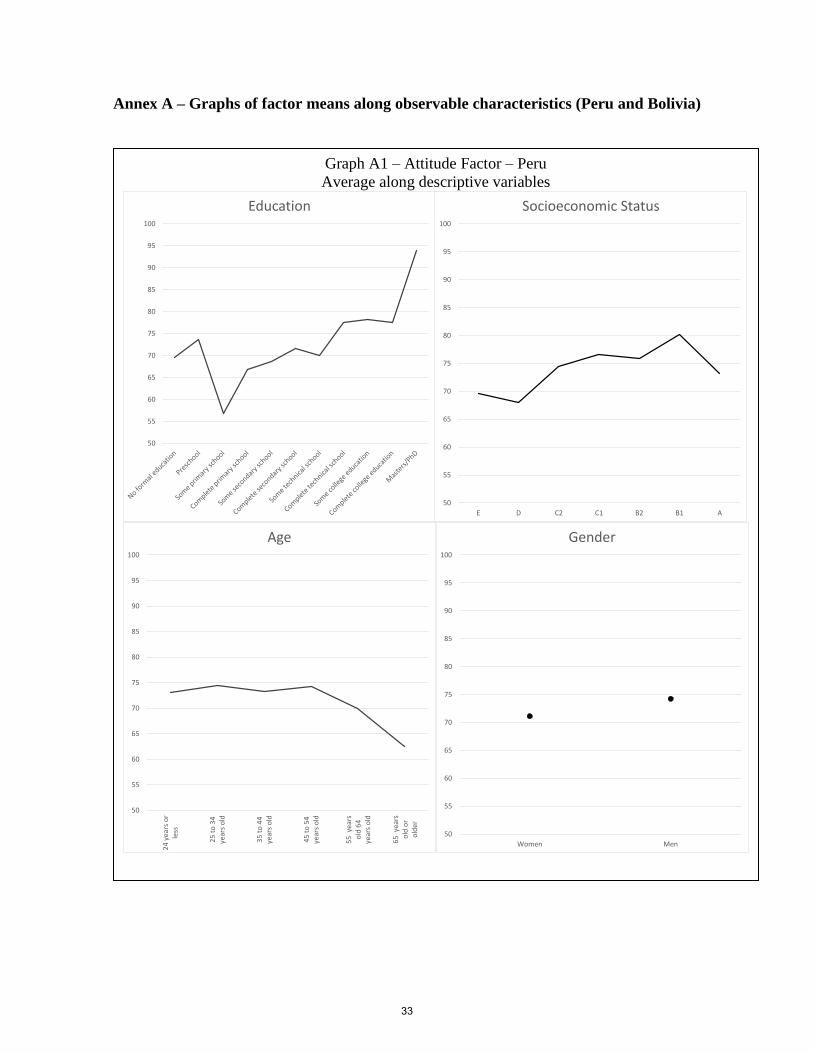
With this estimation, the factor may be computed for each individual in the sample.
We analyze how this factor varies with the sampled individuals’ characteristics. It generally
increases with the education level, although this is not true for the two lowest levels, for
which we have a very small sample. It also seems to increase with social class. In terms of
Table 6 – Peru – Attitude Factor Variable Weight
bold 0.006**
conscientious at finance 0.041***
planner 0.008** *** p-value<1%, ** p-value<5%
Table 7 – Peru – Attitude Factor Equation NLSUR
Coefficient NLSUR P-value
3SLS Coefficien
t
3SLS P-value
3SLS-all Coefficient
3SLS-all P-value
Saving_12m 1 (fixed) 3.382 <0.001 3.626 0.000
Saving _12m_fin 0.455 0.013 2.009 0.008 2.364 0.002
Prepared - - 1.672 0.033 Budget 0.735 0.012 2.139 0.009 2.397 0.004
Exact_Budget - - 0.376 0.003
Binding_Budget 0.736 0.001 2.088 0.000 2.133 0.000
Comparison 0.793 0.001 0.692 0.162 0.812 0.103
Check_Account - - 0.902 0.045 Savings_Account - - 0.499 0.474
Loan_shark -0.291 0.049 0.028 0.562 0.025 0.611
Credit_card 0.573 0.002 0.524 0.028 0.551 0.021
Consumption_credit - - 0.154 0.811 First stage: F( 52, 964) = 3.02, Prob > F = 0.0000
19
gender, the factor is on average higher for males. Finally, the factor exhibits a mild usual
inverted U-shape along age. These features may be inspected in Graph A1 in Annex A.
Going back to Table 7, in the fourth and fifth columns we display the results of the
three stages least squares estimation. Some interesting features arise. As expected, the
comparison of columns one and three indicated downward bias estimation for most of the
coefficients. Unfortunately, the three-stage least squares estimation loses precision in the
coefficient of the loan sharks equation and on the comparison equations, rendering the
coefficient not significant. Analyzing the last two columns, which consider the inclusion of
the instrumented factor in all equations, it seems that this downward bias resulted in the
exclusion of the attitude factor from some equations in the NLSUR specification: the
instrumented regression indicates a positive and significant coefficient in three extra
equations.
In Table 8, we show the p-value of the coefficients of knowledge and attitude
variables that do not belong in factors, but are significant at the 10% level in some equations.
None of them seems to affect many variables, except for simple interest. Taking as a
reference the 3SLS estimation with the inclusion of the instrumented factor in all equations,
the attitude factor found is significant in eight equations, thus affecting most of the financial
behavior variables. This makes the attitudes pertinent to the questions in Table 6 particularly
interesting for interventions. Furthermore, although the costs of addressing these topics
should be assessed, in terms of the benefits, the improvement of being conscientious at
finance stands out from the other two attitudes in the factor: the coefficient is more than five
times as large as those of the other variables.
20

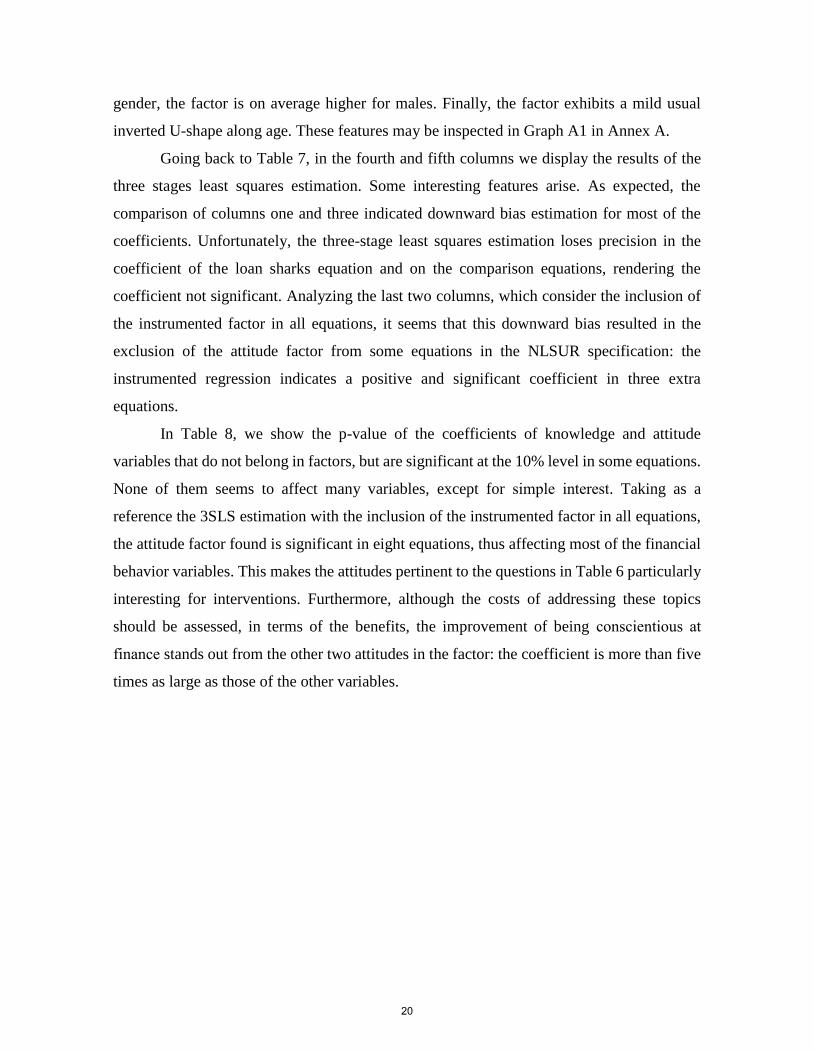
4.2 - Bolivia
In the Bolivian dataset, it was not possible to estimate the equation for personal credit.
Two factors were found, one for knowledge and another for attitudes. The variables included
in the knowledge factor and their weights are displayed in Table 9.
Table 8 – Peru – P-values of knowledge and attitude variables not included in factors
Savi
ng_
12
m
Savi
ng
_12
m_f
in
Pre
par
ed
Bu
dge
t
Exac
t_B
ud
get
Bin
din
g_B
ud
get
Co
mp
aris
on
Ch
eck_
Acc
ou
nt
Savi
ngs
_Acc
ou
nt
Loan
_sh
ark
Cre
dit
_ca
rd
Co
nsu
mp
tio
n_c
red
it
1 2 3 4 5 6 7 8 9 10 11 12
Division 0.041 0
Inflation in practice
0.051 0.01
Interest definition
0.092
Simple interest 0.018 0.001 0.061 0.017
Compound interest – double right
0.031 0.004
Risk and return 0.016
Inflation Definition
0.033
Diversification 0.019
Conscientious consumer
0.089
Carpe diem (inv.)
0.048 0.061
Impatient(inv.) 0.002
Responsible
Bold
Conscientious at finance
Planner
Spender (inv.) 0.024 0.044 0.049
Shaded variables enter the factor
21
Variables compound interest (double right) and inflation definition have a higher
estimated weight and are more statistically significant than the others. The estimated
knowledge factor coefficients in the behavior equations are shown in the second and third
columns of Table 10.
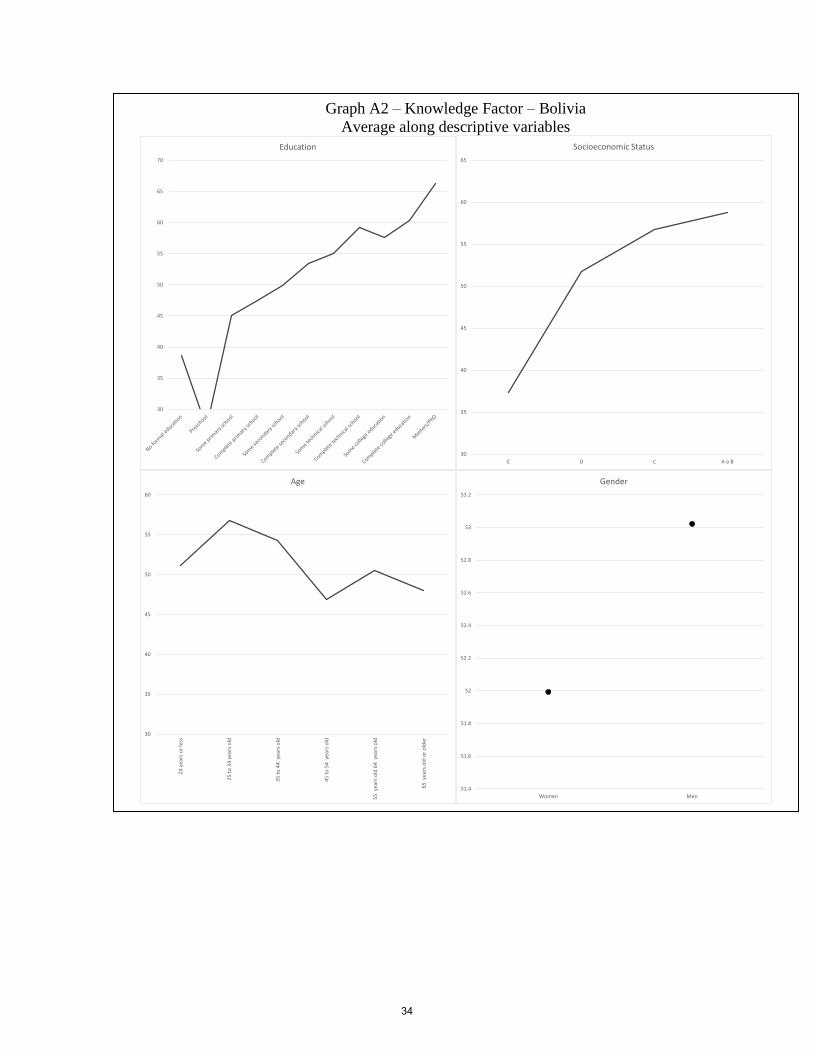
The Bolivian financial knowledge factor increases with social class and formal
education (except at the lowest level). It is slightly higher for men than women. In terms of
age, the factor displays a weak inverted U-shape, peaking at the 25-34 age group. These
features may be further explored in Graph A2 in Annex A.
Still in Table 10, the fourth and fifth columns show the instrumented version of the
system. Although the knowledge factor ceases being significant in two equations, in all of
the others it shows the underestimation bias of the endogenous version. The exercise of
Table 9 – Bolivia – Knowledge Factor Variable Weight
Division 0.029*
Compound interest – double right 0.057**
Risk and return 0.027*
Inflation definition 0.042** *** p-value<1%,** p-value<5%,* p-value<10%
Table 10 – Bolivia – Knowledge Factor Equation NLSUR
Coeff. NLSUR P-
value 3SLS
Coeff. 3SLS
P-value 3SLS-all Coeff.
3SLS-all P-value
Saving_12m 0.989 0.035 2.959 0.054 3.393 0.028 Saving _12m_fin 1 (fixed) 1.641 0.472 2.562 0.270
Prepared - - 2.736 0.065
Budget 2.881 0.021 3.071 0.049 3.341 0.033
Exact_Budget 1.680 0.027 2.551 0.052 2.423 0.066
Binding_Budget 1.766 0.029 2.626 0.095 2.788 0.077
Comparison - - 2.712 0.182 Check_Account - - 1.656 0.201
Savings_Account 0.726 0.059 -0.866 0.696 0.035 0.988
Loan_shark - - 0.199 0.623
Credit_card - - 1.798 0.272 First Stage:F( 49, 1056) = 4.05, Prob > F = 0.0000
22
including the instrumented factor in all the equations (sixth and seventh columns of Table 7)
largely confirms the original specification, although the results indicate that the elimination
of the downward bias results in the factor becoming significant in the equation of
preparedness for negative shocks.
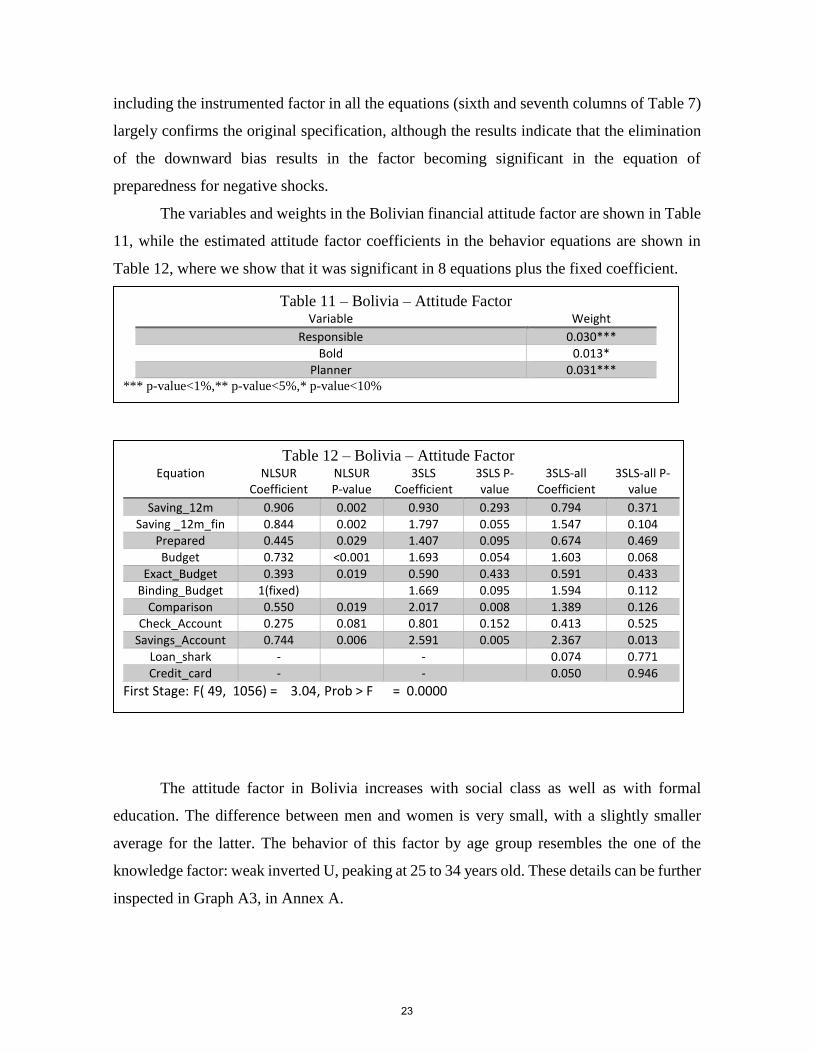
The variables and weights in the Bolivian financial attitude factor are shown in Table
11, while the estimated attitude factor coefficients in the behavior equations are shown in
Table 12, where we show that it was significant in 8 equations plus the fixed coefficient.
The attitude factor in Bolivia increases with social class as well as with formal
education. The difference between men and women is very small, with a slightly smaller
average for the latter. The behavior of this factor by age group resembles the one of the
knowledge factor: weak inverted U, peaking at 25 to 34 years old. These details can be further
inspected in Graph A3, in Annex A.
Table 11 – Bolivia – Attitude Factor Variable Weight
Responsible 0.030***
Bold 0.013*
Planner 0.031*** *** p-value<1%,** p-value<5%,* p-value<10%
Table 12 – Bolivia – Attitude Factor Equation NLSUR
Coefficient NLSUR P-value
3SLS Coefficient
3SLS P-value
3SLS-all Coefficient
3SLS-all P-value
Saving_12m 0.906 0.002 0.930 0.293 0.794 0.371
Saving _12m_fin 0.844 0.002 1.797 0.055 1.547 0.104 Prepared 0.445 0.029 1.407 0.095 0.674 0.469
Budget 0.732 <0.001 1.693 0.054 1.603 0.068
Exact_Budget 0.393 0.019 0.590 0.433 0.591 0.433
Binding_Budget 1(fixed) 1.669 0.095 1.594 0.112
Comparison 0.550 0.019 2.017 0.008 1.389 0.126 Check_Account 0.275 0.081 0.801 0.152 0.413 0.525
Savings_Account 0.744 0.006 2.591 0.005 2.367 0.013
Loan_shark - - 0.074 0.771
Credit_card - - 0.050 0.946
First Stage: F( 49, 1056) = 3.04, Prob > F = 0.0000
23
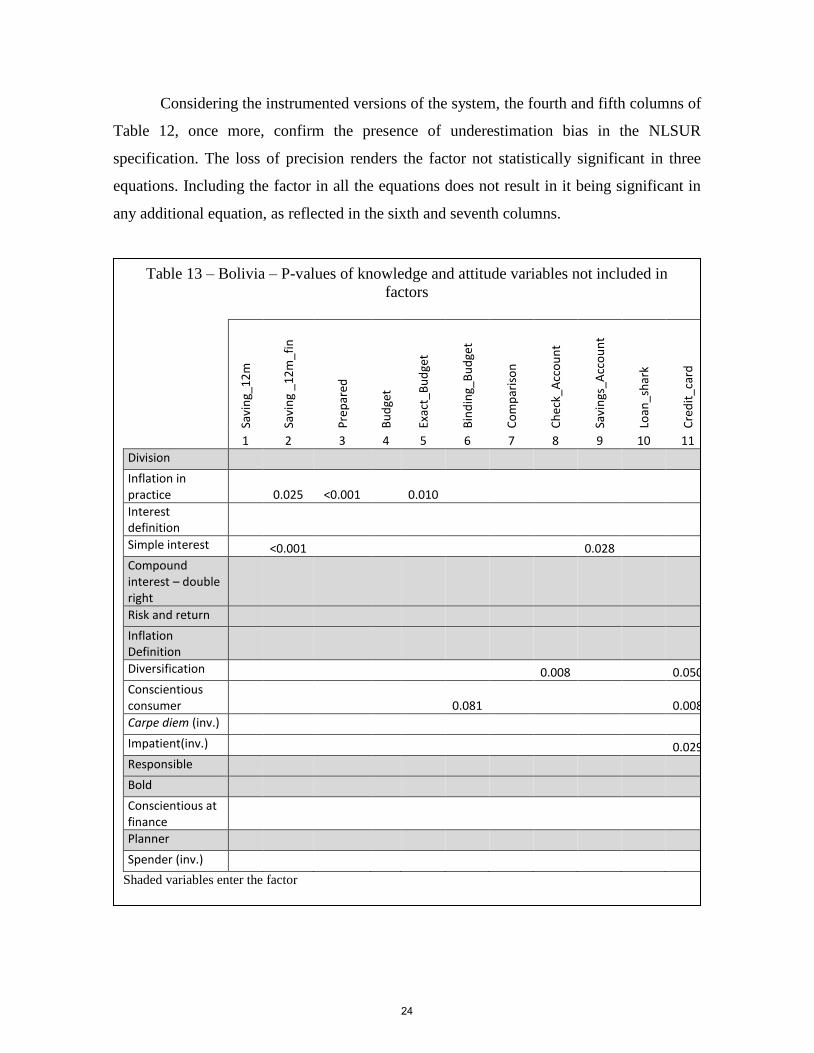
Considering the instrumented versions of the system, the fourth and fifth columns of
Table 12, once more, confirm the presence of underestimation bias in the NLSUR
specification. The loss of precision renders the factor not statistically significant in three
equations. Including the factor in all the equations does not result in it being significant in
any additional equation, as reflected in the sixth and seventh columns.
Table 13 – Bolivia – P-values of knowledge and attitude variables not included in
factors
Savi
ng_
12
m
Savi
ng
_12
m_f
in
Pre
par
ed
Bu
dge
t
Exac
t_B
ud
get
Bin
din
g_B
ud
get
Co
mp
aris
on
Ch
eck_
Acc
ou
nt
Savi
ngs
_Acc
ou
nt
Loan
_sh
ark
Cre
dit
_ca
rd
1 2 3 4 5 6 7 8 9 10 11
Division
Inflation in practice 0.025 <0.001 0.010 Interest definition Simple interest
<0.001 0.028 Compound interest – double right Risk and return
Inflation Definition Diversification
0.008 0.050
Conscientious consumer 0.081 0.008
Carpe diem (inv.)
Impatient(inv.) 0.029
Responsible
Bold
Conscientious at finance Planner
Spender (inv.)
Shaded variables enter the factor
24

In Table 13, we show the of coefficient p-values of knowledge and attitude variables
that do not belong in the factors, but are significant at the 10% level in some equations. The
association appears to be scattered. This indicates that most of the effect of financial
knowledge and attitude variables on financial behavior variables is captured by the factors.
In the knowledge factor, the compound interest question is the one with the highest point
estimate, followed by the understanding of inflation as changing prices. The attitude factor
indicates that increasing the self-assessment of paying bills on time and of setting long-term
goals show an advantage in term of policy benefits over promoting the attitude of being
prepared to take risks in investments.
4.3 - Ecuador
In the Ecuadorian dataset only an attitude factor with two variables was found.
These variables can be seen in Table 14.
In the second and third columns of Table 15, we show in which equations the factor
was significant along with the coefficients of the endogenous version.
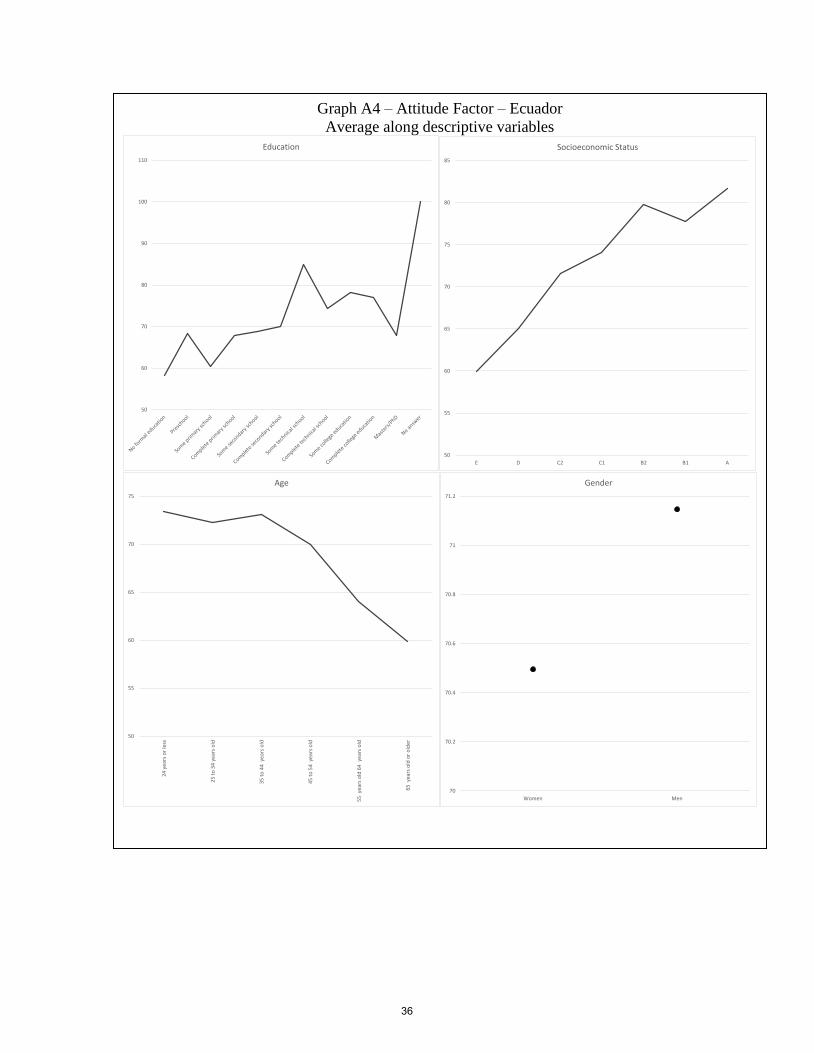
The attitude factor in Ecuador tends to increase with social class for almost all classes,
but its increase with formal education is questionable. With regard to age, the factor decreases
from 44 years old onwards. The difference between genders is very small, with men slightly
ahead. These outcomes may be analyzed in Graph A4, in Annex A.
Table 14 – Ecuador – Attitude Factor
Variable Weight
Responsible 0.019***
Planner 0.054*** *** p-value<1%,** p-value<5%,* p-value<10%
25

The instrumented versions of the system are more imprecise (columns three through
six of Table 15). This is likely to result from correlations between the instruments and the
factor. Only in two equations do they retain significance. In these, the coefficient, once more,
indicates underestimation bias in the NLSUR specification. The exercise of including the
instrumented factor in all equations does not result in significance in any additional equation.
Table 15 – Ecuador – Attitude Factor Equation NLSUR
Coefficient NLSUR P-value
3SLS Coefficient
3SLS P-value
3SLS-all Coefficient
3SLS-all P-value
Ahorro_12m 1(fixed) -0.638 0.529 -0.584 0.565 Ahorro_12m_fin 0.912 <0.001 0.861 0.437 1.010 0.364
Preparado - - -0.148 0.775 T_presup 0.666 0.004 0.317 0.673 0.266 0.730
T_presup_e - - -0.185 0.716 T_presup_s 0.547 0.006 -0.262 0.658 -0.335 0.585
El_comp 1.119 <0.001 1.573 0.002 1.686 0.001 T_ccorriente - - 0.404 0.250
T_cahorro 0.442 0.045 0.987 0.240 1.078 0.202 T_prestamistas 0.161 0.047 0.634 0.031 0.621 0.035
T_tarjcred - - 0.565 0.19 T_credcons - - 0.177 0.651
First stage: F( 52, 1118) = 3.44, Prob > F = 0.0000
26

In Table 16, we show the attitude and knowledge variables that were significant even
though they did not participate in a factor. Several variables are correlated with the behavior
variables, but as their coefficients are not “proportional” along the equations, most of them
cannot be included in factors, making the policy design more complex.
Table 16 – Ecuador – P-values of knowledge and attitude variables not included in factors
Savi
ng_
12
m
Savi
ng
_12
m_f
in
Pre
par
ed
Bu
dge
t
Exac
t_B
ud
get
Bin
din
g_B
ud
get
Co
mp
aris
on
Ch
eck_
Acc
ou
nt
Savi
ngs
_Acc
ou
nt
Loan
_sh
ark
Cre
dit
_ca
rd
Co
nsu
mp
tio
n_c
red
it
1 2 3 4 5 6 7 8 9 10 11 12
Division 0.097 0.043 0.035 0.056 0.024 0.005 0.097
Inflation in practice <0.001 <0.001 0.023 0.000
Interest definition 0.039 0.007 0.039
Simple interest 0.031 0.026 <0.001 0.031
Compound interest – double right 0.057 0.026
Risk and return 0.072 0.094 0.016
Inflation Definition <0.001 0.023 0.056 <0.001
Diversification 0.019 0.098
Conscientious consumer 0.009 0.077
Carpe diem (inv.) 0.013
Impatient(inv.) 0.077 0.001 0.089 0.024
Responsible
Bold 0.083 0.056 0.083
Conscientious at finance <0.001 0.052 0.061
Planner
Spender (inv.) 0.003 0.009 0.031 0.094 0.032 0.003 Shaded variables enter the factor
27

4.4 - Colombia
In the Colombian dataset only an attitude factor with two variables was
found. These variables are presented in Table 17.
In Table 18, we show in which equations the factor was significant along with its
coefficients.
The attitude factor in Colombia increases with social class for almost all classes, but
its increase with formal education appears weak. It terms of age, the factor decreases from
44 years old onwards. The difference between genders places women ahead of men, on
average. This features may be inspected in Graph A5, in Annex A.
Table 17 – Colombia – Attitude Factor
Variable Weight
Impatient(inv.) 0.030*** Conscientious at finance 0.010**
*** p-value<1%, ** p-value<5%,* p-value<10%
Table 18 – Colombia – Attitude Factor Equation NLSUR
Coefficient NLSUR P-value
3SLS Coefficient
3SLS P-value
3SLS-all Coefficient
3SLS-all P-value
Saving_12m 1(fixed) 2.048324 0.126 2.278 0.092 Saving _12m_fin 0.476 0.049 1.035 0.480 1.520 0.321
Prepared - - 0.974 0.424 Budget 0.533 0.073 -0.225 0.864 1.53 0.311
Exact_Budget - - 0.356 0.796 Binding_Budget - - 3.821 0.013
Comparison - - -0.816 0.518 Check_Account - - 1.692 0.058
Savings_Account - - 1.472 0.355 Loan_shark - - -0.285 0.724 Credit_card - - 1.147 0.323
Consumption_credit -0.371 0.087
-0.084 0.907 0.045 0.950
First Stage: F( 52, 1145) = 1.55, Prob > F = 0.0083
28

The instrumented estimation of the system, shown in columns three and four render
the coefficients not significant in all equations. The inclusion of the factor in all equations,
displayed in the last two columns of Table 18 results in three significant coefficients at the
10% level. Two of them do not belong in the NLSUR specification, indicating some presence
of downward bias in it.
Table 19 – Colombia – P-values of knowledge and attitude variables not included in factors
Savi
ng_
12
m
Savi
ng
_12
m_f
in
Pre
par
ed
Bu
dge
t
Exac
t_B
ud
get
Bin
din
g_B
ud
get
Co
mp
aris
on
Ch
eck_
Acc
ou
nt
Savi
ngs
_Acc
ou
nt
Loan
_sh
ark
Cre
dit
_ca
rd
Co
nsu
mp
tio
n_c
red
it
1 2 3 4 5 6 7 8 9 10 11 12
Division 0.003 0.007 0.047 0.005
Inflation in practice 0.041 0.035
Interest definition
Simple interest 0.023
Compound interest – double right 0.016 0.039 0.016
Risk and return 0.066
Inflation Definition 0.041 0.081
Diversification
Conscientious consumer 0.000 0.005 0.001
Carpe diem (inv.)
Impatient(inv.)
Responsible 0.028 0.037
Bold 0.017
Conscientious at finance
Planner <0.001 0.035 0.066 0.001 0.000
Spender (inv.) 0.028 0.051
Shaded variables enter the factor
29

In Table 19, we show the attitude and knowledge variables that were significant even
though they did not participate in a factor. As in the Ecuadorian case, many variables are
correlated with financial behavior and most of them cannot be included in the factors, making
the policy design more complex.
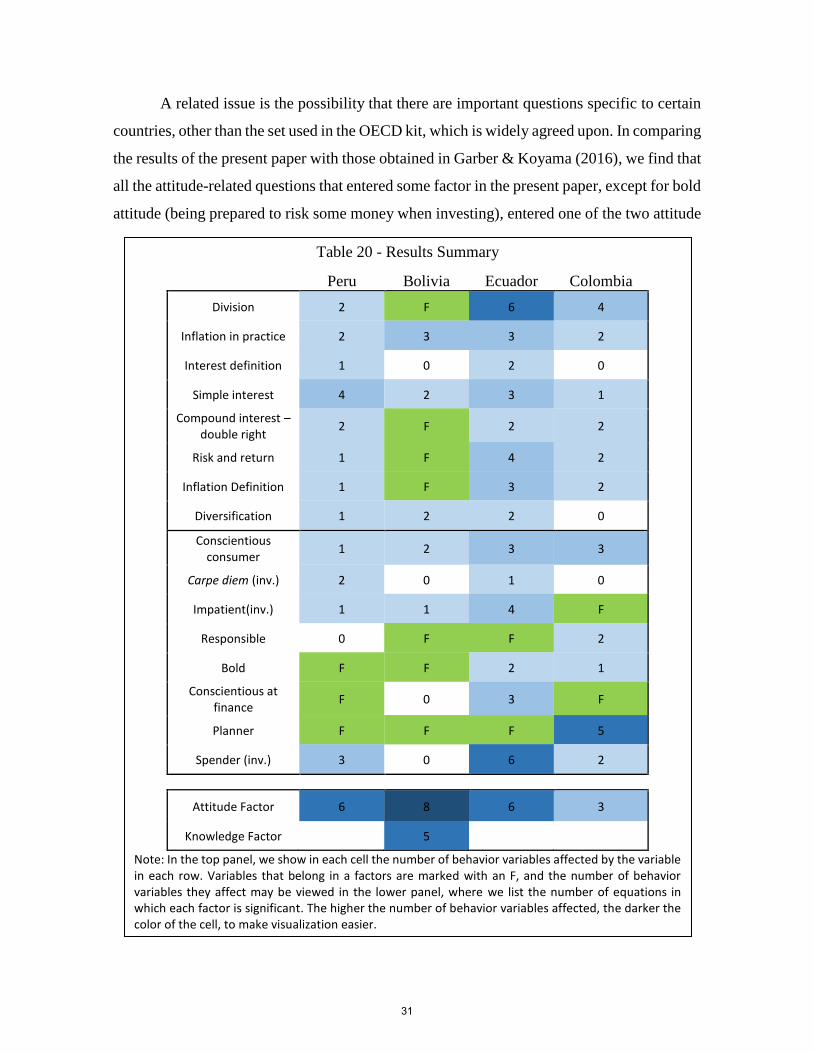
4.5 – Cross-country comparisons
Although in this paper we focus on policy design and, thus, advocate the need of
addressing the relationship between financial literacy and behavior variables separately for
each country, it is interesting to notice some regularity of the results. In Table 20 we
summarize the results of the NLSUR estimations and we may grasp easily how many
objective variables are explained by each of the regressors of interest.
In analyzing Table 20, we find being a planner (setting long-term financial goals and
striving to get them) is important in all countries. This variable belongs in a factor in three of
them and is significant by itself in five equations in the remaining one.
Some variables, on the other hand, seem to perform poorly, since they are correlated
with very few dependent variables in all countries. This is the case of the carpe diem attitude
(statement: “I tend to live for today and let tomorrow take care of itself”) and the
understanding of the definition of interest. Of course, it is possible that these questions are
relevant for dimensions of financial behavior that could not be used in estimations, due to a
very low number of users, or even for behaviors not assessed by the survey.
30
A related issue is the possibility that there are important questions specific to certain
countries, other than the set used in the OECD kit, which is widely agreed upon. In comparing
the results of the present paper with those obtained in Garber & Koyama (2016), we find that
all the attitude-related questions that entered some factor in the present paper, except for bold
attitude (being prepared to risk some money when investing), entered one of the two attitude
Table 20 - Results Summary
Peru Bolivia Ecuador Colombia
Division 2 F 6 4
Inflation in practice 2 3 3 2
Interest definition 1 0 2 0
Simple interest 4 2 3 1
Compound interest – double right
2 F 2 2
Risk and return 1 F 4 2
Inflation Definition 1 F 3 2
Diversification 1 2 2 0
Conscientious consumer
1 2 3 3
Carpe diem (inv.) 2 0 1 0
Impatient(inv.) 1 1 4 F
Responsible 0 F F 2
Bold F F 2 1
Conscientious at finance
F 0 3 F
Planner F F F 5
Spender (inv.) 3 0 6 2
Attitude Factor 6 8 6 3
Knowledge Factor 5
Note: In the top panel, we show in each cell the number of behavior variables affected by the variable in each row. Variables that belong in a factors are marked with an F, and the number of behavior variables they affect may be viewed in the lower panel, where we list the number of equations in which each factor is significant. The higher the number of behavior variables affected, the darker the color of the cell, to make visualization easier.
31
factors defined there. At the same time, some additional questions, not present in the CAF or
OECD survey were important too, including one about the habit of buying products in
installments, a common practice in Brazil. We list the questions that were important in Brazil
and the information about their presence in CAF and OECD survey in Annex B.
5 - Conclusion
In this paper we implement for four Latin American countries a technique developed
in Garber and Koyama (2016) to obtain financial knowledge and financial attitude measures
that are meaningful in terms of policy objectives. In each country, the technique utilized
resulted in the construction of at least one factor, and the possibility of employing controls
that were significant in the equations as instruments was confirmed.
An interesting regularity is that the “weights” of the variables inside those factors are
very heterogeneous among variables. This fact, combined with the notion that several
knowledge and attitude variables fail to explain financial behavior, indicates that measures
that sum “points” on survey questions could convey misleading measures for the design of
programs aimed at enhancing financial literacy. Of course, this argument is only valid if the
behavioral outcomes that we employed as targets are the ones that matter as policy goals.
The fact that they were included as questions in such a careful survey appears to indicate that
this is true.
In terms of the performance of specific variables, the attitude of being a planner stands
out, affecting several outcomes in all the countries analyzed.
Finally, the fact that the set of knowledge and attitude variables that affect financial
behaviors varies from one country to another indicates that there may be questions not
included in the survey that are relevant, even if that is only at the national level. This point is
reinforced by Garber and Koyama (2016), who use the Brazilian dataset, which includes
additional variables that reflect local practices.
32
Annex A – Graphs of factor means along observable characteristics (Peru and Bolivia)
Graph A1 – Attitude Factor – Peru
Average along descriptive variables
50
55
60
65
70
75
80
85
90
95
100
Education
50
55
60
65
70
75
80
85
90
95
100
E D C2 C1 B2 B1 A
Socioeconomic Status
50
55
60
65
70
75
80
85
90
95
100
24
yea
rs o
rle
ss
25
to
34
year
s o
ld
35
to
44
year
s o
ld
45
to
54
year
s o
ld
55
yea
rso
ld 6
4ye
ars
old
65
yea
rso
ld o
ro
lder
Age
50
55
60
65
70
75
80
85
90
95
100
Women Men
Gender
33
Graph A2 – Knowledge Factor – Bolivia
Average along descriptive variables
30
35
40
45
50
55
60
65
70
Education
30
35
40
45
50
55
60
65
E D C A o B
Socioeconomic Status
30
35
40
45
50
55
60
24
yea
rs o
r le
ss
25
to
34
yea
rs o
ld
35
to
44
ye
ars
old
45
to
54
ye
ars
old
55
yea
rs o
ld 6
4 y
ears
old
65
yea
rs o
ld o
r o
lder
Age
51.4
51.6
51.8
52
52.2
52.4
52.6
52.8
53
53.2
Women Men
Gender
34

Graph A3 – Attitude Factor – Bolivia
Average along descriptive variables
30
40
50
60
70
80
90
Education
55
60
65
70
75
80
1 2 3 4
Socioeconomic Status
68
69
70
71
72
73
74
75
76
24
yea
rs o
r le
ss
25
to
34
yea
rs o
ld
35
to
44
ye
ars
old
45
to
54
ye
ars
old
55
yea
rs o
ld 6
4 y
ears
old
65
yea
rs o
ld o
r o
lder
Age
73.2
73.25
73.3
73.35
73.4
73.45
73.5
Women Men
Gender
35
Graph A4 – Attitude Factor – Ecuador
Average along descriptive variables
50
60
70
80
90
100
110
Education
50
55
60
65
70
75
80
85
E D C2 C1 B2 B1 A
Socioeconomic Status
50
55
60
65
70
75
24
yea
rs o
r le
ss
25
to
34
yea
rs o
ld
35
to
44
ye
ars
old
45
to
54
ye
ars
old
55
yea
rs o
ld 6
4 y
ears
old
65
yea
rs o
ld o
r o
lder
Age
70
70.2
70.4
70.6
70.8
71
71.2
Women Men
Gender
36

Graph A5 – Attitude Factor – Colombia
Average along descriptive variables
40
45
50
55
60
65
70
75
80
85
Education
62
64
66
68
70
72
74
24
yea
rs o
r le
ss
25
to
34
yea
rs o
ld
35
to
44
ye
ars
old
45
to
54
ye
ars
old
55
yea
rs o
ld 6
4 y
ears
old
65
yea
rs o
ld o
r o
lder
Age
40
45
50
55
60
65
70
75
80
85
Estrato 1 Estrato 2 Estrato 3 Estrato 4 Estrato 5 Estrato 6
Socioeconomic Status
67.5
68
68.5
69
69.5
70
70.5
71
71.5
Women Men
Gender
37

Annex B - Comparison with results for Brazil
In this section we display the knowledge and attitude questions that proved to be
relevant in the Brazilian case, but were not included in the CAF survey. We reproduce the
tables for knowledge and attitude factors from Garber and Koyama (2016).
Table 10 – Questions entering the Financial Knowledge Factor in Brazil
Question Value assigned Coefficient
(Std. Dev.)
OECD survey
CAF survey
Suppose 3 friends win together R$1500 in a lottery. If they decide to share the money equally, how much does each one get? (3 alternatives or not know)
dummy =1 if right 0.984****
(0.240) Yes Yes
A good way to control monthly expenditure is to make a budget. (True or false)
dummy =1 if right 0.270*
(0.159) No No
Having the information about the interest included if a sale is made in instalments is a basic consumer right. (True or false)
dummy =1 if right 0.730****
(0.227) No No
In Brazil, in 2013 what was the level of inflation? (3 alternatives or not know)
dummy =1 if right 0.463****
(0.098) No No
How would you rate your level of financial knowledge on a scale of 1 to 5 where 1 is not at all knowledgeable and 5 is very knowledgeable?
(1 through 5, not know or refusal)
1 through 5 0.248****
(0.051) Yes No
Suppose you borrow R$100 from a friend and pay him back R$100 after a week. How much interest have you paid on this loan? (3 alternatives or not know)
dummy =1 if right 0.379***
(0.1286657) Yes Yes
An investment with a high return is likely to be high risk. (True or false)
dummy =1 if right 0.357***
(0.130) Yes Yes
significant at: **** 0.1%, ***1%, **5%, *10%
Source: Garber and Koyama (2016)
38
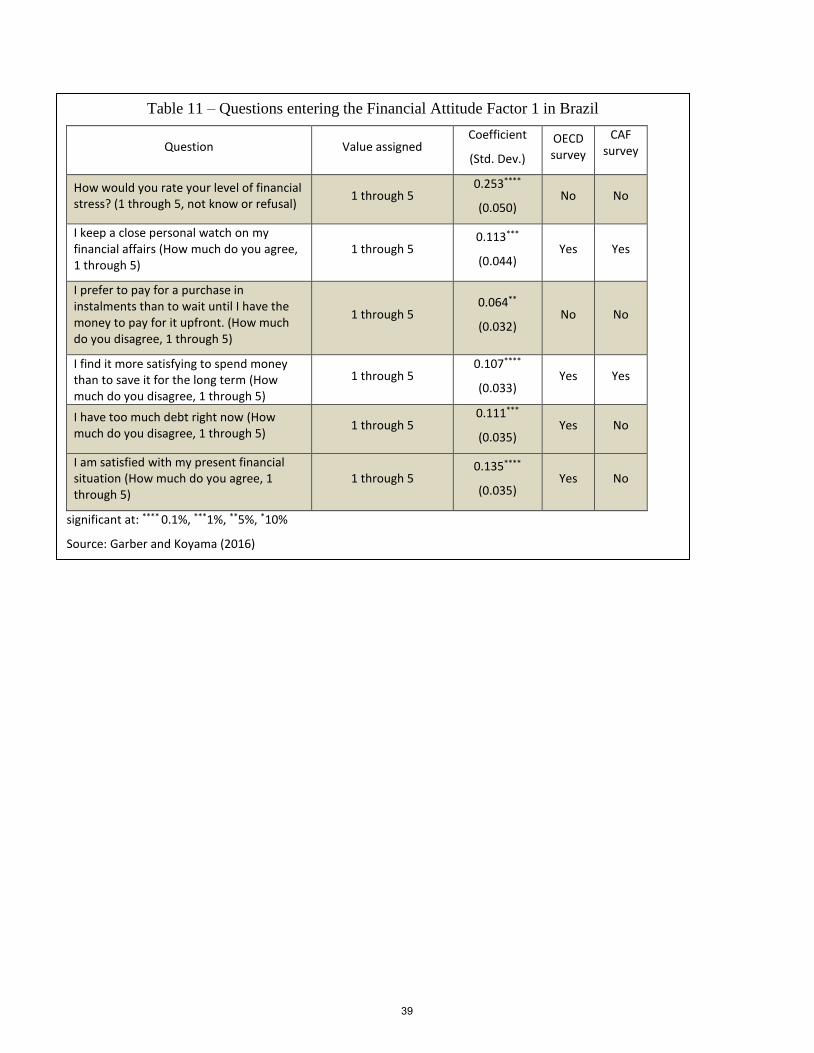
Table 11 – Questions entering the Financial Attitude Factor 1 in Brazil
Question Value assigned Coefficient
(Std. Dev.)
OECD survey
CAF survey
How would you rate your level of financial stress? (1 through 5, not know or refusal)
1 through 5 0.253****
(0.050) No No
I keep a close personal watch on my financial affairs (How much do you agree, 1 through 5)
1 through 5 0.113***
(0.044) Yes Yes
I prefer to pay for a purchase in instalments than to wait until I have the money to pay for it upfront. (How much do you disagree, 1 through 5)
1 through 5 0.064**
(0.032) No No
I find it more satisfying to spend money than to save it for the long term (How much do you disagree, 1 through 5)
1 through 5 0.107****
(0.033) Yes Yes
I have too much debt right now (How much do you disagree, 1 through 5)
1 through 5 0.111***
(0.035) Yes No
I am satisfied with my present financial situation (How much do you agree, 1 through 5)
1 through 5 0.135****
(0.035) Yes No
significant at: **** 0.1%, ***1%, **5%, *10%
Source: Garber and Koyama (2016)
39
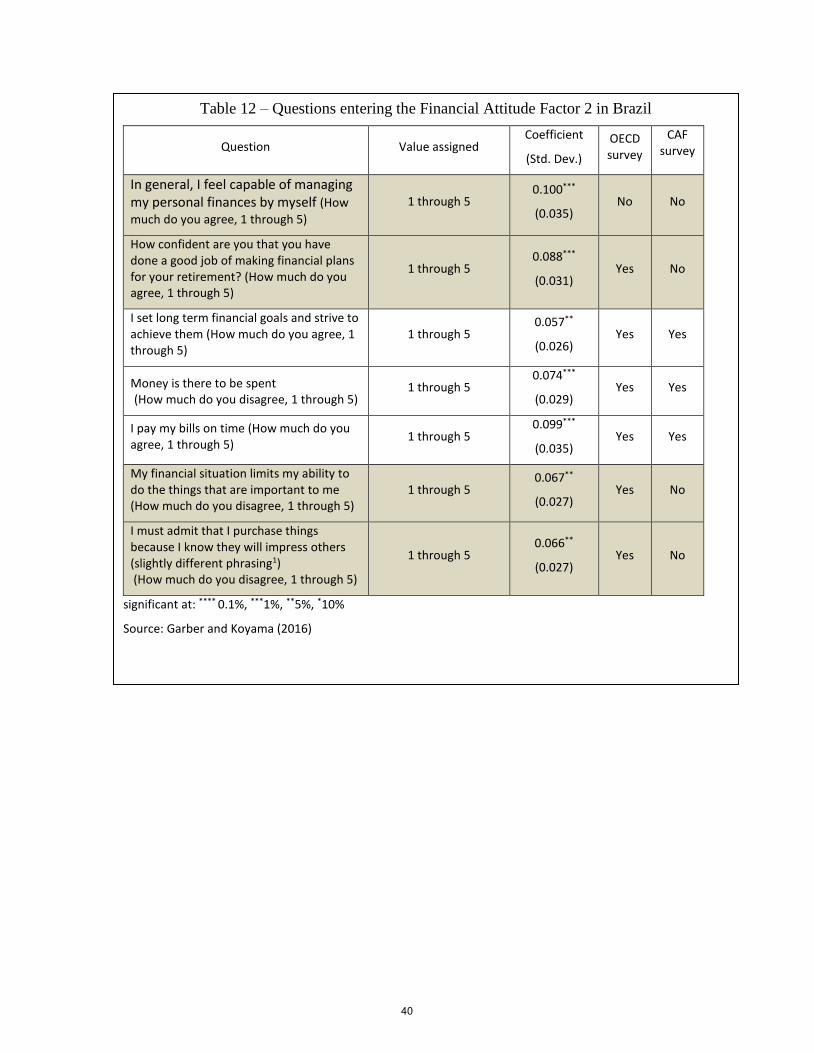
Table 12 – Questions entering the Financial Attitude Factor 2 in Brazil
Question Value assigned Coefficient
(Std. Dev.)
OECD survey
CAF survey
In general, I feel capable of managing my personal finances by myself (How
much do you agree, 1 through 5)
1 through 5 0.100***
(0.035) No No
How confident are you that you have done a good job of making financial plans for your retirement? (How much do you agree, 1 through 5)
1 through 5 0.088***
(0.031) Yes No
I set long term financial goals and strive to achieve them (How much do you agree, 1 through 5)
1 through 5 0.057**
(0.026) Yes Yes
Money is there to be spent (How much do you disagree, 1 through 5)
1 through 5 0.074***
(0.029) Yes Yes
I pay my bills on time (How much do you agree, 1 through 5)
1 through 5 0.099***
(0.035) Yes Yes
My financial situation limits my ability to do the things that are important to me (How much do you disagree, 1 through 5)
1 through 5 0.067**
(0.027) Yes No
I must admit that I purchase things because I know they will impress others (slightly different phrasing1) (How much do you disagree, 1 through 5)
1 through 5 0.066**
(0.027) Yes No
significant at: **** 0.1%, ***1%, **5%, *10%
Source: Garber and Koyama (2016)
40
References
Agnew, J. R., Bateman, H., & Thorp, S. (2013). “Financial Literacy and Retirement
Planning in Australia”. Numeracy, 6(2), 7.
Alessie, R., Van Rooij, M., & Lusardi, A. (2011). “Financial literacy and retirement
preparation in the Netherlands”. Journal of Pension Economics and Finance, 10(04), 527-
545.
Atkinson, A. and Messy, F. (2012). “Measuring Financial Literacy: Results of the OECD /
International Network on Financial Education (INFE) Pilot Study”, OECD Working Papers
on Finance, Insurance and Private Pensions, No. 15, OECD Publishing.
<http://dx.doi.org/10.1787/5k9csfs90fr4-en >
Behrman, J. R., Mitchell, O. S., Soo, C. K., & Bravo, D. (2012). “How financial literacy
affects household wealth accumulation”. The American economic review, 102(3), 300.
Bucher-Koenen, T., & Lusardi, A. (2011). “Financial literacy and retirement planning in
Germany”. Journal of Pension Economics and Finance, 10(04), 565-584.
Finke, Michael S., Howe, John S. and Huston, Sandra J. (2011) “Old Age and the Decline in
Financial Literacy”. Forthcoming in Management Science. Available at SSRN:
<http://ssrn.com/abstract=1948627> or <http://dx.doi.org/10.2139/ssrn.1948627 >
Garber, G. and Koyama, S.M. (2016). “Policy-effective Financial Knowledge and Attitude
Factors”, Brazilian Central Bank Working Paper Series, 430. Available at
<http://www.bcb.gov.br/pec/wps/ingl/wps430.pdf >
41

Lusardi, A., & Mitchell, O. S. (2007b). “Financial literacy and retirement planning: New
evidence from the Rand American Life Panel”. Michigan Retirement Research Center
Research Paper No. WP, 157.
Lusardi, A., & Mitchell, O. S. (2008). “Planning and Financial Literacy: How Do Women
Fare?”. American Economic Review, 98(2), 413-17.
Lusardi, A., & Mitchell, O. S. (2011). “Financial literacy and retirement planning in the
United States”. Journal of pension economics and finance, 10(04), 509-525.
Lusardi, A., & Mitchell, O. S. (2014). The Economic Importance of Financial Literacy:
Theory and Evidence. Journal of Economic Literature, 52(1), 5-44.
Van Rooij, M., Lusardi, A., & Alessie, R. (2011). “Financial literacy and stock market
participation”. Journal of Financial Economics, 101(2), 449-472.
42