policy department, directorate -general for external policies2016)535007_en.pdf · introduction:...
TRANSCRIPT
DIRECTORATE-GENERAL FOR EXTERNAL POLICIES
POLICY DEPARTMENT
EP/EXPO/B/AFET/2015/03 EN
June 2016 - PE 535.007 © European Union, 2016
STUDY
The EU’s energy diplomacy: Transatlantic and foreign policy implications
ABSTRACT
Energy security is increasingly occupying a top spot on the EU’s foreign policy agenda. The unconventional oil and gas revolution, OPEC’s supply response, increased global Liquefied Natural Gas (LNG) trade, persistent concerns about the reliability of Russian gas supplies and the need to expand low carbon energies such as renewables to address climate change pose opportunities and challenges to European energy security. The EU has flagged these issues up in its flagship Energy Union communication and the EU Energy Diplomacy Action Plan. The United States has developed into a major exporter of Natural Gas Liquids and refined petroleum products as a result of its unconventional oil and gas revolution. It might develop export capacities for LNG and continues to be a major coal exporter. The mutual energy trade could expand if the Transatlantic Trade and Investment Partnership (TTIP) were concluded successfully. The United States is also a crucial partner of the EU for transport security and the protection of critical energy infrastructure.

Policy Department, Directorate-General for External Policies
This paper was requested by the European Parliament's Committee on Foreign Affairs.
English-language manuscript was completed on 16 June 2016.
Printed in Belgium.
Author: Eckart Woertz, Senior Research Fellow, CIDOB (Barcelona Centre for International Affairs), Spain, Meike Fienitz, Hugh Jorgensen, Andrew Sprague, Arya Fazilat, Berenguer Gangolells, IBEI (Barcelona Institute for International Studies), Spain.
Official Responsible: Anete BANDONE and Wanda TROSZCZYNSKA-VAN GENDEREN.
Editorial Assistant: Elina STERGATOU.
Feedback of all kind is welcome. Please write to: [email protected].
To obtain copies, please send a request to: [email protected].
This paper will be published on the European Parliament's online database, 'Think tank'.
The content of this document is the sole responsibility of the author and any opinions expressed therein do not necessarily represent the official position of the European Parliament. It is addressed to the Members and staff of the EP for their parliamentary work. Reproduction and translation for non-commercial purposes are authorised, provided the source is acknowledged and the European Parliament is given prior notice and sent a copy.
ISBN: 978-92-823-9399-4 (pdf) ISBN: 978-92-823-9400-7 (paper)
doi:10.2861/203159 (pdf) doi:10.2861/446421 (paper)
Catalogue number: QA-02-16-568-EN-N (pdf) Catalogue number: QA-02-16-568-EN-C (paper)

The EU’s energy diplomacy: Transatlantic and foreign policy implications
3
Table of contents
List of figures 6
List of tables 7
Acronyms and abbreviations 8
Executive summary 10
1 Introduction: Changes to the global energy landscape 14
1.1 The global energy landscape 14
1.2 Energy markets and the unconventional oil and gas revolution 15
1.3 Oil price fluctuations and OPEC’s response 16
1.4 Liquefied natural gas (LNG) markets 18
1.5 The future of nuclear power in the EU 21
1.6 Climate change policies, renewables and the future of coal 22
2 The North Atlantic and the U.S. in the context of the changing energy landscape 25
2.1 Impact of the Unconventional natural gas revolution on U.S. gas supplies and its potential for LNG exports 25
2.1.1 Natural gas resources and production 25
2.1.2 Natural gas prices and imports 26
2.1.3 Implications for LNG exports 27
2.1.4 Unconventional natural gas in Canada 29
2.2 Impact of the unconventional oil revolution in the U.S. 30
2.2.1 U.S. oil reserves and production 30
2.2.2 Implications for U.S. imports and exports 31
2.2.3 Unconventional oil in Canada 32
2.3 U.S. coal exports and their possible future development 33
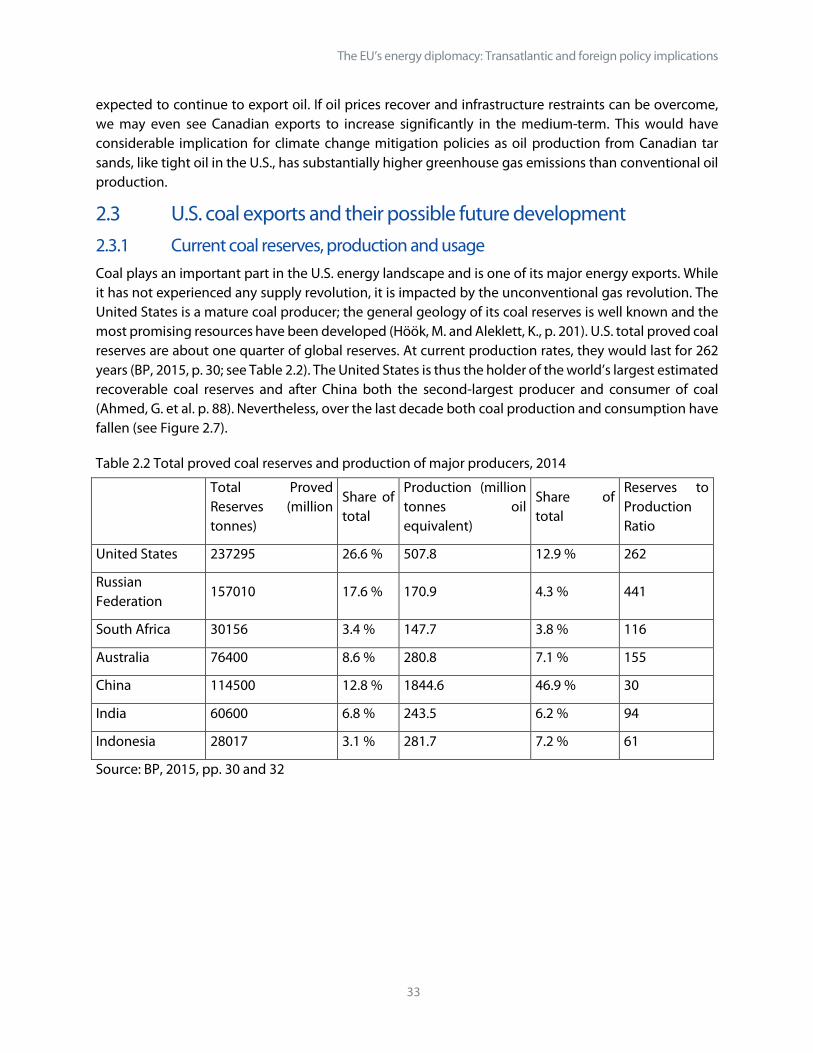
2.3.1 Current coal reserves, production and usage 33
2.3.2 Changes in domestic coal demand 34
2.3.3 Projected future coal exports 35
2.3.4 Canadian coal exports 35
2.4 U.S. energy security strategy 36
Policy Department, Directorate-General for External Policies
4
2.4.1 Official strategy papers 36
2.4.2 U.S. energy security strategy and the EU 37
3 The EU’s energy security strategy 39
3.1 The emerging European energy security strategy in the 2000s 39
3.2 The European energy security strategy and the 2030 climate and energy framework 41
3.3 The European energy union and energy diplomacy 42
3.4 European aggregated energy mix and major supplier countries 44
3.5 Energy mixes of individual EU Member States and diverging energy security interests 46
3.6 Oil supply alternatives for Europe 49
3.6.1 Oil: Global commodity - Natural gas: Segmented markets 49
3.6.2 Saudi Arabia 50
3.6.3 Iraq 51
3.6.4 Iran 52
3.6.5 Brazil 53
3.6.6 Venezuela 53
3.6.7 North America 53
3.7 Natural gas supply alternatives for Europe 54
3.7.1 Domestic conventional gas production in Europe 54
3.7.2 Domestic non-conventional gas production in Europe 55
3.7.3 North and Sub-Saharan Africa 56
3.7.4 Azerbaijan and Central Asia 58
3.7.5 Iran 58
3.7.6 Qatar and other Middle East countries 59
3.7.7 The Eastern Mediterranean and Egypt 59
3.7.8 Western supply corridor I: United States 60
3.7.9 Western supply corridor II: Latin America 64
4 Transatlantic energy cooperation 65
4.1 EU-US cooperation on energy 65
4.2 Opportunities and challenges of TTIP energy provisions 66
4.3 Main U.S. advocates and opponents of TTIP energy provisions 69

The EU’s energy diplomacy: Transatlantic and foreign policy implications
5
4.3.1 Strategic and security views 69
4.3.2 Hydrocarbon producing states and industries 69
4.3.3 Energy consuming industries 70
4.3.4 The interests of civil society and environmental groups 70
5 Chokepoints and transatlantic cooperation on the protection of critical energy infrastructure 72
5.1 The rationale for critical energy infrastructure protection (CEIP) 72
5.2 Shared transatlantic critical energy infrastructure concerns 73
5.2.1 Information and communication technology infrastructure 73
5.2.2 The risks of (not) sharing information 74
5.2.3 Gas Infrastructure within the EESS 74
5.2.4 Oil Infrastructure within the EESS 75
5.2.5 General threats to oil and gas infrastructure access 75
5.3 Transit countries and threats to oil and gas infrastructure access 76
5.3.1 Gas pipelines 76
5.3.2 Maritime choke points 78
5.4 Best practice CEIP examples from the transatlantic community 80
5.4.1 Transatlantic lessons in CEIP? 80
5.4.2 Transatlantic cooperation over external critical energy infrastructure protection 81
5.4.3 Governance and financing of CEIP 82
5.4.4 Hard power CEIP 82
6 Conclusion and policy recommendations 84
7 Annex 87
8 References 89

Policy Department, Directorate-General for External Policies
6
List of figures Figure 1.1 Global energy consumption projections to 2040 .................................................................................. 14 Figure 1.2 Global Oil Supply Disruptions and U.S. Production Growth 2010-16 ............................................. 15 Figure 1.3 Selected LNG Exporters, 2014 ....................................................................................................................... 19 Figure 1.4: European sources of LNG imports (excluding re-exports), % share 2014 .................................... 20 Figure 1.5: European LNG import countries, 2014 (% share) .................................................................................. 20 Figure 1.6 Known recoverable resources of uranium 2013, % share of global total ...................................... 21 Figure 2.1 U.S. dry natural gas production, 2000 – 2015 ............................................................................................... in billion cubic meters ........................................................................................................................................................... 26 Figure 2.2 U.S. natural gas production and consumption, 2004-2014 ..................................................................... in billion cubic metres ........................................................................................................................................................... 26 Figure 2.3 Henry Hub natural gas spot price and EU natural gas import price, 2006 – 2016........................... in USD per MMBtu .................................................................................................................................................................. 27 Figure 2.4 Canadian natural gas production and consumption, 2004-2014 .................................................... 29 in billion cubic metres ................................................................................................................................................................ Figure 2.5 U.S. oil production and consumption (incl. NGL), 2004-2014 ................................................................. in million barrels daily ........................................................................................................................................................... 30 Figure 2.6 Price difference (spread) between brent and WTI crude oil 2010-2015 ........................................ 31 Figure 2.7 Canadian oil production and consumption, 2004-2014 ........................................................................... in million barrels daily ........................................................................................................................................................... 32 Figure 2.8 U.S. coal production and consumption, 2004-2014 ................................................................................... in million tonnes oil equivalent ......................................................................................................................................... 34 Figure 2.9 U.S. coal exports, 2009-2040 ............................................................................................................................... in quadrillion Btu per year ................................................................................................................................................... 35 Figure 2.10 Canadian coal production and consumption, 2004-2014 ..................................................................... in million tonnes oil equivalent ......................................................................................................................................... 36 Figure 3.1 EU energy sources % of total usage ............................................................................................................ 44 Figure 3.2 Supplier countries: % of total EU crude oil imports, 2013 .................................................................. 45 Figure 3.3 Supplier countries: % of total EU natural gas imports, 2013 ............................................................. 45 Figure 3.4: Supplier countries: % of Total EU solid fuels imports (mainly Coal), 2013 .................................. 46 Figure 3.5: Supplier countries: % of total EU uranium imports ............................................................................. 46 Figure 3.6 Individual energy mixes of EU countries, 2014 ....................................................................................... 48 Figure 3.7 Indigenous conventional gas production in European markets 2013 – 2030 (bcm) ................ 55 Figure 5.1 The LNG supply chain ....................................................................................................................................... 76 Figure A 1: Major Russian gaslines to Europe ............................................................................................................... 87 Figure A 2: Competing gas pipeline proposals ............................................................................................................ 88 Figure A 3: Major maritime chokepoints ........................................................................................................................ 88
The EU’s energy diplomacy: Transatlantic and foreign policy implications
7
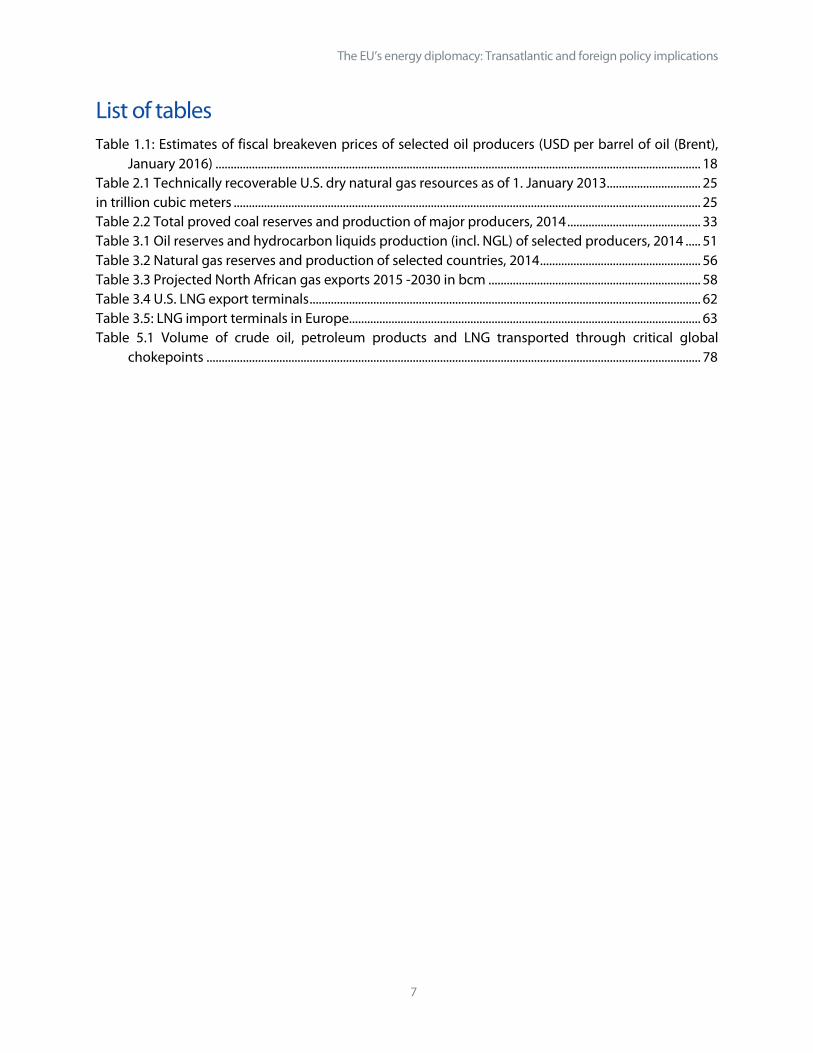
List of tables Table 1.1: Estimates of fiscal breakeven prices of selected oil producers (USD per barrel of oil (Brent),
January 2016) ................................................................................................................................................................ 18 Table 2.1 Technically recoverable U.S. dry natural gas resources as of 1. January 2013............................... 25 in trillion cubic meters .......................................................................................................................................................... 25 Table 2.2 Total proved coal reserves and production of major producers, 2014 ............................................ 33 Table 3.1 Oil reserves and hydrocarbon liquids production (incl. NGL) of selected producers, 2014 ..... 51 Table 3.2 Natural gas reserves and production of selected countries, 2014 ..................................................... 56 Table 3.3 Projected North African gas exports 2015 -2030 in bcm ...................................................................... 58 Table 3.4 U.S. LNG export terminals ................................................................................................................................. 62 Table 3.5: LNG import terminals in Europe.................................................................................................................... 63 Table 5.1 Volume of crude oil, petroleum products and LNG transported through critical global
chokepoints ................................................................................................................................................................... 78
Policy Department, Directorate-General for External Policies
8
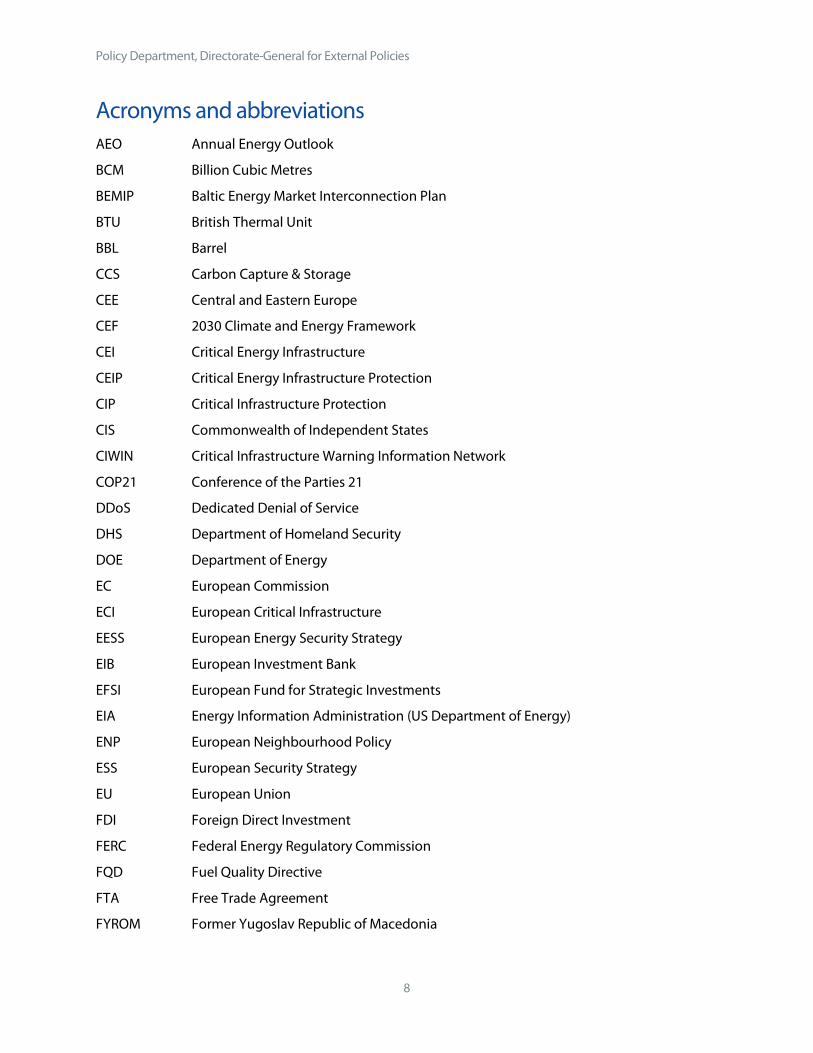
Acronyms and abbreviations AEO Annual Energy Outlook
BCM Billion Cubic Metres
BEMIP Baltic Energy Market Interconnection Plan
BTU British Thermal Unit
BBL Barrel
CCS Carbon Capture & Storage
CEE Central and Eastern Europe
CEF 2030 Climate and Energy Framework
CEI Critical Energy Infrastructure
CEIP Critical Energy Infrastructure Protection
CIP Critical Infrastructure Protection
CIS Commonwealth of Independent States
CIWIN Critical Infrastructure Warning Information Network
COP21 Conference of the Parties 21
DDoS Dedicated Denial of Service
DHS Department of Homeland Security
DOE Department of Energy
EC European Commission
ECI European Critical Infrastructure
EESS European Energy Security Strategy
EIB European Investment Bank
EFSI European Fund for Strategic Investments
EIA Energy Information Administration (US Department of Energy)
ENP European Neighbourhood Policy
ESS European Security Strategy
EU European Union
FDI Foreign Direct Investment
FERC Federal Energy Regulatory Commission
FQD Fuel Quality Directive
FTA Free Trade Agreement
FYROM Former Yugoslav Republic of Macedonia
The EU’s energy diplomacy: Transatlantic and foreign policy implications
9
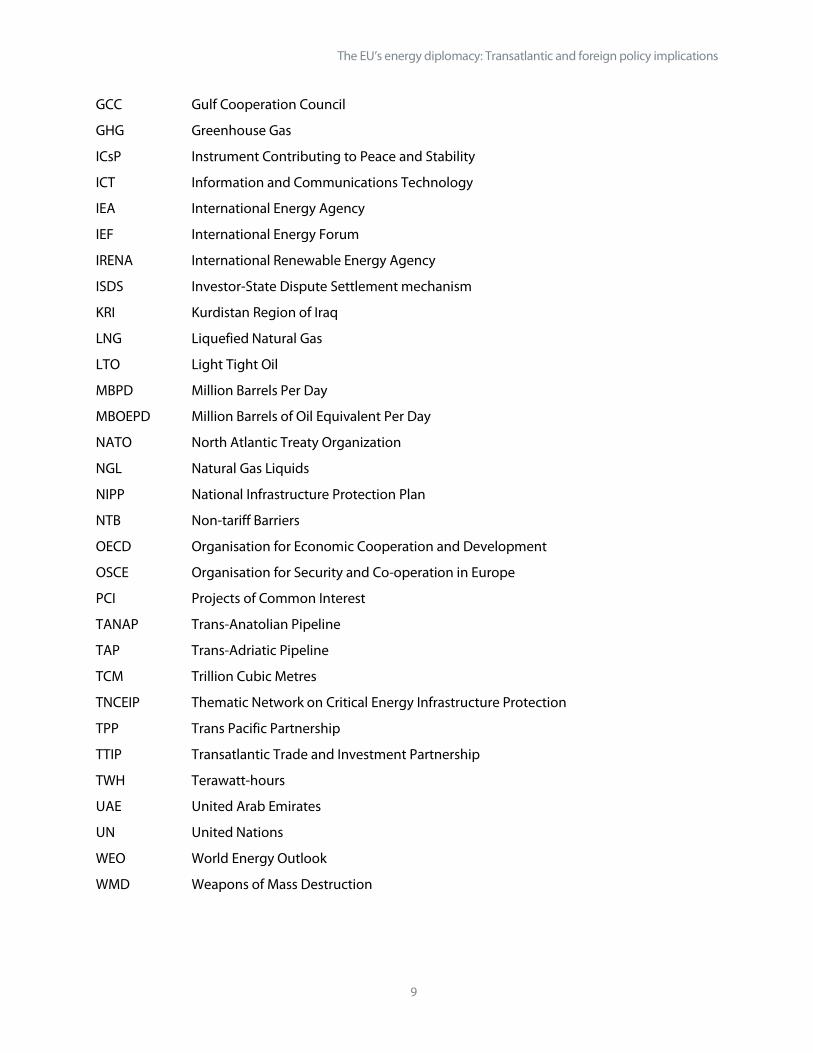
GCC Gulf Cooperation Council
GHG Greenhouse Gas
ICsP Instrument Contributing to Peace and Stability
ICT Information and Communications Technology
IEA International Energy Agency
IEF International Energy Forum
IRENA International Renewable Energy Agency
ISDS Investor-State Dispute Settlement mechanism
KRI Kurdistan Region of Iraq
LNG Liquefied Natural Gas
LTO Light Tight Oil
MBPD Million Barrels Per Day
MBOEPD Million Barrels of Oil Equivalent Per Day
NATO North Atlantic Treaty Organization
NGL Natural Gas Liquids
NIPP National Infrastructure Protection Plan
NTB Non-tariff Barriers
OECD Organisation for Economic Cooperation and Development
OSCE Organisation for Security and Co-operation in Europe
PCI Projects of Common Interest
TANAP Trans-Anatolian Pipeline
TAP Trans-Adriatic Pipeline
TCM Trillion Cubic Metres
TNCEIP Thematic Network on Critical Energy Infrastructure Protection
TPP Trans Pacific Partnership
TTIP Transatlantic Trade and Investment Partnership
TWH Terawatt-hours
UAE United Arab Emirates
UN United Nations
WEO World Energy Outlook
WMD Weapons of Mass Destruction
Policy Department, Directorate-General for External Policies
10
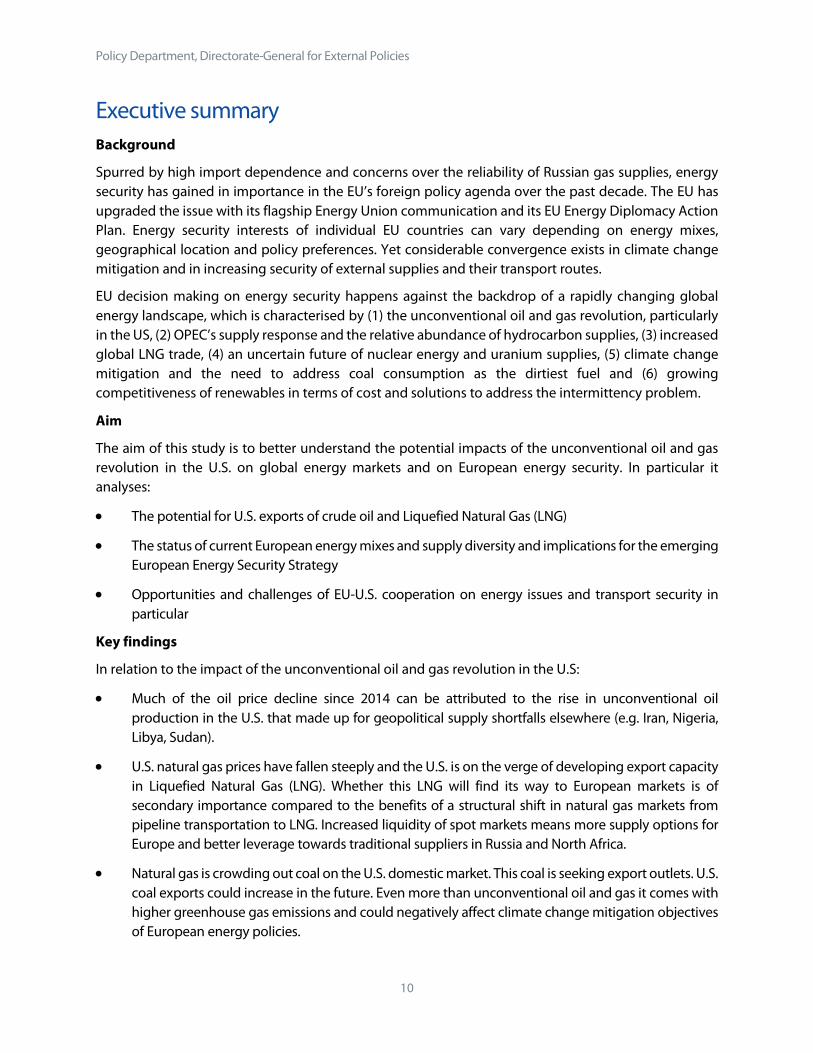
Executive summary Background Spurred by high import dependence and concerns over the reliability of Russian gas supplies, energy security has gained in importance in the EU’s foreign policy agenda over the past decade. The EU has upgraded the issue with its flagship Energy Union communication and its EU Energy Diplomacy Action Plan. Energy security interests of individual EU countries can vary depending on energy mixes, geographical location and policy preferences. Yet considerable convergence exists in climate change mitigation and in increasing security of external supplies and their transport routes.
EU decision making on energy security happens against the backdrop of a rapidly changing global energy landscape, which is characterised by (1) the unconventional oil and gas revolution, particularly in the US, (2) OPEC’s supply response and the relative abundance of hydrocarbon supplies, (3) increased global LNG trade, (4) an uncertain future of nuclear energy and uranium supplies, (5) climate change mitigation and the need to address coal consumption as the dirtiest fuel and (6) growing competitiveness of renewables in terms of cost and solutions to address the intermittency problem.
Aim
The aim of this study is to better understand the potential impacts of the unconventional oil and gas revolution in the U.S. on global energy markets and on European energy security. In particular it analyses:
• The potential for U.S. exports of crude oil and Liquefied Natural Gas (LNG)
• The status of current European energy mixes and supply diversity and implications for the emerging European Energy Security Strategy
• Opportunities and challenges of EU-U.S. cooperation on energy issues and transport security in particular
Key findings
In relation to the impact of the unconventional oil and gas revolution in the U.S:
• Much of the oil price decline since 2014 can be attributed to the rise in unconventional oil production in the U.S. that made up for geopolitical supply shortfalls elsewhere (e.g. Iran, Nigeria, Libya, Sudan).
• U.S. natural gas prices have fallen steeply and the U.S. is on the verge of developing export capacity in Liquefied Natural Gas (LNG). Whether this LNG will find its way to European markets is of secondary importance compared to the benefits of a structural shift in natural gas markets from pipeline transportation to LNG. Increased liquidity of spot markets means more supply options for Europe and better leverage towards traditional suppliers in Russia and North Africa.
• Natural gas is crowding out coal on the U.S. domestic market. This coal is seeking export outlets. U.S. coal exports could increase in the future. Even more than unconventional oil and gas it comes with higher greenhouse gas emissions and could negatively affect climate change mitigation objectives of European energy policies.
The EU’s energy diplomacy: Transatlantic and foreign policy implications
11
• However, if (unconventional) natural gas imports replaced coal consumption in Europe this could improve greenhouse gas emissions as has been already observed in the U.S. This could complement the European drive towards renewables, which have the largest potential to drive down hydrocarbon consumption and decrease greenhouse gas emissions.
• The United States could become a swing-producer for oil. Thanks to the price elasticity of its tight oil sector we might see smaller global oil price fluctuations than in the past. U.S. unconventional oil can also contribute to sustain substantially lower oil prices than during the oil boom of the 2000s.
• Major oil exports from the United States are not to be expected, despite a lifting of the crude oil export ban. Due to market peculiarities of various crude varieties and the strength of the U-S. refining industry, petroleum exports of the U.S. will likely continue to be in the form of refined products and Natural Gas Liquids (NGL) rather than light crude oil.
• The importance of traditional oil suppliers such as Russia and OPEC will persist, however, reduced U.S. imports of light crude oil put downward pressure on global oil prices and free supplies for Europe elsewhere (e.g. from Nigeria or Algeria). In contrast, suppliers of heavy crude (e.g. Saudi Arabia) have been able to maintain market share in the U.S. because of the requirements of refiners.
• As the U.S. remains dependent on stable global oil prices and trade, a decisive weakening of U.S. strategic interest in major oil producing regions such as the Middle East is unlikely.
In relation to Russian gas supplies:
• A critical dialogue with Russia needs to be part of European energy diplomacy. Considerable dependence of the EU on Russian oil and gas supplies will persist for the foreseeable future. This dependence varies from country to country depending on energy mixes and geographic location.
• Some recent projects like the Nord Stream II pipeline to Germany in fact enhance dependence on Russian gas rather than reducing it.
• Apart from the geopolitical risk there are good commercial arguments for Russian gas imports. In many European regions they are more competitive than most LNG imports in the current price environment, especially in western European core markets like Germany, Italy and the UK.
In relation to LNG imports from the U.S:
• In theory, the EU already has enough LNG import capacity to almost completely replace Russian gas with imported LNG. Much of it lies idle, especially in Spain, due to limited global LNG supply, which is not yet available or not price-competitive.
• More than new LNG infrastructures the EU will need to work on a unified gas market and the interconnections between already existing LNG terminals and other member states.
• A decision in favour of LNG imports would require considerable infrastructure investments in exporting and importing nations and a supportive political environment that prioritises geopolitical safety over purely commercial considerations.

Policy Department, Directorate-General for External Policies
12
• Increased LNG imports, whether from the U.S or elsewhere, could grant the EU more contractual leverage over its traditional natural gas suppliers from Russia and North Africa and help unify the energy mixes of individual member states.
In relation to EU-U.S Energy Cooperation and the proposed Transatlantic Trade and Investment Partnership (TTIP):
• The U.S. is a privileged partner in European energy cooperation. There is a shared interest in open and competitive energy markets. Institutionalised platforms like the EU-U.S Energy Council do not exit with other countries.
• At this stage the U.S. appears to be disinclined to negotiate a specific energy chapter within TTIP. However, even without such a chapter, Europe would harvest considerable benefits simply by signing a free trade agreement, such as improved access to U.S. LNG.
• Any opening for renewables in the TTIP such as a reduction of local content provisions or a harmonisation of regulations and standards could significantly improve export opportunities for European producers of renewable energy equipment and know-how, particularly for wind power.
• A successful conclusion of TTIP would enhance European access to U.S. LNG, but commercial pressures and the competitiveness of Russian pipeline gas could affect such exports.
• Some of the advantages of a successful conclusion of TTIP would be eroded if Asian nations succeeded in signing the Trans Pacific Partnership (TPP) with the U.S. They would have equally privileged access to U.S. LNG and price levels in Asian gas markets tend to be higher than in Europe.
• The European Fuel Quality Directive (FQD) is a considerable stumbling block in TTIP negotiations. It is not in line with U.S legislation and U.S. energy exporters see it as a barrier to market access.
• The U.S. has an interest to gain market access to European unconventional gas resources that would require controversial fracking. The EU regards decision over natural resources and their possible exploitation a matter of sovereignty of the respective member states. Only once they have decided to open up a particular energy market like unconventional natural gas the TTIP could help to foster competition and open access.
In relation to Critical Energy Infrastructure Protection (CEIP):
• Critical Energy Infrastructure Protection (CEIP) should be defined more broadly and should go into more detail than the broad brush of geopolitical scenario building. It should not only focus on country risks in energy exporting nations, but should include details of actual technical and physical infrastructure.
• Cyber security merits greater attention in this context. Energy and Information and Communications Technology (ICT)-related infrastructure are so intimately linked that an ICT infrastructure failure has the potential to disrupt nearly every aspect of the energy supply chain, in every energy market.
• Much of CEI belongs to private owners who are reluctant to share information because of concerns about commercial confidentiality and regulatory burdens. Such lack of mutual trust has to be overcome by institutionalisation and other appropriate measures.
The EU’s energy diplomacy: Transatlantic and foreign policy implications
13
• The EU and the U.S. are well placed to cooperate on ensuring CEIP receives the attention it deserves not only in terms of their own respective markets, but also internationally, due to their positions of influence in a range of multilateral processes.
• The U.S. can provide some important lessons for the EU. The U.S. Department of Homeland Security (DHS) has developed a fairly comprehensive and well-integrated national infrastructure protection plan (NIPP) that has been regularly updated since 2006 and was complemented by an Energy Sector Specific Plan (ESSP) in 2010 that is due for renewal. In comparison the EU’s efforts have been more limited and policy implementation is still hampered by 28 different regulatory frameworks.
• Although there is an understandable reluctance to conflate hard security and energy issues, the European Commission (EC), through its energy dialogues with the U.S., is well placed to push security partner processes to engage in more explicit preparatory planning in the event of a major external CEI disruption. Due to the high overlap in membership, the obvious partner in this regard is NATO.
• Maritime chokepoints like the Strait of Hormuz, Bab al-Mandab and the Suez Canal come with higher risks than the sea-lanes to North America, Latin America and West Africa. At the same time one needs to acknowledge that apart from the temporary Arab oil embargo in the 1970s and the collapse of Iranian production in the wake of the unrest of the Islamic revolution in 1979 no major unilateral geopolitical supply disruption from the Middle East has ever occurred. Most supply disruptions were voluntary as they were a result of Western sanctions against countries such as Libya, Iraq and Iran. Autocratic oil countries in the Middle East are more dependent on oil exports than the EU is on oil imports from there.
• A much-fretted closure of the Strait of Hormuz is unlikely, not only because of the recent rapprochement in the Iranian nuclear standoff. Hormuz is crucial for Iran’s own oil exports and essential imports such as food. It does not have alternative export outlets like Saudi Arabia or the UAE and no possible self-interest in closing the Strait. It also lacks the military capabilities to do so sustainably against U.S. naval power in the region.
Policy Department, Directorate-General for External Policies
14
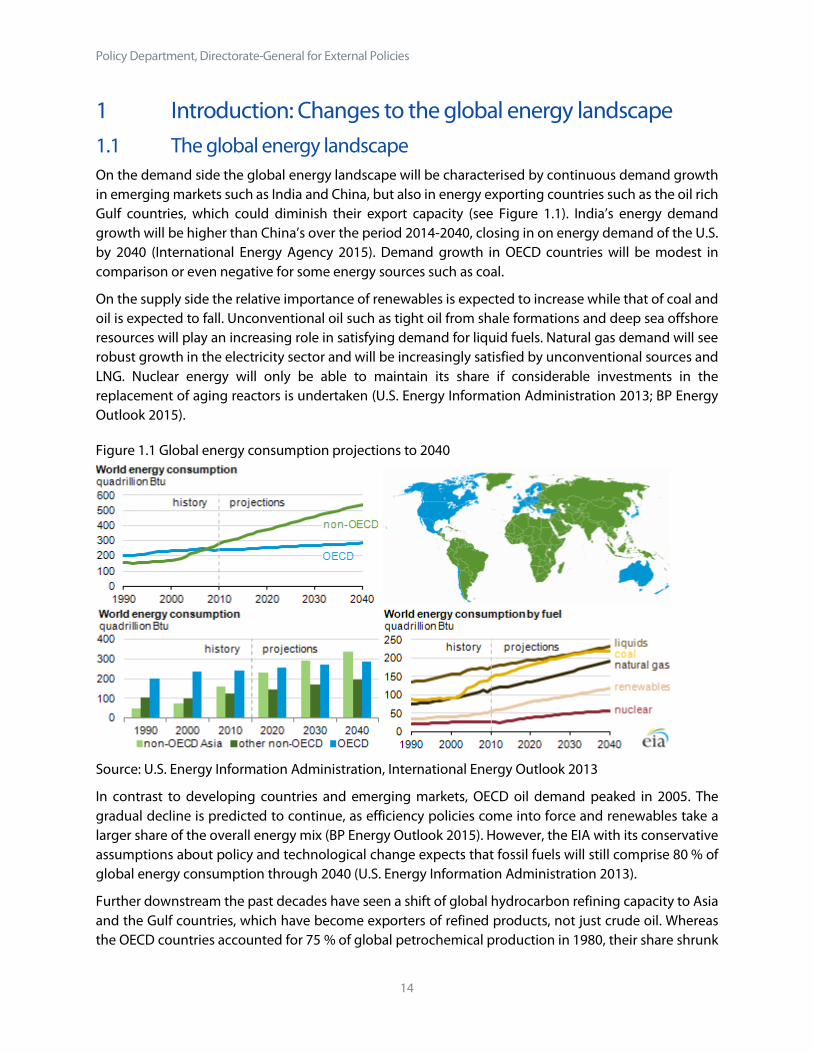
1 Introduction: Changes to the global energy landscape 1.1 The global energy landscape On the demand side the global energy landscape will be characterised by continuous demand growth in emerging markets such as India and China, but also in energy exporting countries such as the oil rich Gulf countries, which could diminish their export capacity (see Figure 1.1). India’s energy demand growth will be higher than China’s over the period 2014-2040, closing in on energy demand of the U.S. by 2040 (International Energy Agency 2015). Demand growth in OECD countries will be modest in comparison or even negative for some energy sources such as coal.
On the supply side the relative importance of renewables is expected to increase while that of coal and oil is expected to fall. Unconventional oil such as tight oil from shale formations and deep sea offshore resources will play an increasing role in satisfying demand for liquid fuels. Natural gas demand will see robust growth in the electricity sector and will be increasingly satisfied by unconventional sources and LNG. Nuclear energy will only be able to maintain its share if considerable investments in the replacement of aging reactors is undertaken (U.S. Energy Information Administration 2013; BP Energy Outlook 2015).
Figure 1.1 Global energy consumption projections to 2040
Source: U.S. Energy Information Administration, International Energy Outlook 2013
In contrast to developing countries and emerging markets, OECD oil demand peaked in 2005. The gradual decline is predicted to continue, as efficiency policies come into force and renewables take a larger share of the overall energy mix (BP Energy Outlook 2015). However, the EIA with its conservative assumptions about policy and technological change expects that fossil fuels will still comprise 80 % of global energy consumption through 2040 (U.S. Energy Information Administration 2013).
Further downstream the past decades have seen a shift of global hydrocarbon refining capacity to Asia and the Gulf countries, which have become exporters of refined products, not just crude oil. Whereas the OECD countries accounted for 75 % of global petrochemical production in 1980, their share shrunk

The EU’s energy diplomacy: Transatlantic and foreign policy implications
15
to 37 % by 2010 (Kalkman, J. and Keller, A.). This dislocation trend is expected to level out at one point, especially in the U.S. where the refining industry has seen a remarkable resurgence. Reliance on renewable energy sources and efficiency increases drive down EU hydrocarbon demand and make Europe less interesting for exporter nations. Oil exporters from the Gulf Cooperation Council (GCC) countries1 for example are working to forge strategic partnerships with Asian clients in refining and storage in search for demand security.
1.2 Energy markets and the unconventional oil and gas revolution Between summer 2014 and January 2016 oil prices collapsed from over USD100 dollars to below USD30. A major reason was the unconventional oil and gas revolution in the U.S. that added up to 4 million barrels per day (mbpd) of additional oil supplies to global markets over that period. This made up for mainly geopolitical supply disruptions elsewhere. In Libya, Sudan, Syria and Nigeria production collapsed as a result of internal unrest, in Iran as a result of sanctions (see Figure 1.2).
Figure 1.2 Global Oil Supply Disruptions and U.S. Production Growth 2010-16
Source: Anas Al-Hajji, personal communication, based on data of DNB, PIRA and NGP, 2016
Unconventional oil and gas2 was responsible for the majority of American supply additions of crude oil, Natural Gas Liquids (NGL) and natural gas. These steady and consistent increases are due to a new
1 Saudi Arabia, Kuwait, Bahrain, Qatar, United Arab Emirates (UAE), Oman. 2 Beside shale and tight gas there is also coal bed methane. The process involves extracting natural gas directly from coal beds, producing ‘sweet gas’ (lacks hydrogen sulphide) and reducing methane leakage from coal mining (World Coal Association, ‘Coal Seam Methane’). Countries with large coal deposits such as Australia, India, and the U.S. have started taking advantage by producing this cleaner fuel along with dirtier coal.
Policy Department, Directorate-General for External Policies
16
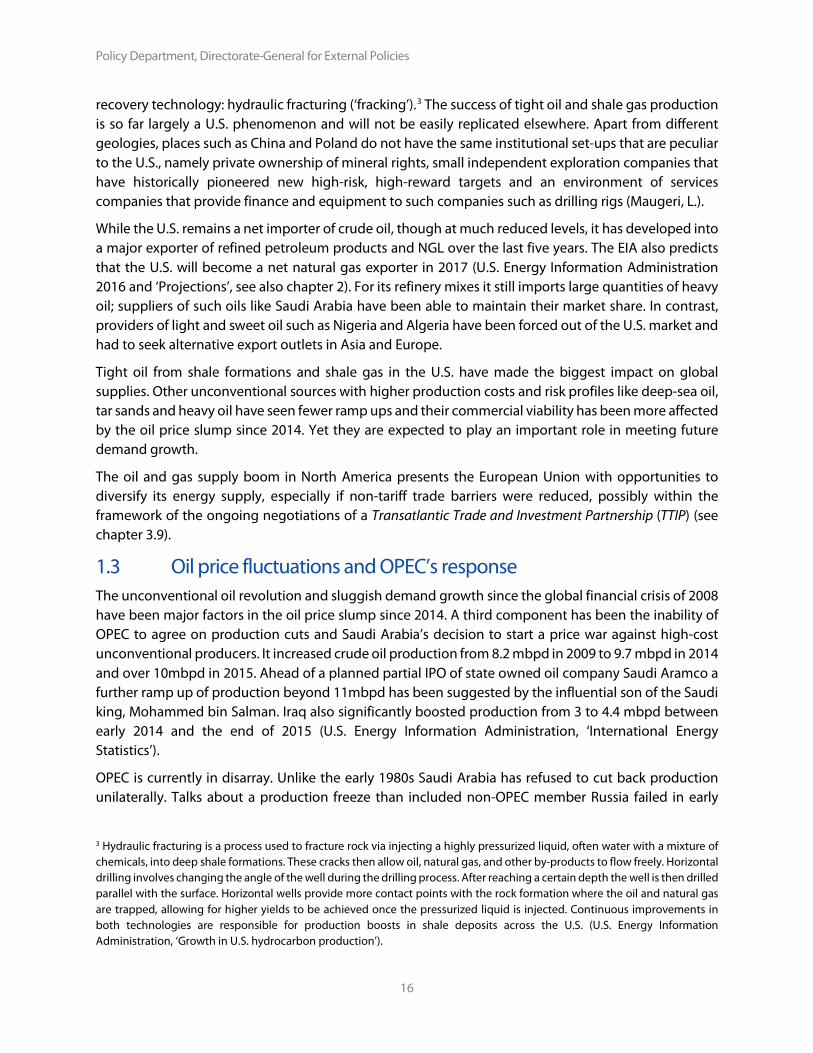
recovery technology: hydraulic fracturing (‘fracking’).3 The success of tight oil and shale gas production is so far largely a U.S. phenomenon and will not be easily replicated elsewhere. Apart from different geologies, places such as China and Poland do not have the same institutional set-ups that are peculiar to the U.S., namely private ownership of mineral rights, small independent exploration companies that have historically pioneered new high-risk, high-reward targets and an environment of services companies that provide finance and equipment to such companies such as drilling rigs (Maugeri, L.).
While the U.S. remains a net importer of crude oil, though at much reduced levels, it has developed into a major exporter of refined petroleum products and NGL over the last five years. The EIA also predicts that the U.S. will become a net natural gas exporter in 2017 (U.S. Energy Information Administration 2016 and ‘Projections’, see also chapter 2). For its refinery mixes it still imports large quantities of heavy oil; suppliers of such oils like Saudi Arabia have been able to maintain their market share. In contrast, providers of light and sweet oil such as Nigeria and Algeria have been forced out of the U.S. market and had to seek alternative export outlets in Asia and Europe.
Tight oil from shale formations and shale gas in the U.S. have made the biggest impact on global supplies. Other unconventional sources with higher production costs and risk profiles like deep-sea oil, tar sands and heavy oil have seen fewer ramp ups and their commercial viability has been more affected by the oil price slump since 2014. Yet they are expected to play an important role in meeting future demand growth.
The oil and gas supply boom in North America presents the European Union with opportunities to diversify its energy supply, especially if non-tariff trade barriers were reduced, possibly within the framework of the ongoing negotiations of a Transatlantic Trade and Investment Partnership (TTIP) (see chapter 3.9).
1.3 Oil price fluctuations and OPEC’s response The unconventional oil revolution and sluggish demand growth since the global financial crisis of 2008 have been major factors in the oil price slump since 2014. A third component has been the inability of OPEC to agree on production cuts and Saudi Arabia’s decision to start a price war against high-cost unconventional producers. It increased crude oil production from 8.2 mbpd in 2009 to 9.7 mbpd in 2014 and over 10mbpd in 2015. Ahead of a planned partial IPO of state owned oil company Saudi Aramco a further ramp up of production beyond 11mbpd has been suggested by the influential son of the Saudi king, Mohammed bin Salman. Iraq also significantly boosted production from 3 to 4.4 mbpd between early 2014 and the end of 2015 (U.S. Energy Information Administration, ‘International Energy Statistics’).
OPEC is currently in disarray. Unlike the early 1980s Saudi Arabia has refused to cut back production unilaterally. Talks about a production freeze than included non-OPEC member Russia failed in early
3 Hydraulic fracturing is a process used to fracture rock via injecting a highly pressurized liquid, often water with a mixture of chemicals, into deep shale formations. These cracks then allow oil, natural gas, and other by-products to flow freely. Horizontal drilling involves changing the angle of the well during the drilling process. After reaching a certain depth the well is then drilled parallel with the surface. Horizontal wells provide more contact points with the rock formation where the oil and natural gas are trapped, allowing for higher yields to be achieved once the pressurized liquid is injected. Continuous improvements in both technologies are responsible for production boosts in shale deposits across the U.S. (U.S. Energy Information Administration, ‘Growth in U.S. hydrocarbon production’).
The EU’s energy diplomacy: Transatlantic and foreign policy implications
17
2016. Other OPEC members have not been willing to take the lead. Iran in particular is anxious to return to oil markets and regain market share. It lost about a million barrels of exports in 2012-15 as a result of sanctions that were recently lifted after a compromise deal was reached over the management of its nuclear program. In spring 2016 exports had rebounded to 1.75 mbpd and were expected to reach pre-sanction level of 2.2 mbpd by June (Reuters, 2016). Iraq, a member of OPEC, but not of its dysfunctional quota system, is also eager to expand its production to cover its budgetary needs. Its budget has been strained by the oil price slump and the need for increased military spending in the wake of the Islamic State in Iraq and Syria (ISIS) onslaught.
Tight oil producers in the U.S. have proven more resilient to oil price reductions than many experts expected (Sharma, G.; Ashton, G.). However, there will likely be a more measurable impact in 2016 as finance has dried up and well drilling has decreased. The impact could be substantial as tight oil fields have higher decline rates than conventional oil fields and are in constant need of well drilling to maintain production (IHS 2016). Still, U.S. tight oil producers constitute a new flexible element in oil markets and have the ability to provide a market based spare capacity. Unlike other unconventional sources such as deep-sea oil or tar sands, they have lower costs of production (some below USD50 per barrel) and the ability to quickly ramp up production when prices recover (Wells, P.). The short turnaround time from drilling a well to production (in some cases 3 months in total) allows tight oil producers to react to market demands (U.S. Energy Information Administration, 2015 (d)). Additionally, drilled but uncompleted wells in existing production zones can be brought online or left uncompleted depending on global prices and overall production declines from other tight oil wells (Nülle, G.). The United States thus has the potential to become an important swing producer alongside Saudi Arabia.
The adaptability of U.S. tight oil producers in the face of low prices has created problems for the major hydrocarbon exporters. Their fiscal breakeven prices are below current oil price levels and they are facing serious budgetary shortfalls (see Table 1.1). The social contract and legitimacy in oil producing states of the Gulf, Iraq, Iran and Algeria crucially depends on oil financed government spending. Other countries such as Egypt benefit indirectly from oil revenues via transfer payments and remittances. The budgetary situation in Russia, Kazakhstan, Azerbaijan, Nigeria, Angola and Gabon has also been negatively affected.

Policy Department, Directorate-General for External Policies
18
Table 1.1: Estimates of fiscal breakeven prices of selected oil producers (USD per barrel of oil (Brent), January 2016)
Libya 208
Venezuela 111
Bahrain 105
Oman 98
Saudi Arabia 96
Algeria 93
Russia 85
Iraq 76
Nigeria 75
Iran 70
UAE 68
Qatar 58
Kuwait 52
Source: Bentley, Minczeski, and Juan, 2016
If the price war of Saudi Arabia and other OPEC members has failed to decisively cripple the U.S. tight oil industry so far, it has had a more measurable impact on other unconventional oil supplies, such as ultra-deep water wells and arctic projects (Wells, P.). If investment in exploration and production expansion continues to fall, the world may again find itself in a tight oil market with higher prices. In such a market OPEC could be more relevant again.
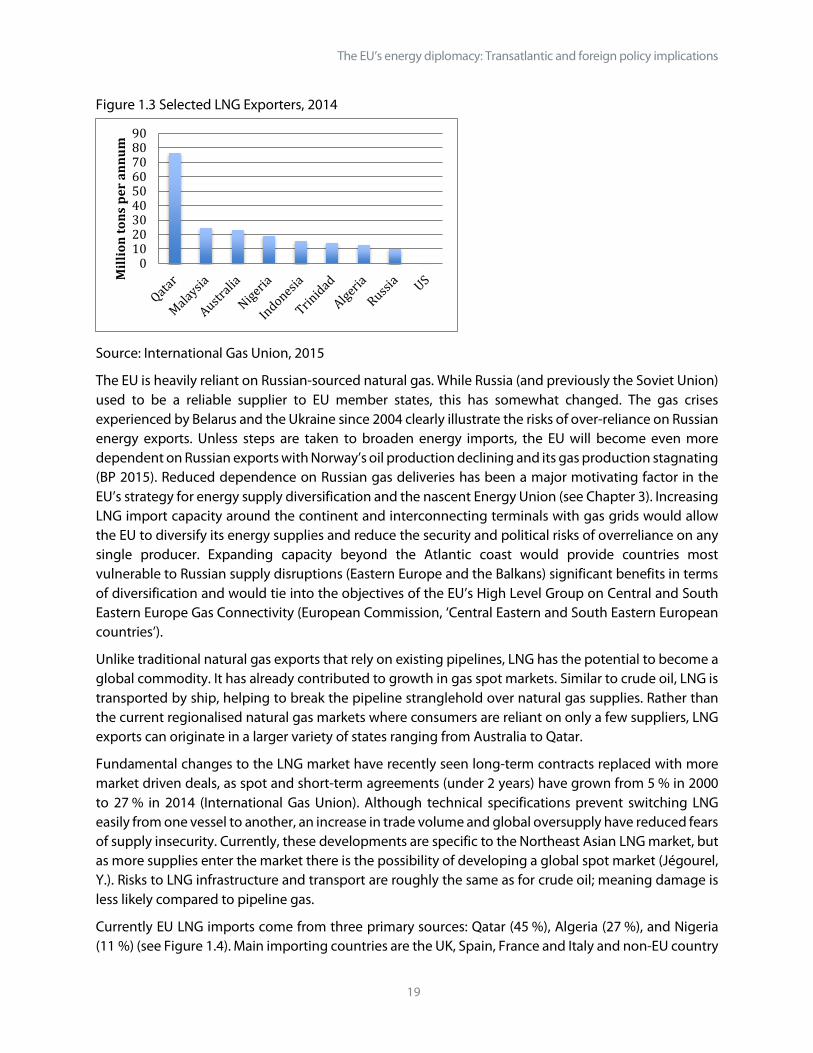
1.4 Liquefied natural gas (LNG) markets LNG4 imports can be expected to be a major source of energy supply diversity over the coming decades. The LNG share of global gas supplies has grown from 4 % in 1990 to 10 % today. Its share in global gas trade has grown from a quarter to a third over the last decade. At 7 %, the annual growth rate of LNG trade is far higher than for pipeline gas (4 %) and domestically consumed natural gas (2 %) (International Gas Union; Coote, B.). LNG trade is expected to grow by almost 50 % by 2020, led by growth in the U.S. and Australia. This is remarkable, as the U.S. does not play a role in global LNG markets so far (see Figure 1.3).
4 Liquefied Natural Gas (LNG) is natural gas that has been cooled to -162ºC, shrinking more than 600 times in volume. It differs from regular natural gas only in that it has had certain compounds (such as helium, heavier hydrocarbon compounds, and water) removed to make its transport safer. When LNG is imported, it first must be processed at regasification facilities. This step poses as a potential bottleneck and illustrates the importance of adequate import capacity. After the regasification process it can then be transported through the traditional natural gas pipeline network.
The EU’s energy diplomacy: Transatlantic and foreign policy implications
19
Figure 1.3 Selected LNG Exporters, 2014
Source: International Gas Union, 2015
The EU is heavily reliant on Russian-sourced natural gas. While Russia (and previously the Soviet Union) used to be a reliable supplier to EU member states, this has somewhat changed. The gas crises experienced by Belarus and the Ukraine since 2004 clearly illustrate the risks of over-reliance on Russian energy exports. Unless steps are taken to broaden energy imports, the EU will become even more dependent on Russian exports with Norway’s oil production declining and its gas production stagnating (BP 2015). Reduced dependence on Russian gas deliveries has been a major motivating factor in the EU’s strategy for energy supply diversification and the nascent Energy Union (see Chapter 3). Increasing LNG import capacity around the continent and interconnecting terminals with gas grids would allow the EU to diversify its energy supplies and reduce the security and political risks of overreliance on any single producer. Expanding capacity beyond the Atlantic coast would provide countries most vulnerable to Russian supply disruptions (Eastern Europe and the Balkans) significant benefits in terms of diversification and would tie into the objectives of the EU’s High Level Group on Central and South Eastern Europe Gas Connectivity (European Commission, ‘Central Eastern and South Eastern European countries’).
Unlike traditional natural gas exports that rely on existing pipelines, LNG has the potential to become a global commodity. It has already contributed to growth in gas spot markets. Similar to crude oil, LNG is transported by ship, helping to break the pipeline stranglehold over natural gas supplies. Rather than the current regionalised natural gas markets where consumers are reliant on only a few suppliers, LNG exports can originate in a larger variety of states ranging from Australia to Qatar.
Fundamental changes to the LNG market have recently seen long-term contracts replaced with more market driven deals, as spot and short-term agreements (under 2 years) have grown from 5 % in 2000 to 27 % in 2014 (International Gas Union). Although technical specifications prevent switching LNG easily from one vessel to another, an increase in trade volume and global oversupply have reduced fears of supply insecurity. Currently, these developments are specific to the Northeast Asian LNG market, but as more supplies enter the market there is the possibility of developing a global spot market (Jégourel, Y.). Risks to LNG infrastructure and transport are roughly the same as for crude oil; meaning damage is less likely compared to pipeline gas.
Currently EU LNG imports come from three primary sources: Qatar (45 %), Algeria (27 %), and Nigeria (11 %) (see Figure 1.4). Main importing countries are the UK, Spain, France and Italy and non-EU country
0102030405060708090
Mill
ion
tons
per
ann
um

Policy Department, Directorate-General for External Policies
20
Turkey (see Figure 1.5). Import capacity at the start of 2016 stands at 191 bcm, for reference, the EU as a whole utilised 386.9 bcm of natural gas during 2014 with LNG comprising only 10 % of all natural gas consumed (BP Statistical Review, 2015).
Figure 1.4: European sources of LNG imports (excluding re-exports), % share 2014
Source: Papa, C., 2015
Figure 1.5: European LNG import countries, 2014 (% share)
Source: Papa, C., 2015
In 2014, OPEC countries provided over 83 % of European LNG imports. Paired with crude oil and traditional natural gas imports, the EU is heavily reliant on Russian and GCC energy exports. The geopolitical risks and the threat of supply disruptions associated with both areas could be alleviated by the emerging possibility of LNG exports from the US. Yet a word of caution is in order, any change would likely be gradual only. U.S. exports would grapple with considerable transportation costs that could make them uncompetitive with pipeline gas from Russia, if only commercial considerations entered the
Qatar45%
Algeria27%
Nigeria11%
Trinidad&Tobago
6%
Norway5%
Peru3%
Other3%
UK26%
Spain25%Turkey
17%
France14%
Italy10%
Portugal3%
Belgium3%
Netherlands1% Greece
1%

The EU’s energy diplomacy: Transatlantic and foreign policy implications
21
equation. However, the geopolitical benefits of supply diversification might make such commercial risks worth taking. Utilising current import facilities while boosting gas interconnector capacity will also grant the EU a stronger bargaining position with its traditional suppliers. Growth of natural gas in EU countries with a high share of coal in their energy mixes (see Chapter 3.6) could also synergise environmental goals amongst member states.
1.5 The future of nuclear power in the EU The future of nuclear power as a major European energy source is currently put in question. France and Germany alone produce more than 60 % of the EU’s nuclear energy (BP Statistical Review, 2015). With Germany’s announcement to phase out nuclear power by 2022, the EU’s largest energy consumer has effectively abandoned nuclear power (World Nuclear Association, 2016). Additionally, the average age of France’s 58 reactors is 30 years (World Nuclear Association 2015 (c)). Maintaining a commitment to nuclear energy would require investments in a new generation of reactors to replace decommissioned plants. France is actively involved in Generation III and Generation IV reactor research and design. However, only Finland, France, and Slovakia have nuclear plants currently under construction and these new units will not offset the losses from decommissioning old reactors (World Nuclear Association 2015 (a)). In fact, all three projects have suffered from delays and cost overruns that have further diminished the attractiveness of investing in new plants.
An additional concern in the coming years is a rarely discussed aspect of nuclear power: uranium supplies. Future nuclear fuel concerns for ongoing nuclear power generation are often overlooked. Much like oil and natural gas, large uranium deposits are dispersed unevenly, with Australia, Kazakhstan, the Russian Federation, Canada, and Niger possessing significant amounts of low and medium cost uranium (OECD NEA, p. 19, see Figure 1.4).
Figure 1.6 Known recoverable resources of uranium 2013, % share of global total
Source: World Nuclear Association 2015b
Uranium in low concentration is plentiful and can be even found in seawater, but higher ore grades are rare and increased mining costs have reduced the viability of supplies. Most new (unconventional) discoveries have been associated with higher production costs, for example in Jordan, Mexico and Sweden (OECD NEA, p. 34ff). With the completion of the Megatons to Megawatts Program between the
05
101520253035
%
Policy Department, Directorate-General for External Policies
22
U.S. and the Russian Federation in 2013, there has been a reduction in nuclear fuel supplies from secondary sources (OECD NEA, p. 107). Uranium production has been significantly below global demand since the end of the Cold War, due primarily to the availability of these secondary supplies that met excess demand (primarily stockpiles and reprocessed weapons material). The drop in available secondary sources and demand growth from new Chinese and Indian plants could cause supply bottlenecks:
‘Maintaining production at the level required to meet reactor requirements in the coming years, particularly in light of increased production costs and declining market prices for uranium […] will be a challenge’ (OECD NEA, p. 126).
Timely implementation of reprocessing and fast breeder facilities that could stretch the lifetime of existing fuels is unlikely for technical, economic and security reasons. The associated technologies are not mature, saddled with limited commercial viability and entail the risk of plutonium proliferation. Hence, mine supplies will need to rise, especially of high grade uranium, whose relative scarcity has led to concerns about the long-term viability of nuclear energy because the energy needs of enriching low-grade uranium could outstrip actual energy generation in nuclear power plants (Energy Watch Group).
Feedstock concerns are also exemplified by the importance that emerging producers of civilian nuclear energy such as Iran and the United Arab Emirates (UAE) attribute to long-term delivery contracts with international providers and to domestic mine supplies (Woertz, E., 2014).
1.6 Climate change policies, renewables and the future of coal Coal supplies do not immediately conjure geopolitical concerns, but it is second only to oil as an energy source; in 2014, coal comprised 30 % of global energy consumption (BP Statistical Review 2015). It is also the dirtiest source of energy and a major concern in climate change policies. It releases almost double the amount of CO2 as natural gas to produce the same amount of energy (U.S. Energy Information Administration, ‘How much carbon dioxide’). Over the past decade coal demand has grown aggressively, with a 4.2 % annual average growth rate driven primarily by Chinese and Indian energy demands (International Energy Agency, 2015 (a)).
Low oil and natural gas prices paired with China’s focus on reducing emissions saw global coal demand growth come to a halt in 2014 for the first time since the early 1990s (International Energy Agency, 2015 (a)). Like other fossil fuels, coal prices are predicted to remain low in the short-term, as excess export capacity and tepid Asian demand has resulted in a global oversupply. Future growth is expected to continue, albeit at a lower rate, as predicted Indian and Southeast Asian demand compensates for declines in the U.S. and Europe while Chinese demand levels off (International Energy Agency, 2015 (a)).
Coal has historically been an important energy source, with the EU tracing its formation back to the European Coal and Steel Community. The European energy mix changed dramatically in the post-war decades. By the 1970s, it had become more oil-based. Coal also lost ground to natural gas, first slowly via North African LNG supplies in the 1960s, then more substantially with Soviet deliveries in the 1970s and the extraction of natural gas from the North Sea in the 1980s (Yergin, D.). Differences in domestic responses to the 1970s oil crises led to different energy mixes in the European countries. These in turn dictate member countries’ climate change policy aims and preferences today.
Coal still plays an important role in EU energy consumption, particularly in Central and Eastern European member states, such as Estonia, Poland and Czech Republic. Remembering their past under Soviet

The EU’s energy diplomacy: Transatlantic and foreign policy implications
23
tutelage these countries are reluctant to replace domestic coal with Russian supplied natural gas and they are wary to phase out coal due to domestic pressures exerted by the labour unions (Baumann, F. and Simmerl, G.). Thus there is a large divide between Eastern and Southeastern members on one side advocating for coal, while Western and Northern European member states are focused more on emission reductions and natural gas. Based on BP’s most likely energy growth scenario, coal in the EU would be overtaken by renewables in 2024, with overall coal-based electricity production expected to fall 55 % by 2035 (BP 2015).
Globally, the IEA expects renewables to account for half of additional power generation until 2040, overtaking coal as the largest power source around 2030 (International Energy Agency, 2015 (d)). Two-thirds of renewable electricity generation growth is predicted to come from developing countries over the next five years. Technological developments and cost declines have driven growth and made renewables competitive in certain markets (International Energy Agency, ‘Renewables’). Wind and solar will be the main drivers of growth. The challenge of renewables is not so much cost anymore, but intermittency. Expansion of and breakthroughs in storage solutions such as electric cars, pump storage and batteries and integrated smart grids that allow swing consumers to enter and exit the market flexibly could increase the expansion of renewables dramatically. In the long run this could be a game changer greater than the shale revolution. Costs for lithium-ion batteries decreased by 65 % between 2010 and 2015 alone (Bloomberg New Energy Finance). Bloomberg New Energy Finance expects electric vehicles to make up 35 % of new car sales by 2040, causing a crude oil demand reduction of 13mbpd. Countries like Chile, Bolivia and Argentina with large silicon reserves would be crucial in providing raw materials for such an expansion.
Government incentives traditionally encouraged clean energy technology in Japan and Europe, but new initiatives in China and the U.S. have recently made both major players in wind and solar development (International Energy Agency, ‘Renewables’). The U.S.is home to Tesla, the world’s leading electric car manufacturer that has recently also marketed batteries for electricity storage in homes. Progress in storage technologies could expand renewable energy usage in the U.S. This in turn could reduce domestic consumption of natural gas, oil and coal and lead to increased export potential in these items. It would also mean growing competitive pressure on European producers of renewable technologies. Besides reducing emissions, renewables could play a large role in energy security policies as a way for energy importers to reduce their reliance on overseas supplies. The IEA expects renewable sources to boost developing countries’ electricity generation capacity while leapfrogging the supply-security risks associated with oil and natural gas (International Energy Agency, ‘Renewables’).
Increased connectivity between the individual energy markets of member states is important to create a unified market. Efforts to shield domestic energy suppliers and sources, such as nuclear in France or coal in Poland, have impeded the synchronisation of energy markets and limited clean energy exports between member states (Oliver, C.). Linking domestic energy markets would help harmonise prices across member states and allow excess electricity generation from renewable sources to replace dirtier alternatives.
Thus the global energy landscape has changed considerably, from largely coal based after World War II to an oil dominated hydrocarbon mix in the 1970s and a diversified energy mix thereafter that includes nuclear energy and natural gas and increasingly renewables. While declining in relative importance, hydrocarbons still dominate in absolute terms. This raises questions about their supply security and how

Policy Department, Directorate-General for External Policies
24
the unconventional oil and gas revolution in the U.S. could offer additional import options for the EU. The following chapter will discuss this in greater detail.
The EU’s energy diplomacy: Transatlantic and foreign policy implications
25
2 The North Atlantic and the U.S. in the context of the changing energy landscape
2.1 Impact of the Unconventional natural gas revolution on U.S. gas supplies and its potential for LNG exports
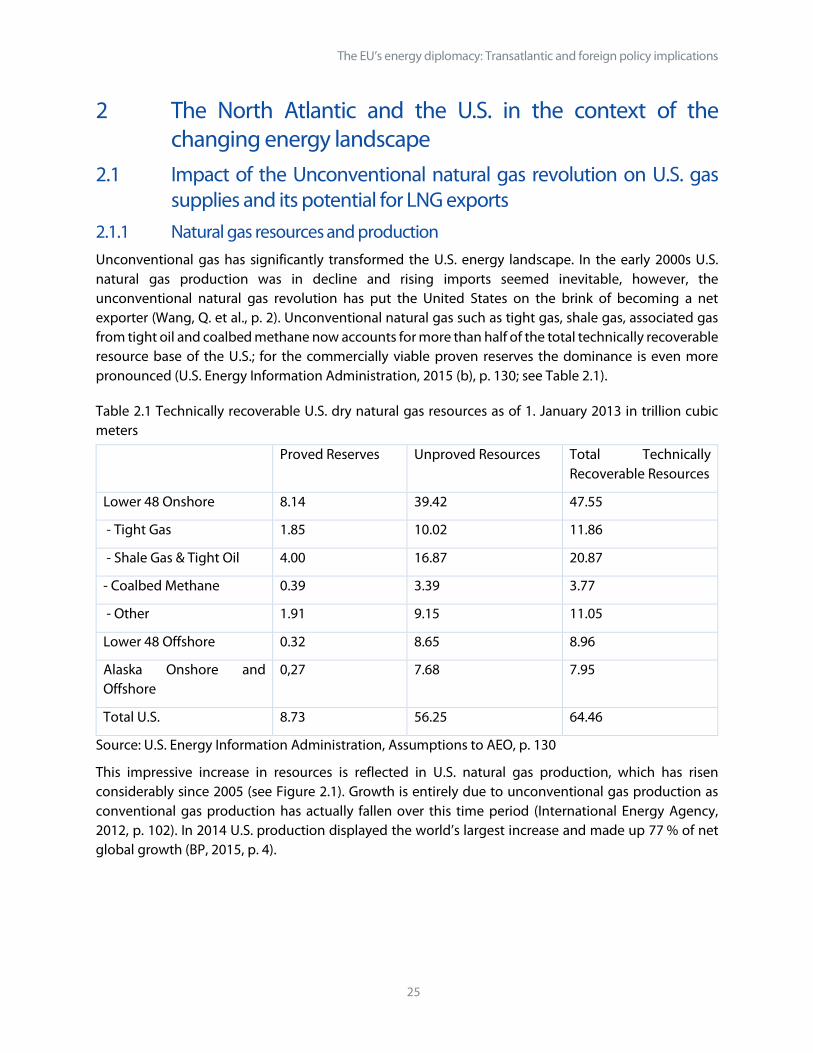
2.1.1 Natural gas resources and production Unconventional gas has significantly transformed the U.S. energy landscape. In the early 2000s U.S. natural gas production was in decline and rising imports seemed inevitable, however, the unconventional natural gas revolution has put the United States on the brink of becoming a net exporter (Wang, Q. et al., p. 2). Unconventional natural gas such as tight gas, shale gas, associated gas from tight oil and coalbed methane now accounts for more than half of the total technically recoverable resource base of the U.S.; for the commercially viable proven reserves the dominance is even more pronounced (U.S. Energy Information Administration, 2015 (b), p. 130; see Table 2.1).
Table 2.1 Technically recoverable U.S. dry natural gas resources as of 1. January 2013 in trillion cubic meters
Proved Reserves Unproved Resources Total Technically Recoverable Resources
Lower 48 Onshore 8.14 39.42 47.55
- Tight Gas 1.85 10.02 11.86
- Shale Gas & Tight Oil 4.00 16.87 20.87
- Coalbed Methane 0.39 3.39 3.77
- Other 1.91 9.15 11.05
Lower 48 Offshore 0.32 8.65 8.96
Alaska Onshore and Offshore
0,27 7.68 7.95
Total U.S. 8.73 56.25 64.46
Source: U.S. Energy Information Administration, Assumptions to AEO, p. 130
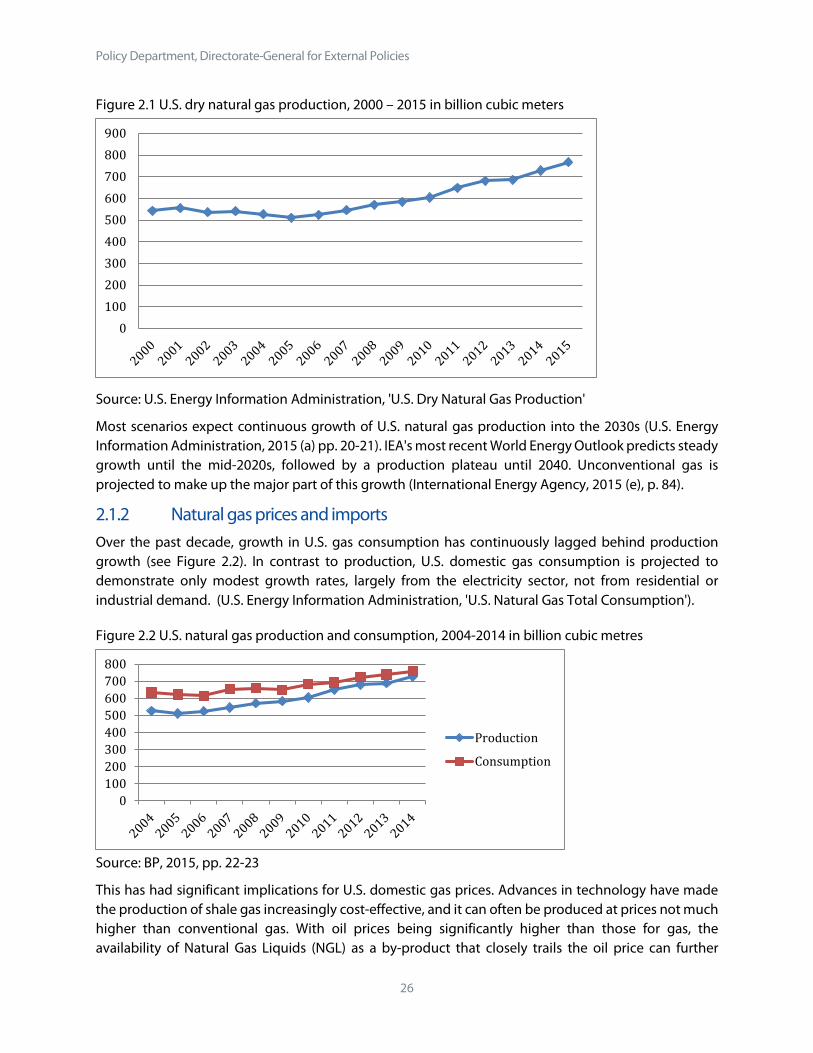
This impressive increase in resources is reflected in U.S. natural gas production, which has risen considerably since 2005 (see Figure 2.1). Growth is entirely due to unconventional gas production as conventional gas production has actually fallen over this time period (International Energy Agency, 2012, p. 102). In 2014 U.S. production displayed the world’s largest increase and made up 77 % of net global growth (BP, 2015, p. 4).
Policy Department, Directorate-General for External Policies
26
Figure 2.1 U.S. dry natural gas production, 2000 – 2015 in billion cubic meters
Source: U.S. Energy Information Administration, 'U.S. Dry Natural Gas Production'
Most scenarios expect continuous growth of U.S. natural gas production into the 2030s (U.S. Energy Information Administration, 2015 (a) pp. 20-21). IEA's most recent World Energy Outlook predicts steady growth until the mid-2020s, followed by a production plateau until 2040. Unconventional gas is projected to make up the major part of this growth (International Energy Agency, 2015 (e), p. 84).
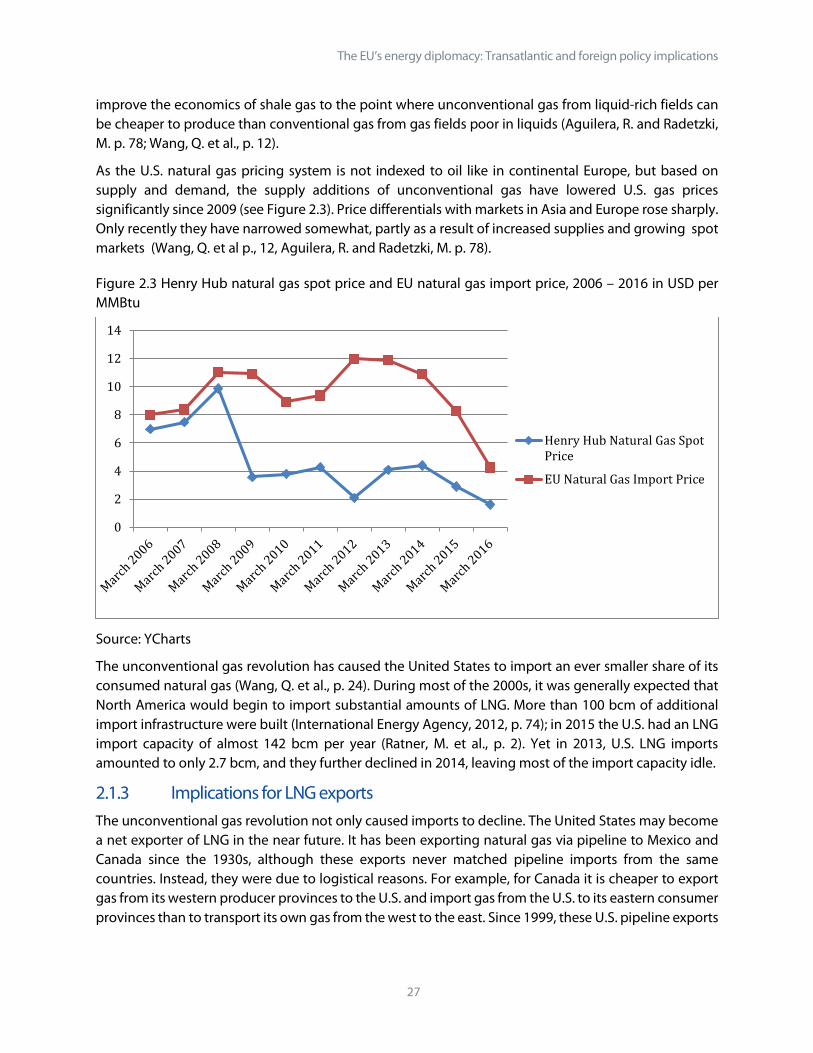
2.1.2 Natural gas prices and imports Over the past decade, growth in U.S. gas consumption has continuously lagged behind production growth (see Figure 2.2). In contrast to production, U.S. domestic gas consumption is projected to demonstrate only modest growth rates, largely from the electricity sector, not from residential or industrial demand. (U.S. Energy Information Administration, 'U.S. Natural Gas Total Consumption').
Figure 2.2 U.S. natural gas production and consumption, 2004-2014 in billion cubic metres
Source: BP, 2015, pp. 22-23
This has had significant implications for U.S. domestic gas prices. Advances in technology have made the production of shale gas increasingly cost-effective, and it can often be produced at prices not much higher than conventional gas. With oil prices being significantly higher than those for gas, the availability of Natural Gas Liquids (NGL) as a by-product that closely trails the oil price can further
0100200300400500600700800900
0100200300400500600700800
Production
Consumption
The EU’s energy diplomacy: Transatlantic and foreign policy implications
27
improve the economics of shale gas to the point where unconventional gas from liquid-rich fields can be cheaper to produce than conventional gas from gas fields poor in liquids (Aguilera, R. and Radetzki, M. p. 78; Wang, Q. et al., p. 12).
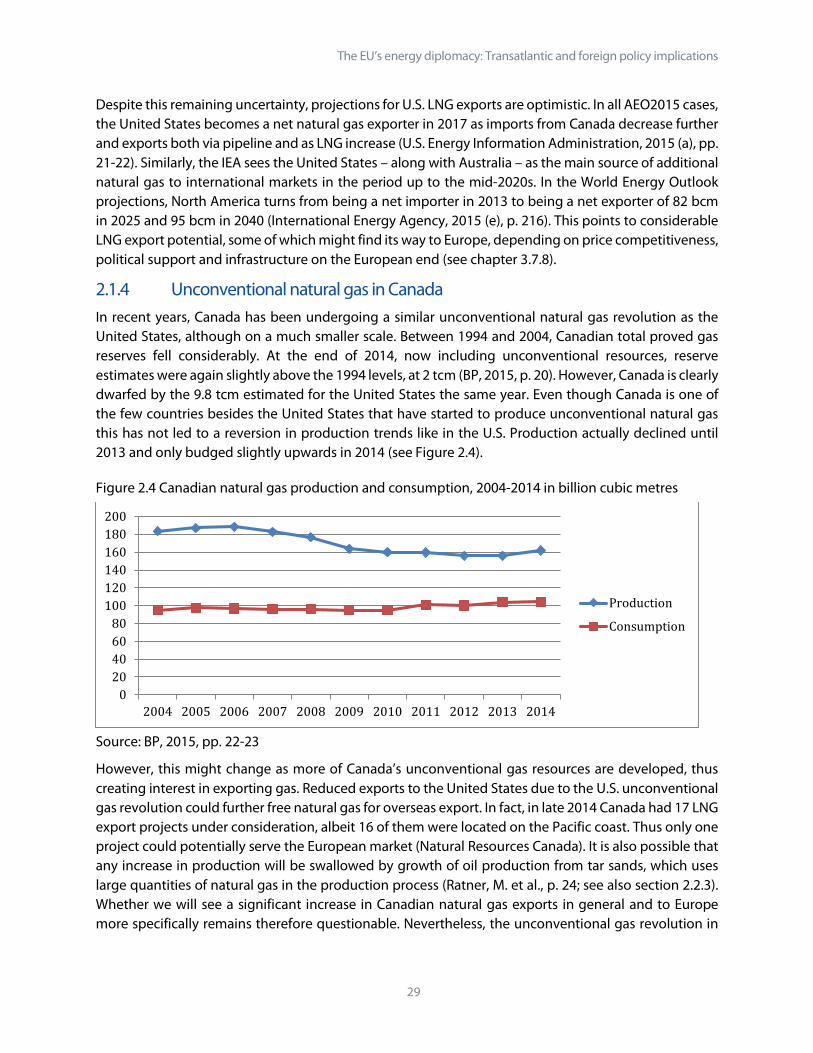
As the U.S. natural gas pricing system is not indexed to oil like in continental Europe, but based on supply and demand, the supply additions of unconventional gas have lowered U.S. gas prices significantly since 2009 (see Figure 2.3). Price differentials with markets in Asia and Europe rose sharply. Only recently they have narrowed somewhat, partly as a result of increased supplies and growing spot markets (Wang, Q. et al p., 12, Aguilera, R. and Radetzki, M. p. 78).
Figure 2.3 Henry Hub natural gas spot price and EU natural gas import price, 2006 – 2016 in USD per MMBtu
Source: YCharts
The unconventional gas revolution has caused the United States to import an ever smaller share of its consumed natural gas (Wang, Q. et al., p. 24). During most of the 2000s, it was generally expected that North America would begin to import substantial amounts of LNG. More than 100 bcm of additional import infrastructure were built (International Energy Agency, 2012, p. 74); in 2015 the U.S. had an LNG import capacity of almost 142 bcm per year (Ratner, M. et al., p. 2). Yet in 2013, U.S. LNG imports amounted to only 2.7 bcm, and they further declined in 2014, leaving most of the import capacity idle.
2.1.3 Implications for LNG exports The unconventional gas revolution not only caused imports to decline. The United States may become a net exporter of LNG in the near future. It has been exporting natural gas via pipeline to Mexico and Canada since the 1930s, although these exports never matched pipeline imports from the same countries. Instead, they were due to logistical reasons. For example, for Canada it is cheaper to export gas from its western producer provinces to the U.S. and import gas from the U.S. to its eastern consumer provinces than to transport its own gas from the west to the east. Since 1999, these U.S. pipeline exports
0
2
4
6
8
10
12
14
Henry Hub Natural Gas SpotPrice
EU Natural Gas Import Price

Policy Department, Directorate-General for External Policies
28
have grown and in 2012 increased more than 15-fold. Still, total U.S. natural gas exports remain relatively small and have not yet surpassed pipeline imports from Canada (Ratner, M., et al. p. 5; BP, 2015, p. 28).
However, this might be about to change. Unlike pipeline exports to Canada and Mexico, with which the United States has a free trade agreement (FTA), LNG exports to non-FTA countries require a much more complicated approval process, including authorisation from the Federal Energy Regulatory Commission (FERC) and the U.S. Department of Energy (DOE). The former is responsible for the regulation of natural gas import and export facilities. The latter has to determine whether the gas export is within the public interest – a concept that can be vague because of the lack of a clear working definition. So far, the DOE has not rejected any LNG export projects, but it has not always approved the full volume of sought exports. (Boersma, T., Ebinger, C. K. and Greenley, H. L.). In 2010, reacting to the number of LNG import facilities idling, the United States allowed foreign-sourced LNG to be re-exported to international markets. However, the low natural gas prices in the U.S. relative to other markets have also stimulated interest in exporting domestically produced natural gas. Thus, in addition to the re-exports, 48 applications for permits to either construct new LNG export facilities or convert liquefaction facilities at LNG import terminals had been submitted by January 2015 in order to export U.S.-sourced natural gas (Ratner, M. et al., pp. 3 and 5-6). Producers’ interest in exporting is clearly visible and likely to rise with increasing domestic natural gas production.
Exportation of LNG is also regarded as logistically feasible. After a comprehensive analysis of the prospects of U.S. LNG exports, Ebinger, Massy and Avasarala conclude that
‘[b]ased on current knowledge, the domestic U.S. natural gas resource base is large enough to accommodate the potential increased demand for natural gas from the electricity sector, the industrial sector, the residential and commercial sectors, the transportation sector, and exporters of LNG. Other obstacles to production, including infrastructure, investment, environmental concerns, and human capacity, are likely to be surmountable.’ (Ebinger, C., Massy, K., and Avasarala, G., p. 46).
Recent declines of international gas prices have however dampened the enthusiasm somewhat. In addition to the six LNG projects already under construction (see Table 3.4), there are 33 proposed projects in the United States. However, it is highly doubtful that all of these will actually be built. As the International Gas Union remarks, U.S. LNG exports' economics is based on the difference between a low Henry Hub price thanks to the unconventional gas revolution and a high oil-linked gas price elsewhere. With current low oil prices lowering gas prices where they are linked to oil, and a general loosening of the global LNG market, any projects that still have to make contracts face severe commercial risk (International Gas Union, p. 31; Coote, B., p. 1). One can reasonably expect to see U.S. LNG exports to increase in the near future, when the facilities under construction will come on line. Beyond that, however, prospects are somewhat unsure and depend largely on price developments in importing regions.
Furthermore, the likelihood of increased U.S. LNG exports depends on decisions made by politicians about whether or not to export LNG. Indeed, concern about rising domestic gas prices and energy security might cause the U.S. Government to restrict LNG exports (Stevens, P., 2012, p. 7), even though many experts agree that such worries are unfounded as price increases would be moderate and outweighed by economic benefits from LNG exports (Aguilera, R. and Radetzki, M. p. 79).
The EU’s energy diplomacy: Transatlantic and foreign policy implications
29
Despite this remaining uncertainty, projections for U.S. LNG exports are optimistic. In all AEO2015 cases, the United States becomes a net natural gas exporter in 2017 as imports from Canada decrease further and exports both via pipeline and as LNG increase (U.S. Energy Information Administration, 2015 (a), pp. 21-22). Similarly, the IEA sees the United States – along with Australia – as the main source of additional natural gas to international markets in the period up to the mid-2020s. In the World Energy Outlook projections, North America turns from being a net importer in 2013 to being a net exporter of 82 bcm in 2025 and 95 bcm in 2040 (International Energy Agency, 2015 (e), p. 216). This points to considerable LNG export potential, some of which might find its way to Europe, depending on price competitiveness, political support and infrastructure on the European end (see chapter 3.7.8).
2.1.4 Unconventional natural gas in Canada In recent years, Canada has been undergoing a similar unconventional natural gas revolution as the United States, although on a much smaller scale. Between 1994 and 2004, Canadian total proved gas reserves fell considerably. At the end of 2014, now including unconventional resources, reserve estimates were again slightly above the 1994 levels, at 2 tcm (BP, 2015, p. 20). However, Canada is clearly dwarfed by the 9.8 tcm estimated for the United States the same year. Even though Canada is one of the few countries besides the United States that have started to produce unconventional natural gas this has not led to a reversion in production trends like in the U.S. Production actually declined until 2013 and only budged slightly upwards in 2014 (see Figure 2.4).
Figure 2.4 Canadian natural gas production and consumption, 2004-2014 in billion cubic metres
Source: BP, 2015, pp. 22-23
However, this might change as more of Canada’s unconventional gas resources are developed, thus creating interest in exporting gas. Reduced exports to the United States due to the U.S. unconventional gas revolution could further free natural gas for overseas export. In fact, in late 2014 Canada had 17 LNG export projects under consideration, albeit 16 of them were located on the Pacific coast. Thus only one project could potentially serve the European market (Natural Resources Canada). It is also possible that any increase in production will be swallowed by growth of oil production from tar sands, which uses large quantities of natural gas in the production process (Ratner, M. et al., p. 24; see also section 2.2.3). Whether we will see a significant increase in Canadian natural gas exports in general and to Europe more specifically remains therefore questionable. Nevertheless, the unconventional gas revolution in
020406080
100120140160180200
2004 2005 2006 2007 2008 2009 2010 2011 2012 2013 2014
Production
Consumption

Policy Department, Directorate-General for External Policies
30
Canada does mean that Canada will likely remain a net exporter and U.S. exports will not be absorbed by its northern neighbour.
2.2 Impact of the unconventional oil revolution in the U.S. 2.2.1 U.S. oil reserves and production The unconventional oil revolution in the U.S. started in the late 2000’s with a few years delay compared to the unconventional gas revolution (Aguilera, R. and Radetzki, M. p. 77). Oil extractors realised that the new technologies used in the unconventional gas revolution could also be used to extract oil so far believed to be uneconomic, mainly light tight oil, as well as NGLs, which are extracted from liquid-rich shale gas (International Energy Agency, 2012, p. 84). Similarly to the unconventional gas revolution, the unconventional oil revolution caused estimates of U.S. reserves to be significantly raised and production to increase notably.
At the end of 1994, the U.S. was estimated to have 29.6 billion barrels of proved oil reserves. Over the course of the following decade, these declined continuously. However, at the end of 2014, this number had grown to 48.5 billion barrels (BP, 2015, p. 6). Between 2008 and 2013, oil production rose by 64 % (Aguilera, R. and Radetzki, M. p. 77). In 2014, the U.S. recorded the largest oil production growth in the world and it became the world’s largest liquids producer (incl. NGLs), ahead of Saudi Arabia (BP, 2015, p. 3; see Figure 2.5).
Figure 2.5 U.S. oil production and consumption (incl. NGL), 2004-2014 in million barrels daily
Note: numbers include NGL and are therefore higher than those of the EIA referred to below.
Source: BP 2015, pp. 8-9
Production growth is likely to continue in various scenarios of the IEA (International Energy Agency, 2012, p. 85; 2015 (c), p. 14). The EIA is even more optimistic: In its AEO2015 Reference case, oil production peaks at 10.6 mbpd (ca. 13.3 mbpd including NGLs) in 2020. This projection is not even much affected by lower oil prices as the Low Oil Price case demonstrates. In the High Oil and Gas Resource case production reaches a record 16.6 mbpd in 2039 (U.S. Energy Information Administration, 2015 (a), p. 18).
0
5
10
15
20
25
Production
Consumption
The EU’s energy diplomacy: Transatlantic and foreign policy implications
31
U.S. shale oil resources can be produced at lower costs than other unconventional oil resources such as Canadian tar sands or Brazilian ultra-deep crude. This has important implications for both, their growth prospects and oil prices. In the medium-term the U.S. unconventional oil industry is thus expected to be resilient, despite current investment cutbacks (International Energy Agency, 2015 (c), p. 14).
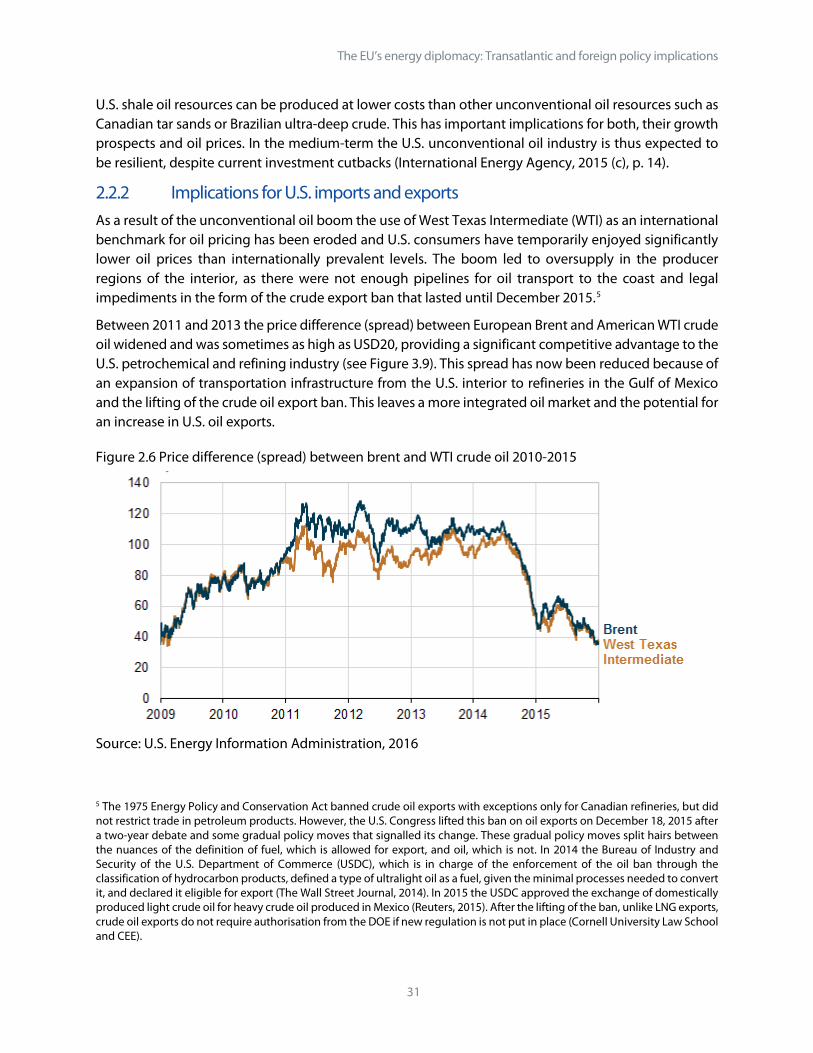
2.2.2 Implications for U.S. imports and exports As a result of the unconventional oil boom the use of West Texas Intermediate (WTI) as an international benchmark for oil pricing has been eroded and U.S. consumers have temporarily enjoyed significantly lower oil prices than internationally prevalent levels. The boom led to oversupply in the producer regions of the interior, as there were not enough pipelines for oil transport to the coast and legal impediments in the form of the crude export ban that lasted until December 2015.5
Between 2011 and 2013 the price difference (spread) between European Brent and American WTI crude oil widened and was sometimes as high as USD20, providing a significant competitive advantage to the U.S. petrochemical and refining industry (see Figure 3.9). This spread has now been reduced because of an expansion of transportation infrastructure from the U.S. interior to refineries in the Gulf of Mexico and the lifting of the crude oil export ban. This leaves a more integrated oil market and the potential for an increase in U.S. oil exports.
Figure 2.6 Price difference (spread) between brent and WTI crude oil 2010-2015
Source: U.S. Energy Information Administration, 2016
5 The 1975 Energy Policy and Conservation Act banned crude oil exports with exceptions only for Canadian refineries, but did not restrict trade in petroleum products. However, the U.S. Congress lifted this ban on oil exports on December 18, 2015 after a two-year debate and some gradual policy moves that signalled its change. These gradual policy moves split hairs between the nuances of the definition of fuel, which is allowed for export, and oil, which is not. In 2014 the Bureau of Industry and Security of the U.S. Department of Commerce (USDC), which is in charge of the enforcement of the oil ban through the classification of hydrocarbon products, defined a type of ultralight oil as a fuel, given the minimal processes needed to convert it, and declared it eligible for export (The Wall Street Journal, 2014). In 2015 the USDC approved the exchange of domestically produced light crude oil for heavy crude oil produced in Mexico (Reuters, 2015). After the lifting of the ban, unlike LNG exports, crude oil exports do not require authorisation from the DOE if new regulation is not put in place (Cornell University Law School and CEE).

Policy Department, Directorate-General for External Policies
32
In 2004, the U.S. imported 12.9 mbpd of oil. Imports were expected to continue to rise but instead peaked in 2007, just before the onset of the unconventional oil revolution, and dropped to 9.2 mbpd in 2014 (BP, 2015, p. 18, Duffield, J., p. 278). In 2013, the U.S. was replaced by China as the world’s largest net oil importer. While oil consumption declined somewhat in the 2004-2014 period, this decline is nowhere near the net-import decline (BP, 2015, pp. 3, 9 and 18). Thus, changes in imports can mainly be attributed to the unconventional oil revolution.
It is unlikely however, that reduced crude oil imports of the U.S. will translate into future net-exports to Europe. Because of the strength of the U.S. refining industry, peculiarities of different crude varieties and infrastructure bottlenecks, U.S. liquids exports will rather take the form of refined petroleum products and NGL, which have already seen a steep rise over the last years (see chapter 3.6.7).
The impact of the unconventional oil revolution in the United States on European crude imports is therefore mainly indirect: It puts pressure on global prices and leads to falling U.S. imports which frees crude oil elsewhere for exports to Europe. It also puts the U.S. in a position to act as a swing-producer, thus diminishing the importance of OPEC and particularly Saudi Arabia. Thanks to the price elasticity of U.S. shale oil we might also see smaller price fluctuations than in the past.
2.2.3 Unconventional oil in Canada Canada’s unconventional oil revolution is different form the on in the United States and began several years earlier. While in the U.S. the unconventional oil revolution revolves around light tight oil (LTO), which in many ways is similar to shale gas, LTO is insignificant in Canada. Instead, Canadian tar sands have revolutionised Canada’s oil prospects in the early 2000s. While in 1994 Canada’s total proved oil reserves were estimated to be 48.1 billion barrels, by 2004 this number had jumped to 179.6 billion barrels. Over the last years Canadian oil production gained speed and reached record levels in 2014 (BP, 2015, pp. 3 and 6; see Figure 2.6).
Figure 2.7 Canadian oil production and consumption, 2004-2014 in million barrels daily
Source: BP, 2015, pp. 8-9
Future expansion might be hampered by relatively high commercial break-even prices and lacking transportation infrastructure to export outlets on the coasts (see chapter 3.6.7). Overall, Canada can be
00.5
11.5
22.5
33.5
44.5
5
2004
2005
2006
2007
2008
2009
2010
2011
2012
2013
2014
Production
Consumption
The EU’s energy diplomacy: Transatlantic and foreign policy implications
33
expected to continue to export oil. If oil prices recover and infrastructure restraints can be overcome, we may even see Canadian exports to increase significantly in the medium-term. This would have considerable implication for climate change mitigation policies as oil production from Canadian tar sands, like tight oil in the U.S., has substantially higher greenhouse gas emissions than conventional oil production.
2.3 U.S. coal exports and their possible future development 2.3.1 Current coal reserves, production and usage Coal plays an important part in the U.S. energy landscape and is one of its major energy exports. While it has not experienced any supply revolution, it is impacted by the unconventional gas revolution. The United States is a mature coal producer; the general geology of its coal reserves is well known and the most promising resources have been developed (Höök, M. and Aleklett, K., p. 201). U.S. total proved coal reserves are about one quarter of global reserves. At current production rates, they would last for 262 years (BP, 2015, p. 30; see Table 2.2). The United States is thus the holder of the world’s largest estimated recoverable coal reserves and after China both the second-largest producer and consumer of coal (Ahmed, G. et al. p. 88). Nevertheless, over the last decade both coal production and consumption have fallen (see Figure 2.7).
Table 2.2 Total proved coal reserves and production of major producers, 2014
Total Proved Reserves (million tonnes)
Share of total
Production (million tonnes oil equivalent)
Share of total
Reserves to Production Ratio
United States 237295 26.6 % 507.8 12.9 % 262
Russian Federation
157010 17.6 % 170.9 4.3 % 441
South Africa 30156 3.4 % 147.7 3.8 % 116
Australia 76400 8.6 % 280.8 7.1 % 155
China 114500 12.8 % 1844.6 46.9 % 30
India 60600 6.8 % 243.5 6.2 % 94
Indonesia 28017 3.1 % 281.7 7.2 % 61
Source: BP, 2015, pp. 30 and 32
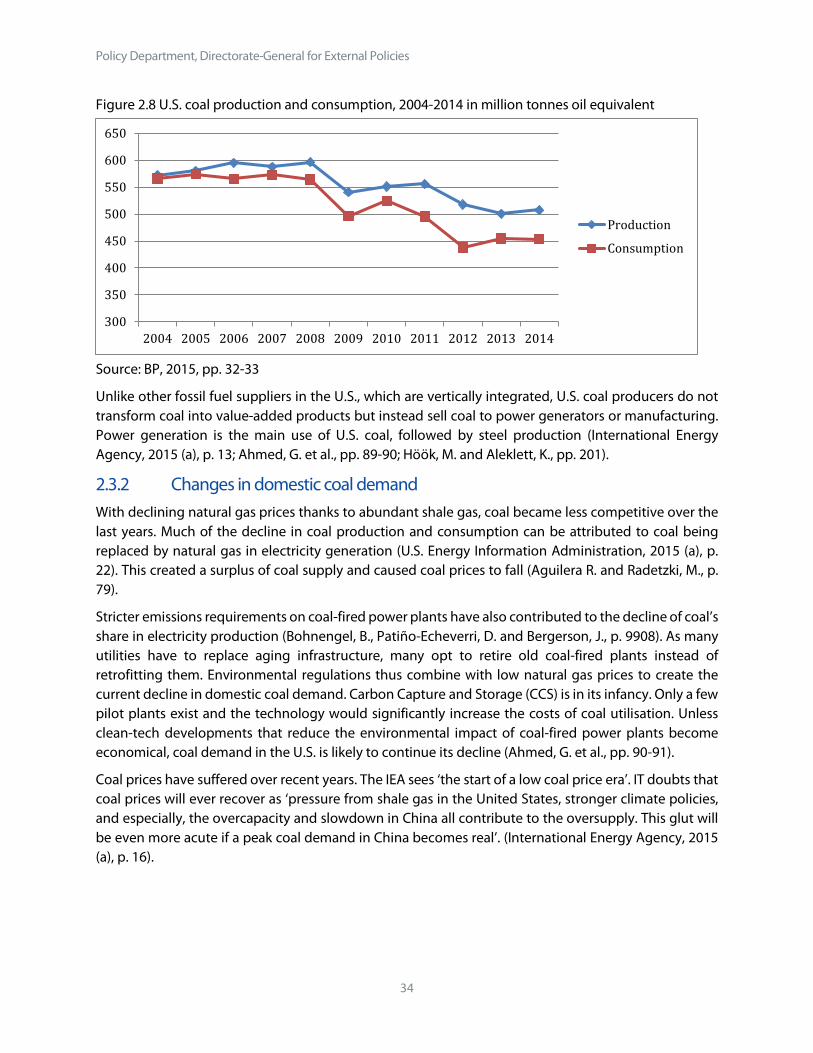
Policy Department, Directorate-General for External Policies
34
Figure 2.8 U.S. coal production and consumption, 2004-2014 in million tonnes oil equivalent
Source: BP, 2015, pp. 32-33
Unlike other fossil fuel suppliers in the U.S., which are vertically integrated, U.S. coal producers do not transform coal into value-added products but instead sell coal to power generators or manufacturing. Power generation is the main use of U.S. coal, followed by steel production (International Energy Agency, 2015 (a), p. 13; Ahmed, G. et al., pp. 89-90; Höök, M. and Aleklett, K., pp. 201).
2.3.2 Changes in domestic coal demand With declining natural gas prices thanks to abundant shale gas, coal became less competitive over the last years. Much of the decline in coal production and consumption can be attributed to coal being replaced by natural gas in electricity generation (U.S. Energy Information Administration, 2015 (a), p. 22). This created a surplus of coal supply and caused coal prices to fall (Aguilera R. and Radetzki, M., p. 79).
Stricter emissions requirements on coal-fired power plants have also contributed to the decline of coal’s share in electricity production (Bohnengel, B., Patiño-Echeverri, D. and Bergerson, J., p. 9908). As many utilities have to replace aging infrastructure, many opt to retire old coal-fired plants instead of retrofitting them. Environmental regulations thus combine with low natural gas prices to create the current decline in domestic coal demand. Carbon Capture and Storage (CCS) is in its infancy. Only a few pilot plants exist and the technology would significantly increase the costs of coal utilisation. Unless clean-tech developments that reduce the environmental impact of coal-fired power plants become economical, coal demand in the U.S. is likely to continue its decline (Ahmed, G. et al., pp. 90-91).
Coal prices have suffered over recent years. The IEA sees ‘the start of a low coal price era’. IT doubts that coal prices will ever recover as ‘pressure from shale gas in the United States, stronger climate policies, and especially, the overcapacity and slowdown in China all contribute to the oversupply. This glut will be even more acute if a peak coal demand in China becomes real’. (International Energy Agency, 2015 (a), p. 16).
300
350
400
450
500
550
600
650
2004 2005 2006 2007 2008 2009 2010 2011 2012 2013 2014
Production
Consumption
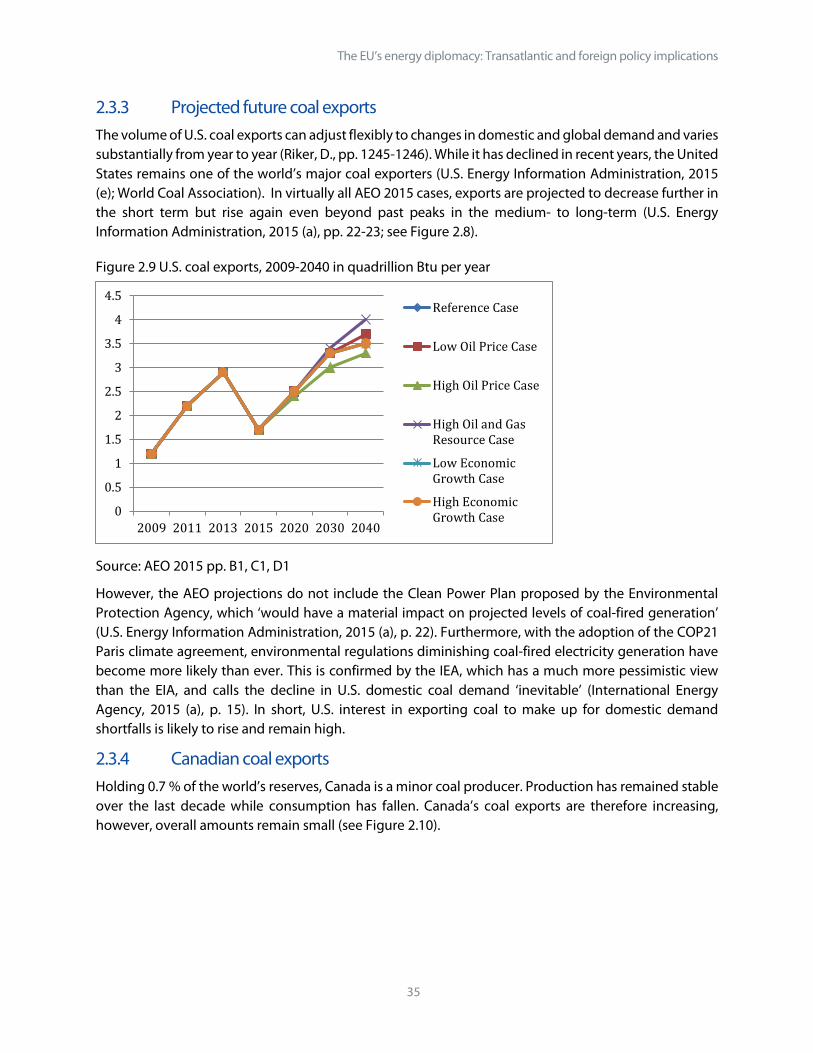
The EU’s energy diplomacy: Transatlantic and foreign policy implications
35
2.3.3 Projected future coal exports The volume of U.S. coal exports can adjust flexibly to changes in domestic and global demand and varies substantially from year to year (Riker, D., pp. 1245-1246). While it has declined in recent years, the United States remains one of the world’s major coal exporters (U.S. Energy Information Administration, 2015 (e); World Coal Association). In virtually all AEO 2015 cases, exports are projected to decrease further in the short term but rise again even beyond past peaks in the medium- to long-term (U.S. Energy Information Administration, 2015 (a), pp. 22-23; see Figure 2.8).
Figure 2.9 U.S. coal exports, 2009-2040 in quadrillion Btu per year
Source: AEO 2015 pp. B1, C1, D1
However, the AEO projections do not include the Clean Power Plan proposed by the Environmental Protection Agency, which ‘would have a material impact on projected levels of coal-fired generation’ (U.S. Energy Information Administration, 2015 (a), p. 22). Furthermore, with the adoption of the COP21 Paris climate agreement, environmental regulations diminishing coal-fired electricity generation have become more likely than ever. This is confirmed by the IEA, which has a much more pessimistic view than the EIA, and calls the decline in U.S. domestic coal demand ‘inevitable’ (International Energy Agency, 2015 (a), p. 15). In short, U.S. interest in exporting coal to make up for domestic demand shortfalls is likely to rise and remain high.
2.3.4 Canadian coal exports Holding 0.7 % of the world’s reserves, Canada is a minor coal producer. Production has remained stable over the last decade while consumption has fallen. Canada’s coal exports are therefore increasing, however, overall amounts remain small (see Figure 2.10).
0
0.5
1
1.5
2
2.5
3
3.5
4
4.5
2009 2011 2013 2015 2020 2030 2040
Reference Case
Low Oil Price Case
High Oil Price Case
High Oil and GasResource Case
Low EconomicGrowth Case
High EconomicGrowth Case

Policy Department, Directorate-General for External Policies
36
Figure 2.10 Canadian coal production and consumption, 2004-2014 in million tonnes oil equivalent
Source: BP, 2015, pp. 32-33
Again, from a European perspective the most important lesson from Canadian coal production and consumption figures is that Canada is unlikely to consume significant amounts of U.S. exports in the near- or mid-term.
2.4 U.S. energy security strategy 2.4.1 Official strategy papers Energy security is usually defined as the availability, reliability and affordability of energy (Elkind, J., p. 121). It has been a major issue in U.S. politics since the oil price shocks of the 1970s (Pascual, C. and Elkind, J., p. 1). For most of the time since then U.S. energy security concerns revolved primarily around the price and availability of oil. Policy responses of the early 2000s had still hardly progressed from those of the 1970s: increasing the size of the Strategic Petroleum Reserve, raising vehicle fuel economy standards, increasing domestic oil production and attempting to diversify fuels in use (Duffield, J., pp. 240-241).
More recently however, combating climate change has been added as a major issue influencing U.S. energy strategies, particularly since the publication of President Obama’s 2013 Climate Action Plan. In fact, in the current Department of Energy’s Strategic Plan, climate change is the single largest issue and encompasses almost all points raised. While oil price and availability remain important concerns, U.S. energy security strategy revolves around Obama’s ‘all of the above’ strategy, aiming at diversifying energy sources to the maximum. This includes the target to double renewable energy generation between 2012 and 2020, cutting carbon pollution from power plants, developing second-generation CCS technologies, advancements in nuclear energy and retrofitting the electricity grid to accommodate increased use of renewable energies (U.S. Department of Energy, pp. 4 and 8, Executive Office of the President, p. 6).
Energy efficiency and the Strategic Petroleum Reserve, while important issues since the oil price shocks, still feature prominently in the DOE’s Strategic Plan. The traditional issue of reducing oil import dependence is brought up as well through the goal to halve net oil imports by 2020. This is to be done by improving fuel economy in the transportation sector but also by increased deployment of electric vehicles and biofuels, as well as increased development of domestic petroleum and natural gas resources (U.S. Department of Energy, pp. 3, 5 and 8).
05
10152025303540
Production
Consumption
The EU’s energy diplomacy: Transatlantic and foreign policy implications
37
Internationally, the U.S. wants to promote usage of natural gas as a ‘bridge fuel’ around the world. It thus wants to encourage fuel-switching from coal to gas and promote the development of a global market for natural gas (Executive Office of the President, p. 19).
Surprisingly, the unconventional gas and oil revolution is rarely mentioned in either the DOE’s Strategic Plan or the Energy Security chapter of the National Security Strategy. Unconventional gas and oil are implicitly included in the Strategic Plan's frequent mentioning of the 'all of the above' strategy, which aims at enhancing all energy sources, which naturally includes unconventional sources. The DOE also plans to 'support safe and responsible deployment of domestic energy resources' which hints at unconventional gas and oil. More explicitly, the DOE wants to 'conduct research and development, data collection, modeling analysis and information dissemination programs to promote environmentally responsible development of unconventional domestic petroleum and natural gas resources.' Furthermore, increased domestic oil production is mentioned as a complementary measure to the Strategic Petroleum Reserve to respond to possible petroleum market supply disruptions. (U.S. Department of Energy, pp. 3, 5 and 8).
However, these are virtually the only references to unconventional gas and oil. Overall, the plan places much more emphasise on renewables and very much echoes Obama's Climate Action Plan. The same applies for the National Security Strategy. It names two energy-related topics among the eight security threats with the highest priority, climate change and major energy market disruptions, but does not highlight the unconventional oil and gas revolution prominently. Nevertheless, scholars agree that unconventional gas and oil will have significant implications for U.S. energy security strategies as reduced U.S. import dependence diminishes the petro-power of oil producers such as Venezuela, the Middle East and Russia (Medlock, K., Jaffe, A. and Hatley, P., pp. 12-13; Stevens, P., 2012, p. 7).
However, U.S. dependence on energy imports should not be confused with dependence on a steady flow of world energy trade at stable prices, which is untouched by the shale revolution. Because U.S. energy prices are shaped by world energy prices, crises affecting world prices also affect the U.S. economy, even if the U.S. was energy self-sufficient. Moreover, the U.S. depends heavily on the global economy’s health and on imports from countries, which in turn depend on oil imports. Through these indirect imports of petroleum U.S. strategic dependence on world petroleum trade will increase regardless of whether the U.S. becomes energy self-sufficient or not (Cordesman, A., pp. 3-4 and 6).
2.4.2 U.S. energy security strategy and the EU U.S. energy security strategies focus on the supply of energy to the U.S. and its domestic usage. The EU is a major energy importer rather than exporter and is not explicitly mentioned in the DOE’s Strategic Plan. However, the U.S. does not see its security obligations ending on its borders. In the energy security subchapter of the National Security Strategy, the U.S. is found to have ‘a significant stake in the energy security of our allies in Europe and elsewhere’:
‘[t]he challenges faced by Ukrainian and European dependence on Russian energy supplies puts a spotlight on the need for an expanded view of energy security that recognises the collective needs of the United States, our allies, and trading partners as well as the importance of competitive energy markets. Therefore, we must promote diversification of energy fuels, sources, and routes, as well as encourage indigenous sources of energy supply’ (National Security Strategy, p. 16).
Policy Department, Directorate-General for External Policies
38
This is again mentioned in the International Order subchapter, which recommends ‘working with Europe to improve its energy security in both the short and long term’ (National Security Strategy, p. 25).
European dependence on Russian energy imports is thus an important consideration in U.S. security strategies, especially since Russian aggression is named throughout the National Security Strategy as a major threat that needs to be countered by the U.S. Apart from supporting European attempts at diversifying fuels, sources, and transportation routes, scholars agree that the most important part the U.S. can play here is by becoming a source for European LNG imports (Ebinger, C., Massy, K. and Avasarala, G., pp. 41-42). This, as Medlock, Jaffe and Hatley put it, ‘will likely reduce Russia’s ability to unduly influence political outcomes’ and enhance U.S. interests ‘by buttressing Europe’s abilities to resist Russian interference in European affairs’. Generally, they find that ‘a more energy independent Europe will be better positioned to join with the United States in global matters that might not have the full support of Russia’ (Medlock, K., Jaffe, A. and Hatley, P., pp. 54-55).
This strategic position of the United States has already shown in recent comments of U.S. politicians on the German backed Nord Stream II pipeline that will supply natural gas directly from Russia to Germany via the Baltic Sea. U.S. Deputy Secretary for Energy Elizabeth Sherwood-Randall warned it would decrease energy security and supply diversity, and Richard Morningstar, former U.S. ambassador to the EU and Azerbaijan, said that the project could ‘kill the [European] LNG strategy’ (Crisp, J., 2016 a and b). During the opening press conference of the seventh session of the EU.U.S. Energy Council Secretary of State Kerry underlined that the Nord Stream 2 pipeline would be discussed and that he believes the project would have adverse impacts on Eastern Europe, even though the pipeline was not directly mentioned in the joint statement (see chapter 4.1).
If the U.S. decides to export LNG, this cannot be a direct tool of foreign policy as its destination will be determined by market forces. However, the existence of a new, market-based exporter will contribute to increasing gas supply diversity in Europe, a point that is in the interest of the United States and may influence the its decision about whether or not to allow LNG exports to Europe:
‘large increase in U.S. LNG exports would have the potential to increase U.S. foreign policy interests in both the Atlantic and Pacific basins. Unlike oil, natural gas has traditionally been an infrastructure-constrained business, giving geographical proximity and political relations between producers and consumers a high level of importance’ (Ebinger, C., Massy, K. and Avasarala, G., p. 43).
Therefore, LNG exports to the EU would likely increase U.S. strategic interest in good political relationships with the EU. These are important points that should be kept in mind when considering the United States as a possible additional supplier of LNG, and when considering U.S. positions on energy in the TTIP negotiations, discussed in chapter 3.

The EU’s energy diplomacy: Transatlantic and foreign policy implications
39
3 The EU’s energy security strategy 3.1 The emerging European energy security strategy in the 2000s Energy security issues have long been seen through the national lens of EU member states and have been informed by differences in energy mixes, import profiles, geographic locations and foreign policies. Apart from the Coal and Steel Community (est. 1951) and EURATOM (est. 1957), capacities and responsibilities at the EU level have been limited and the EU has tended to follow the IEA, an OECD institution, in the formulation of crises response policies, such as guidance on the administration of strategic petroleum reserves on a national level.
Until the Russian-Ukrainian disputes over gas prices in 2006 and 2009, concerns about energy security were not as pronounced within the EU as they are today. The European Security Strategy (ESS) that was adopted by the European Council in 2003 mentioned dependence on energy imports as an issue, but did not rank it among its five major security threats: Terrorism, Proliferation of Weapons of Mass Destruction (WMD), Regional Conflicts, State Failure, and Organised Crime (European External Action Service, 2008). In the review of the ESS in 2008 energy security, cyber security and climate change were upgraded in importance and mentioned as key threats in the ‘Report of the Implementation of the European Security Strategy: Providing Security in a Changing World’. It reckoned that by 2030 ‘up to 75 % of [EU] oil and gas will have to be imported […] from a limited number of countries’ (European External Action Service, 2008).
In 2004 countries from Central and Eastern Europe (CEE) joined the EU. For many of these new member countries energy security was already a pressing issue on the political agenda (Sedelmeier, U.). After the breakup of the Soviet Union Russia used energy exports to achieve foreign policy goals with a stick and carrot approach. It comprised favourable price scales for CIS and CEE countries that Russia deemed compliant with its foreign policy agenda, and energy supply disruptions for those that were seen in violation of Russian interests. Politically motivated Russian gas cuts to the Baltics occurred in the 1990s already. In the 2000s Russian politicisation of the energy trade grew in significance. Between 2000 and 2006 Russia cut off energy exports on about 40 occasions, mostly to CIS and CEE states (Grigas, A. 2012).
New levels of tension were reached in 2006 and 2009 during two consecutive Ukrainian gas crises. Indeed, the fallout from nearly a decade of Russian-Ukrainian tension over the management of the gas pipeline system that passes through the latter’s territory has been a significant motivating factor in the push for a new EU Energy Union, and has galvanised EU members into considering alternative energy supply sources that could replace the insecure transit route of Ukraine (European Commission, 2013 (c), p. 17). Officially the standoff revolved around subsidised prices of Russian gas and outstanding Ukrainian payments, but also reflected deterioration in relations between Russia and a country that had sought closer relationship with the EU. Thus, a series of disputes that started in 2005 between Russia’s largest gas supplier Gazprom and Ukraine’s state-owned oil and gas firm Naftohaz over the pricing and usage of gas destined for the EU via the brotherhood pipeline system (see Figure A1 in Annex) soon morphed into a full-blown geopolitical crisis. By January 2009 Russia completely stopped gas exports to Ukraine for almost three weeks, in one of the coldest months of the year (Pirani, S., pp. 2-3). At the time, the Brotherhood pipeline system transmitted around 300 million cubic metres or around 80 % of Russia’s natural daily gas exports to Europe. The shutdown of the pipeline denied EU-28 states access to the source of 30 % of their collective gas imports, and which led to the depletion of 20 % of reserve

Policy Department, Directorate-General for External Policies
40
gas supplies (European Commission, 2013c, 17). Several EU countries with high dependency on Russian gas found themselves in a suddenly precarious situation. Bulgaria and Slovakia in particular had no alternative gas supply source to draw upon, such that the latter was forced to declare a state of emergency in the face of rapidly dwindling reserves (Reuters, 2009). Several non-EU states were also severely affected, including Moldova, Serbia, Bosnia and the former Yugoslav Republic of Macedonia (FYROM).
Eventually a compromise was reached, but the dispute was a turning point for European energy security debates as it raised doubts over the reliability of Russia as a gas supplier and of Ukraine as a transit country (Pirani, S., et al., 2009). The reliability of Russian gas supplies and the need to create a united European stance in the energy partnership with Russia loomed large in the Green Paper: A European Strategy for Sustainability, Competitive and Secure Energy (2006). For the first time the EU proposed a ‘coherent external energy policy’ (p. 14), which was identified as one of six priority areas that included competitiveness of the internal energy market, climate friendly diversification of the energy mix, solidarity driven crisis management capacities, sustainable development and technological innovation.
Climate polices and implementation of an internal energy market have been two major pillars of European energy policy. The Lisbon Treaty of 2009 established important prerequisites for a common energy policy, defining it as the simultaneous pursuit of competitiveness, supply security and environmental sustainability, although it explicitly defined energy mixes and energy supply strategies as prerogatives of national sovereignty (Dreyer, I. and Stang, G., p. 51). The Third Energy Package of 2009 stipulated a separation of generation and marketing from transmission networks for gas and electricity markets. It aimed to increase competitiveness and to open up compartmentalised and monopolised national markets, especially in CEE countries, that have made them particularly vulnerable to supply disruptions. EU Regulation No. 994/ 2010 on security of gas supplies introduced common standards for infrastructure and consumer protection in the event of a crisis and the EU increasingly intervened in contract negotiations over energy supplies to ensure compliance with European competitiveness laws (e.g. Poland-Russia in 2010, suspension of South-Stream pipeline in 2014, possibly Nord Stream in the future) (Dreyer, I. and Stang, G., p. 54).
Increasing competitiveness by expansion of its rules based approach to energy issues has long been a hallmark of EU polices. The Energy Charter Treaty (ECT) of 1994 aims to secure production, trade and transit of energy based on WTO rules. It provides legally binding rules for its members to engage in cross border energy cooperation. However, membership of the ECT has remained largely European and producer nations have been reluctant to join (Dreyer, I. and Stang, G., p. 30). With the Energy Community treaty of 2006 between the EC and various countries on the Balkan, Moldova and Ukraine, these countries were drawn into the rules based orbit of the EU. Initially valid until July 2016, the Energy Community treaty has been extended until 2026. Its declared aim is ‘to extend the EU's internal energy market to South Eastern Europe and the Black Sea region’ (European Commission, ‘Energy Community’).
The year 2011 was decisive for EU energy policies. The EU Council set 2014 as date to achieve the single market in energy and called for stronger international efforts to achieve supply security via a coherent external energy policy. Then EU Commissioner for Energy, Guenther Oettinger, had called for such an upgrade of supply security as he and others within the EU administration felt that EU energy policies were too narrowly focused on climate policies (Oettinger, G., 2011). At the same time climate change policies were by no means neglected. In 2011 the EU adopted the 2050 Energy roadmap with the

The EU’s energy diplomacy: Transatlantic and foreign policy implications
41
ambitious target to reduce greenhouse gas emissions by 80 % to 95 % compared to their level in 1990 through low carbon technology, renewable energy and energy efficiency (European Commission, ‘2050 Energy strategy’).
Energy security has thus visibly moved up the priority scale of EU politics in the decade before the launch of the European Energy Union in 2014. Supply security in particular received increased attention. Efforts focused on three areas:
First, integration of EU gas and electricity markets and related investments in infrastructure such as storage facilities and interconnector pipelines (e.g. Projects of Common Interests, Connecting Europe Facility, Baltic Energy Market Interconnection Plan (BEMIP)).
Secondly, diversification of import supply routes (e.g. Southern Corridor plan of 2008 to source natural gas from Central Asia, the Caucasus and the Middle East, funding contribution to the MEDGAZ pipeline from Algeria to Spain that was completed in 2011).
Thirdly, external energy diplomacy and inclusion of energy in trade negotiations (e.g. with Ukraine, Georgia, Moldova and Morocco). The bilateral energy dialogue with the U.S.and the TTIP negotiations also fall into this bracket (see chapter 4.2), as well as legally non-binding declarations of energy with Iraq in 2011 and with China in 2012 (Dreyer, I. and Stang, G., p. 57).
3.2 The European energy security strategy and the 2030 climate and energy framework
The year 2014 saw the establishment of two important building blocks of the European Energy Union: The 2030 Climate and Energy Framework (CEF) and the European Energy Security Strategy (EESS). Three key targets for 2030 are at the heart of the CEF: greenhouse gas emissions have to be cut by at least 40 % compared to 1990 levels, renewable energies should have a share of at least 27 % and there has to be an improvement in energy efficiency of at least 27 %. It builds on the 2020 climate and energy package and is in line with strategies with a longer term perspective such as the Roadmap for moving to a competitive low carbon economy in 2050, the Energy Roadmap 2050 and the Transport White Paper (European Commission, ‘2030 Climate & Energy Framework’).
The 2014 European Energy Security Strategy (EESS) proposes internal and external measures. Internally it proposes a more unified energy market with interconnections and greater crisis management mechanisms to deal with temporary disruption of energy supplies. Externally it proposes diversification of fuels, supplies and transit routes. As part of the EESS energy stress tests were conducted in 38 European countries, including all EU members. They simulated two scenarios over a period of one month and six months each: a complete halt of Russian gas imports and a disruption of the Ukrainian transit route. The EESS is based on the following eight key pillars:
1) Immediate actions aimed at increasing the EU's capacity to overcome a major disruption during the winter 2014/2015;
2) Strengthening emergency and solidarity mechanisms, including coordination of risk assessments and contingency plans and protecting strategic infrastructure;
3) Moderating energy demand;
4) Building a well-functioning and fully integrated internal market;
Policy Department, Directorate-General for External Policies
42
5) Increasing energy production in the European Union;
6) Further developing energy technologies;
7) Diversifying external supplies and related infrastructure;
8) Improving coordination of national energy policies and speaking with one voice in external energy policy (European Commission, 2014c, p. 3).
Part and parcel of the emerging EESS is its inclusion in matters of foreign policy, the cultivation of contacts with established energy exporters and the search for supply diversification. The advent of the U.S. as a major energy exporter and an ambitious TTIP – if it were concluded - could be an important pillar of this strategy. To summarise, the EESS has the objective to secure alternative energy supplies to make the EU less vulnerable to energy imports from a single supplier, namely Russia. The means to achieve more secure energy supplies is closer integration and harmonisations of European energy markets and then closely intertwine these efforts with ‘more coherent external action’ (p. 3) to overcome dispersed national regulatory frameworks and interests.
3.3 The European energy union and energy diplomacy The 2030 Framework for Climate and Energy and the EESS were major steps towards the Energy Union that was launched in 2015 (European Commission, ‘Energy Union Fact Sheet’). In November 2014, under the 10-point priority Agenda for the European Commission (2014-2019), Jean Claude Juncker outlined his objective to develop ‘a resilient Energy Union with a forward-looking climate change policy’. Since February 2015 this objective is implemented by the Vice President of the Commission for the Energy Union, Maroš Šefčovič, and the Commissioner of Climate Action and Energy, Miguel Arias Cañete. As indicated by the name, the call for an Energy Union has the primary objective to achieve a fundamental transformation of the European energy system, away from a model of ‘a fragmented system characterised by uncoordinated national policies, market barriers and energy isolated areas’ to a model of an economy where energy policies are centralised through a fully integrated internal European energy market. The divide between energy rules that are set at the European level and 28 national regulatory frameworks is to be overcome (European Commission 2015b).
The Energy Union ‘is based on the three long-established objectives of EU energy policy: security of supply, sustainability and competitiveness’ that were already highlighted in the Treaty of Lisbon (European Commission 2015b, p. 4). In order to accomplish these objectives it focuses on five mutually supportive dimensions: (1) energy supply security, solidarity and trust; the (2) internal energy market; (3) energy efficiency as a contribution to the moderation of energy demand; (4) decarbonisation of the economy and climate action; and (5) research, innovation and competitiveness in low-carbon technologies (European Commission, ‘Energy Union Factsheet’).
A particular focus is on the diversification of external natural gas supplies, including a revision of the security of gas supplies regulation 994/ 2010, an expansion of LNG infrastructure and interconnector pipelines and partnerships with foreign suppliers - existing ones and potential ones such as the U.S.and Canada. Full compliance of Intergovernmental Agreements (IGA) over energy supplies from third countries has to be ensured (European Commission 2015b, p. 7). Funding of strategically important infrastructure is another priority and requires close cooperation with institutions like the European Investment Bank (EIB) and the establishment of new ones such as the proposed European Fund for Strategic Investments (EFSI). In terms of sustainability the EU aims to retain global leadership in climate
The EU’s energy diplomacy: Transatlantic and foreign policy implications
43
change mitigation by encouraging negotiations such as COP 21 as well as private investments in new infrastructures and new technologies to achieve emission reduction (Far, S. and Youngs, R.). In its first report on the State of the Energy Union in November 2015, the EC identifies three areas to achieve a ‘decarbonisation of the economy’: emission trading, renewables and further investments in low carbon technologies and energy efficiency (European Commission, ‘State of the Energy Union’, p. 2). The goal is to become ‘number one’ globally in renewable energies and treat energy efficiency as ‘a source in its own right’, increasing related investments five-fold by 2030 (p. 4-5).
A word of caution is in order, though. The Union’s objective is to ensure secure, affordable and climate-friendly energy. These objectives are not necessarily interconnected and in fact may oppose one another in some aspects of short, medium and long-term policy aspirations. Imports of unconventional oil and gas from North America for example might increase supply security, but such resources cause more carbon dioxide emissions than conventional hydrocarbons or renewable energies (Buchan, D.).
The importance of external supply security as part of the Energy Union was reinforced in July 2015 when the Council adopted the Energy Diplomacy Action Plan (Council of the European Union, 2015). It encourages institutions to work closely with the Commission and its member states to follow the objectives of the EESS and create a global climate friendly energy architecture. Furthermore the Diplomacy Plan agrees to use more funds and aid budgets for infrastructure and access to affordable and sustainable energy in ‘increasingly important [energy] producing and transit countries’ (European External Action Service, 2014; Far, S. and Youngs, R.). It thus acknowledges interests and problems of energy exporting countries and offers them investment and cooperation to promote stability and sustainable development. Additionally, the EU is advised to provide aid to promote energy efficiency and renewable energies in the countries it trades with.
For the EU Energy Diplomacy Action Plan the Commission outlined the following four pillars:
1) Strengthen strategic guidance through high-level engagement.
2) Establish and further develop energy cooperation and dialogues, particularly in support of diversification of sources, suppliers and routes.
3) Support efforts to enhance the global energy architecture and multilateral initiatives.
4) Strengthen common messages and energy diplomacy capacities (Council of the European Union, 2015 p. 5-8)
Beside environmental and climate issues the Diplomacy Plan stresses the importance of ‘diversification of sources, suppliers and routes’, mentioning in particular ‘the Southern Gas Corridor, the Southern Caucasus and Central Asia; the strategic potential of the Eastern Mediterranean region; the Euro-Mediterranean energy cooperation in the Southern Neighbourhood; the wider Middle East region [and] new energy sources in the Americas, Africa and Australia, including Liquefied natural Gas (LNG)’ (Council of the European Union, 2015 p. 3). It encourages diplomatic outreach to producer countries, including Russia, provided the relationship is reframed ‘on a level playing field in terms of market opening, fair competition, environmental protection and safety’ (p. 4). Promotion of energy efficiency standards in major consumer countries such as the U.S.and Canada, but also in the non-IEA countries China and India is another priority axis. The Diplomacy Action also mentions the propagation of nuclear safety standards in non-EU countries and points to the importance of multilateral initiatives on the UN, G7 and G20 level.

Policy Department, Directorate-General for External Policies
44
It mentions in particular the Sustainable Development Goals agenda of the UN, the IEA Association Initiative, the Energy Charter modernisation and the International Renewable Energy Agency (IRENA).
3.4 European aggregated energy mix and major supplier countries Energy mixes and major supplier countries have a profound impact on European energy strategy. Overall EU energy consumption across member states peaked in 2006 and has seen a slow decline since then. Through 2015 oil remains the dominant European energy source, representing 37 % of all energy consumed followed by natural gas with 22 % (BP, 2015). The role of coal in the energy mix varies depending on each member state’s circumstances, but still accounts for 17 % of total EU energy consumption. The share of nuclear energy is still 12 %, but will decline with Germany’s phase out of this energy source by 2022. Hydroelectric sources have a stable share of 5 %, while other renewables like solar and wind have a share of 7 %. This share is considerably higher in some member states like Denmark and Germany and has the potential to grow significantly in the future (see Figure 3.1).
Figure 3.1 EU energy sources % of total usage
Source: Eurostat, ‘Main origin of primary energy imports’, Simplified energy balances 2015
Roughly 40 % of all oil imports come from OPEC nations, with Saudi Arabia and Nigeria the most important suppliers from the organisation. Russia is the largest single supplier with 33.5 % (see Figure 3.2). Despite recent discoveries and slight production increases in 2014 and 2015, the share of Norway of 11.7 % can be expected to decline in the future as its oil production is mature. It peaked in 2001 and has about halved since then (BP, 2015).
Oil37%
Natural Gas22%
Coal17%
Nuclear12%
Renewables7%
Hydro-electric
5%

The EU’s energy diplomacy: Transatlantic and foreign policy implications
45
Figure 3.2 Supplier countries: % of total EU crude oil imports, 2013
Source: Eurostat, ‘Energy production and imports’, 2015
The primary natural gas exporters to the EU are Russia (39 %), Norway (30 %) and Algeria (13 %). With a share of 7 %, LNG exports from Qatar have developed into an important supply addition, particularly for the UK. The heavy reliance on only three suppliers, the predominance of Russia and the mature production profile of Norway are of concern and inform the need to diversify the EU supply base.
Figure 3.3 Supplier countries: % of total EU natural gas imports, 2013
Source: Eurostat, ‘Energy production and imports’, 2015
Main suppliers of EU coal imports in 2014 were Russia (29 %), the U.S. (22 %) and Colombia (22 %) (see Figure 3.4), so even here the EU is highly reliant on Russian exports. The same also applies to a degree for EU uranium imports. In 2013 they mainly came from Kazakhstan (27 %), Russia (18 %), Canada (17 %), Niger (15 %) and Australia (13.5 %) (World Nuclear Association 2015a).
Kazakhstan5.8% Nigeria
8.1%
Norway11.7%
Russian Federation
33.5%Saudi
Arabia8.6%
Other OPEC
23.3%
Others9.0%
Algeria13%
Libya2%
Nigeria2%
Norway29%
Qatar7%
Russian Federation
39%
Others8%
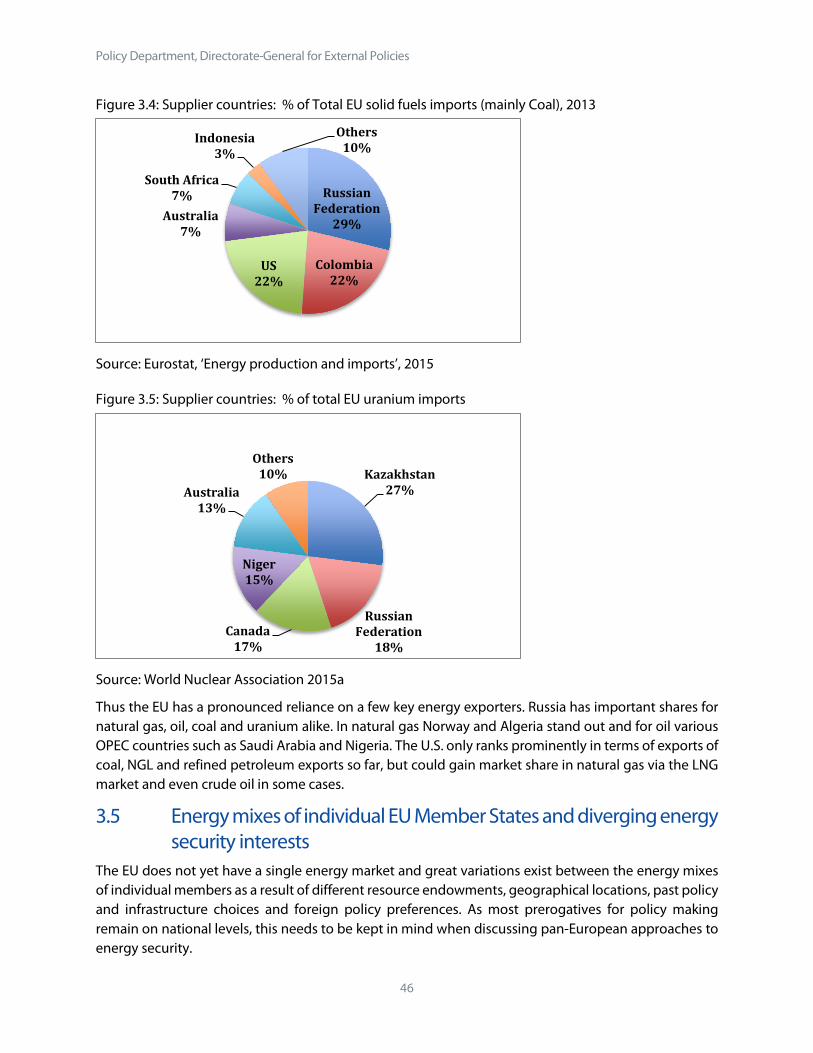
Policy Department, Directorate-General for External Policies
46
Figure 3.4: Supplier countries: % of Total EU solid fuels imports (mainly Coal), 2013
Source: Eurostat, ‘Energy production and imports’, 2015
Figure 3.5: Supplier countries: % of total EU uranium imports
Source: World Nuclear Association 2015a
Thus the EU has a pronounced reliance on a few key energy exporters. Russia has important shares for natural gas, oil, coal and uranium alike. In natural gas Norway and Algeria stand out and for oil various OPEC countries such as Saudi Arabia and Nigeria. The U.S. only ranks prominently in terms of exports of coal, NGL and refined petroleum exports so far, but could gain market share in natural gas via the LNG market and even crude oil in some cases.
3.5 Energy mixes of individual EU Member States and diverging energy security interests
The EU does not yet have a single energy market and great variations exist between the energy mixes of individual members as a result of different resource endowments, geographical locations, past policy and infrastructure choices and foreign policy preferences. As most prerogatives for policy making remain on national levels, this needs to be kept in mind when discussing pan-European approaches to energy security.
Russian Federation
29%
Colombia22%
US22%
Australia7%
South Africa7%
Indonesia3%
Others10%
Kazakhstan27%
Russian Federation
18%Canada
17%
Niger15%
Australia13%
Others10%

The EU’s energy diplomacy: Transatlantic and foreign policy implications
47
As the largest single energy consumer in the EU, Germany has a major impact on the bloc’s overall energy mix. In its Energiewende it has announced its intention to transition away from nuclear energy and hydrocarbons. Despite the expansion of renewable energies in the country, Germany is still heavily reliant on hydrocarbons with a share of over 80 % (see Figure 3.6). Oil comprises the largest single energy source, followed by coal and then natural gas . Only about 18 % of energy produced comes from non-carbon sources, with renewables playing the largest role. Germany’s announcement to phase out all nuclear power by 2022 will in the short-term further increase reliance on hydrocarbon sources to provide baseload electricity.
France has the second largest economy and energy consumption within the EU. Unlike many other members, it is far less reliant on imported fossil fuels. This is the result of a historical decision to focus on nuclear energy. In total France generates around 40 % of its overall energy consumption with nuclear power. Focusing on nuclear energy production has allowed the French Republic to export over 65.1 terawatt-hours (TWh) of electricity to neighbouring countries (World Nuclear Association 2015 (c)). Unlike Germany, France has asserted its commitment to nuclear energy for the foreseeable future. Oil is the second biggest energy component, comprising an additional 32 % of domestic consumption. Renewables and hydroelectric plants together combine for 9 %, highlighting the potential for growth in wind and solar over the coming decades.
Oil and natural gas consumption in the United Kingdom is roughly equivalent. Oil represents 37 % and natural gas 32 % of the overall energy mix. The UK is unique amongst EU members as it had a sizeable hydrocarbon endowment and was a significant energy exporter throughout the 1980s and 1990s. Declining production has turned it into a net energy importer over the course of the 2000s. While this energy mix was beneficial in the past, increasing reliance on imported oil and natural gas could become a liability.

Policy Department, Directorate-General for External Policies
48
Figure 3.6 Individual energy mixes of EU countries, 2014
Source: Chyong and Tcherneva, European Council on Foreign Relations, 2015
As a former Warsaw Pact country Poland’s historical energy development has differed greatly from its Western European neighbours. A full 95 % of Poland’s energy is derived from fossil fuels. Coal alone represents 55 % of all energy consumed. Transitioning away from coal to cleaner hydrocarbons (like natural gas) and renewables would greatly reduce Polish emissions and improve air quality. The Polish coal industry faces challenges of commercial viability. Switching from coal could endanger domestic jobs in the short-term, but a new focus on developing renewables and reducing investment in an unprofitable energy sector could pay long-term economic dividends.
Spain’s energy market remains disconnected from the rest of the European continent. Prime Minister Rajoy has referred to the Iberian Peninsula as an energy island (Viscusi, G. and Duarte, E.). Oil is by far the largest source, comprising 45 % of all energy consumed. The rest of the energy mix is evenly split between the remaining energy sources. One matter of growing importance is Spain’s 25 % share of total EU LNG import capacity (Papa, C.). Thus additional efforts to integrate the Iberian Peninsula into the wider European energy network are required if LNG is to play a more prominent role in Europe.
Like Spain, Italy is heavily reliant on oil for its energy needs. Italy’s reliance on hydrocarbon sources is similar to Germany with a full 81 % of energy consumption based on fossil fuels. The lack of any nuclear capacity means the country does not have to worry about replacing an aging nuclear fleet; it also means renewable sources must be the primary focus of energy growth to reduce hydrocarbon dependence. Wind power is particularly important, as Italy remains fifth amongst member states in wind energy

The EU’s energy diplomacy: Transatlantic and foreign policy implications
49
generation. The two-year consecutive decline in wind power installations between 2012 and 2014 must be reversed if energy imports are to be reduced (EWEA, 2015).
Unlike other EU members, Sweden’s two largest energy sources are not carbon based. Like in Austria, hydroelectric energy plays an important role with a share of 28 % of energy consumption and like France, Sweden has a substantial nuclear component in its energy mix with 29 %. Hydrocarbons only contributed 33 % of Sweden’s total energy consumption in 2014, with the overwhelming majority derived from oil. Efforts to renovate existing hydropower facilities and reduce their environmental impact on river systems have boosted overall electricity generation (Rudberg, P.). Additional developments to hydroelectric and renewable sources could shrink oil’s role further and allow Sweden to become a clean energy exporter within the EU.
The differing energy mixes of various EU member countries thus constitute different vulnerabilities, import needs and national interests. Germany is interested to push its renewable energy sector, which requires measures to address grid stability. France and Sweden will worry about uranium supplies, while security of gas supplies is not as important to them as it is for Italy, Germany, the UK and Eastern European countries. The latter in turn are much more vulnerable to Russian supply disruptions than Western Europe which enjoys greater diversity of supplies. While coal tends to be on the decline in Western and Northern Europe, Eastern European countries are inclined to cling to it for labour and geostrategic reasons. On the other hand there are many common interests that the EU tries to enhance with its policies for energy cooperation and diversification. Stability of oil supplies and building an integrated gas and electricity market is clearly a common interest of all EU countries.
3.6 Oil supply alternatives for Europe 3.6.1 Oil: Global commodity - Natural gas: Segmented markets Oil and natural gas have different geopolitical risk profiles that need to be taken into consideration when weighing supply alternatives. Oil is relatively more important than natural gas in energy mixes and its transportation via tankers on the open sea makes it less prone to geopolitical risks. Oil is a global commodity, a fungible good that is traded worldwide with a single price for various crude oil varieties that differ by viscosity and sulphur content.
In contrast, natural gas trades in segmented markets with widely differing prices from one region to another. Natural gas prices in Asia and Europe are vastly higher than in North America for example. Natural gas is more difficult to transport than oil. High transportation costs, associated needs for large upfront investments and fixed transportation lines for the prevalent pipeline export encourage long-term buyer-seller relationships. The spot market is underdeveloped and has only expanded recently with increased LNG trade. While natural gas markets have become more liquid, the oil market has shown some signs of segmentation via the forging of refining and storage ventures between Gulf countries and their Asian clients and investments of Asian national oil companies in upstream sectors in the Middle East, Africa and Latin America, yet in principle oil remains a global commodity.
Hence, transportation lines for natural gas are more vulnerable than those for oil and can be more easily subjected to geopolitical risks. In contrast, oil can be sourced from a variety of sources provided sea-lanes remain open. Risks of supply disruptions are more concentrated in the upstream sector of the producer states where political unrest, resource nationalism and sanctions by Western countries have affected production in the past.
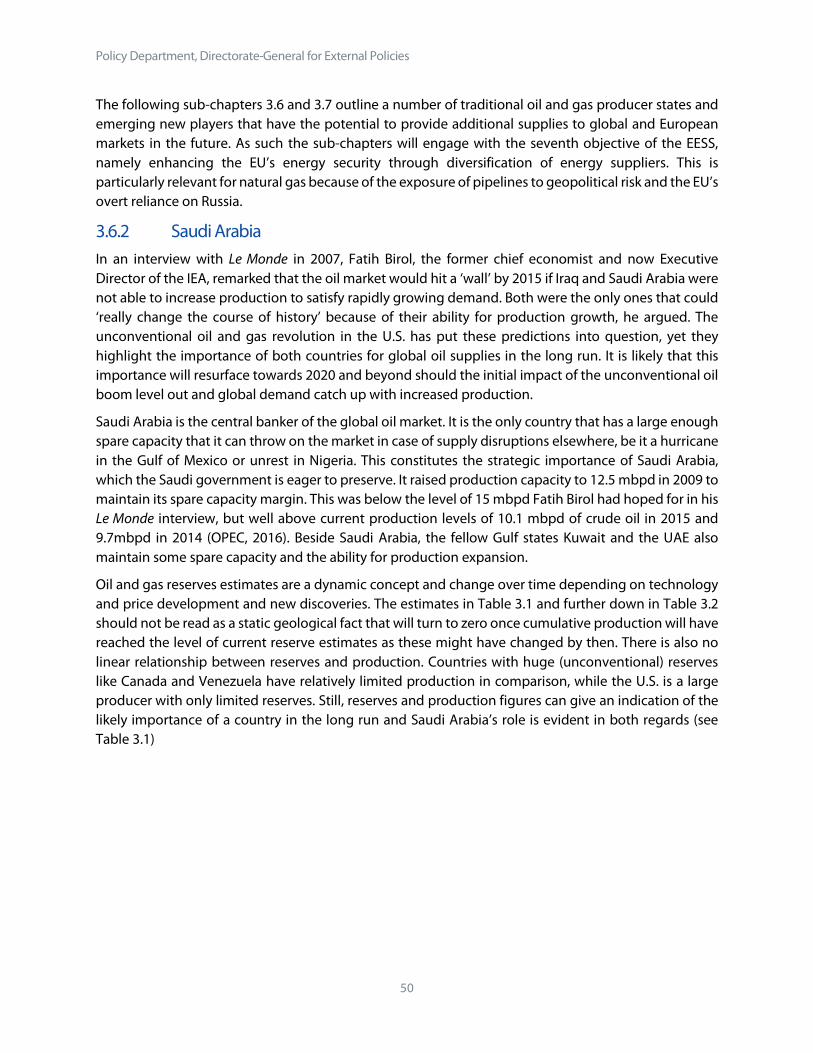
Policy Department, Directorate-General for External Policies
50
The following sub-chapters 3.6 and 3.7 outline a number of traditional oil and gas producer states and emerging new players that have the potential to provide additional supplies to global and European markets in the future. As such the sub-chapters will engage with the seventh objective of the EESS, namely enhancing the EU’s energy security through diversification of energy suppliers. This is particularly relevant for natural gas because of the exposure of pipelines to geopolitical risk and the EU’s overt reliance on Russia.
3.6.2 Saudi Arabia In an interview with Le Monde in 2007, Fatih Birol, the former chief economist and now Executive Director of the IEA, remarked that the oil market would hit a ‘wall’ by 2015 if Iraq and Saudi Arabia were not able to increase production to satisfy rapidly growing demand. Both were the only ones that could ‘really change the course of history’ because of their ability for production growth, he argued. The unconventional oil and gas revolution in the U.S. has put these predictions into question, yet they highlight the importance of both countries for global oil supplies in the long run. It is likely that this importance will resurface towards 2020 and beyond should the initial impact of the unconventional oil boom level out and global demand catch up with increased production.
Saudi Arabia is the central banker of the global oil market. It is the only country that has a large enough spare capacity that it can throw on the market in case of supply disruptions elsewhere, be it a hurricane in the Gulf of Mexico or unrest in Nigeria. This constitutes the strategic importance of Saudi Arabia, which the Saudi government is eager to preserve. It raised production capacity to 12.5 mbpd in 2009 to maintain its spare capacity margin. This was below the level of 15 mbpd Fatih Birol had hoped for in his Le Monde interview, but well above current production levels of 10.1 mbpd of crude oil in 2015 and 9.7mbpd in 2014 (OPEC, 2016). Beside Saudi Arabia, the fellow Gulf states Kuwait and the UAE also maintain some spare capacity and the ability for production expansion.
Oil and gas reserves estimates are a dynamic concept and change over time depending on technology and price development and new discoveries. The estimates in Table 3.1 and further down in Table 3.2 should not be read as a static geological fact that will turn to zero once cumulative production will have reached the level of current reserve estimates as these might have changed by then. There is also no linear relationship between reserves and production. Countries with huge (unconventional) reserves like Canada and Venezuela have relatively limited production in comparison, while the U.S. is a large producer with only limited reserves. Still, reserves and production figures can give an indication of the likely importance of a country in the long run and Saudi Arabia’s role is evident in both regards (see Table 3.1)
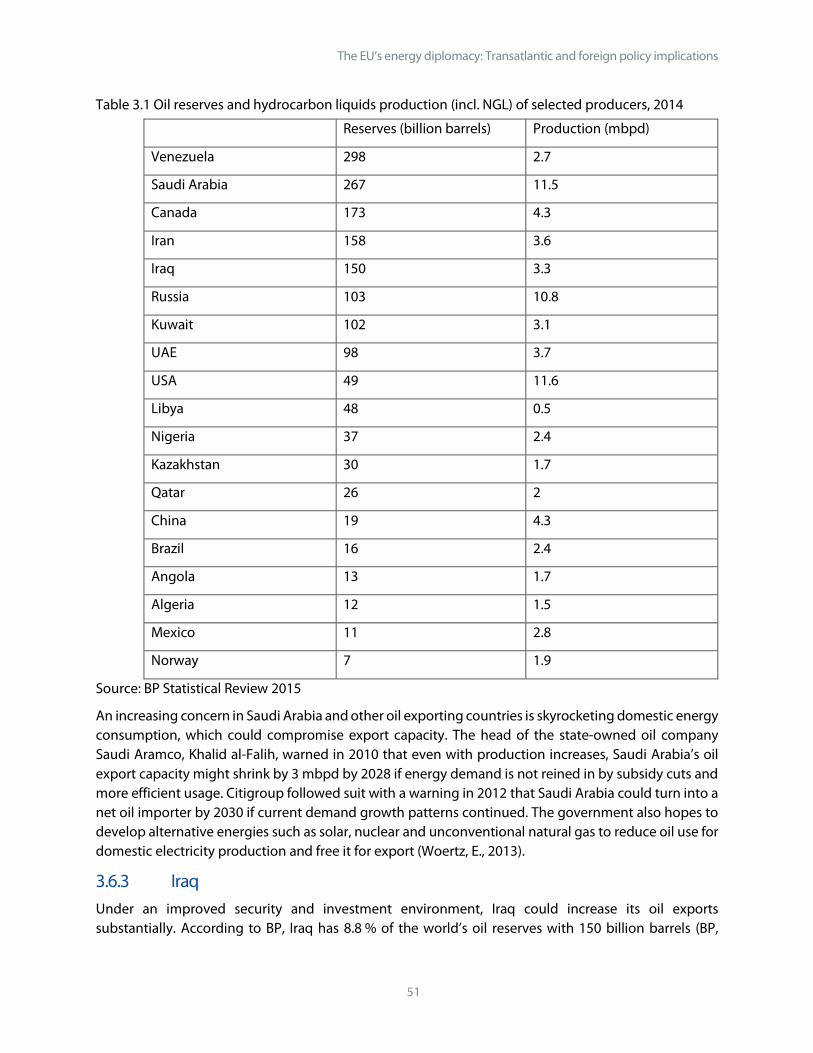
The EU’s energy diplomacy: Transatlantic and foreign policy implications
51
Table 3.1 Oil reserves and hydrocarbon liquids production (incl. NGL) of selected producers, 2014
Reserves (billion barrels) Production (mbpd)
Venezuela 298 2.7
Saudi Arabia 267 11.5
Canada 173 4.3
Iran 158 3.6
Iraq 150 3.3
Russia 103 10.8
Kuwait 102 3.1
UAE 98 3.7
USA 49 11.6
Libya 48 0.5
Nigeria 37 2.4
Kazakhstan 30 1.7
Qatar 26 2
China 19 4.3
Brazil 16 2.4
Angola 13 1.7
Algeria 12 1.5
Mexico 11 2.8
Norway 7 1.9
Source: BP Statistical Review 2015
An increasing concern in Saudi Arabia and other oil exporting countries is skyrocketing domestic energy consumption, which could compromise export capacity. The head of the state-owned oil company Saudi Aramco, Khalid al-Falih, warned in 2010 that even with production increases, Saudi Arabia’s oil export capacity might shrink by 3 mbpd by 2028 if energy demand is not reined in by subsidy cuts and more efficient usage. Citigroup followed suit with a warning in 2012 that Saudi Arabia could turn into a net oil importer by 2030 if current demand growth patterns continued. The government also hopes to develop alternative energies such as solar, nuclear and unconventional natural gas to reduce oil use for domestic electricity production and free it for export (Woertz, E., 2013).
3.6.3 Iraq Under an improved security and investment environment, Iraq could increase its oil exports substantially. According to BP, Iraq has 8.8 % of the world’s oil reserves with 150 billion barrels (BP,

Policy Department, Directorate-General for External Policies
52
2015). Iraq’s 2014 crude oil production of 3.26 mbpd matched its 1979 high and rose further to 3.9 mbpd in 2015 (OPEC, 2016).
The Iraqi government has set ambitious expectations for oil production in the coming years. It has not offered production-sharing agreements to international oil companies that would have given these companies equity stakes in projects, but only service provider contracts. Original government targets of 12 mbpd by 2017 were considered overly ambitious (U.S. Energy Information Administration, 2015 (c)). Iraqi oil minister Adel Abdul-Mahdi recently affirmed a production target of 6 mbpd by 2020, a massive reduction from the previously downgraded goal of 9 mbpd but still almost double 2014 production levels (Economist, 2015).
However, these revised targets have been questioned as aging transportation infrastructure and political instability weigh on the sector. The major oilfields of Iraq are in the south and in the northern Kurdish region. Hence they are out of the reach of the Islamic State in Iraq and Syria (ISIS). However, there are indirect effects of the brittle security situation and Iraq’s notoriously low scores in global transparency and governance rankings contribute to a challenging business environment.
The dispute between the federal government in Baghdad and the semi-autonomous Kurdistan Region of Iraq (KRI) in the north of the country over the sovereignty rights of oil exploitation are of particular concern. It has stymied an oil law that has been pending for years, the KRI government has unilaterally decided to build its own pipeline for exports to Turkey and the government of Baghdad stopped the payment of the KRI’s share in federal oil revenues in 2014, which caused severe budgetary shortfalls and payment delays of government salaries for several months.
3.6.4 Iran Iran’s oil industry suffered a series of setbacks over the past 10 years, including Western sanctions, aging infrastructure, and mature fields. As the oldest crude oil producer in the Persian Gulf, its fields require enhanced recovery techniques to maintain production levels. Throughout the 2000s, internal political interests saw international firms halt desperately needed investment; the culmination of these problems in 2005 resulted in considerable numbers of engineers and technical experts departing, further exacerbating Iran’s internal energy sector development problems (Stevens, P., 2015). Sanctions reduced badly needed investments, decreased the customer base, and diminished revenues as the country was forced to discount exports to its remaining international buyers (Stevens, P., 2015).
Following the lifting of nuclear related sanctions against Iran in January 2016, the Islamic Republic announced its intention to immediately increase production by 500 000 bpd. Overall crude oil production fell about 1 mbpd from pre-sanction highs and Iran has set a target of reaching pre-sanction production by the end of 2016 in an attempt to gain badly needed revenue (U.S. Energy Information Administration, ‘International Energy Statistics’). However beyond this increase, Iran shows limited potential to impact global supply over the long-term. The government has set an ambitious production target of 5.7 mbpd by 2018, but this does not appear feasible given the lack of technical expertise in dealing with aging fields (Kustal, E.).
Meanwhile Iranian benefits from nuclear related sanction relief might be more limited than initially thought. Sanctions that relate to sponsorship of terrorism remain in place, new restrictive U.S. visa regulations have been issued for Iranians and there are new sanctions regarding Iran’s missile programme (Erdbrink, T., 2016) The Iranian banking system has also problems of complying with

The EU’s energy diplomacy: Transatlantic and foreign policy implications
53
international regulations and U.S. tax evasion laws after years of isolation (Clawson, P., 2016). All this seriously restricts its ability to conduct operations in dollar currency and causes reluctance on part of European banks and corporations to engage in Iran out of fear of reprisals in the U.S. and losing business there (Mousavian, S.H., 2016).
3.6.5 Brazil Brazil has benefited greatly from technological advancements in hydrocarbon production. The largest recent oil discoveries have been off the coast in deep pre-salt basins. The development of these ultra-deep water oil wells poses significant challenges. The EIA considers anything below 5 000 feet (roughly 1 500 meters) as ultra-deep water and the Lula oil field is 7 000 meters below the water’s surface (U.S. Energy Information Administration, ‘Brazil’).
The short-term viability of these projects has been questioned in light of low oil prices. Petrobras has slashed exploration and production investments. Oversupply has reduced Brazilian oil’s attractiveness and meaningful quantities of ultra-deep water oil likely will not enter the market before 2020. While short-term prospects remain poor, Brazil is expected to play a growing role in the energy export market over the long-term.
The development of these offshore fields is predicted to account for the majority of Brazil’s production growth through 2030. Governance issues could also compromise field development. Petrobras is currently undergoing an investigation into the largest corruption scandal in Brazil’s history, with the former head of mining operations accused of money laundering and high-ranking government officials accused of corruption. This scandal has blocked the company from accessing international funds, delaying ultra-deep water developments and forcing Petrobras to divest resources to maintain capital levels (U.S. Energy Information Administration, ‘Brazil’).
3.6.6 Venezuela Venezuela is the largest holder of oil reserves in the world, ahead of Saudi Arabia and Canada (see Table 3.1). Yet most of its oil reserves are heavy oil that is difficult to process, while most of its production is still coming from conventional oil. Extra heavy oil presents challenges over conventional oil and even the light tight oil from shale formations. High viscosity reduces its transportability and the refining process is more complex to remove elevated levels of metal and sulphur (Talwani, M.). Greater reliance on such unconventional oil sources would significantly increase the climate impact of the European energy mix.
Resource nationalism and shortcomings in corporate governance additionally weigh on the prospects of heavy oil development in Venezuela, but if prices and the investment environment were right the country could produce considerably more oil than the 2.7 mbpd it did in 2014. This would come however, at significantly higher environmental impact than conventional oil production.
3.6.7 North America Over the last five years the U.S. has developed into a net-exporter of refined petroleum products and NGLs, while remaining a net importer of crude oil at reduced levels. In the AEO2015 Reference case, net crude and petroleum products imports roughly halve between 2013 and 2040, from 33 % to 17 % of total domestic consumption. In the High Oil and Gas Resources case and the High Oil Price case, the United States is projected to become a net exporter of liquid fuels around 2020. However, in all cases

Policy Department, Directorate-General for External Policies
54
net crude imports begin to rise again later in the 2020s (U.S. Energy Information Administration, 2015 (a), pp. 18-19).
With the 2015 lift of the crude export ban the United States could also export crude oil (see chapter 2.2.2), a possibility that has been included in the AEO2015 projections. However, the lifting of the ban only has a noticeable effect in the High Oil Price scenario. The EIA remarks that continued exports of petroleum products might be more likely because of the strength of the U.S. refining industry (U.S. Energy Information Administration, 2015 (a), pp. 18-19).
Yet, increased exports of refined products could also face limitations, stemming from peculiarities of the U.S. market for crude oils. The U.S. has a glut of light, sweet crude in the Midwest and Gulf Coast regions stemming from the shale formations, however, refineries in these regions have invested in processing heavier, sourer grades from the Gulf of Mexico, Venezuela and Canada. Since there are no pipelines connecting the Midwest or Gulf Coast to the refineries on the Atlantic coast that are better suited to process the new shale production, transportation to these refineries would be costly. Instead, some of the Midwest crude might be shipped to Europe unrefined, but amounts will likely remain small, a fact also reflected in the AEO2015 projections mentioned above (Stratfor, 2016).
Canada is a net exporter of crude oil and the third largest holder of oil reserves globally due to its abundant tar sands (see chapter 2.2.3 and Table 3.1). However, whether Canadian exports will continue to grow hinges critically on two questions. First, tar sands are expensive to produce and have higher commercial break even prices (USD45-USD90/bbl) than tight oil production that is prevalent in the U.S. Production levels could be affected if oil prices continued to stay low (Aguilera, R. and Radetzki, M., p. 79). Secondly, Canada currently faces severe restraints in infrastructure to transport oil from Alberta’s oil fields to either the Atlantic or Pacific (Canadian Association of Petroleum Producers). All proposed pipeline routes are facing high levels of public opposition (Stonington, J.). TransCanada’s Keystone XL pipeline seemed most promising and was supposed to reach the Atlantic via the United States; however, President Obama has vetoed it. Nevertheless, it might still be constructed if Obama’s veto is reversed in response to TransCanada’s demand of USD15 billion in damages through an arbitration process. Either way, a decision in the arbitration process will likely take several years, delaying any possible resumption of the Keystone XL project (Austen, I.). Because tars sands have higher GHG emissions than conventional oil, any growth of European imports would have a negative impact on EU polices for climate change mitigation.
In sum the unconventional oil revolution in the United States is impacting Europe as it has been a contributing factor to lower global oil prices. However, despite the glut of light, sweet crude in the Midwest, only relatively small amounts of crude oil are expected to reach Europe, U.S. exports will rather take the form of refined products. The unconventional oil revolution therefore does not turn the United States into a major supply alternative for Europe, but is important because of falling U.S. imports that free crude oil elsewhere for exports to Europe.
3.7 Natural gas supply alternatives for Europe 3.7.1 Domestic conventional gas production in Europe The fifth pillar of the EESS calls for ‘increasing EU energy production’. Beside renewables, Europe does have capacities for indigenous gas production. This capacity, however, is heavily concentrated and expected to decrease towards 2030. Only Norway will be able to roughly maintain production (see
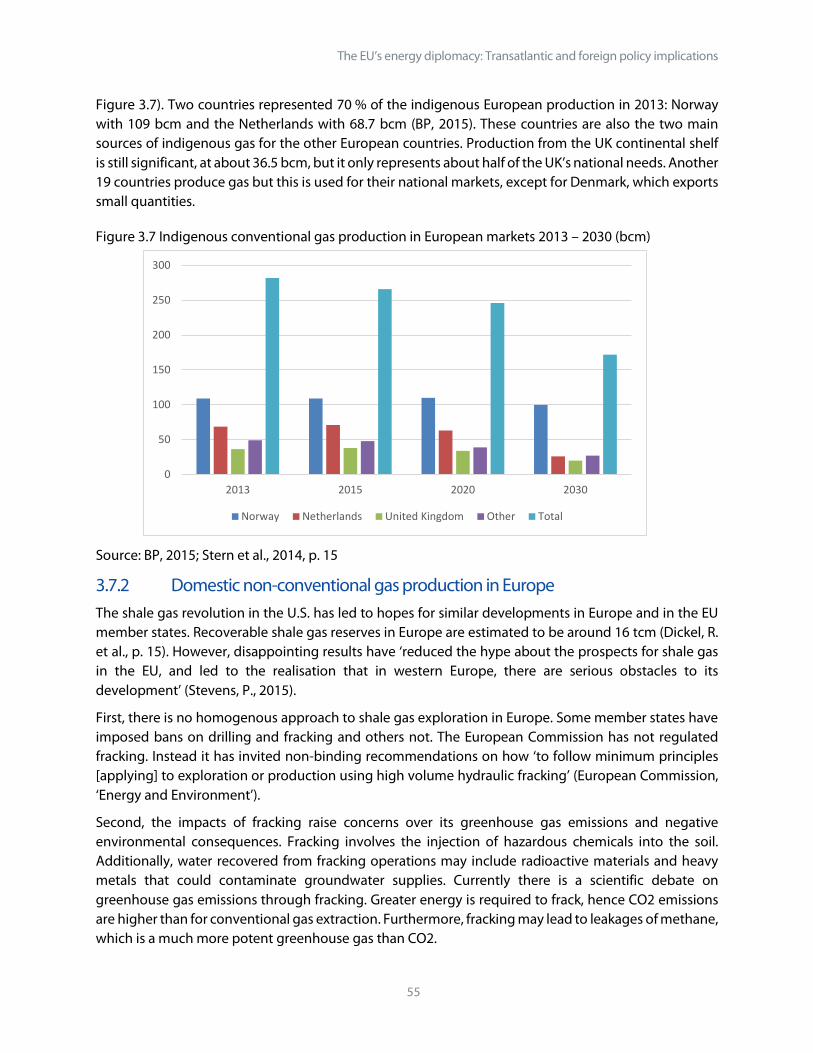
The EU’s energy diplomacy: Transatlantic and foreign policy implications
55
Figure 3.7). Two countries represented 70 % of the indigenous European production in 2013: Norway with 109 bcm and the Netherlands with 68.7 bcm (BP, 2015). These countries are also the two main sources of indigenous gas for the other European countries. Production from the UK continental shelf is still significant, at about 36.5 bcm, but it only represents about half of the UK’s national needs. Another 19 countries produce gas but this is used for their national markets, except for Denmark, which exports small quantities.
Figure 3.7 Indigenous conventional gas production in European markets 2013 – 2030 (bcm)
Source: BP, 2015; Stern et al., 2014, p. 15
3.7.2 Domestic non-conventional gas production in Europe The shale gas revolution in the U.S. has led to hopes for similar developments in Europe and in the EU member states. Recoverable shale gas reserves in Europe are estimated to be around 16 tcm (Dickel, R. et al., p. 15). However, disappointing results have ‘reduced the hype about the prospects for shale gas in the EU, and led to the realisation that in western Europe, there are serious obstacles to its development’ (Stevens, P., 2015).
First, there is no homogenous approach to shale gas exploration in Europe. Some member states have imposed bans on drilling and fracking and others not. The European Commission has not regulated fracking. Instead it has invited non-binding recommendations on how ‘to follow minimum principles [applying] to exploration or production using high volume hydraulic fracking’ (European Commission, ‘Energy and Environment’).
Second, the impacts of fracking raise concerns over its greenhouse gas emissions and negative environmental consequences. Fracking involves the injection of hazardous chemicals into the soil. Additionally, water recovered from fracking operations may include radioactive materials and heavy metals that could contaminate groundwater supplies. Currently there is a scientific debate on greenhouse gas emissions through fracking. Greater energy is required to frack, hence CO2 emissions are higher than for conventional gas extraction. Furthermore, fracking may lead to leakages of methane, which is a much more potent greenhouse gas than CO2.
0
50
100
150
200
250
300
2013 2015 2020 2030
Norway Netherlands United Kingdom Other Total
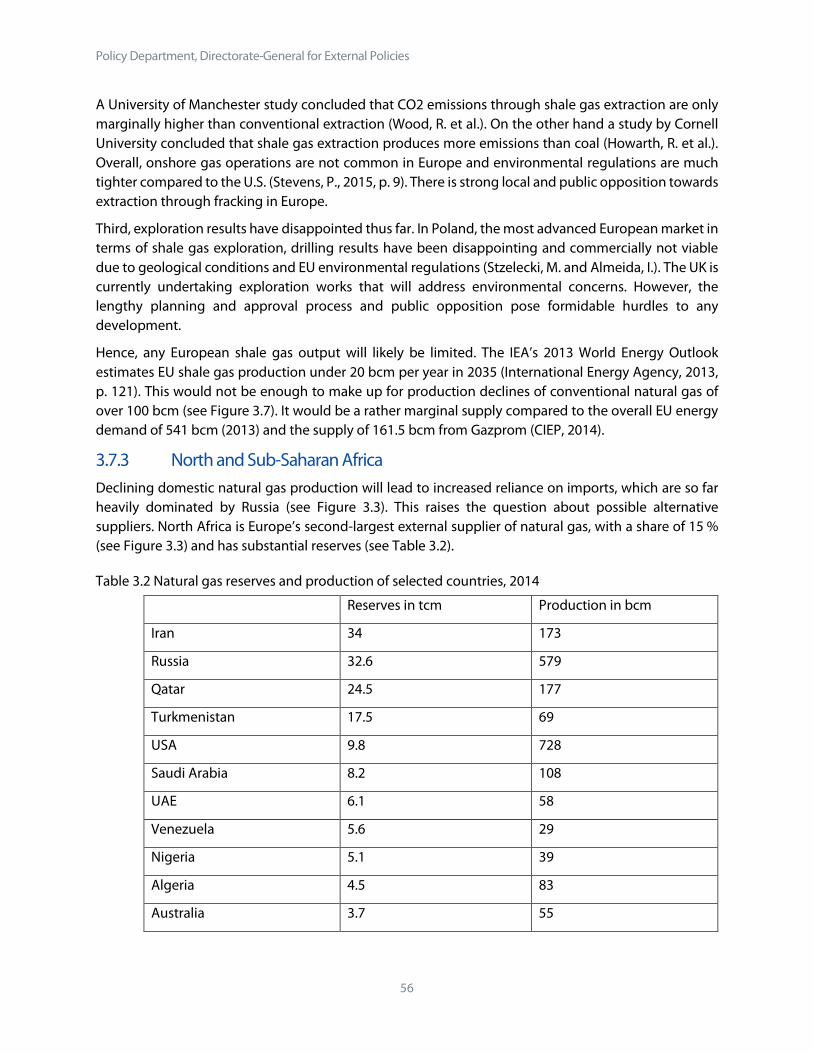
Policy Department, Directorate-General for External Policies
56
A University of Manchester study concluded that CO2 emissions through shale gas extraction are only marginally higher than conventional extraction (Wood, R. et al.). On the other hand a study by Cornell University concluded that shale gas extraction produces more emissions than coal (Howarth, R. et al.). Overall, onshore gas operations are not common in Europe and environmental regulations are much tighter compared to the U.S. (Stevens, P., 2015, p. 9). There is strong local and public opposition towards extraction through fracking in Europe.
Third, exploration results have disappointed thus far. In Poland, the most advanced European market in terms of shale gas exploration, drilling results have been disappointing and commercially not viable due to geological conditions and EU environmental regulations (Stzelecki, M. and Almeida, I.). The UK is currently undertaking exploration works that will address environmental concerns. However, the lengthy planning and approval process and public opposition pose formidable hurdles to any development.
Hence, any European shale gas output will likely be limited. The IEA’s 2013 World Energy Outlook estimates EU shale gas production under 20 bcm per year in 2035 (International Energy Agency, 2013, p. 121). This would not be enough to make up for production declines of conventional natural gas of over 100 bcm (see Figure 3.7). It would be a rather marginal supply compared to the overall EU energy demand of 541 bcm (2013) and the supply of 161.5 bcm from Gazprom (CIEP, 2014).
3.7.3 North and Sub-Saharan Africa Declining domestic natural gas production will lead to increased reliance on imports, which are so far heavily dominated by Russia (see Figure 3.3). This raises the question about possible alternative suppliers. North Africa is Europe’s second-largest external supplier of natural gas, with a share of 15 % (see Figure 3.3) and has substantial reserves (see Table 3.2).
Table 3.2 Natural gas reserves and production of selected countries, 2014
Reserves in tcm Production in bcm
Iran 34 173
Russia 32.6 579
Qatar 24.5 177
Turkmenistan 17.5 69
USA 9.8 728
Saudi Arabia 8.2 108
UAE 6.1 58
Venezuela 5.6 29
Nigeria 5.1 39
Algeria 4.5 83
Australia 3.7 55

The EU’s energy diplomacy: Transatlantic and foreign policy implications
57
Iraq 3.6 1
China 3.5 135
Indonesia 2.9 73
Canada 2 162
Norway 1.9 109
Egypt 1.8 49
Kuwait 1.8 29
Libya 1.5 12
Kazakhstan 1.5 19
Azerbaijan 1.2 17
Uzbekistan 1.1 57
Netherlands 0.8 56
Trinidad Tobago 0.3 42
Argentina 0.3 35
UK 0.2 37
Source: BP Statistical Review 2015
However, the likelihood of increased natural gas exports from North Africa is limited for several reasons, such as political instability, lack of investment, increasing domestic demand and declining production from ageing gas fields. In Algeria militants attacked the gas production plants at Tiguentourine in 2013. Libya’s civil war and sanctions against the Ghadafi regime in 2011 caused a shutdown of Libyan pipeline gas exports to Italy, which since have not resumed, also because of a lack of demand and saturation of the Italian market in the wake of economic slowdown.
Algeria offers potential to increase gas exports, especially for LNG, followed by Libya (see Table 3.3). It holds the world’s fourth largest shale gas reserves after the USA, China, and Argentina (U.S. Energy Information Administration, ‘Analysis & Projections’). With the help of these shale gas resources Algeria plans to double production capacity from 2013 to 2023. According to the Oxford Institute of Energy the medium-term projections offer a modest but positive outlook with rising export volumes of approximately 60 bcm by 2030 (Dickel, R. et. al).

Policy Department, Directorate-General for External Policies
58
Table 3.3 Projected North African gas exports 2015 -2030 in bcm
2015
Pipeline
2015
LNG
2020
Pipeline
2020
LNG
2030
Pipeline
2030
LNG
Algeria 28 16 20 21 22 38
Libya 8 0 10 0 15 6
Egypt 0 0 0 0 0 3
Total 36 16 30 21 37 47
Source: Stern et al. 2014, p.21
In conclusion, even when leaving political instabilities aside, the prospects for supply diversification from North Africa are limited. In fact Bloomberg claims that 'EU reliance on Russian Gas deepens as North Africa Imports ebb’ (Shiryaevskaya, 2015).
Nigeria still flares most of its associated natural gas from oil production. It has exported LNG since 1999, recently its exports have increased and it could develop into a more substantial exporter given its reserves. Past plans to build a pipeline via the Sahara must be deemed unrealistic now given the widespread unrest in the Sahel region. This leaves LNG as the only viable alternative, but the project implementation in Nigeria’s current investment and political environment is challenging.
3.7.4 Azerbaijan and Central Asia Azerbaijan has become a major player in the EU energy options for diversification. Currently the Trans-Adriatic Pipeline (TAP) project is being implemented to transport gas from the Azeri Sha Deniz field to Greece and onwards to Italy. Additionally the Trans-Anatolian Pipeline (TANAP) is under construction. The project is scheduled for 2019 and of particular importance because it will deliver the first Azeri gas to Europe. Most likely Azeri gas ‘will provide a maximum of 2-4 % of EU imports’ only (Far, S. and Youngs, R., p. 44). However, Azerbaijan could become increasingly interesting with regards to the Southern Gas corridor and the development of Iran as a gas exporting country.
Turkmenistan holds the world’s fourth largest natural gas reserves. Russia has sought to direct Turkmen gas via its supply net and prevent alternative export routes via Iran or via the Caspian Sea and the Caucasus. Should such projects materialise in the future Iran and Azerbaijan could become important transit countries for gas from Turkmenistan.
3.7.5 Iran Iran has surpassed Russia in terms of reserves according to BP (see Table 3.2). At the same time the country is surprisingly still a net importer of gas, mainly from Turkmenistan. At this stage Iran lacks natural gas extraction and transportation infrastructure. However, if the country managed to attract foreign investment and expertise after the end of sanctions it could expand production substantially and develop into a major natural gas exporter. The Iranian Ministry of petroleum has outlined its objective to remain the third largest producer of gas with total gas production of 360 bcm per year by 2025. Industry sources expect Iran to become the fifth largest gas market in the world by 2020 behind the US, the EU, Russia, and China. Iran's abundant reserves and its relative proximity would allow pipeline gas supplies to Europe and make it highly interesting as a future supplier of gas to the EU.

The EU’s energy diplomacy: Transatlantic and foreign policy implications
59
In order to export Iranian gas to Europe certain issues would have to be overcome. Like Egypt the country faces rising domestic demand that competes with potential exports. Similar to the Gulf countries, it uses associated natural gas for reinjection into mature oil fields to maintain reservoir pressure. After meeting growing domestic demand gas exports are expected to supply neighbouring countries first such as Iraq, Pakistan, Oman and the UAE. ‘Any gas available for export to the rest of Europe is expected to remain marginal prior to 2020’ (Stern et al., p.28). The most feasible option to export gas to Europe is via Turkey by using existing infrastructure such as the Tabriz-Ankara pipeline, connecting North West Iran and Turkey and infrastructure projects such as the Trans-Adriatic Pipeline (TAP), connecting the Caspian Sea (Azerbaijan) to the Adriatic See (Italy). The TAP is currently under construction and expected to operate from 2020 onwards.
The idea to supply Europe with Iranian gas is not new. In 2008, the Swiss energy company Elektrizität-Gesellschaft Laufenburg AG (EGL) signed a contract with the National Iranian Oil Company (NIOC). The contract implied to supply an EGL power plant in Italy with 5.5 bcm per year through the existing Iran-Turkey link and the TAP for a period of 25 years (International Energy Agency, 2008). The deal was suspended by the Swiss due to the international sanctions against Iran and could be revised now that the sanctions are lifted. However the caveats about the extent of sanction relief given above for Iran’s oil business (see. 3.6.4) also apply to its gas business.
3.7.6 Qatar and other Middle East countries Qatar has developed into the largest LNG exporter of the world with a share of 32 % in 2014 (see Figure 1.3). It is an important supplier to the UK with a share of 25 % in the country’s total natural gas imports in 2014. Further expansion might be limited as Qatar has a moratorium on its giant North field and is unlikely to increase production for the foreseeable future.
Other Gulf countries like Saudi Arabia and the UAE have substantial reserves (see Table 3.2), but need all their gas production for domestic purposes, be it for electricity production, petrochemical industries or reinjection into mature oil wells to maintain reservoir pressure. The UAE has developed into a gas net importer and has built an LNG import terminal in Al-Fujairah. Kuwait also imports LNG from far away places like Australia.
Iraq has considerable reserves, but hardly any production at this stage (see Table 3.2). Flaring of associated gas is widespread and its gas industry is underdeveloped. It had offered to provide natural gas to the now failed Nabucco project. Development of pipeline gas transportation infrastructure would be challenging in the current security environment.
3.7.7 The Eastern Mediterranean and Egypt Israel, Cyprus, Palestine, Lebanon and Syria share the Levant Basin, which has seen some spectacular gas discoveries since 2009, most notably Israel’s Tamar and Leviathan fields and the Aphrodite field in Cyprus. Egypt used to be a gas exporter to Israel, Jordan, Syria and Lebanon and was even traded as a possible supplier to the European Nabucco project. But it had to cease gas exports to Israel in 2012 and reduced the ones to the Arab partners as its rising domestic consumption outstripped its production capacity. Egypt has now turned into a gas net importer. Natural gas flows are about to reverse as Israel is slated to become a natural gas exporter, first via pipeline to Egypt, but possibly also to Europe. An export deal for the Tamar field to Egypt was greenlighted in December 2015. Israel intends to export 40 % of the production of the two fields and use 60 % domestically. Export proposals have included an
Policy Department, Directorate-General for External Policies
60
offshore pipeline to Turkey, which would raise Cypriot concerns about sovereignty rights over the seabed and export as LNG via a terminal in Cyprus, which would lead to objections by Turkey over the unresolved Cypriot question (Darbouche, H. et al., 2012; Henderson, S., 2013). Relations between Israel and Turkey have also been strained since the raid of a flotilla of Turkish NGOs to Gaza in 2010 by Israeli security forces. A pipeline to Turkey could help Israel to repair strained relations and would strengthen Turkey’s role as a transit hub. Yet the recent deterioration of domestic security and democratic standards in the country have led to considerable doubts in Europe about the reliability of the Erdogan administration that could also extend to Turkey as a transit country.
Tamar started operations in 2013, but Leviathan is not producing yet. Considerable political controversy exists over the regulation of the quasi duopoly of the two major exploiting companies (Delek and Noble Energy) and the share that is supposed to be reserved for the domestic market. Currently there is a pending decision of the country’s High Court about Leviathan. A final decision on the exact nature of Israeli gas exports might still be pending for another year (Lidman, M. 2016).
With the discovery of a giant offshore field by Italian ENI, Egypt could become yet again a more prominent gas producer, but the preferred destination for such gas will likely be the domestic market. Lebanon also hopes for gas discoveries and has some rudimentary institutional set-ups in place, but it has not even started serious exploration ventures, hence possible Lebanese gas discoveries are mere speculation at this stage. As Lebanon shares the Levant Basin, but has not defined its maritime borders with Israel yet, this could be a source of political controversies and conflicts. The chances of exploration success are also limited by political instability and lack of capital; this applies even more to Syria. If successful, Eastern Mediterranean gas will rather be a regional and local game changer than an international one (Darbouche, H. et al., 2012).
3.7.8 Western supply corridor I: United States The unconventional oil and gas revolution in the U.S. has changed the global energy landscape significantly, particularly with regards to gas. The U.S. was projected to become a net importer of gas before 2020 but instead it has evolved into the biggest gas producing country on the globe and it is soon becoming a net exporter of natural gas (see chapter 2).
The unconventional gas revolution in the United States already affects Europe, and will likely do so even more in the future. Declining U.S. imports of LNG have a substantial impact on the rest of the world. Expecting rising imports, major exporters such as Qatar undertook investments matching U.S. import facilities. Thus, when substantial U.S. imports failed to emerge, large quantities of LNG became available for other markets, among them Europe (International Energy Agency, 2012, p. 74). This oversupply of LNG created downward pressure on gas prices around the world. Also spot market trade, so far rather uncommon in Europe, increased. This is weakening Europe’s traditional long-term, oil-indexed contracts and increases pressure on the price of Russian exports to a point where Russian Gazprom has had to renegotiate some contracts (Stevens, P., 2012, pp. 2-3; Ebinger, C., Massy, K. and Avasarala, G., p. 25; Aguilera, R. and Radetzki, M. p. 79).
If the United States becomes a major exporter of LNG, this will help to increase current market liquidity. While U.S. LNG exports cannot be expected to revolutionise the existing pricing system, they could establish an alternative system and thus initiate permanent changes in LNG contract structures, placing European countries in a more favourable position in negotiations with major suppliers (Ebinger, C., Massy, K. and Avasarala, G., p. 39).
The EU’s energy diplomacy: Transatlantic and foreign policy implications
61
However, if U.S. LNG exports do not materialise as anticipated, increased demand in China and India will likely erode the current loose market over time, even though lower demand from Japan as reactors are being restarted after the Fukushima crisis may in turn slow down this process. This will have severe implications for global gas markets. Stevens warns that without the expected U.S. LNG exports we could face substantial shortages around 2020 because upstream gas projects have long lead times (Stevens, P., 2012, p. 4). This risk has become more probable recently as low oil prices have caused large investments to be put off, which could hit the capital-intensive LNG industry particularly hard.
Therefore, the IEA cautions that the global LNG market could tighten up considerably by 2020 if prices remain low. Nevertheless, it also emphasises the ‘unparalleled ability [of the U.S. gas industry] to absorb shocks’. So far, most of the shale gas industry proves surprisingly resilient to low prices and production growth has not yet slowed down dramatically (International Energy Agency, 2015 (b), pp. 4-5). As Stevens puts it:
‘If the [shale gas] hype turns into reality, then world energy markets can look forward to floating on clouds of cheap gas, certainly up to 2030, if not beyond. However, if the hype remains hype then current investor uncertainty will limit future gas supplies. Assuming gas demand continues to increase, the effect in the next five to ten years would be much higher gas prices’ (Stevens, P., 2012, p. 10).
U.S. LNG exports benefit Europe by putting downward pressures on LNG prices and strengthening its bargaining position vis-a-vis Russia. However, there are obstacles that often seem to be forgotten in the current wave of enthusiasm over possible prospects of LNG supply from the U.S.
First, LNG from the U.S. requires lead time and will only be able to enter the market after several years (Bordhoff, J. and Houser, T., p. 28). The majority of LNG export terminals will not operate before 2018 (see Table 3.4). U.S. LNG exports to the EU could only serve as a long-term solution and would therefore not provide solutions for more immediate concerns.
Secondly, growing U.S. LNG exports will not necessarily increase global supplies by the same magnitude, as they might just crowd out other high-cost producers. Bordhoff and Houser argue that 93 bcm per year of U.S. LNG exports will only translate into an additional 15bcm per year of global natural gas production (Bordhoff, J. and Houser, T., p.4). However, the IEA projects higher production rates beyond 2020 when gas demand and prices are expected to grow (Coote, B.)
Thirdly, U.S. LNG could struggle to be competitive with Russian pipeline gas in the current price environment, especially in core markets like Germany and the UK with good infrastructure and diversified supply options (Coote, B.).
Fourthly, rudimentary European LNG infrastructure and pipeline interconnections constitute a bottleneck. The EU does in theory have enough LNG capacities to replace Russian natural gas imports. Its total LNG import capacity stands at 189 bcm (137.1 mt) per year, which is equivalent to 20 % of the global total (Table 3.5 and International Gas Union, p.50). Of this capacity 146 bcm was idling in 2013 and would have been able to almost cover 150 bcm of Russian gas imports (Bordhoff, J. and Houser, T.). However, the LNG terminals are highly concentrated in a few EU member states (see Table 3.5). For example, Spain has six LNG import terminals making it the country with the fourth largest LNG regasification capacity in the world (International Gas Union). But in other parts of the EU, particularly Eastern Europe and the Balkans, which are most vulnerable to Russian gas imports, the LNG infrastructure is not yet ready to replace Russian gas.

Policy Department, Directorate-General for External Policies
62
Table 3.4 U.S. LNG export terminals
Project Status Region Estimated Operation Date
Capacity
Sabine Pass, LA Under Construction
U.S. Gulf Coast 2016 1.40 Bcfd
Freeport, TX Under Construction
U.S. Gulf Coast 2018 1.8 Bcfd
Cove Point, MD Under Construction
U.S. East Coast 2018 0.82 Bcfd
CorpU.S. Christi, TX
Under Construction
U.S. Gulf Coast 2018-2019 2.14 Bcfd
Hackberry, LA Under Construction
U.S. Gulf Coast 2020 1.7 Bcfd
Sabine, LA Under Construction
U.S. Gulf Coast 2019 2.76 Bcfd
Source: Federal Energy Regularity Commission (January 2016), Estimations made by Coote, B., 2016 and Bordhoff, J. and Houser, T, 2014.
The solution for this dilemma requires better interconnections and more strategically located LNG terminals. Both issues are currently being addressed by the 2015 update of the European Commission’s Project of Common Interest (PCI) (2013). The updated list of 195 key energy infrastructure projects aims to integrate European energy markets by diversifying supply sources and transport routes. Stronger interconnections between EU member states and the existing LNG terminals will improve market access. An example for this is the MIDCAT pipeline, which would connect Spain and France by 2020 with a capacity of approximately 7 bcm per year (Euractiv and Natural Gas Europe). New LNG import terminals in Eastern EU member states would increase their import options. The most advanced project after the Lithuanian Terminal is the Polish Swinoujscie project which is expected to receive its first commercial supply between 2016 and 2017 (International Gas Union). Another example is the LNG terminal on the Island of Krk in Croatia. The terminal’s purpose is to serve as a gas hub for central and South-eastern Europe in order to increase security of gas supplies by diversifying imports and creating new supply routes for the Central and South-Eastern European countries.
However, such capital-intensive infrastructure projects pose a high economic burden. For instance, the Klaipeda LNG Terminal in Lithuania was opened at the end of 2014 in order to diversify gas supplies and tackle its vulnerability from Russian gas imports (100 % of Lithuanian imports at that time). Indeed the mission seemed to be a successful ‘game changer’ when Lithuania used its ‘independence LNG Terminal’ to re-negotiate a 20 % gas price cut from Gazprom (EurActiv). Despite the euphoria of securing alternatives to Russian gas supplies in Lithuania, it has to be acknowledged that Russian imports still remain the primary supply for Lithuania and the country is currently paying EUR152 000 daily for the LNG terminal’s operational cost (Natural Gas Europe), a high economic burden for a country with a total GDP of 36 billion euro (Eurostat, ‘National Accounts and GDP’).
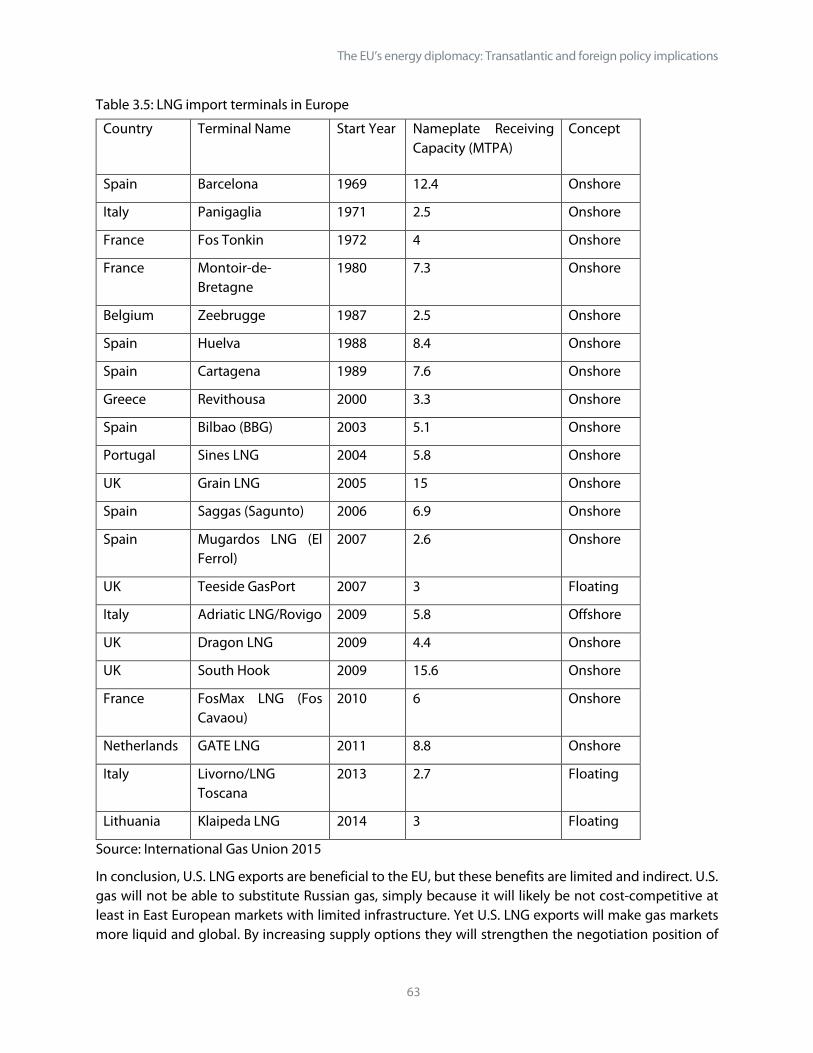
The EU’s energy diplomacy: Transatlantic and foreign policy implications
63
Table 3.5: LNG import terminals in Europe
Country Terminal Name Start Year
Nameplate Receiving Capacity (MTPA)
Concept
Spain Barcelona 1969 12.4 Onshore
Italy Panigaglia 1971 2.5 Onshore
France Fos Tonkin 1972 4 Onshore
France Montoir-de-Bretagne
1980 7.3 Onshore
Belgium Zeebrugge 1987 2.5 Onshore
Spain Huelva 1988 8.4 Onshore
Spain Cartagena 1989 7.6 Onshore
Greece Revithousa 2000 3.3 Onshore
Spain Bilbao (BBG) 2003 5.1 Onshore
Portugal Sines LNG 2004 5.8 Onshore
UK Grain LNG 2005 15 Onshore
Spain Saggas (Sagunto) 2006 6.9 Onshore
Spain Mugardos LNG (El Ferrol)
2007 2.6 Onshore
UK Teeside GasPort 2007 3 Floating
Italy Adriatic LNG/Rovigo 2009 5.8 Offshore
UK Dragon LNG 2009 4.4 Onshore
UK South Hook 2009 15.6 Onshore
France FosMax LNG (Fos Cavaou)
2010 6 Onshore
Netherlands GATE LNG 2011 8.8 Onshore
Italy Livorno/LNG Toscana
2013 2.7 Floating
Lithuania Klaipeda LNG 2014 3 Floating
Source: International Gas Union 2015
In conclusion, U.S. LNG exports are beneficial to the EU, but these benefits are limited and indirect. U.S. gas will not be able to substitute Russian gas, simply because it will likely be not cost-competitive at least in East European markets with limited infrastructure. Yet U.S. LNG exports will make gas markets more liquid and global. By increasing supply options they will strengthen the negotiation position of
Policy Department, Directorate-General for External Policies
64
Europe vis-a-vis Russia which will remain its dominant supplier for the foreseeable future (Bordoff, J. and Houser, T.).
3.7.9 Western supply corridor II: Latin America Venezuela has the second largest natural gas reserves of the Americas after the U.S. (see Table 3.2), yet it is a net importer, mainly from Colombia. Natural gas needs for reinjection into mature oil fields to maintain reservoir pressure have increased by 29 % over the past decade (U.S. Energy Information Administration, ‘Venezuela)’. About 90 % of its natural gas is associated gas from oil production The country has long standing plans to develop more non—associated gas, possibly also for export. Venezuela has joint ventures with European companies Repsol and ENI and could expand LNG production towards the end of the decade. However lack of capital and foreign investment hamper development and considerable doubts exist about domestic stability, governance and the management of the hydrocarbon sector by the Maduro administration.
Argentina is the second largest producer of natural gas in Latin America after Trinidad & Tobago (see Table 3.2), but it is still a net importer of natural gas, mainly from Bolivia. It has the potential, however, to become a major energy exporter over the coming decades. With the second largest shale gas reserves in the world, Argentina could see a considerable production boom (U.S. Energy Information Administration, ‘Argentina’). The government has recently taken steps to increase foreign partnerships and offered exploration incentives. However, a repeat of the North American energy revolution is unlikely over the next five years due to different domestic and international circumstances. Argentina lacks many of the qualities that kick-started the revolution in the United States such as an active financial market and small, high-risk exploratory companies. Additionally, oil producers (both conventional and unconventional) are struggling as a result of the oil price slump. Still, long-term energy prospects for Argentina are considerable.
Hence potential LNG exports of Argentina and Venezuela show some promise, but are also fraught with risks. Prospects are uncertain at this stage. This leaves Trinidad & Tobago as an already established LNG exporter to Europe, mainly to Spain and the UK (BP, Statistical Review 2015), but its reserve base is relatively small (see Table 3.2). It will not be able to become a major source of supply diversity in the future.
The EU’s energy diplomacy: Transatlantic and foreign policy implications
65
4 Transatlantic energy cooperation 4.1 EU-US cooperation on energy The U.S. has played a vital role in European energy security since World War II and is an important cornerstone of the EU’s energy diplomacy today. In the post-war decades the U.S. provided the security infrastructure that made the massive rise of Middle Eastern oil exports to Europe possible. During Arab oil embargoes in 1956 (Suez Crisis) and 1967 (Six Day War) it still commanded spare capacity that it could use to calm global oil markets. When it had lost this spare capacity at the beginning of the 1970s the following oil embargo in 1973 had a more measurable effect (Yergin, D.). To this day the U.S. plays a crucial role in safeguarding energy supply routes to Europe. Beyond that it might play again a certain role as energy exporter.
Talks between the EU and the U.S. about closer and more formal trade partnership go back to the 1990s and the New Transatlantic Agenda (1995) (European Parliament 2015a, p. 19). The EU and the U.S. have a shared interest in open, transparent, competitive, and sustainable global energy markets. Against this backdrop EU-U.S. cooperation on energy has intensified over the past decade. The EU-U.S. Energy Council was created in 2009, substantially upgrading energy cooperation. No similar council of the EU exists with other nations. It meets annually and reports to the wider EU-U.S. summit. The EU High Representative/Vice President, the EU Vice President for Energy Union, the EU Commissioner for Climate and Energy, the U.S. Secretary of State and the U.S. Secretary of Energy chair it. A representative from the rotating EU Presidency also participates. The Council deals with issues of mutual interest such as global and regional energy security challenges, mitigation of climate change, energy efficiency, renewable energy, carbon capture and storage (CCS), smart grids, nuclear safety, unconventional energy, offshore safety and energy research and technologies (European Commission, ‘EU-USA Energy Council’).
During its seventh session in May 2016 in Washington D. C. the Council reaffirmed energy security as a fundamental objective and denounced the use of energy as a political weapon as unacceptable. It stressed the need for diversification of European supply sources and its commitment to the energy security of Ukraine and other vulnerable countries in the neighbourhood. It welcomed the lifting of the U.S. export ban and the start of U.S. LNG exports and noted the importance of regulatory cooperation and the potential benefits of TTIP for energy technology trade and technical cooperation. Regarding climate change, the Council welcomed the Paris Agreement and mentioned the importance of its early entry into force and the necessity for close EU-US cooperation to implement COP 21 commitments. The Council emphasised the need to increase public-private investment in research, development and demonstration (RD&D) projects and welcomed further sharing of information and best practices between the EU and U.S. Additionally, the Council reaffirmed the importance of multilateral institutions, and specifically the importance of concluding the WTO Environmental Goods Agreement (EGA). Finally, the Council established a Climate Change Working Group (U.S.-EU Energy Council, 2016)
The EU and U.S. have also cooperated on the Strategic Energy Review (European Commission 2008) and in the framework of the Clean Energy Ministerial, a global forum to share best practices and promote a global clean energy economy. Another area of cooperation is the Energy Star programme, an international standard for energy efficient products for example computers, refrigerators, televisions

Policy Department, Directorate-General for External Policies
66
and lighting. The EU first signed up for the programme in 2001 and renewed its commitment in 2006 and 2011 (European Commission, ‘EU-USA Energy Council’).
The EU and the U.S. also cooperate on energy via scientific and technical cooperation. As of February 2014, U.S. entities participated in 486 FP7 projects, receiving a total EU contribution of EUR 76.4 million. Of these projects the majority was in health (55 %), followed by Information and Communications Technology (ICT) (11 %). Energy received 7 %, environment, transport and EURATOM (fission) 2 % each. Future cooperation priorities in energy encompass smart grids and energy storage, critical raw materials including for energy, fuel cell and hydrogen and nuclear fusion (European Commission, 2014d, p. 62 and 65).
TTIP could develop into the largest field of cooperation on energy between the EU and the U.S. It could increase energy trade, dissemination of standards and development of technology. Yet considerable divergences exist over the possible inclusion of a separate energy chapter in the TTIP (see chapter 4.2).
4.2 Opportunities and challenges of TTIP energy provisions Beside commercial and technical challenges to U.S. energy exports there are also legal hurdles and non-tariff trade barriers. The Transatlantic Trade and Investment Partnership (TTIP) negotiations between the United States Trade Representative and the European Commission under the directives of the Council of the European Union started officially in July 2013 (Council of the European Union, 2014 (a), for complete information of the TTIP negotiation process see European Parliament 2014 (a), pp. 19-26). The TTIP covers three main areas in a wide range of sectors: a) market access, b) regulatory issues and c) non-tariff barriers and trade rules.
One of the main sectors being discussed are energy products, which made up 10 % of EU imports from the U.S. in 2013, mostly coal and refined petroleum products (European Parliament 2015a, p. 14). Because of the recent dramatic growth in unconventional U.S. crude oil and natural gas production, U.S. oil imports have been greatly reduced and the country is on the verge of becoming a net-exporter of natural gas (see chapter 2.1 and 2.2). Another effect of the domestic gas boom has been an almost threefold increase of U.S. coal exports to the EU since 2006 as coal producers have been crowded out of domestic U.S markets and have sought export markets (European Parliament 2015a).
There are no (or low) tariff barriers in the current bilateral energy trade and existing U.S tariffs on refined products would likely be abolished in a TTIP. The main discussion points pertain to non-tariff barriers (NTB), namely the EU Fuel Quality Directive (FQD), EU climate policies and local content requirements in the U.S. that hinder market access for European producers of renewable energy technologies. The U.S. crude export ban used to be another major NTB in energy, but has already been abolished in 2015 without TTIP (see Chapter 2.2.2 and footnote 5).
TTIP provisions like the Investor-State Dispute Settlement mechanism (ISDS), labour standards and environment and food safety issues have attracted particular attention in public debates, but energy issues are not far behind, such as access to energy, energy security and promotion of green energy technologies. To highlight the strategic importance of energy, the EU has shown a strong interest in including a specific chapter on energy in the TTIP treaty, which would include provisions for raw materials as well. The proposed chapter would cover the entire energy sector, create trade and investment rules to facilitate access to energy, include standards to promote renewable energy and energy efficiency and diversify access to energy suppliers. This chapter would significantly expand

The EU’s energy diplomacy: Transatlantic and foreign policy implications
67
existing U.S.-EU cooperation on energy (see chapter 4.1). It would be seen as a tangible commitment of the U.S. towards the EU energy security strategy and would serve as the basis for ensuring EU access to U.S. energy resources (Council of the European Union, 2014). Specifically, the European Parliament has recommended to the European Commission
‘to retain the objective of dedicating a specific chapter to energy, including industrial raw materials; to ensure that in course of the negotiations the two sides examine ways to facilitate energy exports, so that TTIP would abolish any existing restrictions or impediments of export for fuels, including LNG and crude oil, between the two trading partners, with the aim of creating a competitive, transparent and non-discriminatory energy market thereby supporting a diversification of energy sources, contributing to security of supply and leading to lower energy prices’ (European Parliament, 2015b).
In its initial position paper the European Commission argued that the TTIP should cover energy goods in a specific chapter that could deal with issues such as export restrictions, dual pricing that bolsters domestic industries and discriminates against exports, trading and export monopolies, access to hydrocarbon resources, risk management in offshore oil and gas operations and local content requirements in the renewable energy sector. The European Commission thus hopes to move beyond the WTO’s focus on import tariffs, addressing the limited regulation of export restrictions that often occur in the energy sector, where import tariffs are rather low or non-existent (European Commission (European Commission, 2013).
Regulatory harmonisation of the energy trade could endorse freedom of transit in gas pipeline systems, transparent and non-discriminatory pricing and access to energy markets. This could positively affect investment in energy infrastructure and reduce the exposure of EU energy supplies to geopolitical risks. The settlement of standards to promote green energy and energy efficiency could boost trade in environmental products and renewable and climate-friendly technologies. Reduction of tariffs and non-tariff barriers could provide a boost to Europe’s green energy industry. Setting trade regulations on energy could lead to spill over effects beyond EU-US energy trade, by framing future multilateral and bilateral negotiations with third countries, thus providing a basis for global governance on energy (European Commission, 2013).
So far, the U.S. has been unwilling to include this energy specific chapter, arguing that all issues concerning energy would be covered among general market access provisions of TTIP or by the fact of signing the free trade agreement itself, which would implicitly provide access to LNG exports. Initially this hesitation partially stemmed from the political controversy over whether the ban on crude oil exports should be lifted, which finally was done on December 15, 2015. But this has not stopped the underlying debate over whether the U.S. should ease its energy exports. The U.S. is concerned by a potential rise in hydrocarbon prices, especially of natural gas, due to an increase of exports. What could be beneficial for the U.S. hydrocarbons industry might be detrimental to U.S. households and petrochemical industries that are in need of feedstock. Finally, an increase of production to accommodate exports will entail more environmental risks connected with fracking, which is the main driver of hydrocarbon production growth in the U.S.
From a European perspective major sticking points are (European Parliament, 2015b):
• The EU hopes to gain access to U.S. LNG exports. An FTA like the TTIP would grant Europe access to up to 1.12 bcm/d of LNG instead of 1 bcm/ d and it would not need to go through the cumbersome
Policy Department, Directorate-General for External Policies
68
permission process of FERC and DOE. However, even with an FTA, Asia might be a more lucrative destination for U.S. LNG exporters, as spot prices there are higher than in Europe, where competition from Russian and North African pipeline gas is fierce. The U.S. also already has an FTA with South Korea and is currently negotiating the Trans Pacific Trans Pacific Partnership (TPP) with Asian countries. These countries would then enjoy similar FTA privileges as the EU via the TTIP. Hence a steep rise of U.S. LNG exports as a result of the TTIP is not very likely.
• The European Fuel Quality Directive (FQD) stipulates reduction of 6 % in the carbon intensity of transport fuels by 2020. It assigns a carbon intensity to all fossil fuel feedstock and would effectively ban tar sands exports to Europe because their carbon intensity is higher as a result of their larger GHG emissions. The FDQ is not in line with U.S legislation and U.S. energy exporters see it as a barrier to market access.
• The U.S. has an interest to gain market access to European unconventional gas resources that would require controversial fracking. France and Bulgaria have already enacted legislation against fracking out of environmental concerns and Germany and Czech Republic are contemplating a moratorium. The EU regards decision over natural resources and their possible exploitation a matter of sovereignty of the respective member states. Only once they have decided to open up a particular energy market like unconventional natural gas the TTIP could help to foster competition and open access.
• Local content requirements pose impediments to U.S. market access for European producers of renewable energy technologies, namely wind energy, where Europe has a revealed comparative advantage.
Beside trade in crude oil and LNG, there are other relevant opportunities concerning TTIP even without a specific energy chapter, in particular for technologies for renewable energy and energy efficiency. Their expansion can reduce fuel import dependence and provides export opportunities for European producers.
Solar photovoltaic and wind energy have the highest growth potential. Their costs have fallen substantially. The challenge for their expansion is not so much cost anymore, but intermittency. To address this issue, incremental growth of storage solutions, smart grid integration and technological breakthroughs will be crucial (European Commission, 2014 (b)).
To further develop the sector, phase out subsidies and render renewables competitive in the longer run, technology development, economies of scale and improved regulation of renewables deployment and trade are needed. According to the European Parliament (2015 (a)), reduced trade barriers for wind farms could lower costs and enable growth in this industry. These trade barriers refer to local content requirements, which require companies to acquire a part of the intermediate goods from local sources and impede access to the U.S. market. The European solar energy industry is not as competitive as its wind power industry. Thus there could be negative effects from reduced trade barriers for this industry, as it would face increased competition from U.S. imports.
On the other hand, energy efficiency is greatly underpinned by eco-design and energy labelling. Significant differences can be found between current U.S. and EU standards in environmental labelling schemes that define what constitutes a major trade barrier (European Parliament, 2015 (a)). Without a

The EU’s energy diplomacy: Transatlantic and foreign policy implications
69
harmonised standardisation process, comprising minimum requirements for energy efficiency, trade in environmental products and technologies is not likely to develop its full potential.
4.3 Main U.S. advocates and opponents of TTIP energy provisions 4.3.1 Strategic and security views Opinions on TTIP in the U.S. are divided among those defending a more protectionist energy regime and those eager to ease energy production and trade. In general terms, those backing the increase of U.S. energy exports have an interest in countering Russian influence in the EU and Eastern Europe by decreasing their energy dependence. On the other hand, the opponents argue that increasing energy exports can threaten the long-sought U.S. energy independence and national energy security.
Between these opposites there are mediating voices that point to the cautious potential of U.S. energy exports to mitigate geopolitical risk, rather than ending it. As Blackwill and O’Sullivan explain:
‘the influx of North American gas to the market will not entirely free the rest of Europe from Russia’s influence, since Russia will remain the continent’s largest energy supplier. But additional suppliers will give European customers leverage they can use to negotiate better terms with Russian producers’ (Blackwill, R.D and M.L. O’Sullivan, 2014).
As for U.S. energy independence, the long-term balance between energy production and consumption does not imply that all types of primary energy produced in the U.S. will be consumed within its borders. Exports will be needed to free the surplus production of certain types of energy such as light oil and refined petroleum products, while other sources such as heavy oil will still require imports.
4.3.2 Hydrocarbon producing states and industries The division in opinions can also be found among U.S. states, because of their different stakes in the U.S. oil and gas industry. The potential impact on their economies differs in terms of regulation, investment and jobs depending on whether they host energy producing or energy consuming industries. The recent growth in oil production has come mainly from Texas and North Dakota, which produced more than 60 % of U.S. oil in 2014, particularly from the Eagle Ford formation (Texas) and the Bakken formation (North Dakota), superseding producer states with predominantly conventional oil such as Alaska and California.
Natural gas production is not as concentrated as oil. Seven states account for over 75 % of the production: Texas, Pennsylvania, Alaska, Oklahoma, Wyoming, Louisiana and Colorado. Political representatives of these states have lobbied for deregulation of crude oil and shale gas exports.
The U.S. hydrocarbons producing industry is a major private sector lobby group in the TTIP negotiations. The restriction on U.S. oil exports, the glut in the U.S. domestic market and wide spreads between WTI and Brent over the past years have affected the industry. This industry formed the association Producers for American Crude Oil Exports in 2014 to lobby for a lifting of the ban on oil exports, stopping its activities when the mission was accomplished.
The oil and natural gas producing industry has a big stake in TTIP. The two major EU and U.S. energy producers associations, the International Association of Oil & Gas Producers and the American Petroleum Institute, issued a position paper in favour of U.S. energy exports (International Association of Oil & Gas Producers, and American Petroleum Institute, 2015).
Policy Department, Directorate-General for External Policies
70
4.3.3 Energy consuming industries The hydrocarbon producing industry in the U.S. is not the only industry with an interest in shaping the energy chapter of the TTIP. The refining, the (petro-) chemical and other energy-intensive industries such as the steel and the aluminium industries have benefited from recent low oil and gas prices in the US, which have boosted their international competitiveness. Nevertheless, not all these industries have the same interests.
The recent U.S. crude oil production growth has consisted almost entirely of light sweet crude oil from tight formations. This increase of production was accompanied by a reduction of light oil imports of similar magnitude, which in 2014 almost vanished. This has caused a slight increase of the crude oil degree used in the U.S. refineries, which were designed and optimised to process heavy crude with lower viscosity, both national and imported (U.S. Energy Information Administration, ‘Crude Oil Production Forecast’). Some refineries showed a strong opposition against lifting the ban on U.S. crude oil exports (Reuters, 2014), probably because of an expected reduction of their margins and competitive advantage, as the EIA assessed (U.S. Energy Information Administration, ‘Removing Restrictions’). They were able to benefit from cheaper U.S. crude oil supply, while selling petroleum products on international markets where competitors had to struggle with higher feedstock prices.
On the other hand, the U.S. chemical industry acknowledges that its competiveness and its recent growth and increase of its exports strongly rely on the U.S. shale gas revolution. Low natural gas prices in the U.S. have created a competitive advantage for the U.S. industry and have fostered domestic and foreign investment and job creation in the sector (American Chemistry Council, 2013 (a)). Although increased LNG exports constitute additional demand for U.S. natural gas and will likely lead to slightly higher prices, the U.S. chemical industry does not oppose them. It endorsees trade liberalisation and calls for a stringent application of WTO regulations that would also benefit their exports (American Chemistry Council, 2013 (b)).
Finally, the U.S. metals sector comprises a wide variety of iron, steel, aluminium, and non-ferrous metals. It does not express a particular position over energy regulations in TTIP. On the one hand, their competitive advantage depends upon the domestic supply of ferrous scrap and the low cost of domestic natural gas supplies for their electric needs (Steel Manufacturers Association, 2016). Higher gas prices as a result of LNG exports will affect them to a certain extent. On the other hand, TTIP could provide advantages to ward off competing Chinese steel exports that have been on the mind of the industry (Steel Manufacturers Association, 2015). There is considerable interest in TTIP’s potential to reduce tariffs and non-tariff measures (NTMs) on the sector’s exports to the EU, which are estimated at 1.6 % and 6 %, respectively. An implementation of TTIP addressing these trade barriers is expected to increase U.S. metals exports to the EU by 120 % from 2012 levels by the year 2027 (Atlantic Council, 2014).
4.3.4 The interests of civil society and environmental groups Civil society interests and environmental groups also try to influence the TTIP negotiations. Civil society concerns focus on energy prices and availability, and environmental and climate related issues. Regarding pricing and affordability, the main concern is the rise of consumer’s prices for gasoline and natural gas due to an increase of crude oil and LNG exports. These concerns may be well founded for natural gas if LNG exports are enhanced, since the EIA expects an increase in residential natural gas
The EU’s energy diplomacy: Transatlantic and foreign policy implications
71
prices of 2 %-5 % above their base projection over the 2015-40 period (U.S. Energy Information Administration, ‘Increased Levels of Liquefied Natural Gas Exports’).
Levi (2012) makes a comprehensive assessment of likely effects of U.S. LNG exports, including macroeconomic factors such as output, jobs, and balance of trade, distributional aspects, oil security, climate change, foreign policy and impact on local environments. He finds that easing LNG exports provides net benefits, provided that appropriate environmental protections are in place. With regard to the oil trade the EIA expects that a narrowing of the Brent – WTI spread will make crude oil more expensive for processing industries, but expects that the pass on effect on gasoline and diesel prices will be limited (U.S. Energy Information Administration, ‘Removing Restrictions’).
Other civil society concerns revolve around environmental and climate issues. They tend to widen the focus to a global level beyond the narrow national interests in the U.S. and the EU. Their arguments can be summed up as follows: Loosening the restrictions on hydrocarbon exports will lead to an increase in crude oil and LNG trade from the U.S. to the EU, this will increase tight oil and shale gas production in the U.S. and will increase environmental impacts via fracking and possible methane leaks. It will perpetuate the hydrocarbon dependence of the EU because a more reliable and cheaper hydrocarbon supply could undermine green energy strategies. It will also increase GHG emissions due to the higher life-cycle emissions of LNG that occur during its transportation and liquefaction process. Thus increased U.S. energy exports could undermine the capacity of U.S. and EU governments to implement climate policies (see Smedley, T. for a summary or Solomon, I. for a comprehensive analysis).
Regarding this last point, it is argued that the increase in the U.S. LNG exports will reduce the share of natural gas in the U.S. power mix in favour of coal, and that the increase in the EU LNG imports will displace renewable energies. However, the discussion is not as simple. As David Livingston said in a recent interview:
‘It is possible that U.S. crude export volumes (…) displace other global crude oils in the market. In this case, the focus is not on the gross additional emissions but on the net effect. So, for example, if a light, sweet U.S. crude with a low GHG intensity replaced higher GHG crudes, such as a Nigerian crude with high-[natural gas] flaring associated with its production, or a heavy Venezuelan crude produced from the country’s oil sand. Then a more climate-friendly net effect would be registered. Similarly, if U.S. shale oil production ends up having a high GHG intensity (for example due to higher-than-anticipated methane venting) and replaces a low GHG intensity North Sea oil, then the net effect would be yet worse for the climate’ (Borderlex).
Policy Department, Directorate-General for External Policies
72
5 Chokepoints and transatlantic cooperation on the protection of critical energy infrastructure
5.1 The rationale for critical energy infrastructure protection (CEIP) As the world’s second and third largest energy consumers respectively, the U.S. and the EU share a common interest in protecting both domestic and external critical energy infrastructure upon which their respective economies depend (BP, 2015). Moreover, the prospect of an increase in LNG export intensity from the U.S.to Europe adds to the case for ensuring European LNG receiving infrastructure is adequately protected (Wilson, A.B., p. 3). However, although the EU and the U.S. have established an annual EU-U.S. Energy Council Dialogue, the joint statements of the dialogue thus far suggest that CEIP has only played a minor part within broader discussions about energy security (European Commission, 2015 (a)). This potentially represents a degree of compartmentalisation between the EU and the U.S.in their negotiations with one another when it comes to security and trade. Indeed, in light of the positive progress made by the European Union towards the establishment of a fully integrated ‘Energy Union’ and market, it is somewhat surprising that there is still no attempt to devise a similarly comprehensive and holistic critical energy infrastructure protection plan from an EU-wide level. Although the proposed Energy Union package does emphasise the importance of ‘energy security’, this is mostly viewed through the prism of securing supply source diversity, and the limitation of ‘supply disruptions’ in a general sense (European Commission, 2015 (a)).
To a degree this is understandable – recent tensions between Russia and Ukraine have led to renewed political interest in the realisation of a common European energy policy, grid infrastructure, and market, particularly among EU-28 members that import the majority of their gas from Russia via pipelines that transit through Ukraine. By and large though, concerns about Russia do not actually encompass the technological or physical failure of any specific piece of infrastructure. While such a qualification may be unimportant to an end-user, who is mostly concerned about whether energy is accessible or not, it would be a strategic mistake for policy-planners to delimit the problem of energy supply security to one of ensuring supply source diversity. In reality, energy networks are vulnerable to a far wider variety of risks than geopolitical unpredictability - natural disasters, terrorism (physical and cyber), and technical or organisational risks, all have the potential to suddenly impair access to energy infrastructure and services, and thereby upset the social, political and economic stability of a state or region.
Thus, whether or not the Energy Union facilitates greater overall energy security for the European Union, it is still necessary to prepare for the destruction or disruption of critical energy infrastructure that would have a significant negative impact on the vitality of one or more EU members. Accordingly, this chapter addresses the urgent need to develop a more comprehensive and common Transatlantic critical energy infrastructure protection plan that actually aligns with the vulnerabilities of a ‘fully integrated’ Energy Union. There are a number of dimensions to this challenge, but given the omission of ‘critical energy infrastructure’ from the recently released EU Energy Diplomacy Action Plan, this chapter specifically sets out to show that if the Energy Union is serious about ‘critical energy infrastructure protection’, then this needs to be more fully reflected within its internal and external strategic planning, particularly within the Transatlantic community.

The EU’s energy diplomacy: Transatlantic and foreign policy implications
73
5.2 Shared transatlantic critical energy infrastructure concerns In considering the potential avenues for transatlantic cooperation on CEIP, it is useful to first consider those critical energy infrastructure risks that are also shared by its transatlantic partners. While much of the EC’s own Energy Union Security Strategy rightly focuses on reducing external energy demand via increases to energy efficiency standards and internal production, the EESS largely addresses this challenge by detailing the EUR 1 trillion of investment that will need to be made in new or replacement energy infrastructure between 2014-2020 (European Commission, 2015 (b), p. 3). For example, if the EU-28 is to meet its 10 % interconnection target by 2020, it is estimated some EUR 200 billion of investment will be needed in new internal grid-interconnection infrastructure alone (European Commission, 2015 (b), p. 3). In total, 195 energy infrastructure projects have been identified as ‘projects of common interest’ (PCIs) by the EC as essential to the completion of the European internal energy market (European Commission, 2016). PCIs are eligible for ‘accelerated permit planning, improved regulatory conditions and access to financial support totalling EUR5.35 billion from the Connecting Europe Facility’ (European Commission, 2016). However, although existing EU regulations imply that these projects will eventually be assessed with respect to the 2008 directive on critical infrastructure, it is notable that within the criteria for being declared a ‘PCI’, there is again only reference to ‘security’ in terms of supply source diversity (European Commission, 2016). Moreover, those energy PCIs identified within the 2014 EESS fall within a fairly narrow band of the larger energy infrastructure picture – in particular, there is no mention of energy related ICT, which is a major area where the EC stands to gain from closer cooperation with its transatlantic partners (European Commission, 2014 (c)).). As such, it is worth briefly outlining several further critical-energy-infrastructure-themed areas where the EU and the wider transatlantic community have to potential to attain higher-quality outcomes through cooperation.
5.2.1 Information and communication technology infrastructure Energy and ICT-related infrastructure are so intimately linked that an ICT infrastructure failure has the potential to disrupt nearly every aspect of the energy supply chain, in every energy market (Boin, A. et al., pp. 136-37). While the automation and computerisation of energy control systems enables operators to obtain more efficient outcomes from existing and new energy assets, the Energy Union’s call for an increasingly remote-controlled and interoperable ‘smart’ energy grid, with greater information sharing between members, opens the door to new forms of system-wide vulnerability (European Commission, 2014 (c), p. 12; OSCE, p. 22). Given system-failure can also occur do to deliberately malicious human behaviour, nor can the Energy Union solely rely upon an internal response plan. And yet, given the EESS and the Energy Union Package have only a single sentence each about ‘cyber-security’, observing that it should be ‘ensured’ and ‘improved’ respectively, there is clearly room for greater integration of the EU’s energy agenda and its otherwise disconnected work on promoting cyber-infrastructure-protection. Ultimately, maintaining efficiency, flexibility and overall ‘security’ within the EU’s energy system will require major upgrades to the information and communication technology that functions as the interface between the energy infrastructure and its human operators.
In 2010, the EC’s Directorate-General of Energy established the ‘Thematic Network on Critical Energy Infrastructure Protection’ (TNCEIP), a network made up of ‘European owners and operators of energy infrastructure in the electricity, gas, and oil sectors’ (TNCEIP). In the TNCEIP’s 2012 position paper on CEIP, it was revealed that ‘all members of the TNCEIP have faced a constant increasing number of attacks on their critical energy infrastructure … mostly in the form of thefts, vandalism, and cyber-attacks’ (TNCEIP). This claim is consistent with several related international incidents, including the February

Policy Department, Directorate-General for External Policies
74
2011 theft by Chinese-based hackers of confidential data from western oil and gas companies (Bartz, D.), the use of malware to disable over 30 000 computers at Saudi Aramco in August 2012, as well as RasGas in Qatar, and a November 2012 Dedicated Denial of Service (DDoS) attack on a German electricity transmission network (OSCE, p. 28). In this regard, ICT and interoperability issues are clearly a common area of concern for energy system operators throughout the Transatlantic community.
Although the hacking incidences above appear to have been more about intellectual property theft than deliberate attempts to induce infrastructure failure, exercises commissioned by the U.S. Department of Homeland Security (DHS) have shown that a determined cyber-criminal or terrorist organisation could cause severe grid-failure in the US, and elsewhere. In the ‘Aurora Generator Test’, ‘hired hackers’ demonstrated the ability to both control an electricity generator, and caused it to self-destruct, and in a similar DHS-sponsored ‘trial hack’, it was revealed how an entire state’s power system could have been put out of service for ‘several weeks’ (OSCE, p. 28). Both these experiments show how ICT weaknesses can be exploited in such a way that a coordinated cyber-attack on various components within an energy network has the potential to cause as much service disruption – if not more - as that of a successful attack on a more concentrated energy target, like a single power station. Thus, with the EESS calling for an ‘interconnection target of at least 10 % of the installed electricity production capacity for all Member States’ (European Commission, 2015 (b), p. 8), with a proposed increase in interoperability to 15 % by 2030, the EU clearly needs to consider ways in which it can work with international partners and thereby prepare more aggressively for ICT risks implicit within a more integrated energy grid (Alcaraz, C. and Zeadally, S., p. 56).
5.2.2 The risks of (not) sharing information Although the intentions within the 2008 Critical Infrastructure Protection (CIP) directive has been generally welcomed by EU Members, the expectation that Member States that host European Critical Infrastructure (ECI) should share critical information about that infrastructure with other stakeholder states has been criticised on the grounds that CIP is ‘first and foremost a national responsibility’ (Argomaniz, J., p. 264). In 2012, a UK House of Lords report in fact argued that ‘the designation of many categories of sensitive infrastructure as ECI would, because of the wide sharing of information this would entail, not so much protect the infrastructure as potentially put it at risk’ (cited in Argomaniz, J., p. 264).
Although there is much to recommend the principle of information-sharing, detractors have argued that as many critical infrastructures/ECIs are privately owned, commercial confidentiality, lack of mutual trust, and the desire to avoid the designation of ‘ECI’ in the first place for fear of regulatory burden, all render the concept a practical ‘non-starter’ (Hayden, E., p. 17). Yet unless an information-sharing culture emerges in ‘lock-step’ with the overall push towards EU energy system integration, the present reluctance or confusion on behalf of some infrastructure owner-operators and member states about information sharing requirements (European Commission, 2012, p. 12; Rhinard, M. and Boin, A., p. 13; Umbach, F., p. 6), particularly involving ICT weaknesses or cyber-attacks upon their respective energy assets, has the potential to not only obfuscate awareness about a pending overall systemic risk to the energy grid, but in fact compounds the risks of a CEI disruption.
5.2.3 Gas Infrastructure within the EESS While there has been a decline in domestic consumption of gas within Europe, there has been an even steeper fall in internal production (Wilson, A. B., p. 3). As detailed in earlier chapters, with gas still
The EU’s energy diplomacy: Transatlantic and foreign policy implications
75
accounting for around one quarter of final energy consumption in the EU, there will also likely be a short-term need for an increase in gas imports into the EU area from non-traditional sources, particularly from outside of Russia (Eurostat, ‘Consumption of Energy’).
In particular, as risks associated with gas transport infrastructure connected to Russia and Libya are likely to linger for the foreseeable future, the EC has begun to prepare for a gradual increase in imports of LNG, as indicated by the European Commission’s desire to develop an ‘EU strategy for LNG and gas storage’ through the Energy Union (Wilson, A. B., p. 3). While there is still a great deal of uncertainty as to the future of the international LNG market (insofar as such a thing exists), the need to prepare for the disruption of LNG infrastructure – existing and planned – is as essential as it is for natural gas pipelines.
27 gas-related PCIs are identified within the 2014 EESS, several of which have the potential to meet the ECI criteria (European Commission, 2014 (c)). The majority of these PCIs involves investment in pipelines, including in new interconnectors between member states, in bringing ‘bidirectionality (reverse-flow) capability into existing pipelines, and in the expansion of pipeline volume capacity. Notably, this includes the Trans-Anatolian Pipeline (TANAP), which will complete the ‘Southern Gas Corridor’, connecting the large Shan Deniz gas field in Azerbeijan to the EU gas network. However there are also PCIs relating to new LNG (seagoing) Carriers, 5 new LNG import terminals (one floating), as well as 2 new gas compressor stations. This is on top of the recent construction of the Świnoujście LNG facility in Poland, and the floating Klaipėda LNG terminal (serviced by a large tanker named ‘the Independence’) and regasification unit in Lithuania, bringing the total number of operational LNG import facilities within the EU to 21 (see Table 3.5). According to Gas Infrastructure Europe, a further 8 LNG import terminals are currently under construction, and an additional 27 are planned to be completed by approximately 2020, although whether this occurs will hinge upon the perceived future stability and price-range of the market (Gas Infrastructure Europe).
5.2.4 Oil Infrastructure within the EESS Although 90 % of the crude oil consumed in Europe is imported, the global nature of the oil market is such that the probability of sudden and ‘critical’ supply disruption is low (Eurostat, ‘Energy Production and Imports’). Moreover, with current oil stocks equivalent to 120 days worth of consumption, the EU stockholding obligation places it well above the minimum stockholding requirement of IEA members - 90 days worth of the previous year’s net imports (European Commission, 2014 (c), p. 5). As such, the EESS foresees little danger in terms of access to oil, and it identifies no PCIs that involve the oil industry. However, as one third of Europe’s crude oil import needs are supplied by Russia, mostly via the Druzhba pipeline, the EESS does acknowledge that private crude oil suppliers within Europe need to have alternative supply sources available in the event of any disruption to this supply source (European Commission, 2014 (c), p. 5).
5.2.5 General threats to oil and gas infrastructure access Every stage within oil and gas supply chains is potentially vulnerable to an exogenous security threat – either due to war, local conflict, sea piracy, terrorism, or some similarly violent threat (OSCE, p. 23). Occasional hijackings of marine vessels or offshore facilities, and small-scale vandalism and theft with respect to pipelines do not really fall within the category of ‘critical threats’ to Europe’s energy security. The threats of interest here are those that fall into the category of ‘low-probability high-consequence’ - an incident that is ‘not a random occurrence but is driven by a motivated perpetrator that … [has adapted] to the security measures installed’ (Luca, U. et al., p. 48).

Policy Department, Directorate-General for External Policies
76
Similarly, notwithstanding many similar vulnerability ‘points’, the disruptive effect of attacks on oil and gas infrastructure are not identical in nature. Firstly, as Figure 5.1 demonstrates, the gas supply chain varies according to the form in which gas is transported and consumed by the end-user. Where natural gas is supplied via pipeline, compressor stations are required at regular intervals to ensure the gas is sufficiently pressurised for transport. If gas needs to be converted into LNG for ease of long distance transportation, it first needs to pass through a liquefaction facility, and then a regasification plant at its end destination – assuming it is not being consumed in its LNG form. There is also a distinction to be drawn between attacks on distributional infrastructure and more ‘centralised’ infrastructure. Although there is evidence that coordinated attacks on the ‘pipes’ that make up a pipeline system can cause sizeable supply-chain disruptions (Giroux, J. et al.), repairing damage to a pipeline is relatively easier than repairing damage to a compressor station for example.
Figure 5.1 The LNG supply chain
Source: LNG for Shipping, 2016
5.3 Transit countries and threats to oil and gas infrastructure access 5.3.1 Gas pipelines When it comes to exploring the potential implications for the EU of relying upon critical energy infrastructure that lies outside the EU’s jurisdiction, the summary of Ukraine’s confrontation with Russia between 2005 to the present provided in chapter three is particularly revealing. Although the EU assisted and financially backed Ukraine in the latter’s 2009 negotiations with Russia, EU states concluded in the wake of the standoff to pursue a variety of strategies aimed at reducing their apparent dependence upon gas imported via Ukraine (Far, S. and Youngs, R.). Efforts included the establishment of the Energy Community Treaty, a regional regulatory framework which worked with willing non-EU European states that wished to avoid a repeat of the negative outcomes of the 2009 shutdown (Bosnia, Moldova, Montenegro, Serbia, Ukraine), and opening the door to energy infrastructure investment within these countries by EU public and private funds (O'Mahony, M., p. 3). There has also been an increased level of interest in facilitating non-traditional import sources of natural gas – not least from the US.
The EU’s energy diplomacy: Transatlantic and foreign policy implications
77
However not all of the responses by EU members have been quite so coherent – a series of alternative pipeline proposals that have been made since 2005 point to a general lack of agreement by the EU states themselves over how best to strategically plan for the critical energy infrastructure needs of the European Union (Herranz-Surallés, A., p. 11). Although the Nord Stream pipeline that directly connects Russian gas suppliers with German gas distributors was planned prior to the Ukrainian-Russian disputes that began in 2005, its completion in 2011, and on-going proposals to double the capacity of the system (the ‘Nord Stream 2’ proposal), continue to lack the unanimous support of the rest of the EU – not least those transit countries between Russia and the rest of the EU who are still predominately reliant on Russian gas and are looking to diversify their supply chain, or those countries that were willing to take part in the alternative ‘South Stream’ project (Dempsey, J.; Spiegel, P. and Politi, J.). As Figure A.2 in the annex shows, the proposed ‘South Stream’ pipeline would have provided an alternative route for Russian gas to enter into the European Gas Transmission network via the construction of a USD50bn 2,400km pipeline system that would have traversed the Black Sea, Bulgaria, Greece, Serbia, Hungary, Slovenia, Austria and Italy (Oliver, C. et al.). In large part due to their experience during the 2009 Russia-Ukraine standoff, countries along the proposed South Stream route had a strong interest in ensuring they were less reliant upon the Brotherhood pipeline that passes through Ukraine (Herranz-Surallés, A., p. 11 and Figure A1).
How determined the Russian government was to ever actually deliver on the South Stream proposal is a point of contention – the economics underpinning the plan were dubious from the outset, and the initiative was essentially abandoned by Gazprom in late 2014 (Koďousková, H. and Jirušek, M.). There are suspicions that the project was mainly intended to undermine the case for the Nabucco pipeline (Figure A2 in Annex), a rival project that would have connected the Shah Deniz Gas field in Azerbaijan to a European gas hub in Austria, via Turkey, Bulgaria, Romania, and Hungary, thus reducing the overall dependency of the European energy grid upon Russian gas (Dempsey, J.). Either way, with the completion of the Nord Stream (and its potential expansion), the economics of both the ‘South Stream’ project, and the Nabucco pipeline became more difficult, as energy distributors in northern European countries that benefit from the (more) direct connection to Russia no longer have as strong an incentive to pay for a new gas pipeline that would transport its contents via several Southern European countries first. Non-northern European states have questioned the consistency of the Nord Stream II project given the EU’s stated desire to pursue a diversified import strategy, and this concern has also been echoed by U.S. officials posted in the region (Crisp, J.).
Ultimately, the Azerbaijan suppliers opted for a third pipeline bid – the Trans Adriatic Pipeline (TAP) consortium, that uses the same initial route through Turkey, but then joins up with the European gas grid in Italy via traversing Greece and Albania on the way. Recognised by the EU as a project of common interest, the TAP is eligible for additional EU financing insofar as it contributes to the EU’s goal of establishing a ‘Southern gas corridor’ that diversifies the overall European supply of gas sources (European Commission, ‘Projects of Common Interest’). In this latter regard the TAP project will provide access to an additional 10-20 bcm of gas per year, which is about 1.5-3 % of total annual gas consumption in the EU (Trans Adriatic Pipeline). Yet despite the incrementally positive nature of this diversification away from Russia, from a CEIP perspective, the EC should nevertheless also work to put in place a contingency plan in the event Turkey’s political stability comes into question, such that any potential future disruption to the feed-in gas route into the TAP pipeline itself will not result in a critical supply shortfall for EU members.
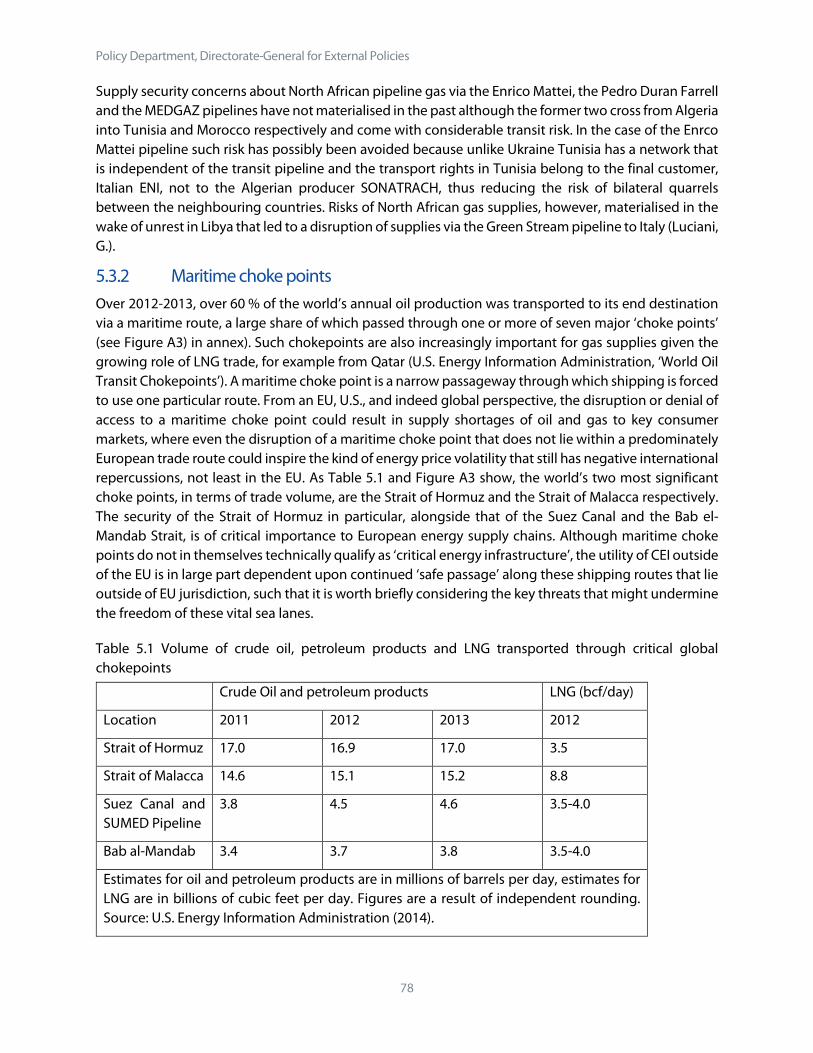
Policy Department, Directorate-General for External Policies
78
Supply security concerns about North African pipeline gas via the Enrico Mattei, the Pedro Duran Farrell and the MEDGAZ pipelines have not materialised in the past although the former two cross from Algeria into Tunisia and Morocco respectively and come with considerable transit risk. In the case of the Enrco Mattei pipeline such risk has possibly been avoided because unlike Ukraine Tunisia has a network that is independent of the transit pipeline and the transport rights in Tunisia belong to the final customer, Italian ENI, not to the Algerian producer SONATRACH, thus reducing the risk of bilateral quarrels between the neighbouring countries. Risks of North African gas supplies, however, materialised in the wake of unrest in Libya that led to a disruption of supplies via the Green Stream pipeline to Italy (Luciani, G.).
5.3.2 Maritime choke points Over 2012-2013, over 60 % of the world’s annual oil production was transported to its end destination via a maritime route, a large share of which passed through one or more of seven major ‘choke points’ (see Figure A3) in annex). Such chokepoints are also increasingly important for gas supplies given the growing role of LNG trade, for example from Qatar (U.S. Energy Information Administration, ‘World Oil Transit Chokepoints’). A maritime choke point is a narrow passageway through which shipping is forced to use one particular route. From an EU, U.S., and indeed global perspective, the disruption or denial of access to a maritime choke point could result in supply shortages of oil and gas to key consumer markets, where even the disruption of a maritime choke point that does not lie within a predominately European trade route could inspire the kind of energy price volatility that still has negative international repercussions, not least in the EU. As Table 5.1 and Figure A3 show, the world’s two most significant choke points, in terms of trade volume, are the Strait of Hormuz and the Strait of Malacca respectively. The security of the Strait of Hormuz in particular, alongside that of the Suez Canal and the Bab el-Mandab Strait, is of critical importance to European energy supply chains. Although maritime choke points do not in themselves technically qualify as ‘critical energy infrastructure’, the utility of CEI outside of the EU is in large part dependent upon continued ‘safe passage’ along these shipping routes that lie outside of EU jurisdiction, such that it is worth briefly considering the key threats that might undermine the freedom of these vital sea lanes.
Table 5.1 Volume of crude oil, petroleum products and LNG transported through critical global chokepoints
Crude Oil and petroleum products LNG (bcf/day)
Location 2011 2012 2013 2012
Strait of Hormuz 17.0 16.9 17.0 3.5
Strait of Malacca 14.6 15.1 15.2 8.8
Suez Canal and SUMED Pipeline
3.8 4.5 4.6 3.5-4.0
Bab al-Mandab 3.4 3.7 3.8 3.5-4.0
Estimates for oil and petroleum products are in millions of barrels per day, estimates for LNG are in billions of cubic feet per day. Figures are a result of independent rounding. Source: U.S. Energy Information Administration (2014).
The EU’s energy diplomacy: Transatlantic and foreign policy implications
79
Although the majority share of oil passing through the Strait of Hormuz is bound for Asian markets (over 85 %), around 30 % of all globally seaborne-traded oil passes through this strait between Oman and Iran (U.S. Energy Information Administration, ‘World Oil Transit Chokepoints’). Any closure would send global oil prices skyrocketing and would have implications well beyond Asia. Unlike other maritime choke points, the location of the Strait of Hormuz in relation to nearby oil and LNG producing states – Qatar, Kuwait, the United Arab Emirates, Saudi Arabia, Iraq and Iran - means it is not possible for many suppliers within these states to access international markets via an alternative maritime route. Only some alternative export outlets exist in the form of the 4.8 mbpd East-West pipeline to the Red Sea in Saudi Arabia and a 1.5 mbpd pipeline from the UAE’s interior to the port of Al-Fujairah, which lies on its Eastern shore outside the Strait.
With north and south bound sea lanes that are each only 3.2km wide at their narrowest point, ensuring access to the Strait of Hormuz has been an on-going strategic concern for major oil consuming states, particularly the transatlantic community (Dreyer, I. and Stang, G., p. 21). Bab el Mandab and the Suez Canal with the SUMED Pipeline are important chokepoints as well, but less crucial in terms of magnitude of transported volumes and threat scenarios.
The 2011 uprising in Egypt had little to no noticeable effect upon the daily functionality of the Suez Canal (apart from speeding up its expansion and an upgrade in the Egyptian military’s protection), the risk to the Canal ‘infrastructure’ itself is relatively low, in part because the Canal itself does not rely upon any locking mechanism and is composed of a largely straight 193km waterway with free-flowing seawater (U.S. Energy Information Administration, ‘World Oil Transit Chokepoints’). With the completed expansion of the Suez Canal in 2015 such that it is now both wider and deeper has reduced both the waiting time and risk of waiting at ‘choke points’ within the choke point of the Canal itself (Emmerson, C. and Stevens, P.; Saleh, H.). Nevertheless, a few minor and unsuccessful attempts at attacking Suez Canal targets – namely ships – have been uncovered or foiled in recent years, including one attempt by self-described ‘Jihadis’ to fire a rocket propelled grenade into a container ship (Bloomberg, 2016; Spencer, R.), such that backup alternatives to the Suez Canal route are worth taking into consideration.
The SUMED pipeline that functions as a complement to the Suez Canal system is more vulnerable due to its route and close location to population centers like Cairo. Due to the limited depth of the Suez Canal, Very Large Cruise Carriers (VLCCs) are unable to traverse the Canal fully laden, and thus rely upon SUMED to offload a portion of their oil cargo at the Ain Sukhna terminal in the Gulf of Suez (a process called ‘lightering’), before proceeding through the canal to collect the temporarily offloaded product at the Sidi Kerir terminal in Alexandria. Although recent upgrades to the Suez Canal have resulted in shorter transit times, the need for fully laden VLCCs to ‘lighter’ via the SUMED pipeline before entering the canal has not changed (World Maritime News, 2015). The Egyptian military has provided increased protection for the pipeline in previous periods of heightened tension, and has thus far managed to prevent any notable incidents from occurring (Wahba, A. L.; Cordano, D.). However, in the event both the SUMED and the Suez Canal system are rendered inaccessible, for the majority of oil and gas exporters, the more likely alternative route to Europe or North America would involve traversing the Cape of Good Hope at the Southernmost end of Africa – a significant and costly diversion which would add up to 15 days in journey-time (U.S. Energy Information Administration, ‘World Oil Transit Chokepoints’).
Situated between the Horn of Africa and Yemen, the Bab al-Mandab Strait forms part of the export route that later passes through the Suez Canal or SUMED pipeline. However, those products that could be

Policy Department, Directorate-General for External Policies
80
transported to the west of Saudi Arabia, via the East-West Petroline, could still bypass the Strait of Bab al-Mandab and head on to the Suez Canal by entering the Red Sea at a more northern access point, however with a spare capacity of around 2 mbpd, this would only provide a partial alternative (Emmerson, C. and Stevens, P., p. 5). Nevertheless, the probability of a major disruption occurring in the Bab al-Mandab Strait is low, with the most recent cause of concern being a spike in piracy activity between 2010-2011. Following a concerted campaign by EU and NATO countries however, with contributing naval forces from China, Japan, Russia and India, this particular threat appears to have largely dissipated (Smith, M.), with the U.S. Office of Naval intelligence reporting only two minor and unsuccessful piracy events off the Horn of Africa for 2014, down from 122 in 2011 (U.S. Office of Naval Intelligence).
Recent geopolitical tensions within the Gulf region point to the need for vigilance with respect to the stability and security of the Hormuz Strait. Notwithstanding the recent ‘détente’ between Iran and the transatlantic community, second tier Iranian officials threatened to block the Strait as recently as 2012 out of retaliation against US-EU economic sanctions (Emmerson, C. and Stevens, P., p. 5). Concerns about a future blockade are widespread, especially in the event of another breakdown in relations of Iran with the U.S. and European powers. Such concerns have prompted the UAE to construct its land pipeline to Al-Fujairah. Yet a word of caution is in order. A closure of the Strait of Hormuz is unlikely, not only because of the recent rapprochement in the Iranian nuclear standoff. Hormuz is crucial for Iran’s own oil exports and essential imports such as food. It does not have alternative export outlets like Saudi Arabia or the UAE and no possible self-interest in closing the Strait. It also lacks the military capabilities to do so sustainably against U.S. naval power in the region.
5.4 Best practice CEIP examples from the transatlantic community By building upon the conception of CEIP outlined in part 1 of this chapter, and in reference to the kinds of CEI threats outlined in part 2, this section firstly looks at how Critical Infrastructure Protection (CIP) policies in Europe potentially stand to gain from taking aboard CIP lessons from the USA, but also how greater transatlantic cooperation itself could deliver a significant value-add to the protection of CEI that is external to the jurisdiction of the EU. In this latter regard, particular attention is paid to the potential for greater institutional cooperation on CEIP between the EU and multilateral processes like NATO, the IEF, and to an extent, even the G20.
5.4.1 Transatlantic lessons in CEIP? The resilience of the European energy system in the face of an infrastructure shock largely comes down to its ability to return to stable conditions post-disruption. `This is in turn dependent upon the level of crisis-coordination between the EU, member and partner states, and the owner-operators of energy infrastructure assets. As observed within the U.S. DOE’s CEIP plan: ‘No single government agency, industry group, or company can secure the entire energy infrastructure’ (DOE and DHS p. 19). However, whereas the U.S. DHS has developed a fairly comprehensive and well-integrated national infrastructure protection plan (NIPP) that has been regularly updated since 2006, complemented by an Energy Sector Specific Plan (ESSP) released in 2010 (and that is due for renewal), the EU’s efforts have been, by comparison, haphazard and mostly aspirational. This is not to discount the dramatically different bureaucratic and administrative structures that U.S. and EU administrators must engage with when designing something as complex as an economy-wide CIEP policy, however, efforts to boost the

The EU’s energy diplomacy: Transatlantic and foreign policy implications
81
integration of EU Member’s energy systems do seem to be moving at a faster pace than the integration of CIP concerns into the EESS.
Several key elements within the EU’s CIP agenda and EESS need to be resolved before the EU’s CEIP efforts can be brought roughly into line with the more comprehensive approach of the U.S. NIPP. These include, firstly, an issue that is identified within the Energy Union Package – namely: ‘the European Union has energy rules set at the European level, but in practice it has 28 national regulatory frameworks... This cannot continue’ (European Commission, 2015 (b), p. 3). Yet this dynamic is unfortunately replicated within the infrastructure protection policies of EU Members as well. Thus, if the Energy Union is to facilitate the delivery of a truly ‘holistic’ EU-wide CEIP policy in line with the issues discussed in this chapter, there needs to a be more concerted effort by the European Commission, supported by Member states, to better integrate the work of the EU that pertains to critical infrastructure protection. This means directly working to ensure that the EC’s workstreams on Critical Infrastructure (under the Directorate-General (DG) Home Affairs), Energy Security (DG Energy), its Digital Agenda (cyber-security – also under DG Connections Networks, Content and Technology), Foreign Policy (under the EU’s Common Foreign and Security Policy) are more aware of how their respective work aligns with the pressing need for more ‘holism’ and coherency within the EU’s critical energy infrastructure protection policy.
Furthermore, as much of the CEI within Europe is privately owned (European Commission, 2013 (c), p. 3), effective public-private structured dialogues are essential to ensure the array of relevant stakeholders in CEIP are able to work towards a common security objective. This latter observation has also been made within the EC’s SWD on the future of the EPCIP, however to date the main initiative in this regard has been a fairly limited experiment bringing together the EPCIP and only four identified ECI operators (DOE and DHS p. 19). This is in stark contrast to the progress made by the U.S. DOE, which works alongside multiple stakeholders to promote CEIP, under the NIPP partnership framework, as depicted within the organisational chart shown in Figure 3. The DOE framework is notable not only for ensuring Cyber-Security is a core focus with respect to CEIP, but also encouraging stakeholders to join working groups (WG) across a broad range of issues relevant to energy infrastructure.
5.4.2 Transatlantic cooperation over external critical energy infrastructure protection
Finding the right governance and institutional framework in which to pursue external CEIP is a challenge for both the EU and other major energy players. To date, the EU has done a reasonably effective job of promoting its own energy governance and regulatory standards within its most immediate neighbourhood through the Energy Community Treaty, such that the Western Balkans and Ukraine now operate under the same rules as the EU energy market (Buzek, J., p. 8). Further afield however, the EU’s external competence in responding to disruptions to - or assisting in the protection of - critical energy infrastructure is less clear.
In 2007 the EC launched the Instrument for Stability in 2007 (now the ‘Instrument contributing to peace and stability’ - IcSP), which grants the Commission the ability to activate rapid technical and financial external assistance in the event of any conflict or threat to critical infrastructure (Regulation (EU) No 230/2014). Yet how the IcSP would actually be deployed in order to minimise the fallout from a CEI disruption, particularly of the kinds described in this paper, is left largely undefined. Either way, due to probable further integration between European and North American energy markets, not least because
Policy Department, Directorate-General for External Policies
82
of the TTIP, as well as a shared history of strategic cooperation, any future international accord or process geared towards the protection of external critical energy infrastructure, will likely be heavily shaped by the mutual interests of the EU-US relationship. Following are some potential policy options for the transatlantic dialogue on CEIP.
5.4.3 Governance and financing of CEIP Collectively accounting for around a third of global energy consumption, and over 40 % of global GDP, the EU-US partnership is in prime position to promote the significance of CEIP within a range of relevant international energy and economic fora (BP, 2015). Firstly, the EC should support IEA involvement in international CEIP policy formation, as the IEA is the most well equipped of the multilateral energy initiatives in terms of being able to provide policy advice and analysis. However, because the IEA’s membership is restricted to the OECD states, thus excluding the major energy supply states that play host to the external CEI of interest here, EU-US efforts should also focus upon promoting CEIP within the International Energy Forum (IEF), that brings together major energy importers and exporters (including the OPEC countries) as well as every major multilateral energy process (Hirst, N. and Froggatt, A.). There is also an opportunity for the EC to work with, or build upon, the work of the ‘Critical Five’, a collective initiative of the United States, the United Kingdom, Canada, Australia and New Zealand, that meets annually to consider common critical infrastructure concerns (Critical 5, ‘Role of Critical Infrastructure in National Prosperity’).
In terms of ensuring financing for CEIP is on the radar of global development financing agencies, diplomatic efforts should also be made to ensure CEIP is considered within any major investment into energy initiatives within the World Bank, IMF, and similar authorities. Insofar as newer entities like the Asian Infrastructure Investment Bank and the New Development Bank BRICS are also interested in funding CEI, the EU and U.S. should work through global forums like the Group of Twenty (G20) and the Global Infrastructure Hub to advocate for CEIP planning being included within the necessary criteria within the financing of CEI projects.
5.4.4 Hard power CEIP Although there is an understandable reluctance on behalf of certain EU Member States to conflate EU Energy Security of supply concerns with more ‘hard power’ military solutions (Niglia, A., p. 8), the EC, through its energy dialogues with the US, is also well placed to push security partner processes to engage in more explicit preparatory planning in the event of a major external CEI disruption. Due to the high overlap in membership, the obvious partner in this regard is NATO. NATO has had an interest in CEIP since 2001, NATO Heads of State identified energy infrastructure security as a NATO-level concern in 2006 and again in 2014 (NATO, 2006; 2014), and while speaking at the launch of the NATO Energy Security Centre of Excellence in Lithuania in 2013, then NATO Secretary General Anders Fogh Rasmussen noted: ‘Energy security is not a call to arms. But when it comes to understanding the security implications of global resource developments, NATO must be ahead of the curve’ (Niglia, A., p. 8).
Aside from its coordination of missions aimed at keeping vital sea-lanes open, NATO is also well equipped to assist the European Community in strengthening the recently established Critical Infrastructure Warning Information Network (CIWIN initiative). CIWIN was launched in 2013 with the objective of assisting Member States and the European Commission to exchange information on shared threats, vulnerabilities and appropriate measures and strategies to mitigate CIP risks. As CIWIN is still in a prototype stage, it would make sense to learn from or apply NATO’s relatively well-developed

The EU’s energy diplomacy: Transatlantic and foreign policy implications
83
intelligence and information sharing best practices to international energy infrastructure developments, as well as in coordinating multilateral cyber-defence programs with an internal and external CEI dimension (Fogh Rasmussen, A.). However, actual deployment of security personnel aside, NATO need not be the only institutional partner with regards to external CEIP, as the Organisation for Security and Co-operation in Europe (OSCE) has also worked to improve the energy cyber-security capacity of members (Borchert, H. and Forster, K., p. 147). Still, with respect to ensuring Transatlantic military personnel are prepared for any disruption to CEI, such as the U.S. 5th fleet that is permanently stationed in Bahrain (notably in close proximity to the Strait of Hormuz), the EU will need to ensure that lines of communication between EU states and the U.S. are not weighed down by additional and superfluous EU requirements (Dreyer, I. and Stang, G., p. 21).
The EU principle of subsidiarity is thus not only important in terms of bureaucratic efficiency, but with respect to CEI security concerns, care must be taken to ensure that any EU role in a coordinated military response between the U.S. and EU states is value-adding, insofar as it assists and does not actually hinder the timeliness and proportionality of a response to an external supply chain disruption.
Policy Department, Directorate-General for External Policies
84
6 Conclusion and policy recommendations European energy security has moved up the priority scale of EU foreign policy against the backdrop of a rapidly changing global energy landscape. The unconventional oil and gas revolution in the U.S. offers some opportunities for supply diversification, but above all its impact will be indirect in the form of more liquid and transparent energy markets and an improved negotiation position of the EU with traditional suppliers from Russia and OPEC, provided European countries undertake their homework and unify their gas and electricity markets and put the necessary interconnecting infrastructure in place. That having said the importance of Russia and OPEC countries for European supplies will not go away and they need to be included in a critical EU energy diplomacy.
The U.S. is also an important partner of the EU in promoting rules based, transparent and competitive global energy markets. Platforms to discuss mutual energy concerns already exist, for example in the form of he EU-U.S. Energy Council and could receive new impulses by a successful conclusion of the TTIP, with or without a separate energy chapter. Considerable differences exist between the EU and the U.S. regarding environmental standards (e.g. fracking and FQD), climate policies and local content provisions for renewable energy projects. Within the EU there are also different policy stances between member countries regarding various energy sources (e.g. nuclear, coal and renewables), depending on national energy mixes, regulatory frameworks, geographic locations and policy preferences. The European parliament can play a crucial role in communicating controversial energy issues to national audiences and forging compromises. It can also give crucial impetus to EU wide energy initiatives via its budgetary prerogatives and its cooperation with the European Commission. Finding common ground will not be easy, but considerable convergence of interests exists regarding external supply security and climate change mitigation. Against this backdrop we conclude with the following policy recommendations:
• Encourage energy efficiency, increased use of renewables and less wasteful energy consumption policies in hydrocarbon producer countries as part of the EU Energy Diplomacy in order to safeguard hydrocarbon supplies and export capacities. This will also help the EU’s policy objectives in terms of climate change mitigation. Countries of the European Neighbourhood Policy (ENP) could be primary partners for such initiatives. One could also discuss how to include the Gulf countries in such discussions, possibly via the ENP or the Union for the Mediterranean, which has the Arab League as a member, which in turn includes the GCC countries.
• Push for smart grid integration and storage solutions for renewables. The main obstacle for a major expansion of renewables is not cost anymore, but intermittency. Many renewables are now cost competitive with conventional sources, especially if hydrocarbon subsidies in some countries such as the Gulf, Russia or India were cut. Storage solutions such as batteries, pump storage or electric cars together with smart grid integration that enable flexible demand patterns by swing consumers could ease the integration of renewables into electricity grids and greatly enhance their application. It would also expand export markets for European producers of such technologies. The EU should fund related R&D and should highlight such issues in its Energy Diplomacy and the TTIP negotiations. A smart integration of grids between Spain, Portugal and Morocco and an integration of the Spanish grid with the rest of Europe could offer the vision of base load generation with renewables, for example.
• Push negotiations and infrastructure projects with Azerbaijan, Turkey and Iran. Iran has now the world’s largest natural gas reserves and could serve as a future diversifier to the EU by

The EU’s energy diplomacy: Transatlantic and foreign policy implications
85
pipeline or LNG.
• Consider the United States as a possible future supplier of natural gas that can help to diversify European natural gas sources and thus reduce dependence on any single supplier. A successful conclusion of TTIP would enhance European access to natural gas from the U.S.. American LNG exports, even if they remain small in quantity, may also help to weaken the oil-based gas pricing system in continental Europe and place the EU in a better negotiation position with its traditional gas suppliers, such as Russia.
• For Europe to be able to fully profit from U.S. LNG exports, policies should encourage the expansion of LNG import infrastructure as well as infrastructure to transport natural gas from coasts to consumers. In particular, the EU should aim to better connect the Iberian Peninsula with the rest of Europe as it already has sophisticated LNG import and processing infrastructure. The MIDCAT pipeline to connect Spain across the Pyrenees to other EU members, pipelines through Turkey to Azerbaijan and Iran (TAP and TANAP), or new LNG terminals in the East for Europe such as Krk that will be able to provide central and Eastern Europe with diversified gas supply options are cases in point. It will be crucial to overcome narrow national interests in these infrastructure projects to realise a true European Energy Union.
• At the same time the EU should take into account that LNG terminals such as Klaipeda in Lithuania and Krk bear capital-intensive construction and operational costs for member states. Russian gas will remain highly cost competitive and therefore will continue to be a major supplier for gas demand. Therefore the EU needs to be cautious with investments and possible over-investments in LNG infrastructure. A few strategically located LNG terminals across Europe and particularly in Eastern Europe and in the Balkans are sufficient to cover the supply and enhance security by decreasing vulnerability.
• Work more explicitly to show that ‘energy security’ is about more than supply source diversity. Develop a more ‘holistic’ approach to the identification of critical energy infrastructure that is actually tailored to the energy sector – this requires considering the whole of the energy supply chain from the point of extraction to consumption.
• Work towards a more ‘dynamic’ and flexible methodology of identifying CEI – one capable of adjusting to changes in time, season, or other circumstance-changing events
• Ensure plans are put in place to consider the ways in which the policies within the new Energy Union Package may themselves entail new critical energy infrastructure risks, including, but not limited to: a) New ICT and cyber-security risks due to the increasingly interoperable and remote-controlled nature of the European energy grid, b) The problem of convincing owner operators to forego concerns about commercial confidentiality, where insufficient awareness or appreciation for high quality data-information-sharing (about cyber-attacks or other observed risks) might build up to a systemic breakdown of the energy system and c) Ensuring that the wide variety of new PCIs are themselves designed with CEIP needs in mind, including new LNG import facilities – particularly those close to urban areas
• With regards to external diplomacy, the EC should work closely alongside its transatlantic partners, particularly the US, to ensure that best practice in CEIP planning is absorbed within the EU.
• In particular the EU should look to the U.S. DHS comprehensive national infrastructure protection plan as an example for more system-wide integration of CEI actors within the EU – the reluctance to shift from ‘national competence’ in CEIP, even as energy systems become

Policy Department, Directorate-General for External Policies
86
more integrated, will require more effective cooperation between several key EC Directorates-General on this topic.
• While the EU needs a more coherent foreign policy with regards to CEIP, it should work alongside the U.S. to promote the issue of CEIP within international forums and financing agencies, including the IEA, the IEF, financing authorities like the World Bank and governance processes like the G20.
• The EC should also consider more ‘hard power’ aspects of responding to CEI disruptions – including working with the U.S. through the NATO alliance to combat threats and denial of access to CEI, either physically or online. EU member states that are already engaged in such operations like the naval missions in the Red Sea against piracy, might want to consider greater European coordination of such policies to integrate them better into the EU’s Common Foreign and Security Policy.
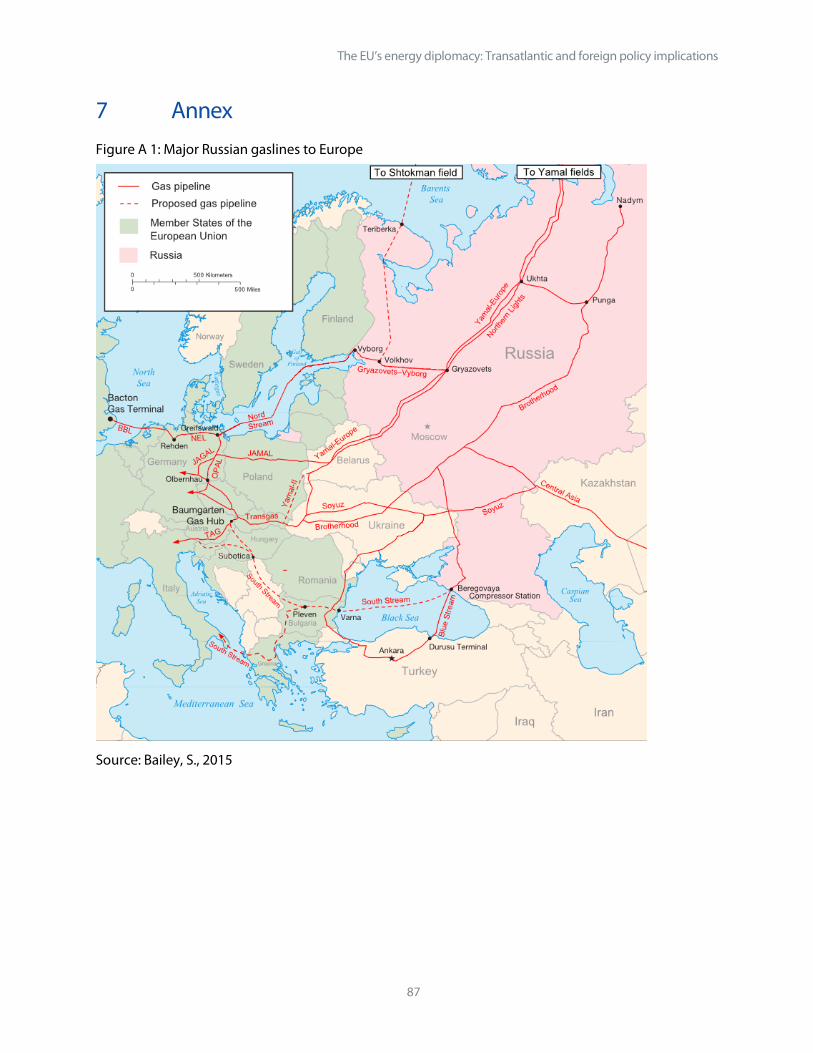
The EU’s energy diplomacy: Transatlantic and foreign policy implications
87
7 Annex Figure A 1: Major Russian gaslines to Europe
Source: Bailey, S., 2015

Policy Department, Directorate-General for External Policies
88
Figure A 2: Competing gas pipeline proposals
Source: http://www.bulgaria-italia.com/bg/news/news/04247.asp
Figure A 3: Major maritime chokepoints
Source: Dreyer, I. and Stang, G, 2014
The EU’s energy diplomacy: Transatlantic and foreign policy implications
89
8 References
Aguilera, R. F. and Radetzki, M., ‘The shale revolution: Global gas and oil markets under transformation’, Mineral Economics, No 26, 2014, pp. 75-84.
Ahmed, G. et al., ‘What Role Can Coal Play in the United States’ Energy Future?’, The Electricity Journal, No 27.3, 2014, pp. 87-95.
Al-Husseini, S. in Williams, P., ‘Saudi Arabia abandons OPEC production targets to protect market share’, Sydney Morning Herald, 8. December 2015. Web, 11. March 2016, <http://www.smh.com.au/business/energy/saudi-defends-countrys-strategy-to-abandon-opec-production-targets-20151207-glhl3p.html>.
Alcaraz, C. and Zeadally, S., 'Critical Infrastructure Protection: Requirements and Challenges for the 21st Century', International Journal of Critical Infrastructure Protection, No 8.1, 2015, pp. 53-66.
American Chemistry Council, Shale Gas, Competitiveness, and New U.S. Chemical Industry Investment: An Analysis Based on Announced Projects, 2013 (a).
American Chemistry Council, Statement for the Record. Cal Dooley. President and CEO. American Chemistry Council Before Senate Energy and Natural Resources. Committee Natural Gas Roundtable on Supply and Exports, 2013 (b).
Argomaniz, J., 'The European Union Policies on the Protection of Infrastructure from Terrorist Attacks: A Critical Assessment', Intelligence and National Security, No 30.2-3, 2015/05/04 2015, pp. 259-80.
Ashton, G., ‘A Look at The U.S. Shale Oil Production Industry’, Investopedia, October 2015. Web, 11. March 2016, <http://www.investopedia.com/articles/investing/052015/us-shale-becoming-global-swing-producer.asp>.
Atlantic Council, TTIP Yields Significant Export Gains in Key U.S. Industrial Sectors, 7. March 2014.
Austen, I., ‘TransCanada Seeks $15 Billion From U.S. Over Keystone XL Pipeline’, The New York Times, 6. January 2016. Web, 20. January 2016, <http://www.nytimes.com/2016/01/07/business/international/transcanada-to-sue-us-for-blocking-keystone-xl-pipeline.html?_r=0>.
Bailey, S., 'Major Russian Gas Pipelines to Europe', Wikimedia Commons, 9. February 2015. Web, 20. January 2016, <https://commons.wikimedia.org/wiki/File:Major_russian_gas_pipelines_to_europe.png>.
Bartz, D., 'Chinese Hackers Infiltrated Five Energy Firms: Mcafee', Reuters, 10. February 2011. Web, 16. January 2016, <http://www.reuters.com/article/us-energy-cyber-china-idUSTRE7190XP20110210>.
Baumann, F. and Simmerl, G., Between Conflict and Convergence: The EU Member States and the Quest for a Common External Energy Policy, Research Group on European Affairs, Center for Applied Policy Research, Munich, 2011. Available from: <http://www.cap.lmu.de/download/2011/CAP_Paper-Baumann-Simmerl.pdf>.
BBC, 'Yemen Says Tanker Blast Was Terrorism', BBC News, 16. October 2002. Web, 14. January 2016, <http://news.bbc.co.uk/2/hi/middle_east/2334865.stm>.
Bentley, E., Minczeski, P., and Juan, J., ‘Which Oil Producers Are Breaking Even? Lower Oil Prices Have Made It a Challenge for Some Countries to Balance Their Budgets’, Wall Street Journal, 2016. Web, 18. February 2016, <http://graphics.wsj.com/oil-producers-break-even-prices/>.
Policy Department, Directorate-General for External Policies
90
Bierbrauer, E.. The Transatlantic Trade and Investment Partnership (TTIP): The Sluggish State of Negotiations, Directorate-General for External Policies, Policy Department. Brussels: European Parliament, 2015, http://www.europarl.europa.eu/RegData/etudes/IDAN/2015/549074/EXPO_IDA(2015)549074_EN.pdf
Blackwill, R.D and O’Sullivan, M.L., ‘America’s Energy Edge’, Foreign Affairs, No 93(2), March/April 2014, pp. 102-114.
Bloomberg, ‘Egypt Boosts Suez Security as Foiled Attack Shows Risks,’ 2. September 2013. Web, 20. January 2016, <http://www.bloomberg.com/news/articles/2013-09-01/egypt-boosts-suez-security-as-foiled-attack-shows-risks>.
Bloomberg New Energy Finance, ‘Electric Vehicles to be 35 % of Global New Cars Sales by 2040,’ 25 February 2016. Web, 11. March 2016, <http://about.bnef.com/press-releases/electric-vehicles-to-be-35-of-global-new-car-sales-by-2040/>.
Boersma, T., Ebinger, C.K. and Greenley, H.L., ‘An Assessment of U.S. Natural Gas Exports’, Issue 4 in the Brookings Energy Security And Climate Initiative, Natural Gas Task Force Brookings, July 2015.
Bohnengel, B., Patiño-Echeverri, D. and Bergerson, J., ‘Environmental Implications of United States Coal Exports : A Comparative Life Cycle Assessment of Future Power System Scenarios’, Environmental Science and Technology, No 48, 2014, pp. 9908-9916.
Boin, A., Rhinard, M. and Ekengren, M., 'Managing Transboundary Crises: The Emergence of European Union Capacity', Journal of Contingencies and Crisis Management, No 22.3, 2014, pp. 131-42.
Borchert, H. and Forster, K., 'Homeland Security and the Protection of Critical Energy Infrastructures: A European Perspective', in Five Dimensions of Homeland and International Security, edited by Esther Brimmer. 133-48. Washington, DC: Center for Transatlantic Relations, 2008.
Borderlex, ‘End of U.S.crude oil export ban – consequences for TTIP and the climate,’ Interview with David Livingston, 15 January, 2016, http://www.borderlex.eu/interview-us-crude-oil-ban-lifting-consequences-ttip-climate/.
Bordoff, J., ‘How Exporting U.S. Liquefied Natural Gas Will Transform the Politics of Global Energy’, Wall Street Journal, 2015. Web, 27. January 2016, <http://blogs.wsj.com/experts/2015/11/17/how-exporting-u-s-liquefied-natural-gas-will-transform-the-politics-of-global-energy/>.
Bordoff, J. and Houser, T., American Gas to the Rescue? The Impact of U.S. LNG Exports on European Security and Russian Foreign Policy, Centre on Global Energy Policy Columbia University, 2014.
BP, BP Statistical Review of World Energy June 2015, BP, London, 2015.
BP, ‘Country insights: US’, BP Energy Outlook, BP, London. Web, 19. January 2016, <http://www.bp.com/en/global/corporate/energy-economics/energy-outlook-2035/country-and-regional-insights/us-insights.html>.
BP, ‘Outlook to 2035 - energy use to rise by a third’, BP Energy Outlook 2035, BP, London. Web, 31. January 2016, <http://www.bp.com/en/global/corporate/energy-economics/energy-outlook-2035/outlook-in-brief.html>.
Buchan, D., Europe’s Energy security - caught between short term needs and long term goals, Oxford Institute of Energy Studies, 2015.
Buzek, J., 'There Is No Energy Security without Solidarity', The Energy Security Strategy in Europe. 8: Eureka Initative, 2015.

The EU’s energy diplomacy: Transatlantic and foreign policy implications
91
Canadian Association of Petroleum Producers, Pipelines, 2015. Web, 20. January 2016, <http://www.capp.ca/canadian-oil-and-natural-gas/infrastructure-and-transportation/pipelines>.
Center for Energy Economics (CEE), Export Regulations: What you Need to Know, Jackson School of Geosciences, University of Texas at Austin.
Clawson, P., ‘Misleading Claims about U.S. Barriers to Iran-Europe Financial Ties’, PolicyWatch 2612, WINEP, 27 April 2016, <http://washin.st/1NAkag2>.
Chyong, C. and Tcherneva, V., ‘Europe’s Vulnerability on Russian Gas’, European Council on Foreign Relations, Commentary, 17 March 2015, http://www.ecfr.eu/article/commentary_europes_vulnerability_on_russian_gas .
Clayton, B., and Levi, M. A., Fiscal Breakeven Oil Prices: Uses, Abuses, and Opportunities for Improvement. Discussion Paper. New York: Council on Foreign Relations, 2015, <http://www.cfr.org/oil/fiscal-breakeven-oil-prices-uses-abuses-opportunities-improvement/p37275>.
Cornell University Law School, Legal Information School, ‘15CFR 754.2 - Crude oil’, Legal Information Institute. Web, 11. March 2016, <https://www.law.cornell.edu/cfr/text/15/754.2>.
Commission of the European Communities, ‘EUR-Lex - Access to European Union Law’, Europa.eu, 2006. Web, 27. January 2016, <http://eur-lex.europa.eu/legal-content/EN/ALL/?uri=CELEX %3A52006DC0105>.
Coote, B., Surging Liquefied Natural Gas Trade: How U.S. Exports Will Benefit European and Global Gas Supply Diversity, Competition, and Security, Atlantic Council, 2016.
Cordano, D., ‘Terrorist threats to energy infrastructure in North Africa.’ African Defence Review, 2013. Web, 14. March 2016, <www.africandefence.net/terrorist-threats-to-energy-infrastructure-in-North-Africa/>.
Cordesman, A. H., American Strategy and Critical Challenges in U.S. ‘Energy Import Dependence’, Center for Strategic and International Studies, 2015.
'Council Directive 2008/114/EC of 8 December 2008 on the Identification and Designation of European Critical Infrastructure and the Assessment of the Need to Improve Their Protection', Official Journal of the European Union, No 345.23.12.2008.
Council of the European Union, Directives for the negotiation on the Transatlantic Trade and Investment Partnership between the European Union and the United States of America, drafted in June 17, 2013, declassified in October 9, 2014 (a). Web, 13. March 2016, <http://data.consilium.europa.eu/doc/document/ST-11103-2013-DCL-1/en/pdf>.
Council of the European Union, ‘Non-paper on a Chapter on Energy and Raw Materials in TTIP’, Brussels, 27. May 2014 (b). Web, 13. March 2016, <http://www.scribd.com/doc/233022558/EU-Energy-Non-paper#scribd>.
Council of the European Union, Council Conclusions on Energy Diplomacy,’ 10995/15, Brussels 20 July 2015 <http://www.consilium.europa.eu/en/press/press-releases/2015/07/20-fac-energy-diplomacy-conclusions/>
James Crisp, ‘Nord Stream 2 will kill EU’s LNG strategy, warns U.S.ambassador’, Web. 24 February 2016 (a), http://www.euractiv.com/section/energy/news/nord-stream-2-will-kill-eus-lng-strategy-warns-us-ambassador/
James Crisp, ‘Senior Obama official: Nord Stream 2 and Brexit may weaken EU energy security,’ Web. 31 March 2016 (b), http://www.euractiv.com/section/energy/interview/senior-obama-official-nord-stream-2-and-brexit-may-weaken-eu-energy-security/
Policy Department, Directorate-General for External Policies
92
Critical 5, ‘Role of Critical Infrastructure in National Prosperity,’ Web. October 2015, https://www.dhs.gov/sites/default/files/publications/critical-five-shared-narrative-ci-national-prosperity-2015-508.pdf
Darbouche, H., El-Katiri, L. , Fattouh, B., East Mediterranean Gas: What Kind of a game Changer? Report NG 71, Oxford Institute for Energy Studies, Oxford, December 2012.
Dempsey, J., 'Germany, Dump Nord Stream 2', Carnegie Europe. Web, 14. March 2016, <http://carnegieeurope.eu/strategiceurope/?fa=62567>.
Dickel, R. et al., Reducing European Dependence on Russian Gas: distinguishing natural gas security from geopolitics, The Oxford Institute for Energy Studies, 2014.
Dreyer, I., and Stang, G., Energy Moves and Power Shifts: EU Foreign Policy and Global Energy Security. EU Institute for Security Studies, Paris, 2014.
Duffield, J. S., Fuels Paradise: Seeking Energy Security in Europe, Japan, and the United States, Johns Hopkins University Press, Baltimore, 2015.
Ebinger, C., Massy, K. and Avasarala, G., Liquid Markets: Assessing the Case for U.S. Exports of Liquefied Natural Gas, Brookings Energy Security Initiative, Policy Brief 12-01, 2012.
Economist, ‘Iraq slashes oil production target by one-third’, The Economist Intelligence Unit, London, July 2015. Available from: <http://www.eiu.com/industry/article/1313250915/iraq-slashes-oil-production-target-by-one-third/2015-06-16>.
Elkind, J., ‘Energy Security. Call for a Broader Agenda’, in Pascual, C. and Elkind, J., Energy Security: Economics, Politics, Strategies, and Implications, Brookings Institution Press, Washington, 2010.
Emmerson, C. and Stevens, P., Maritime Choke Points and the Global Energy System: Charting a Way Forward, Chatham House, London, 2012.
Energy Watch Group, Uranium Resources and Nuclear Energy. Background Paper, EWG Series. Berlin, 2006.
Erdbrink, T., ‘Europe Says U.S. Regulations Keeping It From Trade With Iran’, New York Times, 21 April 2016, <http://www.nytimes.com/2016/04/22/world/middleeast/europe-says-us-regulations-keeping-it-from-trade-with-iran.html?_r=1#story-continues-1>.
EurActiv, ‘Spanish MIDCAT pipeline to replace 10 % of Russian gas imports’, Euractiv.com, 2015. Web, 13. March 2016, <https://www.euractiv.com/section/energy/news/spanish-midcat-pipeline-to-replace-10-of-russian-gas-imports/#comments>.
European Commission, Second Strategic Energy Review. An EU energy security and solidarity action plan, COM(2008) 744, 2008.
European Commission, Commission Staff Working Document on the Review of the European Programme for Critical Infrastructure Protection (EPCIP), Office for Official Publications of the European Communities, Luxembourg, 2012.
European Commission, EU - U.S. Transatlantic Trade and Investment Partnership. Raw materials and energy. Initial EU position paper, 2013, <http://trade.ec.europa.eu/doclib/docs/2013/july/tradoc_151624.pdf>.
European Commission, Commission Staff Working Document on a New Approach to the European Programme for Critical Infrastructure Protection Making European Critical Infrastructures More Secure, Office for Official Publications of the European Communities, Luxembourg, 2013 (c).
European Commission, EU Energy, transport and GHG emissions. Trends to 2050. Reference Scenario 2013, 2014 (a).

The EU’s energy diplomacy: Transatlantic and foreign policy implications
93
European Commission, ‘Energy Economic Developments in Europe’, Europa.eu, January 2014 (b). Web, 14. March 2016, <http://ec.europa.eu/economy_finance/publications/european_economy/2014/energy-economic-developments-in-europe_en.htm>.
European Commission, European Energy Security Strategy, Office for Official Publications of the European Communities, Luxembourg, 2014 (c).
European Commission, Report on the implementation of the strategy for international cooperation in research and innovation, COM(2014) 567, 2014 (d).
European Commission, Communication. ‘A Framework Strategy for a Resilient Energy Union with a Forward-Looking Climate Change Policy’. Office for Official Publications of the European Communities, Luxembourg, 2015 (a).
European Commission, Energy Union Package, Communication from the Commission to the European Parliament, the Council, the European Economic and Social Committee, the Committee of the Regions and the European Investment Bank: A Framework Strategy for a Resilient Energy Union with a Forward-Looking Climate Change Policy, Office for Official Publications of the European Communities, Luxembourg, 2015 (b).
European Commission, EU energy in figures. Statistical pocketbook 2015, 2015 (c).
European Commission, ‘2050 Energy strategy’, Europa.eu. Web, 27. January 2016, <https://ec.europa.eu/energy/en/topics/energy-strategy/2050-energy-strategy>.
European Commission, ‘2030 Climate & Energy Framework’, Web. 28 April 2016, <http://ec.europa.eu/clima/policies/strategies/2030/index_en.htm>
European Commission, ‘Energy Community’, Web. 28 April 2016 https://ec.europa.eu/energy/en/topics/international-cooperation/energy-community.
European Commission, ‘Energy and Environment: Environmental Aspects on Unconventional Fossil Fuels’, Europa.eu. Web, 27. January 2016, <http://ec.europa.eu/environment/integration/energy/unconventional_en.htm>.
European Commission, ‘Energy Security Strategy’, Europa.eu. Web, 27. January 2016, <https://ec.europa.eu/energy/en/topics/energy-strategy/energy-security-strategy>.
European Commission, ‘Energy Union Factsheet’, Europa.eu. Web, 27. January 2016, <http://europa.eu/rapid/press-release_MEMO-15-4485_en.htm>.
European Commission, ‘European Economy - Member States’ Energy Dependence: An Indicator-Based Assessment’, Europa.eu. Web, 27. January 2016, <www.ec.europa.eu/economy_finance/publications>.
European Commission, ‘EU-USA Energy Council’, Web. 29 April 2016, <https://ec.europa.eu/energy/en/topics/international-cooperation/united-states-america>
European Commission, ‘State of the Energy Union’, Europa.eu. Web, 27. January 2016, <https://ec.europa.eu/priorities/energy-union-and-climate/state-energy-union_en>.
European Commission, ‘Supplier countries’, Europa.eu. Web, 20. January 2016, <https://ec.europa.eu/energy/en/topics/imports-and-secure-supplies/supplier-countries>.
European Commission, ‘Questions and answers on security of energy supply in the EU’, Europa.eu. Web, 27. January 2016, <http://europa.eu/rapid/press-release_MEMO-14-379_en.htm>.
European Commission, 'Projects of Common Interest', Europa.eu, 29. January 2016. Web, 20. January 2016, <https://ec.europa.eu/energy/en/topics/infrastructure/projects-common-interest>.

Policy Department, Directorate-General for External Policies
94
European Commission, ‘Central Eastern and South Eastern European countries join forces to create an integrated gas market,’ Europa.eu. Web, 20 April 2016, https://ec.europa.eu/energy/en/news/central-eastern-and-south-eastern-european-countries-join-forces-create-integrated-gas-market
European External Action Service, ‘European Security Strategy’, Eeas.europa.eu, 2008. Web, 27. January 2016, <http://www.eeas.europa.eu/csdp/about-csdp/european-security-strategy/>.
European External Action Service, ‘Energy Diplomacy’, Eeas.europa.eu, 2014. Web, 27. January 2016, <http://eeas.europa.eu/energy/index_en.htm>.
European Parliament, TTIP Impacts on European Energy Markets and Manufacturing Industries, 2015 (a).
European Parliament, European Parliament resolution of 8 July 2015 containing the European Parliament’s recommendations to the European Commission on the negotiations for the Transatlantic Trade and Investment Partnership (TTIP), 2015 (b).
Eurostat, ‘Coal Consumption Statistics’, EuroStat, June 2015. Web, 18. February 2016, <http://ec.europa.eu/eurostat/statistics-explained/index.php/Coal_consumption_statistics - Imports_of_hard_coal>.
Eurostat, 'Consumption of Energy', EuroStat, May 2015. Web, 14. January 2016, <http://ec.europa.eu/eurostat/statistics-explained/index.php/Consumption_of_energy>.
Eurostat, 'Energy Production and Imports', EuroStat, May 2015. Web, 14. January 2016, <http://ec.europa.eu/eurostat/statistics-explained/index.php/Energy_production_and_imports>.
Eurostat, ‘National accounts and GDP’, EuroStat, 2015. Web, 27. January 2016, <http://ec.europa.eu/eurostat/statistics-explained/index.php/National_accounts_and_GDP>.
EWEA, ‘Wind in power 2014 European statistics,’ ewea.org, The European Wind Energy Association. Web, 2. February 2016, <http://www.ewea.org/fileadmin/files/library/publications/statistics/EWEA-Annual-Statistics-2014.pdf>.
Executive Office of the President, The President’s Climate Action Plan, The White House, Washington, 2013.
Far, S. and Youngs, R., Energy Union and EU global strategy - the Undefined Link, Swedish Institute for European Policy Studies, 2015.
Federal Energy Regularity Commission (FERC), Approved North American LNG Import/Export Terminals, 2016.
Fitzgibbon, T. and Rogers, M., ‘Implications of light tight oil growth for refiners in North America and worldwide’, Perspectives on downstream oil and gas’, Mckinsey & Company, January 2014.
Fogh Rasmussen, A., 'Remarks by Nato Secretary General Anders Fogh Rasmussen at the Opening of the Nato Energy Security Centre of Excellence, Vilnius, Lithuania', 6. September 2013. Web, 14. January 2016, <http://www.nato.int/cps/en/natohq/opinions_102856.htm>.
Gas Infrastructure Europe, 'LNG Map', May 2015. Web, 14. January 2016, <http://www.gie.eu/index.php/maps-data/lng-map>.
Gény, F., Can unconventional Gas be a Game Changer in European Gas Markets, The Oxford Institute For Energy Studies, 2010.
Giroux, J., Burgherr, P. and Melkuanite, L., 'Research Note on the Energy Infrastructure Attack Database', Perspectives on Terrorism, 2013. Web, 20 January 2016, <http://www.terrorismanalysts.com/pt/index.php/pot/article/view/315/html>.
Grigas, A., Legacies, Coercion and Soft Power: Russian Influence in the Baltic States. Briefing Paper. London: Chatham House, 2012.
The EU’s energy diplomacy: Transatlantic and foreign policy implications
95
Grigas, A., ‘Klaipeda’s LNG terminal: a game changer’, EurActiv.com, 2014. Web, 27. January 2016, <http://www.euractiv.com/section/energy/opinion/klaipeda-s-lng-terminal-a-game-changer/>.
Hayden, E., 'Barriers to Information Sharing Negatively Impact Critical Energy Infrastructure Protection', Energy Security Forum, No 8, December 2013, pp. 16-19.
Hedberg, A., 'Europe's Energy Security - Is the Energy Union the Answer?', European Policy Centre, 28. January 2015. Web, 14. January 2016, <http://www.epc.eu/pub_details.php?cat_id=4&pub_id=5256>.
Henderson, S., Natural Gas Export Options for Israel and Cyprus. Mediterranean Paper Series, WINEP, Washington D.C., 2013.
Hengel, D., ‘TTIP Presents Opportunity for U.S.-EU Energy Cooperation,’ gmfus.org, The German Marshall Fund of the United States, Washington D.C. Web, 1. February 2016, <http://www.gmfus.org/blog/2015/10/08/ttip-presents-opportunity-us-eu-energy-cooperation>.
Herranz-Surallés, A., 'An Emerging EU Energy Diplomacy? Discursive Shifts, Enduring Practices', Journal of European Public Policy, 2015.
Hirst, N. and Froggatt, A., 'The Reform of Global Energy Governance', In Grantham Institute for Climate Change, discussion paper no. 3. London: Imperial College, 2012.
Höök, M. and Aleklett, K., ‘Historical Trends in American coal production and a possible future outlook’, International Journal of Coal Geology, 78, 2009, pp. 201-216.
Howarth, R. W., Santoro, R. and Ingreffea, A., ‘Methane and the Greenhouse-gas Footprint of Natural Gas from Shale Formations’, Climate Change Letters, 2011, 106: 679-90.
IHS, ‘U.S. Tight Oil: Base Supply, Marginal Supply, Swing Supply, Spare Supply?’, Conference presentation, 13 February 2016.
International Association of Oil & Gas Producers and American Petroleum Institute, ‘Oil & Natural Gas Industry Positions on Potential Energy Issues in TTIP’, 2015.
International Energy Agency, Perspectives on Caspian Gas and Oil Development, Paris, 2008.
International Energy Agency, Golden Rules for a Golden Age of Gas. World Energy Outlook Special Report on Unconventional Gas, Paris, 2012.
International Energy Agency, World Energy Outlook 2013, Paris, 2013.
International Energy Agency, Medium Term Coal Market Report 2015, Executive Summary, Paris, 2015 (a).
International Energy Agency, Medium Term Gas Market Report 2015, Executive Summary, Paris, 2015 (b).
International Energy Agency, Medium Term Oil Market Report 2015, Executive Summary, Paris, 2015 (c).
International Energy Agency, Medium Term Renewables Market Report 2015, Executive Summary, Paris, 2015 (d).
International Energy Agency, World Energy Outlook 2015, Paris, 2015 (e).
International Energy Agency, ‘Renewables to lead world power market growth to 2020’, iea.org. Web, 13. March 2016, <http://www.iea.org/newsroomandevents/pressreleases/2015/october/renewables-to-lead-world-power-market-growth-to-2020.html>.
International Gas Union, World LNG Report – 2015 Edition, Des Plaines (USA), 2015. Available at: <http://www.igu.org/publications>.
Jégourel, Y., The development of the liquefied natural gas spot market: origin and implications, OCP Policy Center, Rabat, January 2016.
Policy Department, Directorate-General for External Policies
96
Kalkman, J. and Keller, A., Global Petrochemicals - Who Is Really Benefitting from Teh Growth in the New World?, Roland Berger Strategy Consultants, 2012. Available at <http://www.rolandberger.com/media/publications/2012-11-11-rbsc-pub-Global_Petrochemicals.html>.
Keay, M. and Buchan, D., Europe’s Energy Union – a problem of governance, Oxford Institut of Energy Studies, 2015.
Koďousková, H. and Jirušek, M., 'Cancellation of South Stream Makes Economic Sense', 12. December 2014. Web, 20. January 2016, <http://www.euractiv.com/section/europe-s-east/opinion/cancellation-of-south-stream-makes-economic-sense/>.
Kustal, E., ‘Iranian comeback and its implications for short-term oil prices,’ McKinsey Solutions: Energy Insights, August 2015. Web, 2. February 2016, <https://www.mckinseyenergyinsights.com/insights/iran-oil-industry-post-sanctions.aspx>.
Laugé, A., Hernantes, J. and Sarriegi, J. M., 'Critical Infrastructure Dependencies: A Holistic, Dynamic and Quantitative Approach', International Journal of Critical Infrastructure Protection, No 8.1, 2015, pp. 16-23.
Levi, M., A Strategy for U.S. Natural Gas Exports, Discussion paper 2012-04 of the Hamilton Project, Brookings, June 2012.
van Leeuwen, J. W. S., Secure Energy: Options for a Safer World. Energy Security and Uranium Reserves. Fact Sheet., Oxford Research Group, Oxford, 2006.
Lidman, M., ‘High Court torpedoes massive gas deal in historic ruling,’ Times of Israel, 27 March 2016, <http://www.timesofisrael.com/high-court-torpedoes-massive-gas-deal-in-historic-ruling/>.
LNG for Shipping, 'Bunkering', Web, 14. January 2016, <https://lngforshipping.eu/lng-for/bunkering>.
LNG Hrvatska, ‘LNG terminal Krk – gas hub for Central and Southeastern Europe’, lng.hr, Web, 13. March 2016, <http://lng.hr/en>.
Luca, U., Mohanty Sangeeta, H. J., and Boekesteijn, E. G., 'The Resilience of Energy Supply Chains: A Multiple Case Study Approach on Oil and Gas Supply Chains to Europe', Supply Chain Management: An International Journal, No 19.1, 2014, pp. 46-63.
Luciani, G., Security of Oil Supplies: Issues and Remedies, European Energy Studies Vol. 4, Deventer; Leuven: Claeys & Casteels, 2013.
Maugeri, L., ‘Oil: The Next Revolution.’ Discussion Paper 2012-10, Belfer Center for Science and International Affairs, Harvard Kennedy School, June 2012.
Ministry of Environmental Protection, China’s Action Plan for the Prevention and Control of Air Pollution, Ministry of Environmental Protection, Beijing 2013.
Medlock, K. B., Jaffe, A. and Hatley, P. R., Shale Gas and U.S. National Security, James A. Baker III Institute for Public Policy, Houston, 2011.
Michaut, J., ‘Pipeline transport for oil and gas’, Oil & Gas Logistics, 2012. Web, 27. January 2016, <https://oilandgaslogistics.wordpress.com/2012/08/28/pipeline-transport-for-oil-and-gas/>.
Mousavian, S. H., ‘U.S. Torpedoing the Nuclear Deal Will Reaffirm Iran’s Distrust’, Huffington Post, 29 April 2016, <http://www.huffingtonpost.com/seyed-hossein-mousavian/us-nuclear-deal-iran-distrust_b_9809758.html>
NATO, Riga Summit Declaration Issued by the Heads of State and Government Participating in the Meeting of the North Atlantic Council in Riga on 29 November 2006, Riga, 2006.
NATO, Wales Summit Declaration Issued by the Heads of State and Government Participating in the Meeting of the North Atlantic Council in Wales, Cardiff, 2014.
The EU’s energy diplomacy: Transatlantic and foreign policy implications
97
‘Natural Gas Act’, Title 15 U.S.C. 717b. Available from: <http://www.energy.gov/sites/prod/files/2013/04/f0/2011usc15.pdf>.
Natural Gas Europe, ‘CNA: Strategic Gas Pipeline Midcat Will Be Ready by 2020’, Natural Gas Europe, 2015. Web, 13. March 2016, <http://www.naturalgaseurope.com/canete-spains-gas-pipeline-midcat-completion-date-25763>.
Natural Gas Europe, ‘Höegh LNG Turns Down Lithuania’s FSRU Advanced Sale Proposal’, Natural Gas Europe, 2015. Web, 18. January 2016, <http://www.naturalgaseurope.com/norway-hoegh-turns-down-lithuanis-proposal-fsru-advance-sale-25006>.
Natural Resources Canada, 'Canadian LNG Projects', nrcan.gc.ca, 30. November 2015. Web, 03. March 2016, <http://www.nrcan.gc.ca/energy/natural-gas/5683>.
Niglia, A., 'Nato and the Eu's Potential Role in Critical Energy Infrastructure Protection', Atlantic Voices, No 4.9, 2014, pp. 7-11.
Nülle, G., ‘Tight Oil Production Trends in a Low Price Environment,’ Energy Information Administration Discussion Paper, Office of Petroleum, Natural Gas and Biofuels, Washington D.C., June 2015.
O'Mahony, M., Report on Realising Priority Infrastructure Projects for Energy Community, Energy Community Secretariat, Vienna, 2014.
OECD Nuclear Energy Agency, Uranium 2014: Resources, Production and Demand, Organization for Economic Co-operation and Development, 2014.
Oettinger, Guenther. ‘Energy Security for Europe: The EU agenda until 2050’, Speech of Commissioner Oettinger at King’s College London, European Commission speech/11/98, 10 February 2011.
Oliver, C., ‘Franco-Spanish Energy Spats Test EU’, Financial Times, 21. October 2014. Web, 26. January 2016, <http://www.ft.com/intl/cms/s/8e94079c-585f-11e4-b331-00144feab7de,Authorised=false.html?siteedition=uk&_i_location=http %3A %2F %2Fwww.ft.com %2Fcms %2Fs %2F0 %2F8e94079c-585f-11e4-b331-00144feab7de.html %3Fsiteedition %3Duk&_i_referer=&classification=conditional_standard&iab=barrier-app#axzz3z1oJ2zcW>.
Oliver, C., Byrne, A. and Hope, K., 'Anger and Dismay as Russia Scraps $50bn Gas Plan', Financial Times, 2. December 2014. Web, 14. March 2016, <http://www.ft.com/intl/cms/s/0/1a5954f0-7a41-11e4-a8e1-00144feabdc0.html - axzz407YiW3dS>.
Oliver, C. and Cienski, J., ‘Energy Security: The price for diversity’, Financial Times, 2014. Web, 27. January 2016, <http://www.ft.com/cms/s/0/67308bb8-97f2-11e3-8c0e-00144feab7de.html#axzz40CA8wgi3>.
OPEC, Annual Statistical Bulletin 2015, Organization of the Petroleum Exporting Countries, Vienna, 2015.
OPEC, Monthly Oil Market Report. Vienna, January 2016. Available at <http://www.opec.org/opec_web/en/publications/338.htm>.
Organization for Security and Co-operation in Europe, 'Good Practices Guide on Non-Nuclear Critical Energy Infrastructure Protection (Nnceip) from Terrorist Attacks Focusing on Threats Emanating from Cyberspace', Vienna: OSCE Secretariat, 2013.
Papa, C. ‘European LNG terminals: Status and outlook’, Gas Infrastructure Europe, Rome, 2015.
Pascual, C. and Elkind, J., ‘Introduction’, in Pascual, C. and Elkind, J., Energy Security: Economics, Politics, Strategies, and Implications, Brookings Institution Press, Washington, 2010.
Pirani, S., J. Stern & K. Yafimava. The Russo-Ukrainian gas dispute of January 2009: a comprehensive assessment. Oxford: Oxford Institute for Energy Studies, 2009.
Policy Department, Directorate-General for External Policies
98
Pirani, S., Ukraine's Imports of Russian Gas: How a Deal Might Be Reached. The Oxford Institute for Energy Studies, Oxford, 2014.
Ratner, M., et al., U.S. Natural Gas Exports: New Opportunities, Uncertain Outcomes, Congressional Research Service, 2015.
'Regulation (EU) No 230/2014 of the European Parliament and of the Council of 11 March 2014, Establishing an Instrument Contributing to Stability and Peace ', Official Journal of the European Union.
Reuters, 'Factbox - 18 Countries Affected by Russia-Ukraine Gas Row', reuters.com, 7. January 2009. Web, 20. January 2016, <http://www.reuters.com/article/uk-russia-ukraine-gas-factbox-idUKTRE5062Q520090107?sp=true>.
Reuters, ‘Valero speaks out against lifting ban on U.S. crude oil exports’, reuters.com, 7. January 2014. Web, 14. March 2016, <http://in.reuters.com/article/usa-energy-exports-idINL2N0KH15V20140107>.
Reuters, ‘U.S. approves landmark crude oil export swaps with Mexico’, reuters.com, 14. August 2015. Web, 14. March 2016, <http://www.reuters.com/article/2015/08/14/us-usa-oil-exports-exclusive-idUSKCN0QJ1RI20150814>.
Reuters, ‘Iran sees oil output rising to pre-sanctions level by June,’ 19 April 2016, http://www.reuters.com/article/us-iran-oil-production-idUSKCN0XG0X5 .
Rhinard, M., and Boin, A. 'European Homeland Security: Bureaucratic Politics and Policymaking in the EU', Journal of Homeland Security and Emergency Management, No 6.1, 2009.
Riker, D. A., ‘International coal trade and restrictions on coal consumption’, Energy Economics, No 34, 2012, pp. 1244-1249.
Rudberg, P. M., Sweden’s Evolving Hydropower Sector: Renovation, Restoration and Concession Change, Stockholm Environment Institute, Project Report 2013-01, Stockholm, January 2013.
Saleh, H., 'Egypt Pins Hopes on Suez Canal Expansion.' Financial Times, 5. August 2015. Web, 20. January 2016, <http://www.ft.com/intl/cms/s/0/2c18da3a-3aa8-11e5-bbd1-b37bc06f590c.html - axzz407YiW3dS>.
Scotiabank, ‘Scotiabank Commodity Price Index. Commodity Prices Strengthen In January’, 20. February 2014. Web, 14. March 2016, <https://prosperitysaskatchewan.files.wordpress.com/2014/02/scotiabank-oil-costs-feb-20-2014.pdf>.
Scotiabank, ‘Scotiabank Commodity Price Index. Year-End Review & Outlook For 2016’, 21. December 2015. Web, 14. March 2016, <http://www.gbm.scotiabank.com/English/bns_econ/bnscomod.pdf>.
SEC, Commission File Number 1-15106, Securities and Exchange Commission Petrobras filing, January 2016. Available from: <http://secfilings.nasdaq.com/filingFrameset.asp?FileName=0001292814-16-003268 %2Etxt&FilePath= %5C2016 %5C01 %5C12 %5C&CoName=PETROBRAS+-+PETROLEO+BRASILEIRO+SA&FormType=6-K&RcvdDate=1 %2F12 %2F2016&pdf>.
Sedelmeier, U., Europe after the Eastern Enlargement of the European Union: 2004-2014, Heinrich Boell Stiftung, 2014.
Sharma, G., ‘Decline of U.S. Shale Plays Not Clear Cut as Oil Price Stays Low,’ Forbes Commodities and Currencies, March 2015. Web, 2. February 2016, <http://www.forbes.com/sites/gauravsharma/2015/03/30/decline-of-us-shale-plays-at-lower-oil-prices-not-as-clear-cut/#6044120832f5>.
Shell, ‘Liquefied natural gas (LNG)’, Shell.com, 2016. Web, 27. January 2016, <http://www.shell.com/energy-and-innovation/natural-gas/liquefied-natural-gas-lng.html>.
The EU’s energy diplomacy: Transatlantic and foreign policy implications
99
Shiryaevskaya, A., ‘EU Reliance on Russia Gas to Deepen as N. Africa Imports Ebb’, Bloomberg, 17. November 2015. Web, 27. January 2016, <http://www.bloomberg.com/news/articles/2015-11-17/eu-reliance-on-russia-gas-to-deepen-as-north-africa-imports-wane>.
Smedley, T., ‘TTIP: what does the transatlantic trade deal mean for renewable energy?’, The Guardian, 5. August 2015. Web, 14. March 2016, <http://www.theguardian.com/public-leaders-network/2015/aug/05/ttip-free-trade-deal-renewable-energy-transatlantic-partnership-eu-us>.
Smith, M., 'Collective Effort by Maritime Industry and Naval Forces Keep Pirate Attacks Suppressed', European Union External Action, 9 September 2015. Web, 20 January, <http://eunavfor.eu/collective-effort-by-maritime-industry-and-naval-forces-keep-pirate-attacks-suppressed-eu-naval-force-operation-commander-major-general-martin-smith-mbe/>.
Solomon, I., ‘The EU’s drive for free energy trade in the TTIP endangers action on climate change’, Energy Post, 3. September 2014. Web, 14. March 2016, <http://www.energypost.eu/pursuit-free-energy-trade-trans-atlantic-trade-investment-partnership-ttip-endangering-action-climate-change>.
Spencer, R., 'Suez Canal Targeted as War in Sinai Spreads', The Telegraph, 17 November 2013. Web, 20 January 2016, <http://www.telegraph.co.uk/news/worldnews/africaandindianocean/egypt/10454020/Suez-Canal-targeted-as-war-in-Sinai-spreads.html>.
Spiegel, P., and Politi, J., 'Italy's Renzi Joins Opposition to Nord Stream 2 Pipeline Deal', Financial Times, 15. December 2015. Web, 20. January 2016, <http://www.ft.com/intl/cms/s/0/cebd679c-a281-11e5-8d70-42b68cfae6e4.html - axzz407YiW3dS>.
Squeglia, C. and Matarazzo, M., The US-EU Energy Trade Dilemma, Instituto Affari Internazionali, 2015 [online]. Available at: <www.iai.it/sites/default/files/iaiwp1528.pdf>.
Steel Manufacturers Association, ‘Testimony of Phillip K. Bell, President of Steel Manufacturers Association’, Steelnet.org, 17 November 2015. Web, 14. March 2016, <http://www.steelnet.org/new/20151117a.pdf>.
Steel Manufacturers Association, ‘Public policy statement. 114th Congress edition’, Steelnet.org, 2016. Web, 14. March 2016, <http://www.steelnet.org/docs/public_policy.pdf>.
Stern, J. et al., Reducing European Dependence on Russian Gas – distinguishing natural gas security from geopolitics, Oxford Institute of Energy Studies, 2014.
Stevens, P., Prospects for Iran’s Oil and Gas Sector, Chatham House Middle East and North Africa Programme & Environment, Energy and Resources Department, March 2015.
Stevens, P., ‘The ‘Shale Gas Revolution’: Developments and Changes’, Energy, Environment and Resources, Briefing Paper, Chatham House, 2012.
Stonington, J., ‘Indigenous Canadians take leading role in battle against tar sands pipeline’, The Guardian, 18. October 2015. Web, 20. January 2016, <http://www.theguardian.com/world/2015/oct/18/canada-indigenous-first-nations-tar-sands-pipeline-oil>.
Stratfor, ‘Why the U.S. Decision to Allow Oil Exports Won’t Change Much’, Stratfor.com, 18. December 2015. Web, 30. April 2016, <https://www.stratfor.com/analysis/why-us-decision-allow-oil-exports-wont-change-much>.
Strezelecki, M. and Almeida, I., ‘Fracking Setback in Poland Dims Hope for Less Russian Gas’, Bloomberg, 2014.
Sullivan, P., 'Geopolitical and Cyber Risks to Oil and Gas', Public Interest Reports, No 66.4, 2013.

Policy Department, Directorate-General for External Policies
100
Szulecki, K., and Westphal, K.. 'The Cardinal Sins of European Energy Policy: Nongovernance in an Uncertain Global Landscape.' Global Policy, No 5. 2014, pp. 38-51.
Talwani, M., The Orinoco Heavy Oil Belt In Venezuela (or Heavy Oil To The Rescue?), The James A. Baker III Institute For Public Policy Of Rice University, Houston, September 2002.
The Wall Street Journal, ‘U.S. Ruling Loosens Four-Decade Ban On Oil Exports’, The Wall Street Journal, 24. June 2014. Web, 14. March 2016, <http://www.wsj.com/articles/u-s-ruling-would-allow-first-shipments-of-unrefined-oil-overseas-1403644494AX>.
Thematic Network on Critical Energy Infrastructure Protection, Position Paper of the Tnceip on EU Policy on Critical Energy Infrastructure Protection (November 2012), Office for Official Publications of the European Communities, Luxembourg, 2012.
Trans Adriatic Pipeline, 'Tap at a Glance', 2016. Web, 20. January 2016, <http://www.tap-ag.com/the-pipeline>.
U.S. Department of Energy, Strategic Plan 2014-2018, U.S. Department of Energy, 2014.
U.S. Energy Information Administration, Annual Energy Outlook 2015 with projections to 2040, U.S. Department of Energy, Washington D.C., 2015 (a).
U.S. Energy Information Administration, Assumptions to the Annual Energy Outlook 2015, U.S. Department of Energy, Washington D.C., 2015 (b).
U.S. Energy Information Administration, Country Analysis Brief: Iraq, U.S. Department of Energy, Washington D.C., 2015 (c). Available from: <https://www.eia.gov/beta/international/analysis_includes/countries_long/Iraq/iraq.pdf>.
U.S. Energy Information Administration, Tight Oil Production Trends in a Low Price Environment, U.S. Department of Energy, Washington D.C., 2015 (d). Available from: <https://www.eia.gov/conference/2015/pdf/presentations/nulle.pdf>.
U.S. Energy Information Administration, Quarterly Coal Report, U.S. Department of Energy, Washington, 2015 (e).
U.S. Energy Information Administration, ‘Analysis & Projections - World Shale Resource Assessments’, eia.gov, U.S. Department of Energy, Washington D.C., 2015. Web, 27. January 2016, <https://www.eia.gov/analysis/studies/worldshalegas/>.
U.S. Energy Information Administration, ‘Argentina: International energy data and analysis’, eia.gov, U.S. Department of Energy, Washington D.C. Web, 5. January 2016, <https://www.eia.gov/beta/international/analysis.cfm?iso=ARG>.
U.S. Energy Information Administration, ‘Brazil: International energy data and analysis’, eia.gov, U.S. Department of Energy, Washington D.C. Web, 5. January 2016, <https://www.eia.gov/beta/international/analysis.cfm?iso=BRA>.
U.S. Energy Information Administration, ‘Canada: International energy data and analysis’, eia.gov, U.S. Department of Energy, Washington D.C. Web, 2. February 2016, <https://www.eia.gov/beta/international/analysis.cfm?iso=CAN>.
U.S. Energy Information Administration, ‘Crude oil prices to remain relatively low through 2016 and 2017’, eia.gov, U.S. Department of Energy, Washington D.C. Web, 14. March 2016, <http://www.eia.gov/todayinenergy/detail.cfm?id=24532>.
The EU’s energy diplomacy: Transatlantic and foreign policy implications
101
U.S. Energy Information Administration, ‘Effect of Increased Levels of Liquefied Natural Gas Exports on U.S. Energy Markets’, eia.gov, U.S. Department of Energy, Washington D.C., 2014. Web, 13. March 2016 <https://www.eia.gov/analysis/requests/fe/>.
U.S. Energy Information Administration, ‘Growth in U.S. hydrocarbon production from shale resources driven by drilling efficiency’, eia.gov, U.S. Department of Energy, Washington D.C. Web, 21. January 2016, <https://www.eia.gov/todayinenergy/detail.cfm?id=15351>.
U.S. Energy Information Administration, ‘How much carbon dioxide is produced per kilowatthour when generating electricity with fossil fuels?’, eia.gov, U.S. Department of Energy, Washington D.C. Web, 6. February 2016, <http://www.eia.gov/tools/faqs/faq.cfm?id=74&t=11>.
U.S. Energy Information Administration, ‘International Energy Statistics’, eia.gov, U.S. Department of Energy, Washington D.C. Web, 1. February 2016, <https://www.eia.gov/cfapps/ipdbproject/iedindex3.cfm?tid=5&pid=57&aid=1&cid=regions&syid=1980&eyid=2015&unit=TBPD>.
U.S. Energy Information Administration, ‘International Energy Statistics - Crude Oil Proved Reserves 2014’, eia.gov, U.S. Department of Energy, Washington D.C., 2014. Web, 27. January 2016, <http://www.eia.gov/beta/international/rankings/#?aid=6&pid=57&tl_type=a&tl_id=6-A>.
U.S. Energy Information Administration, ‘International Energy Statistics - Petroleum and Other Liquids Production 2014’, eia.gov, U.S. Department of Energy, Washington D.C., 2014. Web, 27. January 2016, <http://www.eia.gov/beta/international/rankings/#?prodact=53-1&cy=2014>.
U.S. Energy Information Administration, ‘Iran’, eia.gov, U.S. Department of Energy, Washington D.C.,2015.Web, 27. January 2016, <https://www.eia.gov/beta/international/analysis.cfm?iso=IRN>.
U.S. Energy Information Administration, ‘Projections show U.S. becoming a net exporter of natural gas’, eia.gov, U.S. Department of Energy, Washington D.C. Web, 3. January 2016, <https://www.eia.gov/todayinenergy/detail.cfm?id=20992>.
U.S. Energy Information Administration, ‘Table 5a : U.S. Natural Gas Supply, Consumption, and Inventories’, 9. February 2016. Web, 19. February 2016, <https://http://www.eia.gov/forecasts/steo/tables/?tableNumber=15>.
U.S. Energy Information Administration, ‘Technical Options for Processing Additional Light Tight Oil Volumes Within the United States’, eia.gov, U.S. Department of Energy, Washington D.C. Web, 14. March 2016, <https://www.eia.gov/analysis/studies/petroleum/lto/>.
U.S. Energy Information Administration, ‘U.S. Crude Oil Production Forecast-Analysis of Crude Types’, eia.gov, U.S. Department of Energy, Washington D.C. Web, 13 March 2016 <http://www.eia.gov/analysis/petroleum/crudetypes/archive/2014/pdf/crudetypes.pdf>.
U.S. Energy Information Administration, 'U.S. Dry Natural Gas Production', eia.gov, U.S. Department of Energy, Washington D.C. Web, 04. March 2016, <https://www.eia.gov/dnav/ng/hist/n9070us2A.htm>.
U.S. Energy Information Administration, 'U.S. Natural Gas Total Consumption', eia.gov, U.S. Department of Energy, Washington D.C. Web, 04. March 2016, <https://www.eia.gov/dnav/ng/hist/n9140us2A.htm>.
U.S. Energy Information Administration, ‘U.S. remained world's largest producer of petroleum and natural gas hydrocarbons in 2014’, eia.gov, U.S. Department of Energy, Washington D.C. Web, 16. December 2015, <https://www.eia.gov/todayinenergy/detail.cfm?id=20692>.
U.S. Energy Information Administration, ‘Venezuela’, U.S. Department of Energy, Washington D.C. Web, 20 May 2016, https://www.eia.gov/beta/international/analysis.cfm?iso=VEN.
Policy Department, Directorate-General for External Policies
102
U.S. Energy Information Administration, 'World Oil Transit Chokepoints', eia.gov, 10. November 2014. Web, 10. February 2016, <https://http://www.eia.gov/beta/international/regions-topics.cfm?RegionTopicID=WOTC>.
U.S.-EU Energy Council, Joint Statement of 7th meeting, May 2016, <http://www.euintheus.org/press-media/joint-statement-u-s-eu-energy-council>.
U.S. Office of Naval Intelligence, 'Horn of Africa/Gulf of Guinea/Southeast Asia: Piracy Analysis and Warning Weekly (Paww) Report for 8 – 14 January 2015', 15. January 2015. Web, 20. January 2016, <http://www.oni.navy.mil/Intelligence_Community/piracy.htm>.
Umbach, F., 'Commercial Confidentiality: An Obstacle to Effective Mitigation to Cyber Attacks of Critical Energy Infrastructures?', Energy Security Forum, No 8.December, 2013, pp. 4-8.
United States Department of Energy, and United States Department of Homeland Security, Energy Sector-Specific Plan an Annex to the National Infrastructure Protection Plan, Government Printing Office, Washington, DC, 2010.
United States Department of Homeland Security, National Infrastructure Protection Plan (Nipp), Government Printing Office, Washington, DC, 2012.
United States Government Accountability Office, 'Public Safety Consequences of a Terrorist Attack on a Tanker Carrying Liquefied Natural Gas Need Clarification', Government Printing Office, Washington, DC, 2007.
Viscusi, G. and Duarte, E., ‘Spain, Portugal, France Call for Greater Access for Iberian Gas,’ Bloomberg Media, 4. March 2015, Web, 13. Mach 2016, <http://www.bloomberg.com/news/articles/2016-02-02/morgan-stanley-this-is-what-a-world-without-oil-looks-like>.
Wahba, A. L., ‘Egypt’s military deploys along SuMed oil pipeline, official says’, Bloomberg, 1. February 2011, Web, 14. March 2016, <www.bloomberg.com/news/articles/2011-02-01/egypt-military-deploys-along-sumed-oil-pipe-adds-sentries-official-says>.
Wang, Q. et al., ‘Natural gas from shale formation – The evolution, evidences and challenges of shale gas revolution in United States’, Renewable and Sustainable Energy Reviews, No 30, 2014, pp. 1-28.
Wells, P., U.S.LTO market responds to global price decline, Boston Petroleum Research, Winchester, UK, August 2015.
White House, National Security Strategy, Washington, February 2015.
White House, 'Presidential Policy Directive (PPD-21) on Critical Infrastructure Security and Resilience', 12. February 2013.
Wilson, A. B., Liquefied Natural Gas in Europe, European Parliamentary Research Service, 2015.
Woertz, E., The Domestic Challenges in the Saudi Energy Market and Their Regional and Geopolitical Implications. Policy Brief. Oslo: Norwegian Peacebuilding Resource Center (NOREF), 2013. Available at: <http://www.peacebuilding.no/var/ezflow_site/storage/original/application/05a485f202440778052158eb7ef9808b.pdf>.
Woertz, E.,‘Mining Strategies in the Middle East and North Africa.’ Third World Quarterly No. 35 (6):939-957, 2014. Available at: <http://dx.doi.org/10.1080/01436597.2014.907706>.
Wood, R. et al., Shale Gas: A Provisional Assessment of Climate Change and Environmental Impacts, Tyndall Centre Technical Reports, 2011.
World Coal Association, ‘Coal Market and Pricing’, worldcoal.org. Web, 21. January 2016, <https://www.worldcoal.org/coal/coal-market-pricing>.

The EU’s energy diplomacy: Transatlantic and foreign policy implications
103
World Coal Association, ‘Coal Seam Methane’, worldcoal.org. Web, 2. February 2016, <https://www.worldcoal.org/coal/coal-seam-methane>.
World Maritime News, ‘Argus: Bigger Suez Canal does not guarantee increased traffic’, 31. July 2015, <worldmaritimenews.com/archives/168082/argus-bigger-suez-canal-does-not-guarantee-increased-traffic/>.
World Nuclear Association, ‘Nuclear Power in the European Union’, world-nuclear.org, 2015 (a). Web, 18. February 2016, <http://www.world-nuclear.org/info/Country-Profiles/Others/European-Union/>.
World Nuclear Association, ‘Supply of Uranium (Updated September 2015)’, world-nuclear.org, 2015 (b). Web, 25. February 2016, <http://www.world-nuclear.org/information-library/nuclear-fuel-cycle/uranium-resources/supply-of-uranium.aspx>.
World Nuclear Association, ‘Nuclear Power in France’, world-nuclear.org, 2015 (c). Web, 7. January 2016, <http://www.world-nuclear.org/info/country-profiles/countries-a-f/france>.
World Nuclear Association, ‘ Nuclear Energy in Germany,’ world-nuclear.org, 2016 Web. 20 April 2016, <http://www.world-nuclear.org/information-library/country-profiles/countries-g-n/germany.aspx>.
YCharts, 'Henry Hub Natural Gas Spot Price', ycharts.com. Web, 04. March 2016, <https://ycharts.com/indicators/natural_gas_spot_price>.
YCharts, ‘European Union Natural Gas Import Price’, ycharts.com. Web, 20. May 2016, < https://ycharts.com/indicators/europe_natural_gas_price>.
Yergin, D. 1991. The prize: The epic quest for oil, money, and power. New York: Simon & Schuster.