policy, competitiveness and agricultural trade: an ... · pdf file1 policy, competitiveness...
TRANSCRIPT

1
Policy, Competitiveness and Agricultural Trade: An Application of
the Policy Analysis Matrix (PAM) to Israeli Agriculture
by
Israel Finkelshtain, Yael Kachel and Ofir Rubin1
The Hebrew University of Jerusalem
Department of Agricultural Economics and Management
February 2011
1 Financial support from DANIDA (Danish International Development Agency) in the framework of
the Middle East Regional Agricultural Programme is acknowledged.

2
Contents
Page
Overview 3
1. Development of the Fruit and Vegetable Sector in Israel 3
2. Policy Analysis Matrix of the Israeli Agriculture 17
3. Conclusions 32
Appendix 1: Estimation of Social Prices for Fruit and
Vegetables included in the PAM study
34
Appendix 2: Detailed PAM computations for scenario1 (base-
case assumptions)
71
Appendix 3: Estimation of Support to Agriculture: Comparison
OECD - PAM
82

3
Overview
Our work is a first attempt to construct a policy analysis matrix (PAM) for the
purpose of assessing the government support for the Israeli agriculture and its impact
on comparative advantage, agricultural trade and social profits. We start with a review
of the Israeli fruit and vegetable sector in the last decade. In the second section, we
introduce the PAM methodology and review applications of this methodology in other
countries. In the main part of the study PAM is developed and applied to explore the
impact of varying social prices, availability of domestic factors and to examine the
consequences of partial or complete removal of government supports for agricultural
producers in Israel. In the last section we conclude our findings, discuss policy
implications and feasible ways to extend this framework for future research.
1. Development of the Fruit and Vegetable Sector in Israel2
This chapter reviews the development of the Israeli fruit and vegetable sector in the
last decade (2000 – 2009). It provides the necessary background information about
the crops chosen for the PAM analysis, their importance for Israeli agriculture and
their development in the last decade. The evaluation of PAM results and choice of
simulations for different policy scenarios takes into account the descriptive analysis
presented in this chapter.
Plant production accounts for about 60% of the total value of agricultural production
in Israel. The value of Israeli crop production increased substantially in the last
decade. Crop production increased from 9.4 billion NIS in 2000 to 15.6 billion in
2009 (2009 prices), corresponding to a yearly growth rate of 5.7%. For comparison,
the real GDP (market prices) increased from 2000 to 2009 by 3.0% per year, based on
population growth (+2.0% per year) and an increase in the GDP per capita (+1.0% per
year).
Most of the growth in the value of crop production is accounted for by an increase in
the value of domestic consumption (+4.1 billion NIS) and exports (+2.0 billion NIS)
while the value of crop products diverted to the processing industry or to intermediate
uses hardly changed (Figure 1). Vegetables (including potatoes and melons) and fruits
2 All Figures and Tables presented in this chapter are based on Central Bureau of Statistics (CBS) data.

4
(not including citrus) account for most of the increase in the production value (Figure
2).
Figure 1
Israel: Development of Crop Production - Value
-
2,000
4,000
6,000
8,000
10,000
12,000
14,000
16,000
18,000
2000 2001 2002 2003 2004 2005 2006 2007 2008 2009
NIS
mil
lio
n (
rea
l p
rice
s,
20
09
=1
00)
Intermediate produce
Export
Manufacturing
Local consumption
Figure 2
Israel: Development of Crop Production - Value
-
2,000
4,000
6,000
8,000
10,000
12,000
14,000
16,000
18,000
2000 2001 2002 2003 2004 2005 2006 2007 2008 2009
NIS
mil
lio
n (
rea
l p
rice
s,
20
09
=1
00
)
Seeds and otherFlowers and garden plantsOther fruitCitrusVegetables, potatoes and melonsField crops
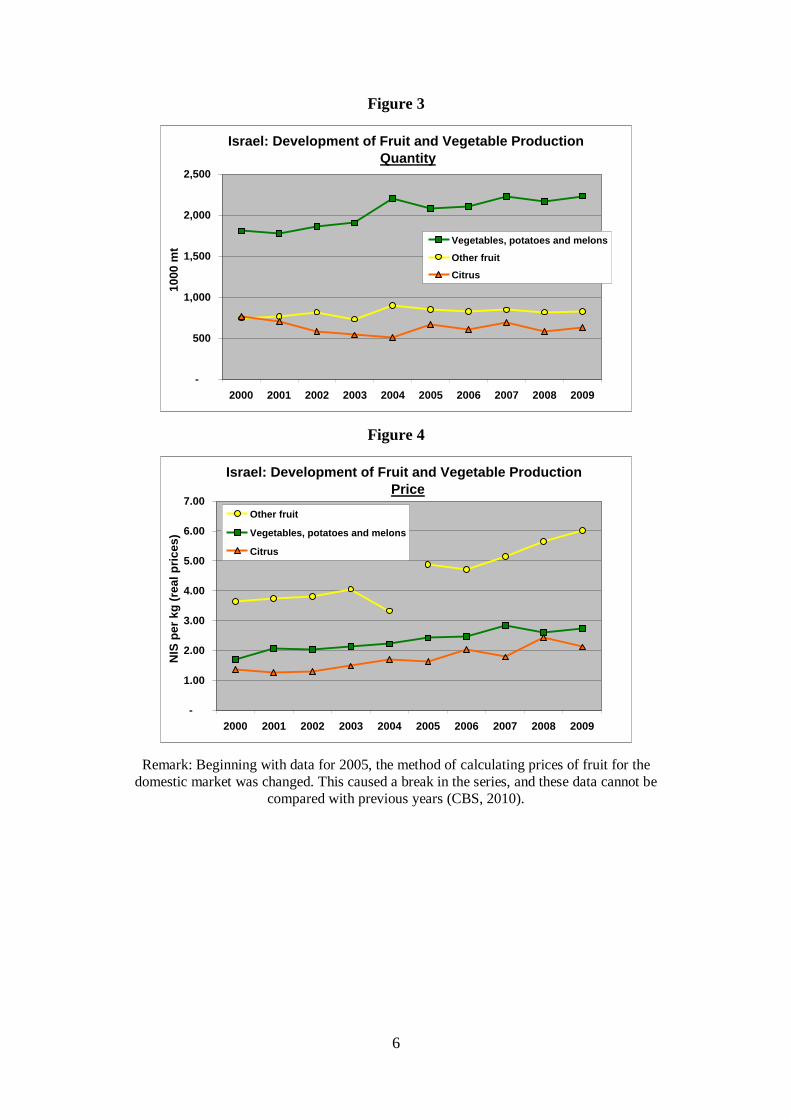
Israel produced in 2009 about 3.7 million tons of fruit and vegetables (Table 1,
Figures 3 and 4). Vegetable production increased substantially in the last decade
(+2.4% per year), mainly because of growing vegetable exports. On the other hand,
total fruit production (citrus and other fruits) hardly changed. For both fruit and
vegetables, real grower prices increased substantially. For fruits, prices in recent years

5
cannot be compared to prices before 2005 because of a change in the data collection
method.
Crops selected for PAM analysis include seven crops classified by Israeli statistics as
vegetables (regular tomatoes, cherry tomatoes, cucumbers, peppers, strawberries,
potatoes, melons) and three crops classified as fruits (table grapes, mangoes, dates).
Table 1 presents the value of production of these crops by main uses, as well as
quantity produced and unit values (average prices). The vegetables included in our
study account in 2009 for 62% of the production value for vegetables (including
potatoes and melons) and for close to 80% of vegetable exports. Selected fruits
represent 23% of the production value for fruits (excluding citrus) and 45% of fruit
exports (2009). Some of the selected crops are produced nearly exclusively for
domestic consumption (cucumbers, strawberries), while a substantial share of the
other crops is exported. For three crops included in the study (cherry tomatoes,
peppers, dates) exports are considerably more important than domestic consumption.
In the remainder of this chapter we present the development of the different
subsectors included in the study. Prices for exported produce are recorded by the CBS
as f.o.b. (price level at the port in the exporting country: free on board). Prices for
produce sold in the domestic market are wholesale prices minus a marketing margin
(about 12%) and production board fees. Prices were deflated using the CPI (2009 =
100).
6
Figure 3
Israel: Development of Fruit and Vegetable Production
Quantity
-
500
1,000
1,500
2,000
2,500
2000 2001 2002 2003 2004 2005 2006 2007 2008 2009
1000 m
t
Vegetables, potatoes and melons
Other fruit
Citrus
Figure 4
Israel: Development of Fruit and Vegetable Production
Price
-
1.00
2.00
3.00
4.00
5.00
6.00
7.00
2000 2001 2002 2003 2004 2005 2006 2007 2008 2009
NIS
per
kg
(re
al
pri
ces)
Other fruit
Vegetables, potatoes and melons
Citrus
Remark: Beginning with data for 2005, the method of calculating prices of fruit for the
domestic market was changed. This caused a break in the series, and these data cannot be
compared with previous years (CBS, 2010).

7
Table 1: Production value for crops analyzed with PAM (2009, Million NIS)
Production 2009
TotalDomestic
MarketExport
Share
export
Quantity
(1000 mt)
Price
(NIS/kg)Quantity Price
GRAND TOTAL 25,581 10,182 4,821 19%
CROPS - TOTAL 15,562 8,867 4,745 30%
FRESH VEGETABLES,
POTATOES and
MELONS 6,125 100% 4,008 1,778 29% 2,231 2.75 2.4% 5.5%
Vegetables - total 4,651 76% 3,063 1,403 30% 1,472 3.16 2.4% 6.6%
Regular tomatos for
fresh consumption 545 9% 429 116 21% 181 3.02 0.4% 5.9%
Cherry tomatoes 274 4% 60 214 78% 39 7.06 8.6% 2.5%
Cucumbers 290 5% 255 1 0% 117 2.45 -0.7% 4.5%
Peppers 997 16% 307 689 69% 202 4.93 9.1% 3.1%
Strawberries 447 7% 435 12 3% 24 18.94 4.1% 8.2%
Potatoes 1,106 18% 660 347 31% 609 1.82 5.6% 1.7%
Melons (Sugar) 131 2% 105 26 20% 39 3.36 -5.7% 5.2%
PLANTATIONS (incl.
young plantations) 6,296 4,179 1,405 22% 1,455 4.33 -0.4% 6.3%
Citrus - total 1,337 491 645 48% 631 2.12 -2.0% 5.1%
Fruit, excl. citrus - total 4,958 100% 3,688 760 15% 824 6.02 1.1% 5.7%
Table grapes 644 13% 582 51 8% 90 7.16 3.0% 6.2%
Mango 171 3% 109 63 37% 32 5.40 0.8% 6.9%
Dates 334 7% 104 230 69% 22 15.06 8.2% 2.4%
Production Value 2009 (Million NIS) Yearly growth rate
Remarks: Yearly growth rates relate to the years 2000 till 2009. Prices were deflated with the CPI.
Source: CBS
Short summary of the main developments in the production for the crops
included in the study (Figures 5 - 14)
Regular tomatoes (Figure 5): Production of regular tomatoes (not including tomatoes
for the processing industry) did not increase substantially in the last decade: about 150
to 200 thousand tons tomatoes are produced each year. Nearly all of the production is
sold in the domestic market. Prices for domestic production increased somewhat in
the last decade to about 2.5 NIS per kg. Export quantities are small (a few thousand
tons) and consist mainly of organic and other high quality tomatoes exported to niche
markets at high prices.
Cherry tomatoes (Figure 6): The production of cherry tomatoes increased in the last
decade, mainly because of an increase in exports. Despite the increase, production
quantities are much smaller than those of regular tomatoes – about 40 thousand tons
in 2009. The majority of the production is exported. Domestic consumption is about

8
15 thousand tons per year, at prices substantially higher than regular tomatoes (about
4 NIS per kg). Prices for exported cherry tomatoes are high compared to domestic
prices but declined in recent years (to 8 NIS per kg in 2009).
Cucumbers (Figure 7): The production of cucumbers declined somewhat in recent
years, to about 120 thousand tons in 2009. Most of the production is consumed fresh
in the domestic market, while about 10 to 15 percent of production is grown for the
processing industry. Exports of cucumbers are insignificant. Prices for cucumbers for
domestic consumption increased during the last decade (to 2.56 NIS/kg in 2009),
indicating an increase in grower prices.
Peppers (Figure 8): Pepper production more than doubled in the last decade to 200
thousand tons in 2009, driven by a dramatic development of pepper exports which
increased from 22 to 120 thousand tons. Prices for pepper exports are quite variable,
indicating changes in market conditions and probably also some data problems. In
recent years (2008 and 2009) export prices were quite low (about 5.5 NIS/kg). On the
other hand, prices for peppers sold in the domestic market are quite stable and show a
tendency to increase (price in 2009: 4.2 NIS/kg). Quantities of pepper marketed
domestically hardly changed in the last decade (about 75 thousand tons per year).
Strawberries (Figure 9): Strawberry production in Israel is relatively small compared
to other vegetables and fruits, about 20 to 25 thousand tons in recent years. However,
because of the high prices in recent years for strawberries marketed domestically (18
– 20 NIS/kg), the value of production of strawberries is quite high (about 450 million
NIS in 2009, which is half the production value of peppers and 63% more than the
production value of cherry tomatoes). Prices for domestic marketing were much lower
until 2006 (about 5 to 7 NIS/kg), and there are some doubts if the high strawberry
prices reported in recent years represent average grower prices. The variation of
strawberry in the course of the season is higher than for most other fruit and
vegetables, and no reliable monthly quantity data to calculate average weighted prices
are available (for example, according to wholesale price data collected by the
Ministry of Agriculture, strawberry prices in season 2007/08 declined from 46 NIS/kg
in October 2007 to 5.3 NIS/kg in April 2008).

9
Strawberry exports from Israel are small – about 2 to 3 thousand tons during most of
the last decade. In recent years exports declined to only one thousand tons in 2009.
Because of their short shelf life strawberries are exported by air, generating high
transportation costs and decreasing their competitiveness in the European market
compared to Spain.
Potatoes (Figure 10): Israeli potato production increased substantially in the last
decade, from 400 to close to 700 thousand tons in 2008. Similar to peppers, this
development was driven by a large expansion in exports, from about 100 thousand
tons per year at the beginning of the decade to a record of 335 thousand tons in 2007.
In the last two years, export quantities of potatoes declined and prices for exported
potatoes decreased, especially in 2008 (1.0 NIS/kg, compared to 1.5 NIS in the two
previous years). Contrary to other vegetables and fruits, prices for exported potatoes
are substantially lower than prices for potatoes marketed domestically (about 2.5
NIS/kg in recent years). This price difference is an indication of price discrimination,
characterized by potatoes exported to lower priced and more elastic export markets in
order to stabilize and increase prices in the domestic market.
Melons (Figure 11): Melon consumption and exports declined in the last decade. In
2009, close to 40 thousand tons of melons were produced in Israel, about 4,000 of
them for export. The substantial decline in exports indicates that Israeli melons are not
competitive in export markets compared to other suppliers like Spain and Morocco.
On the domestic market, and prices increased from about 2 to 3 NIS/kg and
consumption declined.
Table grapes (Figure 12): Table grape production increased in the last decade, from
70 to 90 thousand tons. The additional production quantities are marketed mainly in
the domestic market. Domestic prices reported by the CBS increased (from about 4 to
about 7 NIS/kg)3, indicating an increase in domestic demand for grapes and an
improvement in quality. Export quantities are quite variable and vary between 3 to 10
thousand tons per year. Israel exports table grapes to the European market during a
short time period (June – July) before large quantities from European production are
ready to be marketed. A decade ago Egypt started to target this market window and
3 Beginning with data for 2005, the method of calculating prices of fruit for the domestic market was
changed, and prices from 2005 cannot be compared with previous years (CBS).
10
increased table grape production for exports. Subsequently, European Union imports
of table grapes from Egypt increased from about 4,000 tons in 2000 to nearly 50
thousand tons in 2009! Competition from Egypt and other producers makes it difficult
for Israel to increase its grape exports.
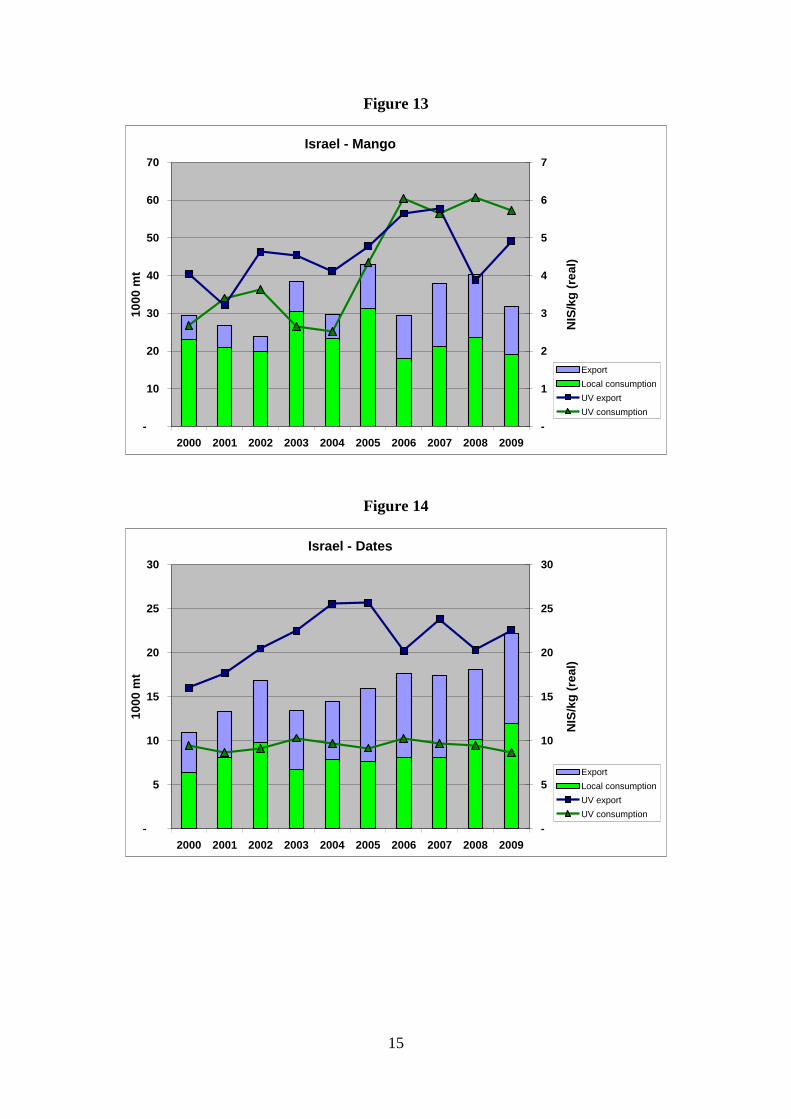
Mangoes (Figure 13): Israeli mango exports increased steadily from 6,000 tons in
2000 to 17 thousand tons in 2008, before declining to 13 thousand tons in 2009.
However, quantities marketed domestically did not increase and are about 20
thousand tons per year. Domestic prices from 2005 to 2009 are much higher than unit
values in the years before, probably because of a change in data collection for fruit
prices (see Footnote 2). Prices for exported fruit vary, depending on market conditions
in export markets. Most mangos from Israel are exported to the European Union.
Dates (Figure 14): Date production in Israel doubled in the last decade from 11 to 22
thousand tons. Exports as well as domestic consumption of dates doubled. Exports
account for nearly half of the production quantity and close to 70% of the value of
production (2009). Israel exports mainly high quality Medjool dates to European
markets which are sold at a substantial price premium compared to other date
varieties. Israel is the dominant supplier of this variety to Europe. In the Israeli
domestic market several date varieties are sold. Prices for dates sold domestically are
about 10 NIS/kg, compared to prices of 20 NIS and more for dates exported.

11
Figure 5
-
2.5
5.0
7.5
10.0
12.5
15.0
-
50
100
150
200
250
300
NIS
/kg
(re
al)
1000 m
tIsrael - Regular Tomatoes for Consumption
Export
Local consumption
UV consumption
UV export
Figure 6
Israel - Cherry Tomatoes
-
8
16
24
32
40
48
2000 2001 2002 2003 2004 2005 2006 2007 2008 2009
10
00
mt
-
2
4
6
8
10
12
NIS
/kg
(re
al)
Export
Local consumption
UV export
UV consumption

12
Figure 7
Israel - Cucumbers
-
20
40
60
80
100
120
140
160
2000 2001 2002 2003 2004 2005 2006 2007 2008 2009
10
00
mt
-
2
4
6
8
10
12
14
16
NIS
/kg
(re
al)
Export
Manufacturing
Local consumption
UV export
UV manufacturing
UV consumption
Figure 8
Israel - Pepper
-
20
40
60
80
100
120
140
160
180
200
220
2000 2001 2002 2003 2004 2005 2006 2007 2008 2009
10
00
mt
-
1
2
3
4
5
6
7
8
9
10
11N
IS/k
g (
rea
l)
Export
Manufacturing
Local consumption
UV export
UV manufacturing
UV consumption

13
Figure 9
Israel - Strawberries
-
5
10
15
20
25
30
2000 2001 2002 2003 2004 2005 2006 2007 2008 2009
10
00
mt
-
5
10
15
20
25
30
NIS
/kg
(re
al)
Export
Local consumption
UV export
UV consumption
Figure 10
Israel - Potatoes
-
100
200
300
400
500
600
700
800
900
2000 2001 2002 2003 2004 2005 2006 2007 2008 2009
10
00
mt
-
0.5
1.0
1.5
2.0
2.5
3.0N
IS/k
g (
rea
l)
Intermediate produce
Export
Manufacturing
Local consumption
UV export
UV manufacturing
UV consumption

14
Figure 11
Israel - Melons
-
10
20
30
40
50
60
70
2000 2001 2002 2003 2004 2005 2006 2007 2008 2009
10
00
mt
-
1
2
3
4
5
6
7
NIS
/kg
(re
al)
Export
Manufacturing
Local consumption
UV export
UV manufacturing
UV consumption
Figure 12
Israel - Table grapes
-
20
40
60
80
100
120
140
2000 2001 2002 2003 2004 2005 2006 2007 2008 2009
10
00
mt
-
2
4
6
8
10
12
14N
IS/k
g (
real)
Export
Manufacturing
Local consumption
UV export
UV manufacturing
UV consumption
15
Figure 13
Israel - Mango
-
10
20
30
40
50
60
70
2000 2001 2002 2003 2004 2005 2006 2007 2008 2009
10
00
mt
-
1
2
3
4
5
6
7
NIS
/kg
(re
al)
Export
Local consumption
UV export
UV consumption
Figure 14
Israel - Dates
-
5
10
15
20
25
30
2000 2001 2002 2003 2004 2005 2006 2007 2008 2009
10
00
mt
-
5
10
15
20
25
30N
IS/k
g (
real)
Export
Local consumption
UV export
UV consumption

16
Summary - Development of the Fruit and Vegetable Sector
Crops selected for the PAM analysis account for a substantial part of fruit and
vegetable production in Israel. Selected crops are diverse with regard to development
of production and main use. Most crops are characterized by higher prices for exports,
compared to produce sold on the domestic market. Probably the main reason is the
higher quality of exported produce. An additional reason may be higher risk
associated with exports (e.g. losses, price risk for growers with consignment
contracts). For potatoes (and mangos in 2008 and 2009) prices for exports are lower
than prices obtained for the part of the crop marketed locally, suggesting third-degree
price discrimination.

17
2. Policy Analysis Matrix of the Israeli Agriculture
Literature Review
The Policy Analysis Matrix is an accounting method proposed by Monke and Pearson
(1989). This analytical tool has been proven useful in numerous practical problems of
policy interventions in agriculture. For example, Nelson and Panggabean (1991)
utilized PAM to investigate governmental policies concerning sugar production in
Indonesia. Other uses of PAM include the evaluations of market power following
price liberalization (Staal and Shapiro 1994) and environmental effects and
transaction costs associated with technological developments (Kydd, Pearce and
Stockbridge 1997).
The competitiveness of three main crops in Thailand (rice, soybean and mungbeans)
has been studied by Yao (1997). In this study, PAM was utilized to measure the
efficiency losses associated with government intervention for diversification from rice
to legume crops. In another paper, PAM was used to study policy shifts from reliance
on chemical fertilizers to alternative agroforestry-based natural resource management
technologies in maize production in Cameroon (Adesina and Coulibaly 1998). Lastly,
Fang and Beghin (2000) assessed the comparative advantage and protection of key
crops in China. Their application of the PAM suggested that China has a comparative
advantage in labor intensive crops; therefore it should diverge from land intensive
crops as grain and oilseed. In particular, they claim that grain self-sufficiency policy
in China incurs efficiency losses.
Methodology
We employ the PAM approach in the following steps. First we construct a farm
budget, which assesses the revenues and costs of every fruit and vegetable crop
included in the study. We divide the agricultural inputs into tradable inputs and
domestic factors. This disaggregation is useful as it allows the assessment of policies
concerning trade in intermediate inputs and those targeting the supply of domestic
factors. Then a double columns bookkeeping is taking place. Market prices are used
to estimate farmers’ revenues, costs and profitability (i.e. private prices). The second

18
column is the valuation of the agricultural activity at social prices. For example, cost
figures in this column are the real costs related to the use of inputs in agriculture
which may include policy interventions. A third column is used to determine the
difference between the entries in each row. If social prices are lower than private
prices (or social costs are higher than private costs) it means that some kind of
government support is present. Accordingly, the opposite implies that a producer tax
is levied.
Table 2: Policy Analysis Matrix (based on Monke and Pearson 1998)
Values at private
prices
Values at social
prices
Divergence
Revenues A E I
Tradable inputs B F J
Domestic factors C G K
Profits D H L
Notice that
D = A - (B + C) = Private profits
H = E - (F + G) = Social profits
L = I - (J + K) = Net policy transfers
Data
Farm crop-specific budgets are constructed from recent available data composed by
the extension service unit of the Israeli Ministry of Agriculture and Rural
Development (2010). These are the most updated and detailed estimates of costs and
expected grower prices available. The farm budgets we used are not final yet, and
some updating of our calculations might be necessary when the final budgets will be
published. We use this data to compute private and social costs of production (entries
B, C, F and G in table 1). For private revenue, we multiply expected yields by grower
price. Grower prices for the domestic market and export (if applicable) used in the
analysis are the prices suggested by the extension service unit (table 2). For social
revenues we do the following. First we compute a reference world price for each crop.
This price represents the lowest possible price available for importing goods of

19
similar quality to substitute for domestic production (the reference price is calculated
at the growers’ price level, see Appendix 1 for details). Then we multiply expected
yields by the lower figure between the reference price and the grower price for each
crop, as this is the lowest price available. For example, if the reference world price is
the lower of the two then it is also the social price and it means that import should
take place. In any case, if we observe that A > E it implies that there is a binding tariff
or another form of trade barrier because domestic prices are higher than world prices.
The basic unit in our analysis is one cultivated dunam. We had access to farm budgets
for several varieties and/or growing technologies for each crop. In order to focus our
analysis we choose varieties/growing technologies that comply with one or two of the
following: crops which are most commonly grown in Israel for domestic consumption
and those which are more suited for exports. This is an important distinction because
the PAM is designed to handle the analysis of homogenous goods. However, in
practice, the quality of fruit and vegetables consumed domestically is generally lower
than the quality exported by Israel. Therefore, we present results for alternatives that
are important for domestic consumption and those which are more relevant for
exports. In this sense our analysis is conservative because we are careful not to
overestimate the domestic willingness to pay.

20
Table 2: Yields, grower prices and export share
Crop Yields
ton/dunam Domestic
price Export
price Export
share
Melons
Melon Galia, trellising, Nov-Jan 9 3000 4000 60%
Melon Galia, open field, July-Sep 4 2000 3000 75%
Melon Charentais, Spring 7 2000 4500 75%
Cucumbers
Cucumbers 3 cycles 28 2000 - 0%
Cucumbers 2 cycles 23 2000 - 0%
Cherry Tomatoes
Cherry clusters greenhouse 14 4000 7000 75%
Cherry tomatoes open field 7.5 4500 7500 80%
Tomatoes
Tomatoes clusters greenhouse 25 2600 - 0%
Tomatoes greenhouse 18 3000 4000 55%
Sweet pepper
Pepper, Dutch trellising, greenhouse, Apr 12 4500 - 0%
Pepper, Spanish trellising, greenhouse, Apr 12 4500 - 0%
Pepper, Spanish trellising, greenhouse, Aug 9 4000 5500 80%
Pepper, Spanish trellising, net, Aug 7.5 4000 5500 75%
Pepper, Dutch trellising, greenhouse, heating & cooling, July
22 4000 6500 60%
Strawberries
Strawberries 7 6754 20180 12%
Potatoes
Potatoes Spring 5 2200 - 0%
Potatoes Fall 3.5 2200 1700 80%
Mango
Mango Maya 2.79 3500 4900 50%
Table grapes
Grapes Thompson 3.5 5000 - 0%
Grapes Redglobe 3.24 3500 - 0%
Dates
Dates Medjool 1.06 9500 18000 60%
Remark: All prices are for crops sorted and packed, with the exception of mangoes
and dates which do not include packaging costs.

21
Government interventions
A recent OECD report indicates that the level of government support to the Israeli
agricultural sector decreased over time (2010). In particular, it is currently below the
average support of OECD and EU27 countries. On the other hand, an implicit
consumer burden index, also computed in this report, suggests that the social cost paid
by consumers in Israel due to government intervention is higher relative to the social
cost in the respective countries. This is mostly because the support in Israel shifted to
relatively more distortive policy instruments such as high tariff rates that may lead to
domestic market prices which are higher than world prices. In addition, the Israeli
government subsidizes key input factors, e.g., water, labor and capital, which may
distort their allocation. This implies that although direct transfers to producers
declined over time, private prices and social prices may diverge significantly.
According to OECD calculations, most of the support to agriculture is provided to
livestock sectors while support of plant production and especially fruit and vegetable
production is relatively small.
Information regarding agricultural policies for this study is composed from several
sources (e.g. OECD, WTO, Israeli officials and interactions with professionals in the
field). This study includes government support of the following types; water for
irrigation, hired labor, capital investment, tariff and crop insurance.
Land and water
Most Israeli land is state-owned (94%). Land use rights for farmers are allocated by
the Israel Land Administration for a small fee and no market mechanism takes place.
Some land transactions between farmers may take place at the margin but in these
cases the price is strongly linked with associated water rights. Water resources are
state-owned as well and the quota for agriculture use is coupled with agricultural land.
Water for agriculture use is subsidized. While the price of water for urban
consumption is 4.5 NIS/m³, it is only 1.5 NIS/m³ for agriculture. We assume
desalination cost of 2.75 NIS/m³ and couple that with 1 NIS/m³ to account for
delivery costs. Therefore, the social cost of supplying water for agriculture in our
study is 3.75 NIS/m³. In addition, with recent increase in the regulated price of water
in Israel it was agreed that 0.15 NIS/m³ of the farmer price is allocated back to rural
communities for maintaining and investing in water infrastructure. Therefore, for the

22
purpose of PAM we subtract this amount from the grower price such that in our
analysis the farmer faces a real cost of 1.35 NIS/m³.
Hired labor
Government support for labor in agriculture is provided by licenses for hiring foreign
workers (mostly from Thailand). The employer cost of an unskilled foreign worker in
agriculture is estimated as 68% of that of the Israeli unskilled worker (Eckstein 2007).
Based on the estimation of Kimhi et al. (2010), we employ 226 NIS/day for hiring a
foreign worker which in turn implies that the cost of an unskilled Israeli worker is 332
NIS/day. Our calculations based on CBS labor survey data yield similar estimates.
However, the availability of foreign-workers is limited by the number of approvals
issued annually by the Israeli government. Recent statistics show that the share of
foreign workers in agriculture is about 50% of hired laborers (CBS). Accordingly, we
estimate that unskilled hired labor in Israeli agriculture is subsidized at rate of 25%.
Capital investment
The policy goals and magnitude of support given for investment in capital in
agriculture varies over time and across crops and type of capital. For example, at the
present support at rate of 40% is given for farmers investing in machinery which
substitutes unskilled labor and limited funds provide 20% subsidy for investments
related to export crops. To be time consistent we employ 20% government funding for
all investment in capital. That is to say that we assume that this rate reflects the long
term support provided for investments in agriculture.
Crop Insurance
Lastly, the Israeli growers enjoy a subsidized crop insurance plan. We assume that
insurance program is actuary fair so premiums reflect true value of expected risk in
agricultural production. Since agricultural risk is systematic and cannot be diversified
this insurance program should not create inefficiency in production. The share paid by
the government is 35% of the premium for natural damages insurance for all crops.
Crop specific premiums are available from KANAT. That is the agricultural insurance
company receiving the payments for the basic coverage subsidized by the Israeli
government. Our most recent data contain costs of insurance for the year 2006. The

23
social cost of insurance varies between 12 NIS/dunam (Melon) and 1,027 NIS/dunam
(Mango) for the crops considered in this study.
Fruit and vegetables crops considered
We provide a detailed analysis for the following crops: Tomatoes, cherry tomatoes,
cucumbers, melons, potatoes, mango, sweet peppers, strawberries, dates and grapes.
Being annual plants, the analysis of vegetable crops is more suited for the PAM
framework because most agricultural activities related to the cultivation of the
vegetable crop are performed over one season or one year. Fruits on the other hand
are perennials; which means that the related agricultural activities are spread
asymmetrically over number of years. To enable the PAM analysis for perennials we
convert their budgets to construct a "representative year" over the life of the plant.
First we compute the present values of the different activities in the multi-year budget.
Then we use interest rate to reallocate the activities such that all years are financially
identical. That allows us to use the representative year of the crop directly in the PAM
framework. Another key difference between vegetable and fruit budgets in our
analysis is with regard to investment in capital. In the farm budgets for vegetables it is
assumed that investments are being made by the farmer to purchase the required
machinery. We make use of these expenses to incorporate the subsidy for capital
investment. On the other hand, in the budget for fruit crops it is assumed that the
farmers are leasing machinery and equipment as needed. To account for subsidy in
these budgets we assume a competitive market were the renting firms pass on the
subsidy they received to invest in capital such that the farmers’ price reflects the
subsidy.
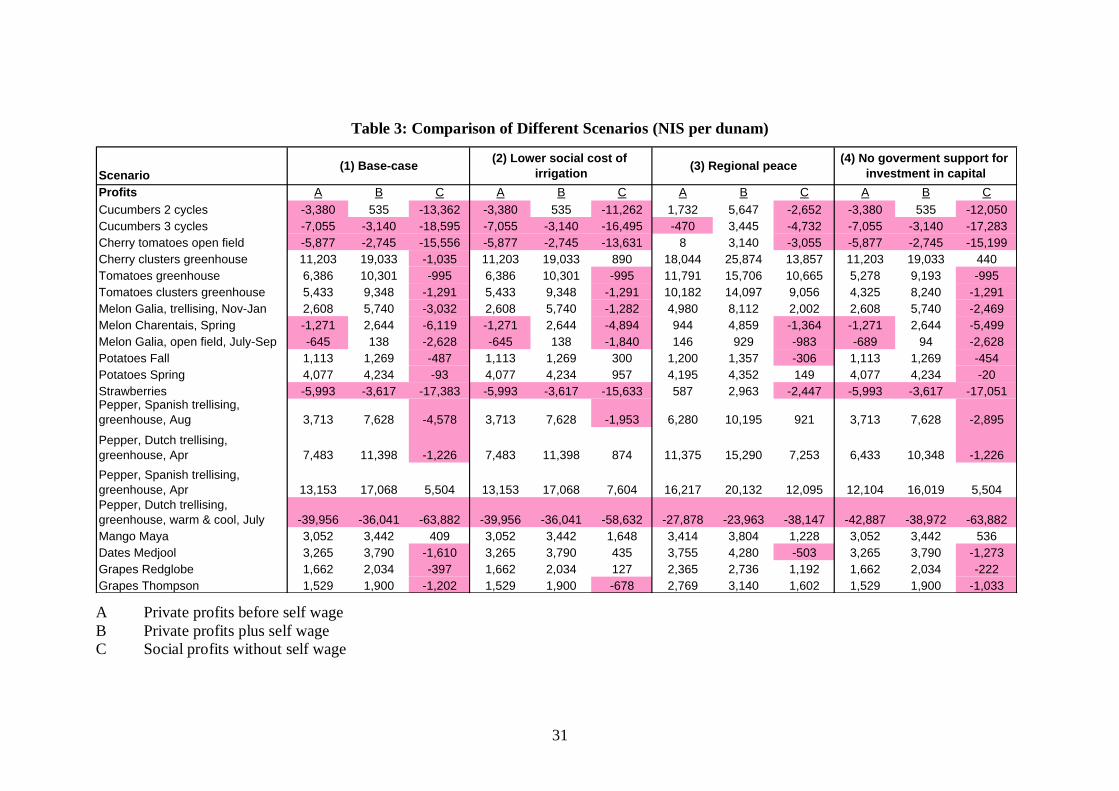
Next, we present the results of our base-case scenario analysis and compare it to three
scenarios representing availability of low quality water at lower prices to agriculture,
regional peace enabling Palestinian workers to replace foreign workers, and the
removal of government support for agriculture. Figures 15 to 21 present the results for
the base-case scenario and Table 3 summarizes results for all four scenarios. For more
details see Appendix 2.

24
Results for selected scenarios
Scenario 1: Base-case assumptions
The results for this scenario are based on the assumptions we listed above. We start by
looking at the profits in agriculture (figures 15–17). The social profits associated with
the cultivation of the selected crops in this study showed to be negative in all cases
but two; Mango Maya and one cultivation method of Pepper. Moreover, for some
crops the losses are quite substantial (e.g. strawberries, open field cherry tomatoes,
and two and three cycles of cucumbers and pepper production for export with heating
and cooling which is grown on a very small scale). Private profits are negative in
many cases as well. The result itself is not surprising because the extension service
farm budgets that we use as a platform for the analysis suggest that negative profits
are common. However, it is unreasonable to assume that the estimated negative
profits are sustainable. The answer for this may be the wage from labor of the farmer
himself. In the farm budgets the wage for skilled worker and the farmer in particular
are up to 580 NIS/day. It might be the case that the real opportunity cost of the farmer
is lower than that. In order to examine this idea we present the farmers wage from
labor as well (figures 15-17). We see that for some crops the farmer income from
wage may be seen as compensation for the negative profits.
The considered components of government support to agriculture are depicted in
figures 18 - 20. Hired labor and water for irrigation are the most subsidized domestic
factors. They account jointly for roughly 80%-90% of government support and may
exceed 10,000 NIS/dunam for some crops.
Potato crops are an exception to the above; it is the only crop in our study for which
the imposition of tariff is effective. For potatoes the domestic price is higher than the
world reference price and still exports are taking place. The observed situation can not
reflect a perfectly competitive market as one would expect that growers market their
output where prices are higher (i.e. domestically). This in turn should push domestic
prices down until there is no arbitrage in trade. In fact, prices of other crops may peak
during some periods over the year and at that times tariff may be binding. However,
being a static model the PAM is incapable of capturing events like these. In this sense
it might be the case that we underestimate the effect of government interventions in
trade (We investigate the impact of seasonality in reference prices on price
differentials in Appendix 1. Results indicate that also during low prices abroad tariffs

25
are not effective for tomatoes, peppers and strawberries but protect farmers from low-
priced grape imports).
Other type of support depicted are insurance and subsidy for investment in capital.
However the share of these two is relatively small compare to the support given to the
other domestic factors considered.
Seeing the significant gap between the social and private revenues, we are interested
to assess the overall transfer of consumers (tax payers) to agricultural producers. That
is not a new idea. The OECD uses Producer Support Estimates (PSE) as an index to
measure the size of the overall transfer. The PSE is computed as the share of overall
support per unit of its market price.. The minimum estimated PSE in our study is 17%
for Red Globe grapes and the maximum is for spring potatoes with 39%, which is due
to the gap between domestic and world prices (Figure 21). The median PSE of the
considered crops is 25.7%. In order to get a better grasp of the average government
support per crop one should weight these figures with shares of production. Our
estimates are significantly higher compared to OECD estimates for fruit and
vegetables (See appendix 3 for a detailed comparison).
Scenario 2: Lower social cost of irrigation
In this scenario the social cost of irrigation is assumed to be 2 NIS/m³. The purpose of
this scenario is to analyze the case in which water of lower quality is available for
agricultural producers.
The results suggest that the consumer burden is less significant with some crops
changing the sign from negative to positive social revenues. These are the two
varieties of potatoes, additional cultivation method of pepper, dates majul, red globe
grapes and greenhouse clusters cherry tomatoes. In addition, social revenues of
pepper for the domestic market have been increased by 38%. For mango which just
barely broke even in the base-case, the social profits in this case are fairly noticeable.
Scenario 3: Regional Peace
The supply of hired workers from the Palestinian Authority is unbounded in this
scenario. That is to say that the social cost of hiring unskilled worker in agriculture is
at the rate of the minimum wage of an Israeli worker plus benefits. We add to that
transportation cost which gives us 237 NIS/day. We construct this scenario by
substituting this new social cost of hiring unskilled worker with the 332 NIS/day

26
which we used in the base-case scenario. To be clear, we assume that there are no
foreign workers in Israel other than from the Palestinian Authority.
The results of this scenario imply that when we relax the subsidy for hired labor the
consumer burden is lowered considerably. This is because for most crops hired labor
is the largest subsidized domestic factor. First, in this case the estimated social
revenues of 11 crops are positive. Second, for large number of crops overall
government support is cut by more than 50%.
Scenario 4: No government support for investment in capital
The purpose of this scenario is to evaluate the sensitivity of our results to the
assumption of 20% fixed government support for investments in capital. We find this
scenario useful because the legislation regarding the subsidy for investments is
updated periodically according to changes in policy and prioritizations.
In this case the results are clear. Removal of the subsidy for investment in capital does
not create a considerable change in our results. In other words, in the case that one
assumes subsidy of smaller rate, it should not make much difference with regard to
the conclusions of this study. In addition, in the case that subsidy is given to
investment in specific machinery or equipment which provides non-proportional
government support it may affect the profitability of one crop over the other but in
any case, this component is too small to have a significant impact on the gap between
social and private profits.

27
Figure 15: Profits in vegetable crops - Scenario 1
Figure 16: Profits in vegetable crops (cont) - Scenario 1

28
Figure 17: Profits in fruit crops - Scenario 1
Figure 18: Government support for vegetable crops - Scenario 1

29
Figure 19: Government support for vegetable crops (cont) - Scenario 1
Figure 20: Government support for fruit crops - Scenario 1

30
Figure 21: Producer Support Estimates – Scenario 1
31
Table 3: Comparison of Different Scenarios (NIS per dunam)
Scenario
Profits A B C A B C A B C A B C
-3,380 535 -13,362 -3,380 535 -11,262 1,732 5,647 -2,652 -3,380 535 -12,050
-7,055 -3,140 -18,595 -7,055 -3,140 -16,495 -470 3,445 -4,732 -7,055 -3,140 -17,283
-5,877 -2,745 -15,556 -5,877 -2,745 -13,631 8 3,140 -3,055 -5,877 -2,745 -15,199
11,203 19,033 -1,035 11,203 19,033 890 18,044 25,874 13,857 11,203 19,033 440
6,386 10,301 -995 6,386 10,301 -995 11,791 15,706 10,665 5,278 9,193 -995
5,433 9,348 -1,291 5,433 9,348 -1,291 10,182 14,097 9,056 4,325 8,240 -1,291
2,608 5,740 -3,032 2,608 5,740 -1,282 4,980 8,112 2,002 2,608 5,740 -2,469
-1,271 2,644 -6,119 -1,271 2,644 -4,894 944 4,859 -1,364 -1,271 2,644 -5,499
-645 138 -2,628 -645 138 -1,840 146 929 -983 -689 94 -2,628
1,113 1,269 -487 1,113 1,269 300 1,200 1,357 -306 1,113 1,269 -454
4,077 4,234 -93 4,077 4,234 957 4,195 4,352 149 4,077 4,234 -20
-5,993 -3,617 -17,383 -5,993 -3,617 -15,633 587 2,963 -2,447 -5,993 -3,617 -17,051
3,713 7,628 -4,578 3,713 7,628 -1,953 6,280 10,195 921 3,713 7,628 -2,895
7,483 11,398 -1,226 7,483 11,398 874 11,375 15,290 7,253 6,433 10,348 -1,226
13,153 17,068 5,504 13,153 17,068 7,604 16,217 20,132 12,095 12,104 16,019 5,504
-39,956 -36,041 -63,882 -39,956 -36,041 -58,632 -27,878 -23,963 -38,147 -42,887 -38,972 -63,882
3,052 3,442 409 3,052 3,442 1,648 3,414 3,804 1,228 3,052 3,442 536
3,265 3,790 -1,610 3,265 3,790 435 3,755 4,280 -503 3,265 3,790 -1,273
1,662 2,034 -397 1,662 2,034 127 2,365 2,736 1,192 1,662 2,034 -222
1,529 1,900 -1,202 1,529 1,900 -678 2,769 3,140 1,602 1,529 1,900 -1,033
Cucumbers 2 cycles
Cucumbers 3 cycles
(1) Base-case(2) Lower social cost of
irrigation(3) Regional peace
(4) No goverment support for
investment in capital
StrawberriesPepper, Spanish trellising,
greenhouse, Aug
Pepper, Dutch trellising,
greenhouse, Apr
Cherry tomatoes open field
Grapes Thompson
Pepper, Spanish trellising,
greenhouse, Apr
Cherry clusters greenhouse
Tomatoes greenhouse
Tomatoes clusters greenhouse
Melon Galia, trellising, Nov-Jan
Melon Charentais, Spring
Melon Galia, open field, July-Sep
Potatoes Fall
Potatoes Spring
Pepper, Dutch trellising,
greenhouse, warm & cool, July
Mango Maya
Dates Medjool
Grapes Redglobe
A Private profits before self wage
B Private profits plus self wage
C Social profits without self wage

32
3. Conclusions
In this study we constructed a first policy analysis matrix for the Israeli agricultural
sector. The study accounts for a substantial part of fruit and vegetable production in
Israel. Therefore, the results may be seen as representative estimates of government
support to vegetables and fruit crops. We find that in most cases the social net value
of agricultural production activities is negative. With regard to private profits, fruit
crops present positive profits. The profits from vegetable crops vary greatly. In some
cases profits are negative, however, this may be the result of the high opportunity
wages for farm operators assumed by the extension service. In addition, we observe
higher private profits for the crops that have a relatively higher share of export, for
instance, some cultivation methods of pepper, medjool dates, some varieties of
tomatoes and cherry tomatoes, melons and mangoes.
We find that government support is as high as10,000 NIS/dunam for many of the
crops that are produced for the domestic markets, e.g. tomatoes and cucumbers. Next
in the level of support is strawberry, which is labor intensive and relies heavily on
foreign labor, followed by peppers which enjoy support of about 8,000 NIS/dunam.
Overall support for fruit crops is lower in most cases than support for vegetables, in
our study it ranges between 2300 and 3800 NIS/dunam.
High support for some agricultural crops suggests that there exists an important
potential for specialization and regional trade, once barriers to trade are removed. For
example, both Israel and the Palestinian authority may benefit from transferring the
production of labor intensive crops such as strawberries to the Palestinian authority.
Cucumbers are characterized by high social losses in Israel and indicate the potential
for imports from the Palestinian authority and Jordan. Egypt is very successful in
grape exports to Europe, while exports of Israeli grapes declined. Probably Egyptian
grapes could compete successfully with Israeli grapes also in the domestic Israeli
market.
Extensions for the base-case scenario provided three important lessons. First, scarce
water is a binding constraint for the development of agricultural production. The
ability to recycle water for irrigation is a key for lowering the consumer burden
related to the supply of agricultural commodities domestically. Second, regional peace

33
can bring unskilled labor which can replace the highly subsidized foreign workers in
agriculture. Third, government support for capital investments in agriculture affects
the profitability of some crops in the margins only and does not have a significance
impact on social prices.
There are some limitations for utilizing PAM. First, the methodology is essentially a
static measure. Namely, it is based on observed price system and assesses the
associated social transfers. On the downside, it cannot forecast accurately changes
which may rise due to policy modifications. That is mainly because PAM does not
model the effect of changes in government intervention on demand and supply forces.
Second, we use thorough this study fixed grower and reference prices. In reality,
prices fluctuate during the year. This means that it might be the case that at times of
high world prices export may be higher than in other times. On the other hand, other
short periods may be characterized by lower world prices which give rise to binding
tariffs. That cannot be observed using PAM. Third, There is spatial diversity with
regard to agricultural activities which is not treated here. Crops are being cultivated in
various regions in Israel. Since regions are not homogeneous with respect to domestic
factors, social prices should not be similar in different regions (for example, water
availability). An advanced study should look at these differences.
Future research
Our research is a first application of the PAM methodology to Israeli agriculture.
Obvious direction for future research is the extension of the PAM calculations to
additional crops, especially fruits, and additional agricultural sectors, e.g. livestock
production. However, a more challenging route to extend the analysis is to construct a
regionalized PAM model that allows identifying the relative advantages of various
regions within Israel. Perhaps most important is the development of regional PAM
analysis for Israel and the neighboring countries including the Palestinian Authority.
This is a necessary next step in completing the analysis of competitiveness of Israeli
agriculture and evaluate the potential for extending regional cooperation and
development of regional trade.

34
Appendix 1
Estimation of Social Prices for Fruit and Vegetables included in the PAM study
The main objective of this appendix is to establish relevant social prices for crops that
could be imported to Israel. Trade barriers like custom duties and or phytosanitary
restrictions may hamper fruit and vegetable imports into Israel. In this case, social
prices are expected to be lower than the private prices faced by Israeli growers. Most
of the crops selected for the study are exported by Israel but these exports are often of
a higher quality compared to consumption in the domestic market. Therefore, even in
the case of exports it might be that the import of lower quality produce is restricted,
creating a price wedge between world prices and domestic prices.
Our analysis is based on European Union (EU) trade data for the crops selected for
the PAM analysis. Annual unit values calculated from EU trade data from import and
export quantities and values provide an indication of the average price level for each
supplying country. For some crops (e.g. cucumbers, regular tomatoes, strawberries,
grapes) imports from the Palestinian Authority, Jordan or Egypt might provide a
lower cost alternative compared to EU produce. We plan to explore this alternative if
reliable data on prices become available.
In addition, the analysis of the development of EU markets provides an important
background for the examination of comparative advantage of the selected crops. 9 of
the 10 crops selected for the study are exported by Israel, and the EU is the main
export market. It is also expected that in the short run the main beneficiaries of a
reduction of custom duties for fruit and vegetables in Israel will be EU countries,
especially for the more perishable fruit and vegetables.
The data presented in this chapter were extracted from Eurostat (the statistical bureau
of the EU) in August 2010. Data relate to the EU27 (27 countries), INTRA-trade is
the trade between member countries, while EXTRA-trade relates to imports from
third countries or exports to third countries.
Calculation of reference prices for importable fruit and vegetables
The reference price stands for the price at which produce can be imported to Israel.
The calculation of reference prices is based on unit import or export values (UV)
derived from EU trade date. Based on the analysis of EU trade data we selected the

35
most relevant potential supplier for each product. We then added transport and
additional marketing costs to calculate reference prices at the border in Israel and
deducted a wholesale margin to obtain the reference price at the growers' level.
The choice of the relevant reference price for Israel was based on the following
criteria:
(a) Crops not grown in the EU, or grown just in small quantities (dates,
mangos): the relevant price is the UV obtained by the main supplier of this
crop from outside the EU in the main import country of the crop. If there are
several important import countries the one closer to Israel is chosen.
(b) Crops grown in the EU, small imports from Extra-EU (cucumbers,
potatoes from storage, strawberries): Export UV from main EU export country
close to Israel (e.g. UVs from France or Italy are preferred on UVs from the
UK).
(c) Crops grown in the EU and also imported in significant quantities from
non-EU countries (tomatoes, sweet pepper, cucumbers, new potatoes):
decision on relevant price after comparison of UVs for Extra EU imports from
main suppliers to UVs for main suppliers from the EU.
To verify the reliability of the data we studied the development of UVs in the last
decade, and compared unit values for main suppliers, and unit values in different
markets. In addition, we compared UVs to import prices in the Netherlands and
wholesale prices in Germany. Overall, UVs seem to provide a reasonable
approximation of the price level in the EU market for the selected fruit and
vegetables. We calculated the average unit value for the last three years (2007-2009)
to obtain a representative reference price. For details about the choice of the relevant
reference price see the explanations and detailed data on the development of EU trade
for the selected fruit and vegetables in this Appendix.
Calculations of reference prices are presented in Table 1. If the reference price is
lower than the price obtained by Israeli growers, obstacles to imports manage to
increase prices in Israel. In this case, the relevant social price is the reference price. If
grower prices are lower, there is no market price support, and domestic prices are
identical to social prices.

36
We compare reference prices to two sets of grower prices: (1) prices reported by the
Extension Service and used in the farm budgets which are the basis of the PAM
calculations, (2) UVs for the domestic market calculated from CBS data. These UV's
are based on wholesale prices minus a marketing margin (12%) and marketing board
fees.
Domestic UVs are lower than reference prices for most of the fruit and vegetables in
our study. Exceptions are potatoes, table grapes, dates and strawberries. For potatoes,
reference prices are lower compared to both sets of grower prices, indicating that
import restrictions are significant in protecting domestic growers. For table grapes and
strawberries, prices reported by the CBS are higher than corresponding reference
prices but prices reported by the Extension Service are lower than reference prices.
There are indications that prices for strawberries and table grapes reported by the CBS
are higher than actual prices received by growers. The prices for dates of the
Extension service is higher than the reference prices but it is for high quality Medjool
dates while the reference price represents lower priced Dekel Nour dates. Thus, our
analysis indicates that with regard to the selected crops for our study import
restrictions are only relevant for potatoes.
The remainder of this appendix contains an analysis of EU trade for each crop
included in the study which provides the necessary information for the choice of the
relevant reference prices. In addition, we investigate if qualitative results for price
differentials change if we consider seasonality of reference prices. We also compare
grower prices of Israeli and Palestinian farmers for four fruit and vegetables (see
Sensitivity Analysis on page 65).
Results indicate that also during low prices abroad tariffs are not effective for
tomatoes, peppers and strawberries but protect farmers from low-priced grape
imports. Tomato, potato, grape and strawberry prices of Palestinian farmers are lower
than prices received by Israeli farmers. This indicates quality differences but also
potential for specialization and trade but has to be verified based on more reliable data
for Palestinian growers.

37
Table 1: Calculation of Reference Prices for Selected Fruit and Vegetables Grown in Israel (based on EU trade unit values)
Euro/mt NIS/mt
Description of
selected UV
UV (avg. 07-
09)
Transport
to Israel
Additional
expenses
Ref. price
importer's
level
Ref. price
importer's
level
Ref. price
grower's
level
Price
domestic
market (1)
Price
domestic
market (2)
MPD (1)
(acc. to
higher p)
MPD (2)
DatesImport UV for
Tunisia in France 1,714 150 105 1,969 10,766 9,501 12,500 9,277 1,734 -224
MangosImport UV for Brazil
in Netherlands 956 257 78 1,290 7,056 6,264 5,000 5,808 -1,264 -456
Table grapesExport UV Italy (all
exports) 1,115 175 81 1,371 7,497 6,518 5,000 / 3,500 7,181 -1,518 663
MelonsExport UV Spain (all
exports) 625 232 61 918 5,021 4,617 3,000 / 2,000 2,961 -1,617 -1,656
TomatoesImport UV for
Turkey in Bulgaria 780 172 65 1,017 5,561 5,193 3,000 / 2,600 2,694 -2,193 -2,499
Cherry tomatoesExport UV Italy (intra
exports) 1,538 240 111 1,889 10,332 9,745 4,500 / 4,000 4,307 -5,245 -5,438
CucumbersImport UV for
Turkey in Bulgaria 663 172 60 895 4,897 4,565 2,000 2,429 -2,565 -2,136
Sweet pepperExport UV Spain
(intra exports) 1,246 321 101 1,668 9,123 8,575 4,500 / 4,000 4,021 -4,075 -4,554
New potatoesImport UV for Egypt
in Italy 336 35 371 2,030 1,694 2,200 2,466 506 772
Old potatoesExport UV France
(intra exports) 166 170 36 372 2,037 1,700 2,200 2,466 500 766
StrawberriesExport UV Spain (all
exports) 1,722 1,208 233 3,163 17,295 14,730 6,754 18,817 -7,976 4,087 Remarks: Translation from Euro to NIS with the average exchange rate in 2009 (5.4685 NIS/Euro). This rate is nearly identical to the average rate in 2007-2009 (5.45
NIS/Euro).
Additional expenses: include harbor expenses and importer's commission.
Price domestic market (1): Grower prices - Source: Extension Service, Ministry of Agriculture (For dates and mangos, we added sorting and packing costs (1500 and 3000 NIS respectively)
Price domestic market (2): Grower prices at the entrance of the wholesale market, Source: CBS
Following OECD methodology for Israel, we assume that wholesale margins for fruit and vegetables in Israel are 12% and calculate margins for each crop based on CBS unit
values. To compare reference prices with grower prices, margins are deducted from the reference price at importer's level.

38
EU trade of selected fruit and vegetables
Dates (EU Imports)
There is little commercial date production in the EU, and most of the supply is
imported from third countries. The main import country is France. Part of the
imported dates are re-exported to other EU countries (INTRA-trade). Until 2007, date
imports to the EU from third countries increased substantially and reached 74,000 mt
(see Graph).
EU IMPORT 2009 1000 mt Euro/kg Remarks
MARKETS Total EXTRA INTRA EXTRA INTRA
EU27 82 68 14 1.87 2.44 About half of supply from Tunisia
France 24 23 1 1.80 3.50
UK 13 11 1 1.51 2.80
Germany 11 9 2 1.89 2.72
Italy 8 8 0 2.42 2.82
Spain 7 5 2 2.28 1.59
Netherlands 4 3 1 2.95 2.17
other 15 9 6
Tunisia is the main supplier of dates to the EU, supplying about 50% of EXTRA-EU
dates. Iran is an additional important supplier at low prices (less than half of Tunisia).
Israel supplies high quality dates, mainly Medjool, which are sold at very high prices
compared to other suppliers. Israel supplies most of the Medjool dates imported by
the EU. Date imports from Israel increased substantially in the last decade, while
prices remained stable – indicating an increase in demand for Medjool dates.
SUPPLIERS to EU 1000 mt Euro/kg
2007 2008 2009 2007 2008 2009
Imports to EU27 (extra+intra) 88.3 90.1 82.2
EU27_EXTRA 74.0 67.5 67.8 1.76 1.76 1.87
TUNISIA 34.0 33.3 35.0 1.86 1.81 1.83
IRAN 15.6 13.6 12.8 0.75 0.75 0.89
ISRAEL 6.8 6.4 7.6 4.27 4.14 4.20
ALGERIA 11.3 8.2 5.7 1.27 1.37 1.40
Other extra 6.4 6.0 6.7
EU27_INTRA 14.3 22.6 14.4 2.44 1.53 2.44
Imports to FRANCE (extra+intra) 27.4 24.9 24.1
EU27_EXTRA 26.9 24.3 23.0 1.76 1.82 1.80
TUNISIA 13.6 13.7 15.7 1.76 1.71 1.68
ALGERIA 10.3 7.7 5.5 1.27 1.37 1.40
ISRAEL 2.2 2.3 1.3 3.45 3.64 3.99
IRAN 0.2 0.2 0.2 1.60 1.77 2.47
Other extra 0.5 0.4 0.4
EU27_INTRA 0.5 0.6 1.2 3.29 2.71 3.50
Import price for PAM: 1.714 Euro/kg (Import UV of date imports to France from
Tunisia, avg. 2007-09) + transportation cost from France to Israel (we assume direct
imports from Tunisia are not feasible at the moment).
This price is the estimated world price for medium quality dates supplied to the
domestic market in Israel. High quality Medjool dates are sold at much higher prices
in export markets.

39
Date Imports to EU27
0
10,000
20,000
30,000
40,000
50,000
60,000
70,000
80,000
90,000
100,000
1999 2000 2001 2002 2003 2004 2005 2006 2007 2008 2009
mt
EU27_INTRA
Other extra
Algeria
Israel
Iran
Tunisia
EU Date Imports - UNIT VALUE
0.00
0.50
1.00
1.50
2.00
2.50
3.00
3.50
4.00
4.50
5.00
1999 2000 2001 2002 2003 2004 2005 2006 2007 2008 2009
Eu
ro/k
g
Import to EU27 from Israel
Import to France from Israel
Import to EU27 from Tunisia
Import to France from Tunisia

40
Mangos (EU Imports)
There is little commercial mango production in the EU, and most of the supply is
imported from third countries (The data presented here include in addition to mango
small quantities of guava and mangosteen). A large part of the mango imports arrive
in the Netherlands and are re-exported.
EU IMPORT 2009 1000 mt Euro/kg Remarks
MARKETS Total EXTRA INTRA EXTRA INTRA
EU27 309 199 110 1.19 1.16
Netherlands 113 106 7 1.01 1.04 Imports mainly for re-export
UK 48 37 11 1.19 1.08
Spain 18 16 2 1.10 1.18
Belgium 18 14 4 1.38 1.38
France 28 7 21 2.44 1.12
Italy 9 6 3 1.11 1.42
Other 75 13 62
Brazil is the main supplier of mango to the EU and accounted for 41% of EU imports
from third countries in 2009. Imports from Peru increased very much in the last
decade, and Peru is now the second most import supplier of mangos to the EU.
Mangos from Peru do not compete with mangos from Israel because of different
supply seasons (Peru: Dec. – April; Israel: July – Sep.). The increase of EU mango
imports from Israel is relatively moderate.
A small part of Israel's supplies to the EU are high quality mangos (ready to eat).
Mangos from Pakistan are mainly supplied to the UK market.
SUPPLIERS to EU 1000 mt Euro/kg
2007 2008 2009 2007 2008 2009
Imports to EU27 (extra+intra) 339 362 309
EU27_EXTRA 212 232 199 1.30 1.17 1.19
BRAZIL 83 97 81 1.04 1.04 1.06
PERU 37 51 36 0.91 0.91 1.15
ISRAEL 15 13 13 2.36 1.81 1.17
PAKISTAN 13 13 13 1.45 1.41 1.32
COTE D'IVOIRE 15 11 12 1.88 1.10 1.04
Other extra 49 47 44
EU27_INTRA 127 131 111 1.20 1.13 1.16
Imports to NETHERLANDS (extra+intra) 112 132 114
EU27_EXTRA 103 125 107 0.99 0.96 1.01
BRAZIL 53 65 52 1.00 0.94 0.93
PERU 24 34 28 0.82 0.84 1.02
COTE D'IVOIRE 4 4 6 0.69 1.17 0.98
UNITED STATES 5 5 4 0.97 0.95 0.97
ISRAEL 2 2 3 1.07 1.08 1.02
Other extra 14 14 14
EU27_INTRA 9 7 7 1.48 1.30 1.04
Import price for PAM: 0.956 Euro/kg (Import UV of mango imports from Brazil to
Netherlands, avg. 2007-09) + price difference transportation to Israel.

41
Mango Imports to EU27
0
50,000
100,000
150,000
200,000
250,000
300,000
350,000
400,000
1999 2000 2001 2002 2003 2004 2005 2006 2007 2008 2009
mt
EU27_INTRA
Other extra
COTE D'IVOIRE
PAKISTAN
ISRAEL
PERU
BRAZIL
EU Mango Imports - UNIT VALUE
0.00
0.50
1.00
1.50
2.00
2.50
1999 2000 2001 2002 2003 2004 2005 2006 2007 2008 2009
Eu
ro/k
g
Import to EU27 from Israel
Import to NL from Israel
Import to EU27 from Brazil
Import to NL from Brazil

42
Table Grapes (EU Exports and Imports)
The EU is a large producer of table grapes and supplies the majority of grapes
consumed in the EU. Main EU countries exporting table grapes are Italy and Spain.
Most of their exports are going to other EU countries. In addition to EU supply, in the
off-season substantial quantities of table grapes are imported from third countries,
mainly from Chile and South Africa (see Graph). EU imports from third countries
doubled in the last decade.
EU EXPORT 2009 1000 mt Euro/kg Main Markets
SUPPLIERS Total EXTRA INTRA EXTRA INTRA
EU27 965 118 847 1.28 1.33
Italy 389 48 341 1.18 1.06 Ger. 96, France 55, Poland 37
Netherlands 242 20 221 1.87 1.69 Re-exports
Spain 101 7 94 1.32 1.46 UK 30, Germany 21, Portugal 16
Greece 77 7 71 0.87 1.24
Belgium 39 1 39 1.85 1.45 Re-exports
Germany 30 2 29 1.63 1.56
other 86 33 53
EU IMPORT 2009 1000 mt Euro/kg Remarks
MARKETS Total EXTRA INTRA EXTRA INTRA
EU27 1,578 617 961 1.59 1.24
Netherlands 374 292 83 1.67 0.65 Mainly for re-export
UK 242 173 69 1.68 1.57
Belgium 71 41 29 1.42 1.65 Mainly for re-export
Germany 307 23 283 1.50 1.35
Spain 41 19 23 1.48 1.16
other 543 69 474
Grape imports from Egypt increased substantially in recent years while imports from
Israel declined. The supply season for both origins as well as unit values are similar
(see Graph). Both countries supply grapes to the EU mainly in June when local
supplies are still relatively small. This explains the relatively high UVs for Egyptian
and Israeli grapes in comparison to EU supplies.
SUPPLIERS to EU 1000 mt Euro/kg
2007 2008 2009 2007 2008 2009
Imports to EU27 (extra+intra) 1,563 1,745 1,578
EU27_EXTRA 612 649 617 1.51 1.54 1.59
CHILE 172 208 190 1.37 1.45 1.53
SOUTH AFRICA 181 183 181 1.58 1.73 1.64
EGYPT 38 40 49 1.83 1.46 1.99
BRAZIL 59 55 39 2.00 1.85 1.91
INDIA 28 41 37 1.32 1.25 1.30
TURKEY 37 36 30 0.80 0.79 0.74
ISRAEL 6 4 4 1.92 1.33 1.61
Other extra 91 84 87
EU27_INTRA 951 1,096 961 1.33 1.30 1.24
Imports to NETHERLANDS (extra+intra) 342 389 382
EU27_EXTRA 265 309 296 1.52 1.57 1.67
CHILE 85 113 102 1.41 1.45 1.61
SOUTH AFRICA (incl. NA ->1989) 94 98 101 1.48 1.68 1.66
INDIA 13 25 24 1.35 1.26 1.33
EGYPT 9 11 15 1.90 1.24 1.93
ISRAEL 1 1 1 1.86 1.47 1.80
Other extra 63 62 53
EU27_INTRA 77 79 86 0.76 0.74 0.66

43
Table Grape Imports to EU27
0
200,000
400,000
600,000
800,000
1,000,000
1,200,000
1,400,000
1,600,000
1,800,000
1999 2000 2001 2002 2003 2004 2005 2006 2007 2008 2009
mt
EU27_INTRA
Other extra
TURKEY
INDIA
BRAZIL
EGYPT
SOUTH AFRICA
CHILE
EU Table Grape Imports - UNIT VALUE
0.00
0.50
1.00
1.50
2.00
2.50
1999 2000 2001 2002 2003 2004 2005 2006 2007 2008 2009
Eu
ro/k
g
Import to EU from Israel
Import to EU from Turkey
Import to EU from Egypt
Import to NL from Egypt
EU countries export each year around 1 million mt table grapes, mainly to other EU
countries. Export unit values for Spanish and Italian grapes increased in the last
decade. Export UVs for Spanish grapes are generally higher, probably because a
substantial share of exports are marketed in the high quality – high price UK market
(see Graphs on next page).
We consider EU export UVs to be a better approximation of relevant prices for export
to Israel, compared to the EU import UV for Egyptian grapes, because Egyptian
grapes are supplied to the EU mainly during a short period at the beginning of the EU

44
season when prices are still high. Italian grape prices are chosen as relevant import
price for Israel because Italy is closer to Israel compared with Spain. Additionally,
Italy markets just small quantities of grapes to the UK, therefore the average quality
of exported grapes is probably closer to the quality sold in the domestic market in
Israel.
Import price for PAM: 1.115 Euro/kg (Italy, avg. export UV for all exports in
2007-09) + marketing costs to Israel.
EU27 Table Grape Exports
0
200,000
400,000
600,000
800,000
1,000,000
1,200,000
1999 2000 2001 2002 2003 2004 2005 2006 2007 2008 2009
mt
Other EU to EU extra
Other EU to EU intra
Export Spain to EU extra
Export Spain to EU intra
Export Italy to EU extra
Export Italy to EU intra
EU Table Grape Exports - UNIT VALUE
0.00
0.20
0.40
0.60
0.80
1.00
1.20
1.40
1.60
1999 2000 2001 2002 2003 2004 2005 2006 2007 2008 2009
Eu
ro/k
g
Export Italy to EU intra
Export Italy to EU extra
Export Spain to EU intra
Export Spain to EU extra

45
Melons (EU Exports and Imports)
Melons are produced in the Mediterranean EU countries and in addition imported
from Central and South America (mainly Brazil) and Morocco. Spain is the dominant
supplier in the EU and accounted for nearly 70% of EU exports in 2009. EU imports
from third countries increased while imports from other EU countries are stagnating
(see Graph on next page). Imports from Israel declined very much, from about 20,000
mt in 1999 to less than 5,000 mt in 2009.
EXPORT 2009 1000 mt Euro/kg Main Markets
SUPPLIERS Total EXTRA INTRA EXTRA INTRA
EU27 532 37 496 0.96 0.68
Spain 363 12 351 0.76 0.57 Germany 87, France 64, UK 60
Netherlands 80 7 73 1.01 0.83 Mainly re-exports
France 39 11 29 1.20 1.37 Italy 10, Belgium 9, Switzerland 9
Italy 18 3 16 1.08 0.70
Other 31 4 27
IMPORT 2009 1000 mt Euro/kg Main EU Extra Suppliers
MARKETS Total EXTRA INTRA EXTRA INTRA
EU27 822 331 490 0.81 0.73 Brazil 173, Morocco 55, Costa R. 43
Netherlands 151 110 40 0.84 0.65 Brazil 60, Costa R. 26, Honduras 14
UK 137 73 64 0.79 0.69 Brazil 53, Honduras 8, Costa Rica 8
Spain 65 62 3 0.67 0.74 Brazil 47, Morocco 7
France 141 50 92 1.01 0.69 Morocco 48
Italy 35 11 24 0.79 0.99
Other 293 26 266
Imports unit values for melons from Morocco and especially Israel are high compared
to supplies from South and Central America and from Spain. Probably most of the
melons from Morocco and Israel are supplied before the main domestic season when
prices are still high. Unit values for Turkish melons are very low. Average yearly UVs
for melons from Brazil in the last decade were relatively stable while UVs for
Moroccan and Israeli melons declined (see Graph on next page). Melons from
Morocco are mainly imported by France.
SUPPLIERS to EU 1000 mt Euro/kg
2007 2008 2009 2007 2008 2009
Imports to EU27 (extra+intra) 903 883 822
EU27_EXTRA 366 362 331 0.75 0.73 0.81
BRAZIL 192 193 173 0.64 0.65 0.71
MOROCCO 47 57 55 0.93 0.85 0.92
COSTA RICA 68 51 43 0.73 0.70 0.82
HONDURAS 14 17 23 0.86 0.75 0.90
PANAMA 18 20 13 0.71 0.72 0.76
TURKEY 7 8 7 0.37 0.38 0.46
ISRAEL 8 4 5 1.05 0.94 1.13
Other extra 12 12 12
EU27_INTRA 537 521 490 0.75 0.78 0.73
Imports to FRANCE (extra+intra) 138 147 141
EU27_EXTRA 46 52 50 1.00 0.91 1.01
MOROCCO 37 46 48 0.95 0.88 0.97
Other extra 8 6 2
EU27_INTRA 93 95 92 0.78 0.83 0.69

46
Melon Imports to EU27
0
100,000
200,000
300,000
400,000
500,000
600,000
700,000
800,000
900,000
1,000,000
1999 2000 2001 2002 2003 2004 2005 2006 2007 2008 2009
mt
EU27_INTRA
Other extra
COSTA RICA
MOROCCO
BRAZIL
EU Melon Imports - UNIT VALUE
0.00
0.20
0.40
0.60
0.80
1.00
1.20
1.40
1.60
1.80
1999 2000 2001 2002 2003 2004 2005 2006 2007 2008 2009
Eu
ro/k
g
Import to EU from Israel
Import to EU from Brazil
Import to EU from Morocco
Import to France from Morocco
EU countries export each year more than half a million ton melons, nearly all of them
to other EU countries (see next Graph). Spain is the dominant supplier. Spains climate
and supply season is comparable to Israel, and Spanish export unit values are chosen
as basis for the approximation of world prices for melon supplies to Israel.
Import price for PAM: 0.625 Euro/kg (Spain, avg. export UV for all exports in 2007-
09) + marketing costs to Israel.

47
EU27 Melon Exports
0
100,000
200,000
300,000
400,000
500,000
600,000
700,000
1999 2000 2001 2002 2003 2004 2005 2006 2007 2008 2009
mt
Other EU to EU extra
Other EU to EU intra
Export France to EU extra
Export France to EU intra
Export Spain to EU extra
Export Spain to EU intra
EU Melon Exports - UNIT VALUE
0.00
0.20
0.40
0.60
0.80
1.00
1.20
1.40
1.60
1999 2000 2001 2002 2003 2004 2005 2006 2007 2008 2009
Eu
ro/k
g
Export France to EU intra
Export France to EU extra
Export Spain to EU intra
Export Spain to EU extra

48
Strawberries (EU Exports and Imports)
Most of the strawberries consumed in the EU are grown in the EU. Third countries –
mainly Morocco, Egypt and Turkey – supply about 10% of EU imports (43,000 mt in
2009). EU strawberry imports from third countries increased in the last decade. In the
last 5 years, imports from third countries as well as other EU countries are more or
less stagnant (see Graph on next page).
EU EXPORT 2009 1000 mt Euro/kg Main Markets
SUPPLIERS Total EXTRA INTRA EXTRA INTRA
EU27 396 36 360 2.41 2.02
Spain 225 7 217 2.35 1.66 France 72, Ger. 68, Italy 18
Netherlands 39 4 35 4.25 3.72 Belgium 11, Germany 9
Belgium 38 5 33 3.57 3.00
France 23 2 21 3.08 1.88 Germany 8, Italy 6
Italy 17 3 14 2.13 1.96
Poland 17 7 10 1.14 0.67
Germany 12 1 12 2.62 2.31
Greece 9 5 4 1.48 1.53
Other 17 3 14
EU IMPORT 2009 1000 mt Euro/kg Remarks
MARKETS Total EXTRA INTRA EXTRA INTRA
EU27 424 43 381 2.09 1.96
France 107 14 92 2.35 1.61
UK 39 7 32 2.22 3.05
Belgium 29 5 23 3.75 2.06
Romania 6 5 1 0.25 2.05
Germany 104 4 100 1.50 1.79
Spain 4 3 2 1.57 2.11
Other 135 4 131
Israel supplies small quantities of strawberries in winter at high prices. EU imports
from Israel declined from 2000 – 3000 mt per year during most of the last decade to
950 mt in 2008 and 450 mt in 2009. Strawberries from Israel compete with supplies
from Egypt which increased very much – from 1000 mt in 2000 to 13,000 mt in 2009.
Average unit values for supplies from the EU and from other third countries are much
lower compared to UVs for strawberries from Israel and Egypt. This is explained by
the supply of limited quantities in winter months which have to be transported by air-
freight.
SUPPLIERS to EU 1000 mt Euro/kg
2007 2008 2009 2007 2008 2009
Imports to EU27 (extra+intra) 425.0 406.1 424.6
EU27_EXTRA 40.5 43.3 43.1 2.03 1.78 2.09
MOROCCO 20.6 23.3 19.4 1.79 1.74 1.89
EGYPT 6.7 6.8 13.3 3.07 3.11 3.09
TURKEY 4.9 7.7 7.1 0.50 0.47 0.44
ISRAEL 2.0 0.9 0.4 3.50 3.19 4.02
Other extra 6.2 4.6 2.8
EU27_INTRA 384.5 362.8 381.5 1.81 2.10 1.95
Imports to FRANCE (extra+intra) 108.9 106.9 106.8
EU27_EXTRA 14.2 15.7 14.4 2.09 2.09 2.35
MOROCCO 11.9 13.2 12.0 1.98 2.04 2.27
UNITED STATES 1.3 1.5 1.4 2.27 1.78 2.36
EGYPT 0.8 0.8 1.0 3.17 3.51 3.18
Other extra 0.2 0.1 0.0
EU27_INTRA 94.7 91.3 92.4 1.66 1.78 1.61

49
Strawberry Imports to EU27
0
50,000
100,000
150,000
200,000
250,000
300,000
350,000
400,000
450,000
1999 2000 2001 2002 2003 2004 2005 2006 2007 2008 2009
mt
EU27_INTRA
Other extra
TURKEY
EGYPT
MOROCCO
EU Strawberry Imports - UNIT VALUE
0.00
1.00
2.00
3.00
4.00
5.00
6.00
1999 2000 2001 2002 2003 2004 2005 2006 2007 2008 2009
Eu
ro/k
g
Import to EU from Israel
Import to EU from Egypt
Import to EU from Morocco
Import to France from Morocco
EU countries export each year about 400,000 mt strawberries, nearly all of them to
other EU countries (see next Graph). Similar to melons, Spain is the dominant
supplier of strawberries in the EU. In 2009, exports from Spain accounted for nearly
60% of all strawberry exports of EU countries. Exports to third countries are mainly
to Switzerland (Spain and France) and Norway and Russia (Netherlands).
Unit values of strawberries from main suppliers to the EU market in recent years are
close to 2 Euro/kg (Spain 1.7 – 1.8 Euro/kg, France about 2 Euro/kg; Morocco Import
UV about 2 Euro/kg). Strawberries are highly perishable and have to be transported
by Israel by airfreight. Airfreight costs are high (about 1.4 €/kg, plus additional export

50
costs (air terminal costs, commission, interest) of about 0.6 €/kg), so that the relevant
import price of European strawberries to Israel is expected to be close to 4 €/kg,
higher than the price for strawberries in Israeli wholesale markets in most months. For
example, wholesale prices for strawberries were close to 20 NIS/kg in December 2009
and January 2010 but declined to 11 NIS in February and to 6-7 NIS in March/April.
Spanish strawberries are mainly exported in March to May. We conclude that relevant
import prices for strawberries to Israel are prices of strawberries grown in the
Westbank or the Gaza Strip, or strawberries from Jordan or Egypt.
Import price of strawberries from Europe: 1.722 €/kg (Spain, avg. export UV for
all exports in 2007-09) + marketing costs to Israel.
EU27 Strawberry Exports
0
50,000
100,000
150,000
200,000
250,000
300,000
350,000
400,000
450,000
1999 2000 2001 2002 2003 2004 2005 2006 2007 2008 2009
mt
Other EU to EU extra
Other EU to EU intra
Export NL to EU extra
Export NL to EU intra
Export Spain to EU extra
Export Spain to EU intra
EU Strawberry Exports - UNIT VALUE
0.00
1.00
2.00
3.00
4.00
5.00
6.00
1999 2000 2001 2002 2003 2004 2005 2006 2007 2008 2009
Eu
ro/k
g
Export Spain to EU intra
Export Spain to EU extra
Export NL to EU intra
Export NL to EU extra
Export France to EU intra
Export France to EU extra

51
Tomatoes (EU Exports and Imports)
EU countries imported in recent years close to 3 million mt tomatoes per year, mainly
from other EU countries. Main EU suppliers of tomatoes are the Netherlands and
Spain. Main third country supplier is Morocco (see Tables and Graph on next page).
The majority of tomato exports from Morocco to the EU are imported by France.
EU EXPORT 2009 1000 mt Euro/kg Main Markets
SUPPLIERS Total EXTRA INTRA EXTRA INTRA
EU27 2,592 167 2,425 1.13 1.00 Ger. 736, UK 370, France 234
Netherlands 964 57 907 1.44 1.13 Ger. 400, UK 172, Sweden 51
Spain 830 23 807 1.01 0.93 Ger. 161, UK 159, France 135
Belgium 200 17 184 0.97 0.84
France 196 9 187 1.29 1.08 Ger. 68, Italy 25, Belgium 20
Portugal 107 0 106 0.94 0.22
Italy 93 6 87 1.85 1.55 Germany. 30, Austria 15, UK 9
Other 203 56 147
EU IMPORT 2009 1000 mt Euro/kg Main Suppliers
MARKETS Total EXTRA INTRA EXTRA INTRA
EU27 2,899 524 2,375 0.76 1.06
France 535 300 235 0.70 0.76 Morocco 289, Tunisia 7
Bulgaria 80 77 3 0.73 0.42 Turkey 60, Macedonia 11
Spain 192 31 161 0.75 0.32
Romania 41 27 13 0.66 0.90
UK 397 21 375 0.96 1.16
Netherlands 180 16 164 1.10 1.11
Italy 130 14 116 1.01 0.86
Slovenia 21 8 13 1.05 0.93
Other 1,324 30 1,294
In addition to Morocco, the EU imports substantial quantities of tomatoes from
Turkey and Israel. Imports from Turkey increased in the last decade from about
20,000 mt to about 100,000 mt while imports from Israel doubled from 12,000 mt in
1999 to 25,000 mt in 2009. Average import unit values of Israeli tomatoes are higher
than UVs of other suppliers, probably mainly because Israel supplies primarily off-
season cherry tomatoes and organic tomatoes to the EU.
SUPPLIERS to EU 1000 mt Euro/kg
2007 2008 2009 2007 2008 2009
Imports to EU27 (extra+intra) 2,919 2,903 2,906
EU27_EXTRA 471 473 525 0.84 0.73 0.76
MOROCCO 302 306 354 0.80 0.71 0.70
TURKEY 91 98 103 0.88 0.77 0.83
ISRAEL 27 19 25 1.39 1.29 1.29
Other extra 51 51 43
EU27_INTRA 2,448 2,430 2,381 1.13 1.10 1.06
Imports to FRANCE (extra+intra) 494 483 535
EU27_EXTRA 274 267 300 0.83 0.73 0.70
MOROCCO 255 251 289 0.80 0.70 0.68
EU27_INTRA 219 216 235 0.91 0.87 0.76
Imports to BULGARIA (extra+intra) 40 58 80
EU27_EXTRA 38 55 77 0.50 0.54 0.73
TURKEY 23 35 60 0.76 0.75 0.83
MACEDONIA 12 17 11 0.09 0.13 0.23
SYRIA 0 0 2 0.66 0.78 0.89
JORDAN 1 2 2 0.48 0.48 0.50
EU27_INTRA 2 3 3 0.40 0.41 0.42

52
Tomato Imports to EU27
0
500,000
1,000,000
1,500,000
2,000,000
2,500,000
3,000,000
1999 2000 2001 2002 2003 2004 2005 2006 2007 2008 2009
mt
EU27_INTRA
Other extra
ISRAEL
TURKEY
MOROCCO
EU Tomato Imports - UNIT VALUE
0.00
0.20
0.40
0.60
0.80
1.00
1.20
1.40
1.60
1.80
1999 2000 2001 2002 2003 2004 2005 2006 2007 2008 2009
Eu
ro/k
g
Import to EU from Israel
Import to EU from Morocco
Import to France from Morocco
Import to EU from Turkey
Import to Bulgaria from Turkey
EU tomato exports increased in the last decade. The large majority of tomatoes is
exported to other EU countries – the main markets are Germany, the UK and France.
Exports to third countries approached 170,000 mt in 2009 and accounted for only 6%
of total exports. Main third country markets are Russia, Switzerland and Norway.
We consider Spain, Italy and Turkey to be potential suppliers of tomatoes to Israel.
Unit values for these three countries (average 2007-09) are:
Turkey – Import UV in Bulgaria: 0.780 €/kg (slightly higher than the UV for
Moroccan tomatoes imported to France = 0.727
€/kg, probably mainly regular tomatoes)
Spain – Export UV for EU-intra trade: 0.930 €/kg (regular and cherry tomatoes)
Italy – Export UV for EU-intra trade: 1.538 €/kg (mainly cherry tomatoes)

53
We choose the UV for Turkish tomatoes for approximating the import price for
regular tomatoes, and the Italian export unit value for approximating the import price
for cherry tomatoes (transport costs to Israel have to be added to both UVs).
Alternatively, tomatoes might be imported to Israel from the West Bank, the Gaza
Strip or Jordan. Price statistics indicating import prices are currently not available.
EU27 Tomato Exports
0
500,000
1,000,000
1,500,000
2,000,000
2,500,000
3,000,000
1999 2000 2001 2002 2003 2004 2005 2006 2007 2008 2009
mt
Other EU to EU extra
Other EU to EU intra
Export Spain to EU extra
Export Spain to EU intra
Export NL to EU extra
Export NL to EU intra
EU Tomato Exports - UNIT VALUE
0.00
0.20
0.40
0.60
0.80
1.00
1.20
1.40
1.60
1.80
1999 2000 2001 2002 2003 2004 2005 2006 2007 2008 2009
Eu
ro/k
g
Exports Italy to EU intra
Exports NL to EU intra
Exports France to EU intra
Exports Spain to EU intra

54
Cucumbers (EU Exports and Imports)
Nearly all cucumbers consumed in the EU are supplied by EU countries. Similar to
other salad vegetables, the main suppliers are Spain and the Netherlands.
Imports from third countries account for about 3% of cucumber quantities imported
by EU countries (33,800 mt in 2009). The dominant third country supplier is Turkey.
EU EXPORT 2009 1000 mt Euro/kg Main Markets
SUPPLIERS Total EXTRA INTRA EXTRA INTRA
EU27 978 37.0 941 1.03 0.80 Ger. 437, UK 132, NL 76
Spain 438 12.9 425 0.86 0.84 Ger. 153, NL 70, UK 56
Netherlands 398 9.7 388 1.38 0.77 Ger. 239, UK 74, Czechia 18
Germany 29 1.7 27 0.96 0.62
Belgium 28 0.6 27 1.40 0.75
Greece 13 1.1 12 1.10 1.18
Austria 12 0.5 12 0.94 0.72
Poland 11 1.1 10 0.63 0.68
Bulgaria 9 0.1 9 0.63 1.00
Other 40 9.4 30
EU IMPORT 2009 1000 mt Euro/kg Main Extra-EU Suppliers
MARKETS Total EXTRA INTRA EXTRA INTRA
EU27* 1,082 33.8 1,048 0.73 0.56 Turkey 20, Morocco 3.3
Bulgaria 11 8.2 2 0.66 0.43 Turkey 6.1
Germany 469 5.5 464 0.53 0.76
Austria 28 4.4 23 1.14 0.94
Romania 8 3.1 5 0.64 0.84
Hungary 12 2.2 10 0.44 0.51
France 71 1.7 69 0.98 0.74
Slovenia 5 1.4 3 0.50 0.77
Other 479 7.3 471
* EU Eurostat data contained a mistake with regard to imports from Czechia (Czech imports in 2009 according to Eurostat: 450,000 mt, instead of about 12,000 mt in previous years). Total imports in the table above were corrected to account for the mistake.
Cucumber trade in the EU increased in the last decade. Also imports from third
countries increased but they are still very small (see Graph on next page).
Unit values for cucumbers imported to the EU from Turkey increased in recent years
(2007-09) to about 0.8 €/kg. Previous years were characterized by very low UVs for
Turkish cucumbers in Bulgaria (low quality or incorrect reporting?). Similar to
tomatoes, Bulgarian import UVs for Turkish cucumbers increased substantially with
the inclusion of Bulgaria in the EU in 2007.

55
Cucumber Imports to EU27
0
200,000
400,000
600,000
800,000
1,000,000
1,200,000
1999 2000 2001 2002 2003 2004 2005 2006 2007 2008 2009
mt
EU27_INTRA
EU27_EXTRA
EU Cucumber Imports - UNIT VALUE
0.00
0.10
0.20
0.30
0.40
0.50
0.60
0.70
0.80
0.90
1999 2000 2001 2002 2003 2004 2005 2006 2007 2008 2009
Eu
ro/k
g
Import to EU from Turkey
Import to EU from Extra EU
Import to Bulgaria from Turkey
Import to Bulgaria from Extra EU
Spain and the Netherlands account for more than 80% of EU cucumber exports (see
Graph on next page). Average export unit values for Spanish and Dutch cucumbers
exported to other EU countries are very similar most of the years (see next page).
Export unit values for third country exports can be quite different – they are probably
less reliable indicators of relevant prices for potential Israeli imports from the EU
because EU cucumber exports to third countries are very small and targeted to a few
markets with specific characteristics (main third country markets are Switzerland,
Russia and Norway).
Alternative import prices for PAM (average unit values 2007-09):
0.828 €/kg (Export UV of Spanish cucumbers to other EU countries) – add
transportation costs to Israel

56
0.663 €/kg (Import UV of Turkish cucumbers to Bulgaria) – add transportation costs
to Israel
We assume that Turkish cucumbers are similar to Israeli cucumbers while most
Spanish salad cucumbers are of the larger type mainly consumed in Europe. Hence,
we choose the UV for Turkish cucumbers.
Alternatively, tomatoes might be imported to Israel from the West Bank, the Gaza
Strip or Jordan. We do not have access to reliable price statistics for these countries.
EU27 Cucumber Exports
0
200,000
400,000
600,000
800,000
1,000,000
1,200,000
1999 2000 2001 2002 2003 2004 2005 2006 2007 2008 2009
mt
Other EU to EU extra
Other EU to EU intra
Export NL to EU extra
Export NL to EU intra
Export Spain to EU extra
Export Spain to EU intra
EU Cucumber Exports - UNIT VALUE
0.00
0.20
0.40
0.60
0.80
1.00
1.20
1.40
1.60
1999 2000 2001 2002 2003 2004 2005 2006 2007 2008 2009
Eu
ro/k
g
Export NL to EU extra
Export NL to EU intra
Export Spain to EU intra
Export Spain to EU extra

57
Sweet Pepper (EU Exports and Imports)
Pepper imports to the EU increased substantially in the last decade. In recent years,
EU countries imported more than a million mt of pepper per year. Supplies from the
EU (mainly from Spain and the Netherlands) are completed by imports from third
countries (see tables and Graph on next page).
EU EXPORT 2009 1000 mt Euro/kg Main Markets
SUPPLIERS Total EXTRA INTRA EXTRA INTRA
EU27 1,112 115 996 1.68 1.20 Ger. 330, UK 136, France 110
Spain 453 18 435 1.38 1.03 Ger. 123, France 92, Italy 56
Netherlands 442 66 376 1.99 1.41 Ger. 157, UK 94, Russia 19
Slovenia 40 2 37 0.90 1.09
Italy 28 1 27 1.57 1.28
Hungary 26 2 24 0.63 0.93
Belgium 23 3 20 1.49 1.11
France 22 3 20 1.41 1.16
Other 78 19 58
EU IMPORT 2009 1000 mt Euro/kg Main Extra-EU Suppliers
MARKETS Total EXTRA INTRA EXTRA INTRA
EU27 1,117 225 892 1.04 1.30 Isr.109, Morocco 50, Turkey 39
Slovenia 47 41 6 1.04 1.18 Israel 37
Netherlands 87 42 45 1.24 1.10 Israel 39
Spain 29 27 2 0.96 1.20 Morocco
Italy 90 23 67 1.19 1.01 Israel 22 (just in 2009)
Bulgaria 21 20 1 0.27 0.43 Turkey 12
France 115 17 98 1.69 1.02 Morocco 15
Other 729 56 672
Israel is the main third-country supplier of sweet peppers to the EU. Imports from
Israel increased very much in the last decade. Israel can supply peppers in winter and
most exports are shipped in the months between the main Spanish and Dutch seasons.
Israeli pepper imports to Slovenia and Italy increased in 2009 while imports to France
decreased: this is because the largest Israeli exporter shifted from harbor Marseille to
Koper in Slovenia. Parallel to the increase in imports from Israel, also competitors
developed off-season pepper exports to the EU (mainly Morocco, also imports from
Turkey increased, and there are small supplies of pepper from Jordan and Egypt).
SUPPLIERS to EU 1000 mt Euro/kg
2007 2008 2009 2007 2008 2009
Imports to EU27 (extra+intra) 1,023 1,074 1,117
EU27_EXTRA 202 218 225 2.44 1.07 1.04
ISRAEL 100 89 109 1.98 1.34 1.18
MOROCCO 41 50 50 1.31 1.22
TURKEY 38 51 39 0.95 0.69 0.75
MACEDONIA 11 15 10 0.23 0.24 0.27
JORDAN 1 4 6 0.86 0.76 0.65
EGYPT 5 5 4 1.50 1.21 1.19
Other extra 6 5 6
EU27_INTRA 821 856 892 1.71 1.56 1.30
Imports to FRANCE (extra+intra) 128 127 115
EU27_EXTRA 36 38 17 1.87 1.42 1.69
MOROCCO 13 17 15 1.22 1.57 1.73
ISRAEL 22 21 1 2.26 1.34 1.21
Other extra 0 1 0
EU27_INTRA 92 89 98 1.27 1.25 1.02

58
Sweet Pepper Imports to EU27
0
200,000
400,000
600,000
800,000
1,000,000
1,200,000
1999 2000 2001 2002 2003 2004 2005 2006 2007 2008 2009
mt
EU27_INTRA
Other extra
TURKEY
MOROCCO
ISRAEL
0.00
0.20
0.40
0.60
0.80
1.00
1.20
1.40
1.60
1.80
2.00
Eu
ro/m
t
EU Sweet Pepper Imports - UNIT VALUE
Import to EU from Israel
Import to EU from Morocco
Import to France from Morocco
Import to EU from Egypt
Import to EU from Turkey
Import to EU from Jordan
Most of the last decade, import unit values for Israeli pepper were higher than UVs
for other Extra-EU suppliers but in the last two years Israeli UVs declined and were
similar to average UVs for EU imports from Morocco and Egypt (see Graph above).
Average UVs for imports from Turkey and Jordan are substantially lower, probably
because of lower quality.
EU sweet pepper exports increased in the last decade. Netherlands and Spain supply
80-85% of EU exports. Dutch exports increased while Spanish imports are more or
less stagnant, despite the higher price of Dutch pepper. Exports to third countries are
very small, main markets are Russia, Switzerland and the US.

59
We consider Spanish pepper the most likely source of pepper supply from the EU to
Israel. An alternative supply source may be Turkey but we presume that Turkish
peppers are of substantial lower quality.
Import prices for PAM (average export unit values for Spanish pepper exports to
other EU markets 2007-09): 1.246 €/kg + marketing costs to Israel
EU27 Sweet Pepper Exports
0
200,000
400,000
600,000
800,000
1,000,000
1,200,000
1999 2000 2001 2002 2003 2004 2005 2006 2007 2008 2009
mt
Other EU to EU extra
Other EU to EU intra
Export NL to EU extra
Export NL to EU intra
Export Spain to EU extra
Export Spain to EU intra
EU Sweet Pepper Exports - UNIT VALUE
0.00
0.50
1.00
1.50
2.00
2.50
3.00
1999 2000 2001 2002 2003 2004 2005 2006 2007 2008 2009
Eu
ro/m
t
Export NL to EU extra
Export NL to EU intra
Export Spain to EU extra
Export Spain to EU intra
Export Italy to EU intra

60
New Potatoes (EU Imports)
According to the EU custom tariff, new potatoes are traded only in the months
January till June. EU countries imported one million mt of new potatoes in 2009,
about 40% from outside the EU. Imports increased substantially until 2007 but
declined in the last two years. Main import markets for new potatoes are Italy and the
UK (see tables and graphs).
EU EXPORT 2009 1000 mt Euro/kg Main Markets
SUPPLIERS Total EXTRA INTRA EXTRA INTRA
EU27 489 25 464 0.30 0.38 Ger. 174, NL 43, Belgium 36
Italy 118 2 116 0.33 0.40 Germany 83, Poland 7, NL 4
Spain 114 6 107 0.23 0.39 Germany 38, NL 17, UK 12
Cyprus 69 3 67 0.39 0.47 Greece 16, Germany 11, UK 10
Netherlands 54 7 48 0.27 0.24 Germany 16, Belgium 13
France 34 1 33 0.39 0.44 Germany 12, Belgium 8
Other 100 6 94
EU IMPORT 2009 1000 mt Euro/kg Main Extra-EU Suppliers
MARKETS Total EXTRA INTRA EXTRA INTRA
EU27 999 422 577 0.34 0.27 Isr. 211, Egypt 199, Morocco 9
Italy 148 113 35 0.37 0.17 Egypt 92, Israel 19
UK 121 82 39 0.36 0.39
Greece 80 70 10 0.29 0.27
Belgium 80 62 18 0.32 0.50
Netherlands 59 39 21 0.31 0.17 Israel 25, Egypt 11, Morocco 2
France 26 21 5 0.43 0.47 Israel 15, Morocco 6.5
Other 485 36 449
Main third country suppliers of new potatoes to the EU are Israel and Egypt.
Morocco, Tunisia and Turkey supply additional, much smaller quantities of new
potatoes. Imports of new potatoes from Israel increased until 2007 but somewhat
declined in the last two years to about 210,000 mt per year. Import quantities from
Egypt developed in a similar pattern. In the past, average EU import UVs of Egyptian
new potatoes were lower compared to UVs of Israeli new potatoes but in recent years
UVs are similar.
SUPPLIERS to EU 1000 mt Euro/kg
2007 2008 2009 2007 2008 2009
Imports to EU27 (extra+intra) 1,168 1,134 999
EU27_EXTRA 555 497 422 0.35 0.37 0.34
ISRAEL 260 207 211 0.37 0.36 0.33
EGYPT 238 223 199 0.33 0.35 0.35
MOROCCO 42 56 9 0.38 0.51 0.66
TUNISIA 8 9 3 0.39 0.39 0.41
TURKEY 6 1 0 0.25 0.44 0.22
Other extra 1 1 0
EU27_INTRA 613 637 577 0.37 0.30 0.27
Imports to ITALY (extra+intra) 0 0 0
EU27_EXTRA 111 117 113 0.32 0.32 0.37
EGYPT 107 109 92 0.32 0.32 0.37
ISRAEL 3 4 19 0.45 0.32 0.38
TUNISIA 1 3 1 0.39 0.40 0.41
Other extra 0 1 0
EU27_INTRA 37 32 35 0.30 0.21 0.17

61
New Potato Imports to EU27
0
200,000
400,000
600,000
800,000
1,000,000
1,200,000
1999 2000 2001 2002 2003 2004 2005 2006 2007 2008 2009
mt
EU27_INTRA
Other extra
MOROCCO
EGYPT
ISRAEL
EU New Potato Imports - UNIT VALUE
0.00
0.10
0.20
0.30
0.40
0.50
0.60
0.70
1999 2000 2001 2002 2003 2004 2005 2006 2007 2008 2009
Eu
ro/k
g
Import to EU from Israel
Import to EU from Egypt
Import to Italy from Egypt
Import to EU from Morocco
Import to EU from Turkey
Main suppliers of new tomatoes in the EU are Italy, Spain and Cyprus. Most exports
are supplied to other EU countries, and exports to third countries are very small.
Export UVs of main EU suppliers of new potatoes are higher than import UVs for
Israeli new potatoes, hence supplies from these countries to the Israeli market are
unlikely to be competitive (see graphs on next page). A relevant supplier of new
potatoes to the Israeli market might be Egypt.
Import price for PAM: 0.336 Euro/kg (Import UV of Egyptian new potatoes in
Italy, avg. 2007-09) minus price difference transportation to Israel

62
EU27 New Potato Exports
0
100,000
200,000
300,000
400,000
500,000
600,000
700,000
1999 2000 2001 2002 2003 2004 2005 2006 2007 2008 2009
mt
Other EU to EU extra
Other EU to EU intra
Export Cyprus to EU extra
Export Cyprus to EU intra
Export Spain to EU extra
Export Spain to EU intra
Export Italy to EU extra
Export Italy to EU intra
EU New Potato Exports - UNIT VALUE
0.00
0.10
0.20
0.30
0.40
0.50
0.60
1999 2000 2001 2002 2003 2004 2005 2006 2007 2008 2009
Eu
ro/k
g
Export Cyprus to EU intra
Export Spain to EU intra
Export Italy to EU intra

63
Old Potatoes (EU Exports and Imports)
EU "old potato" trade includes the trade of fresh and chilled potatoes, excluding new
potatoes, seed potatoes and potatoes for manufacture of starch. EU countries import
about 4.5 million mt of old potatoes per year, nearly all of them from other EU
countries.
EU EXPORT 2009 1000 mt Euro/kg Main Markets
SUPPLIERS Total EXTRA INTRA EXTRA INTRA
EU27 5,190 549 4,641 0.18 0.15 NL 1122, Spain 702, Belgium 594
France 1,804 18 1,786 0.35 0.15 Spain 622, Italy 314, Belgium 251
Germany 1,231 33 1,198 0.17 0.12
Netherlands 893 402 491 0.17 0.17 Belgium 199, Ger. 153, Russia 110
Belgium 627 15 612 0.21 0.11
Spain 159 9 150 0.26 0.22 Portugal 99, Germany 21
UK 126 6 120 0.47 0.33
Other 350 66 284
EU IMPORT 2009 1000 mt Euro/kg Main Extra-EU Suppliers
MARKETS Total EXTRA INTRA EXTRA INTRA
EU27 4,209 30.4 4,178 0.23 0.19 Israel 20, Turkey 9.5
UK 143 17.0 126 0.30 0.32
Bulgaria 17 9.3 8 0.06 0.16
Belgium 1,179 1.5 1,177 0.30 0.12
Italy 369 0.8 369 0.47 0.16
Spain 455 0.6 454 0.25 0.36
Other 2,046 1.1 2,045
Imports of old potatoes from third countries varied between 20,000 – 90,000 mt per
year and account for about 1% of total imports. In the last three years, most third
country imports of old potatoes were supplied by Israel and Turkey. The main market
for imports from Israel is the UK, while old potatoes from Turkey are mainly
imported by Bulgaria. Import values for Turkish potatoes are very low (0.10 – 0.14
€/kg) compared to Israeli supplies and also considerably lower than export UVs of EU
supplies. Probably Turkish supplies are of inferior quality and do not present an
alternative to domestically produced potatoes.

64
Old Potato Imports to EU27
0
500,000
1,000,000
1,500,000
2,000,000
2,500,000
3,000,000
3,500,000
4,000,000
4,500,000
5,000,000
1999 2000 2001 2002 2003 2004 2005 2006 2007 2008 2009
mt
EU27_INTRA
EU27_EXTRA
EU Old Potato Imports - UNIT VALUE
0.00
0.10
0.20
0.30
0.40
0.50
0.60
1999 2000 2001 2002 2003 2004 2005 2006 2007 2008 2009
Eu
ro/k
g
Import to EU from Israel
Import to EU from Turkey
Main EU suppliers of old potatoes are France, Germany and the Netherlands. The
graphs on the next page present the development of French and Dutch exports
(quantities and UVs). French exports increased substantially, despite higher UVs
compared to Dutch potatoes in most of the years. In the last two years French and
Dutch unit values are very similar, after exceptionally high unit values for French
potatoes in 2007. Our approximation of the import price for old potatoes to Israel is
based on the French UV in the last two years.
Import price for PAM: 0.166 Euro/kg (Export UV of French potatoes to other EU
countries, avg. 2008-09) + marketing cost to Israel

65
EU27 Old Potato Exports
0
1,000,000
2,000,000
3,000,000
4,000,000
5,000,000
6,000,000
1999 2000 2001 2002 2003 2004 2005 2006 2007 2008 2009
mt
Other EU to EU extra
Other EU to EU intra
Export NL to EU extra
Export NL to EU intra
Export France to EU extra
Export France to EU intra
EU Old Potato Exports - UNIT VALUE
0.00
0.05
0.10
0.15
0.20
0.25
0.30
1999 2000 2001 2002 2003 2004 2005 2006 2007 2008 2009
mt
Export NL to EU extra
Export NL to EU intra
Export France to EU intra

66
Sensitivity Analysis – Reference Prices
The following section examines two implicit assumptions of our analysis:
(a) We use as reference prices for fruit and vegetables the annual average price
at which produce can be imported to Israel. Because of the seasonal nature of
fruit and vegetable supplies it may be that reference prices in certain months
are lower. In this section we look at the seasonal pattern of selected reference
prices and investigate if reference prices are higher than domestic prices also
in low-price periods.
(b) We did not consider produce from the Palestinian territories as an
alternative source of supply because reliable price statistics are not available.
In this section we will compare Palestinian farmers' prices for four products
grown in the Westbank (tomatoes, potatoes, grapes, dates) with prices
obtained by Israeli farmers. Prices for Palestinian farmers are average prices in
2007 and 2008 (Source: Presentation El-Jafari, April 2010).
(a) Seasonal pattern of reference prices
We look at monthly unit values for tomatoes, pepper and strawberries exported from
Spain and for grapes exported from Italy (Graphs 1 – 4). Monthly prices for all four
crops are quite variable and show a seasonal pattern. Tomato prices are lower in
summer; pepper prices are relatively low in August – October; strawberries are scarce
in winter and obtain high prices in December – February; and prices for grapes from
Italy are relatively low in autumn when supply is high. Prices in specific months can
be considerably lower than the average annual price.
Table 1 presents reference import prices based on average unit values compared to
those based on months with especially low prices. Market price differentials
(domestic price – reference import price) were calculated based on two different
sources for domestic grower prices (Extension Service, CBS). Prices from both
sources are similar for tomatoes and pepper, while Extension Service prices are lower
for grapes and strawberries. Qualitative results for CBS data do not change when
calculations are based on low unit values: domestic grape and strawberry prices are
higher than alternative prices for imports (custom duties are effective), while domestic
prices are lower for tomatoes and peppers. For extension service data, the table grape
reference price based on low unit values is similar to the price for the higher priced
Thompson grape variety but higher than the price for the variety Redglobe. Domestic
prices are lower for the three additional crops, indicating that custom duties are
redundant.
Results indicate that during periods with low prices abroad grape imports to Israel are
feasible and, in the absence of barriers to import, can compete successfully with
Israeli grapes.

67
Graph 1
Unit Values - Tomato Exports Spain
0.0
0.2
0.4
0.6
0.8
1.0
1.2
1.4
1.6
Ja
n. 2007
Feb. 2007
Mar.
2007
Apr.
2007
May. 2007
Ju
n. 2007
Ju
l. 2
007
Aug. 2007
Sep. 2007
Oct. 2
007
No
v. 2007
De
c. 2007
Ja
n. 2008
Feb. 2008
Mar.
2008
Apr.
2008
May. 2008
Ju
n. 2008
Ju
l. 2
008
Aug. 2008
Sep. 2008
Oct. 2
008
No
v. 2008
De
c. 2008
Ja
n. 2009
Feb. 2009
Mar.
2009
Apr.
2009
May. 2009
Ju
n. 2009
Ju
l. 2
009
Aug. 2009
Sep. 2009
Oct. 2
009
No
v. 2009
De
c. 2009
Eu
ro/k
g
TOMATOES, FRESH OR CHILLED EU27_EXTRA
TOMATOES, FRESH OR CHILLED EU27_INTRA
avg-extra
avg-intra
Graph 2
Unit Values - Pepper Exports Spain
0.0
0.5
1.0
1.5
2.0
2.5
3.0
3.5
4.0
Ja
n. 2007
Feb. 2007
Mar.
2007
Apr.
2007
May. 2007
Ju
n. 2007
Ju
l. 2
007
Aug. 2007
Sep. 2007
Oct. 2
007
No
v. 2007
De
c. 2007
Ja
n. 2008
Feb. 2008
Mar.
2008
Apr.
2008
May. 2008
Ju
n. 2008
Ju
l. 2
008
Aug. 2008
Sep. 2008
Oct. 2
008
No
v. 2008
De
c. 2008
Ja
n. 2009
Feb. 2009
Mar.
2009
Apr.
2009
May. 2009
Ju
n. 2009
Ju
l. 2
009
Aug. 2009
Sep. 2009
Oct. 2
009
No
v. 2009
De
c. 2009
Eu
ro/k
g
FRESH OR CHILLED SWEET PEPPERS EU27_EXTRA
FRESH OR CHILLED SWEET PEPPERS EU27_INTRA
avg-extra
avg-intra

68
Graph 3
Unit Values - Strawberry Exports Spain
0.0
1.0
2.0
3.0
4.0
5.0
6.0
Ja
n. 2007
Feb. 2007
Mar.
2007
Apr.
2007
May. 2007
Ju
n. 2007
Ju
l. 2
007
Aug. 2007
Sep. 2007
Oct. 2
007
No
v. 2007
De
c. 2007
Ja
n. 2008
Feb. 2008
Mar.
2008
Apr.
2008
May. 2008
Ju
n. 2008
Ju
l. 2
008
Aug. 2008
Sep. 2008
Oct. 2
008
No
v. 2008
De
c. 2008
Ja
n. 2009
Feb. 2009
Mar.
2009
Apr.
2009
May. 2009
Ju
n. 2009
Ju
l. 2
009
Aug. 2009
Sep. 2009
Oct. 2
009
No
v. 2009
De
c. 2009
Eu
ro/k
g
FRESH STRAWBERRIES EU27_EXTRA
FRESH STRAWBERRIES EU27_INTRA
avg-extra
avg-intra
Graph 4
Unit Values - Table Grape Exports Italy
0.0
0.5
1.0
1.5
2.0
2.5
3.0
Ja
n. 2007
Feb. 2007
Mar.
2007
Apr.
2007
May. 2007
Ju
n. 2007
Ju
l. 2
007
Aug. 2007
Sep. 2007
Oct. 2
007
No
v. 2007
De
c. 2007
Ja
n. 2008
Feb. 2008
Mar.
2008
Apr.
2008
May. 2008
Ju
n. 2008
Ju
l. 2
008
Aug. 2008
Sep. 2008
Oct. 2
008
No
v. 2008
De
c. 2008
Ja
n. 2009
Feb. 2009
Mar.
2009
Apr.
2009
May. 2009
Ju
n. 2009
Ju
l. 2
009
Aug. 2009
Sep. 2009
Oct. 2
009
No
v. 2009
De
c. 2009
Eu
ro/k
g
FRESH TABLE GRAPES EU27_EXTRA
FRESH TABLE GRAPES EU27_INTRA
avg-extra
avg-intra

69
Table 1: Reference Import Prices based on Average and Low Unit Values
Desription of
selected UVUV in Euro/mt
Ref. price
grower's
level
Price
domestic
market (1)
Price
domestic
market (2)
MPD (1)
(acc. to
higher p)
MPD (2)
Average Unit
Values (2007-09)
Table grapes
Export UV Italy
(all exports) 1,115 6,518 5,000 / 3,500 7,181 -1,518 663
Tomatoes
Import UV for
Turkey in Bulgaria 780 5,193 3,000 / 2,600 2,694 -2,193 -2,499
Sweet pepper
Export UV Spain
(intra exports) 1,246 8,575 4,500 / 4,000 4,021 -4,075 -4,554
Strawberries
Export UV Spain
(all exports) 1,722 14,730 6,754 18,817 -7,976 4,087
Low Unit Values
Table grapes Export UV Italy 850 4,993 5,000 / 3,500 7,181 7 2,188
Tomatoes Export UV Spain 600 4,158 3,000 / 2,600 2,694 -1,158 -1,464
Sweet pepper Export UV Spain 700 5,433 4,500 / 4,000 4,021 -933 -1,412
Strawberries Export UV Spain 1,000 10,781 6,754 18,817 -4,027 8,036 Remarks: Price domestic market (1): Grower prices - Source: Extension Service, Ministry of Agriculture
Price domestic market (2): Grower prices at the entrance of the wholesale market, Source: CBS
MPD (1): Difference domestic price (Extension Service) and reference price at grower's level. For crops with several grower prices (for different varieties or growing methods) the calculation is based on
the higher price.
MPD (2): Difference domestic price (CBS) and reference price at grower's level.

70
(b) Supply of fruit and vegetables from the Westbank
To establish a reference price for imports from the Westbank we added marketing
costs to prices received by Westbank farmers in 2007-084. Prices presented in Table 2
indicate that Westbank farmers could supply tomatoes, potatoes, grapes and dates to
the Israeli market at competitive prices. Current trade and mobility barriers probably
add to marketing costs and protect Israeli farmers from low-cost Palestinian produce.
In addition, quality differences may account for part of the price difference.
Table 2: Market Price Differential for Imports from the Westbank
Grower price -
Westbank (Avg.
2007-08)
Transport +
additional
costs
Reference
price
grower's level
Price
domestic
market (1)
Price
domestic
market (2)
MPD (1)
(acc. to
lower p)
MPD (2)
Tomatoes 2,185 200 2,385 3,000 / 2,600 2,694 215 309
Potatoes 1,231 200 1,431 2,200 2,466 769 1,035
Grapes 2,711 200 2,911 5,000 / 3,500 7,181 589 4,270
Dates 3,430 200 3,630 9,500 9,277 5,870 5,647 Remarks:
Price domestic market (1): Grower prices - Source: Extension Service, Ministry of Agriculture
Price domestic market (2): Grower prices at the entrance of the wholesale market, Source: CBS
To conclude:
Average annual unit values employed for calculating import reference prices may
overestimate the competitiveness of domestic production compared to imports.
Nevertheless, an investigation of seasonal price patterns for tomatoes, peppers, grapes
and strawberries indicates that prices in the Israeli domestic market tend to be lower
than reference prices for imports even in months with high supply and relatively low
prices.
On the other hand, a decline in transaction costs for exports from the Westbank to
Israel is expected to increase the supply of some fruit and vegetables to Israel and will
probably cause a decrease in domestic prices. In addition, also Egypt and Jordan can
most likely supply some fruit and vegetables at competitive prices to Israel if
restrictions to trade are dismantled. Judging from the dramatic growth of grape
exports from Egypt to Europe it looks like Egypt could also be a promising supplier of
grapes to the Israeli market.
We hope to obtain reliable prices and estimates for transportation and other marketing
costs to Israel from the Palestinian, Egyptian and Jordanian partners in the regional
DANIDA project to update social prices employed in the PAM calculations for Israel
and investigate the prospect for regional trade.
4 Source grower prices: Eljafari (2010) – Presentation.
Transport costs are about 100 NIS per ton. We added another 100 NIS to account for additional
marketing expenses.

71
Appendix 2
Detailed PAM computations for scenario1 (base-case assumptions)
In our detailed analysis we denote alternatives with relevance to domestic consumption and varieties with relevance to exports with √ and
€, respectively.
Cherry Tomatoes עגבניות שרי
€ € √
Cherry tomatoes open field Cherry clusters greenhouse
Private prices pricesSocial Divergence Private prices Social prices Divergence
51,750 51,750 0 87,500 87,500 0 Revenues
Tradable Inputs 838 838 0 2,585 2,585 0 Land prep and machinery
780 780 0 2,000 2,000 0 Seedlings
5,283 5,283 0 5,190 5,190 0 Fertilizers
2,078 2,078 0 4,105 4,105 0 Pest control
9,000 9,000 0 10,675 10,675 0 Materials in harvest
17,979 17,979 0 24,556 24,556 0 Overall tradable inputs
Domestic Factors 1,485 4,125 -2,640 1,485 4,125 -2,640 Irrigation
34,828 41,444 -6,616 42,381 50,432 -8,051 Hired labor
3,132 3,132 0 7,830 7,830 0 Self employment
122 188 -66 134 207 -72 Insurance
1,782 1,782 0 1,841 1,841 0 Financing and other exp
1,430 1,787 -357 5,900 7,375 -1,475
42,779 52,459 -9,679 59,572 71,810 -12,238 Overall domestic factors
60,759 70,438 -9,679 84,127 96,365 -12,238 Overall Expenses
-9,009 -18,688 9,679 3,373 -8,865 12,238 Profits

72
Tomatoes עגבניות
√ €
Tomatoes greenhouse Tomatoes clusters greenhouse
Private prices Social prices Divergence
Private prices
Social prices Divergence
65,000 65,000 0 63,900 63,900 0 Revenues
Tradable Inputs 3,330 3,330 0 3,330 3,330 0 Land prep and machinery
1,600 1,600 0 1,600 1,600 0 Seedlings
5,040 5,040 0 4,930 4,930 0 Fertilizers
3,713 3,713 0 3,562 3,562 0 Pest control
5,250 5,250 0 8,829 8,829 0 Materials in harvest
18,933 18,933 0 22,251 22,251 0 Overall tradeable inputs
Domestic Factors 1,485 4,125 -2,640 1,620 4,500 -2,880 Irrigation
32,927 39,182 -6,255 29,470 35,069 -5,598 Hired labor
3,915 3,915 0 3,915 3,915 0 Self employment
33 50 -18 33 50 -18 Insurance
2,289 2,289 0 2,280 2,280 0 Financing and other exp
4,433 5,541 -1,108 4,433 5,541 -1,108
43,596 50,977 -7,381 40,131 46,855 -6,724 Overall domestic factors
62,529 69,910 -7,381 62,382 69,106 -6,724 Overall Expenses
2,471 -4,910 7,381 1,518 -5,206 6,724 Profits

73
Cucumbers מלפפון
√ √ €
Cucumbers 2 cycles Cucumbers 3 cycles
Private prices Social prices Divergence
Private prices Social prices Divergence
46,000 46,000 0 56,000 56,000 0 Revenues
Tradable Inputs 2,183 2,183 0 2,487 2,487 0 Land prep and machinery
3,600 3,600 0 5,400 5,400 0 Seedlings
1,510 1,510 0 2,452 2,452 0 Fertilizers
2,014 2,014 0 3,089 3,089 0 Pest control
2,300 2,300 0 2,800 2,800 0 Materials in harvest
11,607 11,607 0 16,228 16,228 0 Overall tradable inputs
Domestic Factors 1,620 4,500 -2,880 1,620 4,500 -2,880 Irrigation
11,718 13,944 -2,226 16,740 19,920 -3,180 Labor in
17,752 21,125 -3,372 21,579 25,679 -4,099 Labor in harvest
29,470 35,069 -5,598 38,319 45,599 -7,279 Hired labor
3,915 3,915 0 3,915 3,915 0 Self employment
356 548 -192 129 198 -69 Insurance
1,078 1,078 0 1,510 1,510 0 Financing and other exp
5,248 6,561 -1,312 5,248 6,561 -1,312
41,688 51,670 -9,982 50,742 62,283 -11,541 Overall domestic factors
53,295 63,277 -9,982 66,970 78,510 -11,541 Overall Expenses
-7,295 -17,277 9,982 -10,970 -22,510 11,541 Profits

74
Potatoes תפוחי אדמה
√ € €
Potatoes Fall Potatoes Spring
Private prices Social prices Divergence Private prices Social prices Divergence
6,300 5,950 350 11,000 8,500 2,500 Revenues
Tradable Inputs 440 440 0 440 440 0 Land prep and machinery
720 720 0 756 756 0 Seedlings
1,018 1,018 0 1,018 1,018 0 Fertilizers
746 746 0 848 848 0 Pest control
760 760 0 1,835 1,835 0 Materials in harvest
3,684 3,684 0 4,897 4,897 0 Overall tradable inputs
Domestic Factors 608 1,688 -1,080 810 2,250 -1,440 Irrigation
491 585 -93 653 777 -124 Hired labor
157 157 0 157 157 0 Self employment
81 124 -44 62 95 -33 Insurance
192 192 0 210 210 0 Financing and other exp
131 164 -33 291 364 -73
1,660 2,910 -1,250 2,183 3,853 -1,670 Overall domestic factors
5,344 6,594 -1,250 7,080 8,750 -1,670 Overall Expenses
956 -644 1,600 3,920 -250 -4,170 Profits

75
Melon מלון
√ €
Melon Galia, trellising, Nov-Jan Melon Charentais, Spring
Private prices Social prices Divergence
Private prices Social prices Divergence
32,400 32,400 0 27,125 27,125 0 Revenues
Tradable Inputs
2,464 2,464 0 2,180 2,180 0 Land prep and machinery
900 900 0 1,500 1,500 0 Seedlings
1,674 1,674 0 2,070 2,070 0 Fertilizers
1,989 1,989 0 1,372 1,372 0 Pest control
4,385 4,385 0 3,707 3,707 0 Materials in harvest
11,411 11,411 0 10,829 10,829 0 Overall tradable inputs
Domestic Factors 1,350 3,750 -2,400 945 2,625 -1,680 Irrigation
6,975 8,300 -1,325 7,812 9,296 -1,484 Labor in
7,037 8,373 -1,337 5,555 6,611 -1,055 Labor in harvest
14,012 16,673 -2,662 13,367 15,907 -2,539 Hired labor
3,132 3,132 0 3,915 3,915 0 Self employment
28 43 -15 18 27 -10 Insurance
741 741 0 760 760 0 Financing and other exp
2,251 2,813 -563 2,477 3,096 -619
21,513 27,152 -5,639 21,482 26,330 -4,848 Overall domestic factors
32,924 38,564 -5,639 32,311 37,159 -4,848 Overall Expenses
-524 -6,164 -8,039 -5,186 -10,034 -6,528 Profits

76
Melon (cont) מלון
€
Melon Galia, open field, July-Sep
Private prices Social prices Divergence
11,000 11,000 0 Revenues
Tradable Inputs 692 692 0 Land prep and machinery
1,260 1,260 0 Seedlings
732 732 0 Fertilizers
1,196 1,196 0 Pest control
2,172 2,172 0 Materials in harvest
6,052 6,052 0 Overall tradeable inputs
Domestic Factors 608 1,688 -1,080 Irrigation
1,535 1,826 -292 Labor in
2,963 3,526 -563 Labor in harvest
4,497 5,352 -854 Hired labor
783 783 0 Self employment
8 12 -4 Insurance
303 303 0 Financing and other exp
178 222 -44
6,376 8,359 -1,983 Overall domestic factors
12,428 14,411 -1,983 Overall Expenses
-1,428 -3,411 -3,063 Profits

77
Strawberries תות שדה
√ €
Private prices Social prices Divergence
58,556 58,556 0 Revenues
Tradable Inputs 2,135 2,135 0 Land prep and machinery
2,132 2,132 0 Seedlings
796 796 0 Fertilizers
2,382 2,382 0 Pest control
8,512 8,512 0 Materials in harvest
15,957 15,957 0 Overall tradable inputs
Domestic Factors 1,350 3,750 -2,400 Irrigation
43,988 52,344 -8,356 Hired labor
2,376 2,376 0 Self employment
561 863 -302 Insurance
1,365 1,365 0 Financing and other exp
1,328 1,660 -332
50,968 62,358 -11,390 Overall domestic factors
66,925 78,315 -11,390 Overall Expenses
-8,369 -19,759 11,390 Profits

78
Sweet Pepper פלפל
€ €
Pepper, Spanish trellising, greenhouse, Aug
Pepper, Dutch trellising, greenhouse, Apr
Private prices
Social prices Divergence
Private prices
Social prices Divergence
46,800 46,800 0 54,000 54,000 0 Revenues
Tradable Inputs
2,613 2,613 0 2,728 2,728 0 Land prep and machinery
4,550 4,550 0 4,290 4,290 0 Seedlings
4,628 4,628 0 3,574 3,574 0 Fertilizers
1,417 1,417 0 1,749 1,749 0 Pest control
3,816 3,816 0 2,400 2,400 0 Materials in harvest
100 100 0 0 0 0 Energy
17,125 17,125 0 14,741 14,741 0 Overall tradable inputs
Domestic Factors 2,025 5,625 -3,600 1,620 4,500 -2,880 Irrigation
15,439 18,372 -2,933 24,147 28,734 -4,587 Hired labor
3,915 3,915 0 3,915 3,915 0 Self employment
140 215 -75 357 550 -192 Insurance
1,626 1,626 0 1,453 1,453 0 Financing and other exp
6,733 8,416 -1,683 4,199 5,248 -1,050
29,878 38,169 -8,291 35,691 44,400 -8,709 Overall domestic factors
47,002 55,293 -8,291 50,432 59,141 -8,709 Overall Expenses
-202 -8,493 8,291 3,568 -5,141 8,709 Profits

79
Sweet Pepper (cond) פלפל√ €€
Pepper, Spanish trellising, greenhouse, Apr
Pepper, Dutch trellising, greenhouse, warm & cool, July
Private prices
Social prices Divergence
Private prices
Social prices Divergence
54,000 54,000 0 121,000 121,000 0 Revenues
Tradable Inputs 2,593 2,593 0 3,003 3,003 0 Land prep and machinery
4,550 4,550 0 4,550 4,550 0 Seedlings
3,574 3,574 0 6,788 6,788 0 Fertilizers
1,765 1,765 0 2,337 2,337 0 Pest control
2,400 2,400 0 8,096 8,096 0 Materials in harvest
0 0 0 44,000 44,000 0 Energy
14,882 14,882 0 68,774 68,774 0 Overall tradable inputs
Domestic Factors 1,620 4,500 -2,880 4,050 11,250 -7,200 Irrigation
18,567 22,094 -3,527 35,949 42,778 -6,829 Hired labor
3,915 3,915 0 3,915 3,915 0 Self employment
357 550 -192 255 393 -138 Insurance
1,222 1,222 0 4,253 4,253 0 Financing and other exp
4,199 5,248 -1,050 11,725 14,656 -2,931
29,880 37,529 -7,649 96,096 120,023 -23,927 Overall domestic factors
44,762 52,411 -7,649 164,871 188,797 -23,927 Overall Expenses
9,238 1,589 7,649 -43,871 -67,797 23,927 Profits

80
Medjool
Private prices
Social prices Divergence
11,110 10,041 1,069 Revenues Tradable Inputs
1,349 1,687 -337 Land prep and machinery 216 216 Seedlings
637 637 Fertilizers
291 291 Pest control
Materials in harvest
2,493 2,831 -337 Overall tradable inputs
Domestic Factors 1,578 4,382 -2,804 Irrigation
3,251 3,869 -618 Hired labor
525 525 Self employment
88 136 -47 Insurance
434 434 Financing and other exp
5,876 9,345 -3,470 Overall domestic factors
8,369 12,176 -3,807 Overall Expenses
2,741
-2,135 4,876
Profits

81
Table grapes Table grapes
Thompson Red globe
Private prices
Social prices Divergence Private prices
Social prices Divergence
13,165 13,165 Revenues 10,532 10,532 Revenues
Tradable Inputs Tradable Inputs
677 846 -169 Land prep and machinery 702 877 -175 Land prep and machinery
152 152 Seedlings 152 152 Seedlings
536 536 Fertilizers 536 536 Fertilizers
460 460 Pest control 460 460 Pest control
843 843 Materials in harvest 963 963 Materials in harvest
1,825 1,994 -169 Overall tradable inputs 2,813 2,989 -175 Overall tradable inputs
Domestic Factors Domestic Factors
405 1,125 -720 Irrigation 405 1,125 -720 Irrigation
8,237 9,802 -1,565 Hired Labor 4,669 5,556 -887 Hired Labor
371 371 Self employment 371 371 Self employment
515 793 -278 Insurance 515 793 -278 Insurance
654 654 Financing and other exp 468 468 Financing and other exp
10,182 12,744 -2,562 Overall domestic factors 6,428 8,312 -1,884 Overall domestic factors
12,007 14,739 -2,731 Overall Expenses 9,241 11,301 -2,060 Overall Expenses
1,157 -1,574 2,731 Profits 1,291 -769 2,060 Profits
82
Appendix 3
Estimation of Support to Agriculture: Comparison OECD - PAM
In 2010, Israel joined the OECD. Prior to accession, the OECD calculated support for
agriculture in Israel based on its standardized methodology. Total support for the
agricultural sector is expressed as Producer Support Estimate (PSE), defined as "the
annual monetary value of gross transfers from consumers and taxpayers to agricultural
producers, measured at the farm gate level, arising from policy measures that support
agriculture, regardless of their nature, objectives or impacts on farm production or
income. It includes market price support, budgetary payments and budget revenue
foregone, i.e. gross transfers from consumers and taxpayers to agricultural producers
arising from policy measures based on: current output, input use, area planted/animal
numbers/receipts/incomes (current, non-current), and non-commodity criteria." (OECD,
2010).
OECD estimates of total support for the agricultural sector in Israel are 4.0 billion NIS in
2006 and 2.9 billion NIS in 2007, accounting for 18 and 12 percent of the value of
production. Preliminary data for 2008 indicate an increase in support to 5.4 billion NIS
(21% of the value of production). Single Commodity Transfers account for close to 90%
of the PSE. Single commodity transfers arise from policies linked to the production of a
single commodity such that the producer must produce the designated commodity in
order to receive the payment. According to OECD estimates for Israel, the dominant form
of support to agriculture is Market Price Support (MPS), arising from policy measures
that create a gap between domestic market prices and border prices of a specific
agricultural commodity. MPS accounts for close to 80% of the PSE. Most of the support
is enjoyed by the livestock sector (poultry, beef, sheep, milk), while support estimated for
plant production and specifically fruit and vegetables is relatively minor.
OECD calculations include 9 fruit and vegetables, 4 of them are also included in PAM
calculations (tomatoes, pepper, potatoes and grapes). Similar to our estimation of "social
prices", the OECD establishes "reference prices" which are compared to prices received
by farmers. If producer prices are higher than reference prices (positive Market Price
Differential (MPD)) custom duties or other restrictions to imports are effective in
protecting the agricultural sector. A negative Market Price Differential may indicate that
the agricultural sector is taxed.
Our methodology for establishing reference prices and calculating MPDs is somewhat
different to the methodology employed by the OECD. Table 1 summarizes the
differences.

83
Table 1: Methodology for Calculating Market Price Differentials: Comparison
OECD - PAM
OECD Our calculation
Quality Homogenous Exports are of higher quality
Producer price Average price for all uses Price domestic market
Reference price Based on export unit values for
products exported by Israel
Based on EU unit values
Tomatoes Cherry tomatoes are included
with regular tomatoes
Separate calculations for
regular tomatoes and cherry
tomatoes
The main difference of our approach is the assumption that exported fruit and vegetables
are characterized by higher quality compared to the average quality marketed on the
domestic market. This assumption is supported by the fact that prices for exports are
substantially higher than prices for produce marketed domestically for most fruit and
vegetables included in our study. Fruit and vegetables from Israel are characterized by
relatively high production costs compared to suppliers of similar products like Egypt and
Morocco; therefore they compete in export markets based on high quality. In this case, it
is not appropriate to use Israeli export unit values as reference prices. In its place, we
base reference prices on EU unit values. In addition, we compare reference prices to
grower prices for the domestic market only, contrary to the OECD which uses average
grower prices for all destinations.
OECD data are available until 2008. Table 2 compares the MPD calculated by the OECD
and our calculations (based on CBS prices obtained in the domestic market) for the years
2007 and 2008.
Table 2: Methodology for Calculating Market Price Differentials: Comparison
OECD - PAM
2007 2008 2007 2008 2007 2008 2007 2008
OECD
Producer price 3,631 3,562 6,375 4,858 1,684 2,021 6,753 7,320
Reference price 8,190 7,106 6,835 6,054 1,180 1,615 9,436 6,627
Market price differential -4,559 -3,544 -459 -1,196 504 406 -2,683 693
Our Calculation for PAM
Producer price 2,532 2,688 3,587 3,879 2,254 2,520 6,279 7,441
Reference price 3,928 3,566 7,022 6,952 1,495 1,347 5,617 4,879
Market price differential -1,397 -878 -3,435 -3,073 759 1,174 662 2,562
Tomatoes Pepper Potatoes Grapes
Producer and reference prices used by the OECD are higher for tomatoes, pepper and
grapes and lower for potatoes. MPD's calculated by the OECD are negative for tomatoes
and peppers and positive for potatoes. For grapes, MPD's are negative most of the years
but positive in 2008. Despite substantial differences in the numbers, qualitative results for
MPD's are similar for OECD and PAM calculations. According to OECD methodology,
price gaps were set to zero for eight out of nine fruit and vegetables included in the PSE

84
calculations (the exception are bananas) because these products are exported by Israel,
and no export subsidies or other market price policies either supporting or taxing
producers have been identified. As a result, the "Producer Single Commodity Transfer"5
for these products is zero.
On-farm budgetary support which is not commodity specific (e.g. the support of
production factors) enters PSE calculations but is not allocated to specific crops. This
support totaled 650 million NIS in 2007 and 619 million NIS in 2008 (mainly water,
insurance and investment support). For simplification, we apportion on-farm budgetary
support according to the share of crops included in PAM calculations in the total
production value of agriculture (about 20%). According to this calculation, total support
for PAM crops amounts to 134 million NIS in 2007 and 113 million NIS in 2008 (2.8%
and 2.5% respectively of their value of production). This is much lower than support
calculated in the framework of the PAM analysis. OECD calculations do not quantify
support provided to the agricultural sector through the supply of foreign labor which
accounts for a substantial share of the PAM support estimate.
5 The annual monetary value of gross transfers from consumers and taxpayers to agricultural producers,
measured at the farm gate level, arising from policies linked to the production of a single commodity such
that the producer must produce the designated commodity in order to receive the payment.

85
References
Adesina A.A. and Coulibaly O.N. (1998) Policy and competitiveness of agroforestry
based technologies for maize production in Cameroon: an application of policy analysis
matrix. Agricultural Economics 19: 1–13
Eckstein, Z. et al. (2007). Committee Report on Policy Design – Foreign Workers.
Economic – Social Agenda 2008 - 2010. (Hebrew)
Fang, C. and Beghin, J. Food self-sufficiency, comparative advantage, and agricultural
trade: A policy analysis matrix for Chinese agriculture. Working Paper 99-WP223
(Ames: Iowa State University, 2000).
Israeli Ministry of Agriculture and Rural Development.
http://www.moag.gov.il/agri/Publication/default.htm (accessed 2010).
Kimhi, E. et al. (2009). Workers from Thailand in Agriculture – Position Paper of
Farmers with Regard to Central Issues and Possible Consequences of a Decline in
Allocation. Working Paper prepared for Agrexco, December 2009 (Hebrew)
Kydd J, Pearce R, Stockbridge M. 1997. The economic analysis of commodity systems:
extending the policy analysis matrix to account for environmental effects and transaction
costs. Agricultural Systems 55(2): 323–345.
Monke E.A. and Pearson S.R., The Policy Analysis Matrix for Agricultural
Development. In: Cornell University Press, Ithaca, NY (1989), p. 279.
Nelson, G.C., and M. Panggabean. "The Costs of Indonesian Sugar Policy: A Policy
Analysis Matrix Approach." Amer. J. Agr. Econ. 73(August 1991):703-12.
OECD (2010), OECD Review of Agricultural Policies: Israel 2010, OECD Publishing.
doi: 10.1787/9789264079397-en
Staal, S.J., Shapiro, B.I., 1994. The effects of recent price liberalization on Kenyan peri-
urban dairy. Food Policy 19 (6), 533-549.
WTO (2010), World tariff profiles 2009, WTO publications. Also available at
http://www.wto.org/english/res_e/booksp_e/tariff_profiles09_e.pdf
Yao, S., 1997. Comparative advantages and crop diversification: a policy analysis matrix
for Thai agriculture. Journal of Agricultural Economics 48, pp. 211–222.