policies for renewable heat - international energy · pdf filerenewable heat creates fewer...
TRANSCRIPT
The views expressed in this IEA Insights paper do not necessarily reflect the views or policy of the International Energy Agency (IEA) Secretariat or of its individual member countries. This paper is a work in progress and/or is produced in parallel with or contributing to other IEA work or formal publication; comments are welcome, directed to [email protected].
© OECD/IEA, 2012
©OEC
D/IEA
2012
Policies for renewable heat
An integrated approach
Milou Beerepoot
Ada Marmion

INTERNATIONAL ENERGY AGENCY
The International Energy Agency (IEA), an autonomous agency, was established in November 1974. Its primary mandate was – and is – two-fold: to promote energy security amongst its member countries through collective response to physical disruptions in oil supply, and provide authoritative
research and analysis on ways to ensure reliable, affordable and clean energy for its 28 member countries and beyond. The IEA carries out a comprehensive programme of energy co-operation among its member countries, each of which is obliged to hold oil stocks equivalent to 90 days of its net imports. The Agency’s aims include the following objectives:
n Secure member countries’ access to reliable and ample supplies of all forms of energy; in particular, through maintaining effective emergency response capabilities in case of oil supply disruptions.
n Promote sustainable energy policies that spur economic growth and environmental protection in a global context – particularly in terms of reducing greenhouse-gas emissions that contribute to climate change.
n Improve transparency of international markets through collection and analysis of energy data.
n Support global collaboration on energy technology to secure future energy supplies and mitigate their environmental impact, including through improved energy
efficiency and development and deployment of low-carbon technologies.
n Find solutions to global energy challenges through engagement and dialogue with non-member countries, industry, international
organisations and other stakeholders. IEA member countries:
Australia Austria
Belgium Canada
Czech RepublicDenmark
Finland France
GermanyGreece
HungaryIreland
ItalyJapan
Korea (Republic of)LuxembourgNetherlandsNew Zealand NorwayPolandPortugalSlovak RepublicSpainSwedenSwitzerland
TurkeyUnited Kingdom
United States
The European Commission also participates in
the work of the IEA.
© OECD/IEA, 2012International Energy Agency
9 rue de la Fédération 75739 Paris Cedex 15, France
www.iea.org
Please note that this publication is subject to specific restrictions that limit its use and distribution.
The terms and conditions are available online at http://www.iea.org/termsandconditionsuseandcopyright/

© OECD/IEA 2012 Policies for renewable heat An integrated approach
Page | 1
Table of Contents Acknowledgements .......................................................................................................................... 4
Executive Summary .......................................................................................................................... 5
Introduction ...................................................................................................................................... 8
Background ................................................................................................................................ 8
Heat matters ..................................................................................................................................... 9
The relevance of heat in total final energy use ......................................................................... 9
Renewable energy technologies for heat ................................................................................ 10
Bioenergy ......................................................................................................................... 11
Solar energy ..................................................................................................................... 11
Geothermal energy .......................................................................................................... 11
Ambient energy ............................................................................................................... 11
Renewable electricity for heat ......................................................................................... 12
The integration of heat in national energy strategies ............................................................. 12
Challenges for renewable heat ...................................................................................................... 14
Characteristics of the heat sector ............................................................................................ 14
Investor climate ............................................................................................................... 14
Market infrastructure ...................................................................................................... 15
Strong climate influence .................................................................................................. 15
Numerous heat sector situations .................................................................................... 15
Even more challenges with renewable technologies .............................................................. 16
Renewable heat production needs local demand ........................................................... 16
Renewable heat and energy efficiency: competition and synergy .................................. 17
Time and temperature affect heat supply ....................................................................... 17
Cost competitiveness of renewable heat technologies .......................................................... 18
Case studies ............................................................................................................................. 19
Towards an integrated policy approach for renewable heat ........................................................ 21
The integrated policy approach and journey .......................................................................... 21
Global trends in RES H‐policies ................................................................................................ 22
Policy tools and government strategies .................................................................................. 25
RD&D policies .................................................................................................................. 25
Fiscal policies ................................................................................................................... 26
Pricing policies ................................................................................................................. 26
Quantitative policies ........................................................................................................ 27
Current RES‐H policies in each phase of the journey: case studies .............................................. 29
R&D and D for geothermal deployment: American and Icelandic pathways .......................... 29
Inception of solar thermal in Tunisia ....................................................................................... 30
Biomass heat take‐off in Austria ............................................................................................. 31
Policies for renewable heat © OECD/IEA 2012
An integrated approach
Page | 2
Renewable heat consolidation in carbon taxed Sweden and obliged Israel ........................... 32
Principles and next steps for policy makers .................................................................................. 34
Policy principles ....................................................................................................................... 34
Additional challenges for policy makers .................................................................................. 35
In the RD&D phase ........................................................................................................... 35
In the inception phase ..................................................................................................... 35
In the take‐off phase ........................................................................................................ 35
In the consolidation phase ............................................................................................... 36
Conclusions and next steps ............................................................................................................ 37
Acronyms, abbreviations and units of measure ............................................................................ 40
Annexes ........................................................................................................................................... 41
Annex 1: Comparison of renewable technologies: status, scale, global production and costs41
Annex 2: Cost of heat and electricity technologies ................................................................. 42
Annex 3: The S‐curve approach ............................................................................................... 43
Annex 4: Direct and indirect renewable heat policies over time ............................................ 44
References ...................................................................................................................................... 46
List of Figures
Figure 1 • Final energy consumption by energy service, 2009 (World left, OECD right) .................. 9 Figure 2 • Fuel mix in final energy consumption for heat, 2009 (World left, OECD right) ............. 10 Figure 3 • Final energy for heat by end use sector, 2009 (World left, OECD right) ........................ 10 Figure 4 • Denmark energy policy strategy .................................................................................... 13 Figure 5 • Fragmented nature of the heat market ......................................................................... 16 Figure 6 • Range in recent levelised cost of energy for selected renewable energy technologies 19 Figure 7 • Case studies: contexts of Denmark and South Africa .................................................... 20 Figure 8 • Policy journey: main policy instruments over time ........................................................ 21 Figure 9• Development of RES‐H policies over time ...................................................................... 24 Figure 10 • EU Member States RES‐H generation targets by 2020 ................................................ 25 Figure 11 • RES‐H policies and case studies analysed .................................................................... 29 Figure 12 • Policy evolution and market deployment of solar water heaters in Tunisia ............... 30 Figure 13 • Energy prices in Sweden for various customer categories, 2009 ................................ 32 Figure 14 • Technology push versus market pull instruments ....................................................... 34 Figure 15 • General policy principles for renewable energy technologies ..................................... 37 Figure 16 • Cost of heat and electricity technologies as included in the Dutch SDE+ scheme ...... 42 Figure 17 • S‐curve approach .......................................................................................................... 43 Figure 18 • Renewable heat policies (direct or indirect) from 1973 to 2011 ................................. 45
List of Tables
Table 1 • Challenges specific to the heat sector ............................................................................... 5 Table 2 • Challenges specific to the renewable heat sector ............................................................. 5 Table 3 • Suitability of renewable energy resources to meet various categories and scales of
heating and cooling applications ..................................................................................... 18 Table 4 • Comparison of renewable technologies: status, scale, global production and costs ..... 41

© OECD/IEA 2012 Policies for renewable heat An integrated approach
Page | 3
List of Boxes
Box 1 • Where is “heat” in energy statistics? ................................................................................... 9 Box 2 • Competitiveness of renewable heat technologies in the 2012 SDE+ ................................ 27 Box 3 • Energy efficiency schemes affect renewable heat deployment ........................................ 28 Box 4 • Technology neutral policy in support of renewable heat .................................................. 32

Policies for renewable heat © OECD/IEA 2012
An integrated approach
Page | 4
Acknowledgements This report was written by Milou Beerepoot and Ada Marmion, from the IEA Renewable Energy Division (RED). The authors would like to thank Didier Houssin, Paolo Frankl, Cedric Philibert, Simon Mueller and Yamina Saheb from the IEA for their constructive input. The authors also acknowledge the invaluable insights provided by Lex Bosselaar (NL Agency) and Dustin Benton (Green Alliance) who commented on the report.
Cheryl Haines from the Communication and Information Office and Peter Chambers edited the report, and Angela Gosmann co‐ordinated its production.
Questions and comments are welcome and should be sent to: [email protected]

© OECD/IEA 2012 Policies for renewable heat An integrated approach
Page | 5
Executive Summary The production of heat is responsible for a large share of final energy demand. In 2009, heat accounted for 47% of total energy used worldwide. Expanding the use of modern biomass, geothermal energy, solar energy and ambient energy to produce heat could contribute substantially to meeting energy security objectives and mitigating climate change.
In its publications, Deploying Renewables, Principles for Effective Policies (IEA, 2008) and Deploying Renewables, Best and Future Policy Practice (IEA, 2011c), the IEA discusses the “integrated policy approach,” whereby renewable energy technologies require different support policies at different stages of their maturity pathways (see also Annex 3).
This paper discusses how the integrated policy approach applies to renewable heat. It attempts to provide guidance for policy‐makers on renewable heat throughout the different phases of the policy lifecycle, allowing for the specific challenges of renewable heat and needs of the many stakeholders involved. Stimulating a market for heat involves challenges that are different and, often, more difficult to overcome than in the electricity and transport sectors.
A number of key challenges to renewable heat may deter deployment, some associated with the overall characteristics of the heat sector, and some specific to the introduction of renewable options. Tables 1 and 2 below outline a number of specific challenges to the heat and renewable heat sectors.
Table 1 • Challenges specific to the heat sector
Investor climate:
Fragmented market: variety of stakeholders
Fragmented finance: millions of investors
Diverging investment decision criteria and “split-incentive” problem
Market infrastructure:
Gatekeepers between supply and demand
Suppliers of fuels as liable parties
Existing heat infrastructure influences potential alternatives
Strong climate influence:
Space heating demand in OECD declining, cooling demand in non-OECD increasing
Table 2 • Challenges specific to the renewable heat sector
To meet local demand, renewable heat production should be geographically close
Renewable heat supply is variable in time
Heat demand is variable over time (both diurnally and seasonally)
Heat is a heterogeneous commodity: different temperature levels per application
There is a need for a combination of technology push and market pull as a technology progresses towards maturity.
In the RD&D phase, renewable heat technologies do not seem to be particularly different from other renewable energy technologies in terms of innovation and technology development needs. In this phase, no additional policy principles are needed for renewable heat.

Policies for renewable heat © OECD/IEA 2012
An integrated approach
Page | 6
In the inception phase, it is important to design market pull instruments that appeal to the variety of investors in the heat market, each with different investment criteria (chapter 3) (Figure 15). Also, a renewable heat strategy will need a careful match of supply and demand, as natural resources will vary considerably from one country to another. The technical training and know‐how of “gatekeepers” such as installers and architects, and an efficient market infrastructure (manufacturers and supply chain) become important at this stage.
In the take‐off phase, the priority is to maintain or accelerate market growth while managing overall policy costs and removing non‐economic barriers. In the renewable heat sector, the most important challenge is to introduce policy support schemes that do not overburden government budgets, to avoid stop‐and‐go policies (Figure 15). Renewable heat policy design should ensure predictable and reliable investment conditions, either from private finance or policy support outside the government budget. Also, non‐economic barriers must be addressed, e.g. micro‐finance in the building sector and the “split‐incentive” problem in both building and industrial sectors.
Eventually during the consolidation phase, renewable heat technologies will face fewer challenges than other renewable energy sectors, such as renewable electricity (Figure 15). The visual environmental impact of geothermal, solar thermal and biomass technologies is low and the local production and demand of heat often encourages public acceptance. Moreover, renewable heat creates fewer integration challenges in large‐scale deployment than renewable electricity.
On the basis of the findings in this study, the following key findings have been identified:
The heat market comprises two end‐use sectors: building and industry. Renewable heat policy design for end‐use sectors may have more in common with “energy efficiency” policy design than with renewable electricity policies.
Renewable heat investment often competes with energy efficiency investment. Moreover, renewable heat policy should address energy efficiency in order to avoid over‐subsidisation.
Only a small part of the heat market shows resemblance with the electricity market: district heating. Here, successful policies based on support on the basis of output may be a good strategy.
On the basis of the findings in this study, the following key actions have been identified:
The characteristics and specific challenges of the (renewable) heat market require greater attention to the design of renewable heat policies.
General principles for the design of renewable policy support (as discussed in IEA, 2011c) should be taken into account in renewable heat policies.
Renewable heat policy design needs additional attention in the inception and take‐off phases.
More attention is needed for differentiation of renewable heat policies along different renewable heat sectors:
Feed‐in‐tariffs or renewable heat portfolio standards may be considered for commercial heat, which shows metering and grid similarities with the electricity sector.
Subsidies and tax incentives may be useful approaches for renewable heat technologies in end‐use sectors, which do not have metering or a heat grid.

© OECD/IEA 2012 Policies for renewable heat An integrated approach
Page | 7
Support and facilitation for new business models that address financing and up‐front investment barriers is needed, to facilitate investment in renewable heat technologies, particularly in the building sector.
It is recommended that governments should seek options to make economic incentive schemes independent of annual government budget appropriations, e.g. by means of levies to fossil fuel consumption. This would avoid the “stop‐and‐go” policies experienced in the past for renewable heat technologies in end‐use sectors.
The heterogeneity of the heat sector, with its great variety of stakeholders, climate conditions and heat infrastructures, requires customised approaches to renewable heat policy based on local market conditions.

Policies for renewable heat © OECD/IEA 2012
An integrated approach
Page | 8
Introduction Efforts to constrain growth in GHG emissions and concerns over security of supply of fossil fuels have recently led to increased world attention on renewable electricity and renewable transport fuels. Renewable heat has received less attention in the past, perhaps partly because of the specific constraints that make it a less straightforward development than renewable electricity. However, governments are increasingly introducing policy frameworks to support renewable heat technologies.
Background
A number of studies have looked into renewable heat policies, mainly focusing on the European situation and usually taking a policy‐specific angle, e.g., the European “RES‐H policy” project.1 The RES‐H project helped EU member states to design and implement renewable heat strategies to meet their 20/20/20 targets and follow up the requirements as stipulated in the EU Directive 2009. Six member states received support in drafting their National Renewable Energy Action Plan (NREAP) and calculating their renewable heat targets.2 The project produced a qualitative and quantitative assessment of main policy instruments available to support renewable energies (feed‐in tariffs, grants, tax exemptions). It concluded that the policies in place would often fail to achieve the very ambitious targets for renewable heat set by some of these countries. The research urged Member states to implement innovative approaches including multiple technologies at different scales to produce various amounts of heat.34
An IEA publication dedicated to renewable heating and cooling reviewed different types of policies (sticks, carrots, guidance) (IEA, 2007). Other IEA publications developed a “policy journey” approach to policy support for renewable technologies that are still under development. This analysis has been mainly applied to renewable electricity, less so to renewable heat (IEA 2008; IEA 2011c).
The present analysis builds on the findings of earlier studies and advances the RES‐H policy discussion by focusing on which policy instruments should be introduced, when and how, in implementing renewable heating technologies. It also gives details of current renewable heat policies in use worldwide.
This analysis attempts to provide guidance on policy‐making for renewable heat in the different phases of the policy journey, while bearing in mind the specific challenges of renewable heat and the needs of the numerous stakeholders involved. The paper discusses the design of an integrated policy framework for renewable heat policy in light of the IEA approach (IEA, 2008; IEA, 2011c) and reviews the challenges in addressing uncompetitive technologies. It should thereby give useful input to the discussion about policy support for renewable heat and future visions for the heat sector.
This paper is the first phase of a detailed study into renewable heating and cooling, covering the market status and outlook for renewable heating and cooling, and the costs of renewable heating and cooling technologies. The study will pay attention to issues such as electrification of heat and the benefits of an integrated approach to heat and electricity.
1 http://www.res‐h‐policy.eu/
2 Greece, Lithuania, Austria, Netherlands, Poland and the United Kingdom.
3 http://www.res‐h‐policy.eu/RES‐H%20Policy_2011‐June_factsheet.pdf.
4 Policy makers are also advised to show better integration with energy efficiency policy, e.g., in the Energy Performance of Buildings directive (EPBD), CHP and Industrial waste regulations.
© OECD/IEA 2012 Policies for renewable heat An integrated approach
Page | 9
Heat matters
The relevance of heat in total final energy use
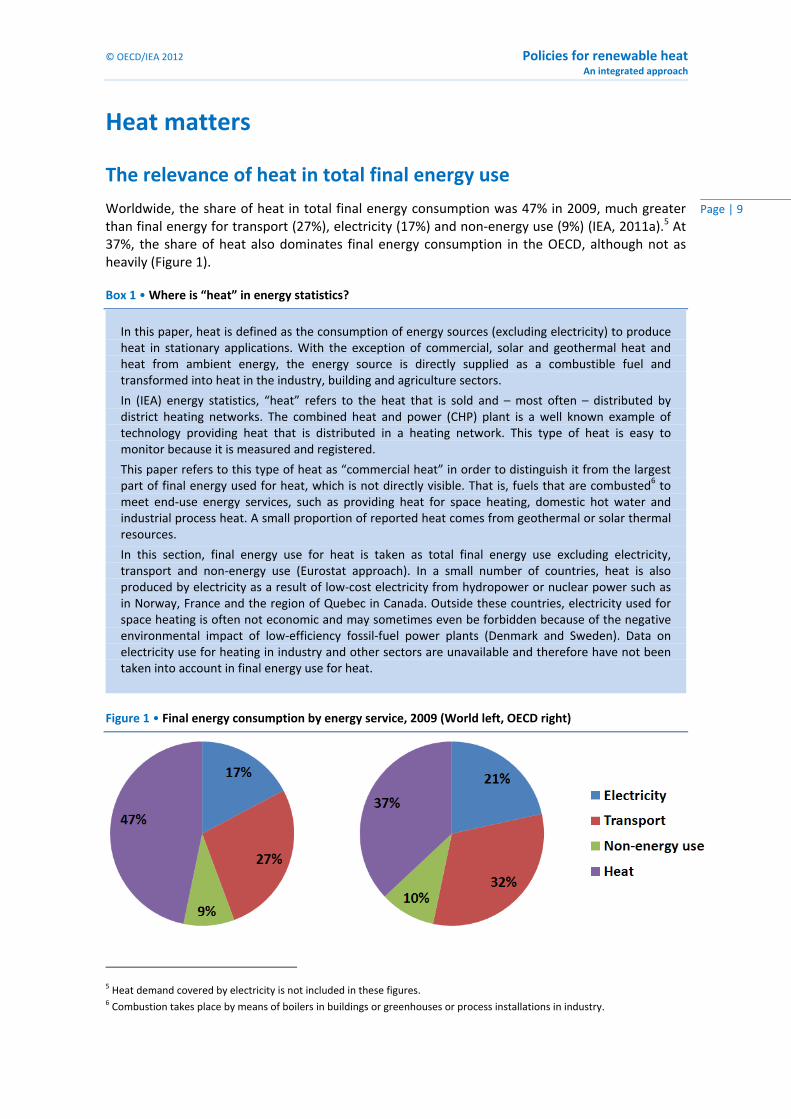
Worldwide, the share of heat in total final energy consumption was 47% in 2009, much greater than final energy for transport (27%), electricity (17%) and non‐energy use (9%) (IEA, 2011a).5 At 37%, the share of heat also dominates final energy consumption in the OECD, although not as heavily (Figure 1).
Box 1 • Where is “heat” in energy statistics?
Figure 1 • Final energy consumption by energy service, 2009 (World left, OECD right)
5 Heat demand covered by electricity is not included in these figures. 6 Combustion takes place by means of boilers in buildings or greenhouses or process installations in industry.
In this paper, heat is defined as the consumption of energy sources (excluding electricity) to produce heat in stationary applications. With the exception of commercial, solar and geothermal heat and heat from ambient energy, the energy source is directly supplied as a combustible fuel and transformed into heat in the industry, building and agriculture sectors.
In (IEA) energy statistics, “heat” refers to the heat that is sold and – most often – distributed by district heating networks. The combined heat and power (CHP) plant is a well known example of technology providing heat that is distributed in a heating network. This type of heat is easy to monitor because it is measured and registered.
This paper refers to this type of heat as “commercial heat” in order to distinguish it from the largest part of final energy used for heat, which is not directly visible. That is, fuels that are combusted6 to meet end‐use energy services, such as providing heat for space heating, domestic hot water and industrial process heat. A small proportion of reported heat comes from geothermal or solar thermal resources.
In this section, final energy use for heat is taken as total final energy use excluding electricity, transport and non‐energy use (Eurostat approach). In a small number of countries, heat is also produced by electricity as a result of low‐cost electricity from hydropower or nuclear power such as in Norway, France and the region of Quebec in Canada. Outside these countries, electricity used for space heating is often not economic and may sometimes even be forbidden because of the negative environmental impact of low‐efficiency fossil‐fuel power plants (Denmark and Sweden). Data on electricity use for heating in industry and other sectors are unavailable and therefore have not been taken into account in final energy use for heat.
Policies for renewable heat © OECD/IEA 2012
An integrated approach
Page | 10
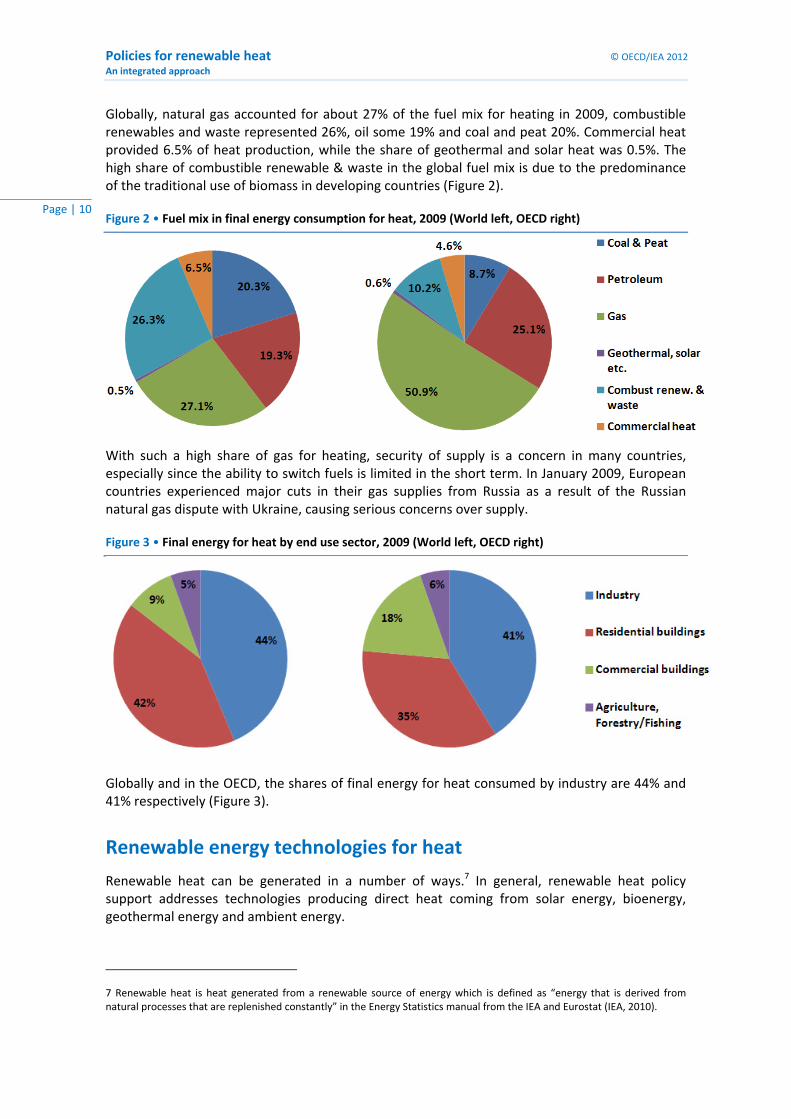
Globally, natural gas accounted for about 27% of the fuel mix for heating in 2009, combustible renewables and waste represented 26%, oil some 19% and coal and peat 20%. Commercial heat provided 6.5% of heat production, while the share of geothermal and solar heat was 0.5%. The high share of combustible renewable & waste in the global fuel mix is due to the predominance of the traditional use of biomass in developing countries (Figure 2).
Figure 2 • Fuel mix in final energy consumption for heat, 2009 (World left, OECD right)
With such a high share of gas for heating, security of supply is a concern in many countries, especially since the ability to switch fuels is limited in the short term. In January 2009, European countries experienced major cuts in their gas supplies from Russia as a result of the Russian natural gas dispute with Ukraine, causing serious concerns over supply.
Figure 3 • Final energy for heat by end use sector, 2009 (World left, OECD right)
Globally and in the OECD, the shares of final energy for heat consumed by industry are 44% and 41% respectively (Figure 3).
Renewable energy technologies for heat
Renewable heat can be generated in a number of ways.7 In general, renewable heat policy support addresses technologies producing direct heat coming from solar energy, bioenergy, geothermal energy and ambient energy.
7 Renewable heat is heat generated from a renewable source of energy which is defined as “energy that is derived from natural processes that are replenished constantly” in the Energy Statistics manual from the IEA and Eurostat (IEA, 2010).
© OECD/IEA 2012 Policies for renewable heat An integrated approach
Page | 11
Bioenergy
Modern biomass combustion to produce heat is a mature technology and often competitive with fossil fuels (IEA, 2007). Modern on‐site biomass technologies include efficient wood burning stoves, municipal solid waste (MSW) incineration, pellet boilers and biogas. Biomass is also used in CHP production; overall conversion efficiencies can reach 70% to 90%. Sweden is the largest consumer of wood and wood waste for district heating, followed by Finland and the United States (IEA, 2011b). Denmark, Germany and Sweden are the largest users of MSW for district heating (IEA, 2011b).
Biogas originating from manure, sewage sludge, landfill and organic waste can be upgraded to biomethane and injected into a gas grid as a sustainable replacement for natural gas. Injection can take place in the national high‐pressure gas grid or a local low‐pressure gas distribution network. When injected in a natural gas grid, biogas needs to be upgraded to a higher methane content (which involves removing impurities and drying) in order to make the biogas compatible with natural gas.
Solar energy
Solar thermal collectors produce heat derived from solar radiation by heating a fluid circulated within the collector. Solar thermal panels producing low‐temperature heat (less than 80°C) are a competitive technology. By the end of 2009, worldwide installed solar thermal (low‐ and medium‐temperature) capacity totalled 172.4 GWth (Weiss and Mauthner, 2011). The vast majority of this capacity was in China (101.5 GWth), followed by Europe (32.5 GWth) and OECD North America (15 GWth). It is mainly used to produce domestic hot water in buildings. In a handful of countries, such as Germany, Austria and Switzerland, solar collectors also contribute to space heating. Despite a high potential for solar thermal in industry, which requires vast amounts of low temperature heat, that sector has seen little development of solar hot water systems (IEA, 2011d).
Low‐concentrating and high‐concentrating technologies can deliver medium‐ and high‐temperature solar heat, e.g., for use in industrial processes. Rooftop solar thermal panels producing medium‐temperature heat (up to 150°C) such as compound parabolic concentrator (CPC) collectors are still in the early stages of development, although some are available on the market.8 High‐concentrating solar thermal technologies can generate temperatures high enough to produce electricity, and can also be used in (process) heat applications (IEA, 2011d).
Geothermal energy
Direct‐use geothermal applications use the heat that is stored in rock and trapped in vapour or liquids. It includes mature technologies to provide heat for industrial processes, space conditioning, district networks, swimming pools, greenhouses and aquaculture ponds. OECD countries using geothermal for district heating include Germany, Austria, Denmark, Hungary, Slovakia and Belgium (Lund, 2010).
Ambient energy
Heat pumps provide a highly efficient means of cooling, space and water heating (IEA, 2010a). They upgrade low‐temperature heat, available in ambient energy sources (air, water or ground),
8 The CPC collector is a low‐concentrating technology that can bridge the gap between the lower‐temperature solar application field of flat‐plate collectors (a temperature of less than 80°C) and the much higher temperature applications of high concentrating technologies (temperature above 200°C).

Policies for renewable heat © OECD/IEA 2012
An integrated approach
Page | 12
to higher‐temperature heat that can be used for low‐temperature heating systems (e.g., water temperatures of up to 45°C for under‐floor heating). Because heat pumps are most commonly powered by electricity, their energy output has a renewable energy component (the ambient energy source) and a more mixed component (from the electricity requirements).9
Aquifer or underground thermal energy storage (UTES) uses a natural underground layer (e.g., a sand, sandstone, or chalk layer) as a temporary storage medium for heat or cold.10 Most applications store winter “cold” (low temperature) to be used for the cooling of large office buildings and industrial processes.11
Renewable electricity for heat
Using renewable electricity to fuel e.g., a heat pump, would qualify as renewable heat. There are few cases today of 100% renewable electricity production; most systems comprise a combination of renewable and conventional electricity.
The integration of heat in national energy strategies
Policies aimed at increasing the share of renewable heat in the national energy mix are only part of a bigger picture. This paper not only stresses the specific challenges for renewable heat deployment, but also aims at integrating heat policies into a combination of tools across sectors to achieve efficient decarbonisation of economies at least cost. Previous IEA work has stressed the need for a policy package that applies CO2 abatement action broadly across sectors and encourages technology diffusion while coping with market and cost uncertainties and securing public acceptance (Hoods, 2011).
Such a “policy mix” can be achieved through the combination of:
Energy efficiency standards.
A carbon price.
Technology policies over the transition period.
The order in which each policy type is to be implemented varies according to a country’s energy and economic structures, existing policy frameworks and sustainability ambition. Rationalisation of energy demand should usually come before fuel substitution strategies.12
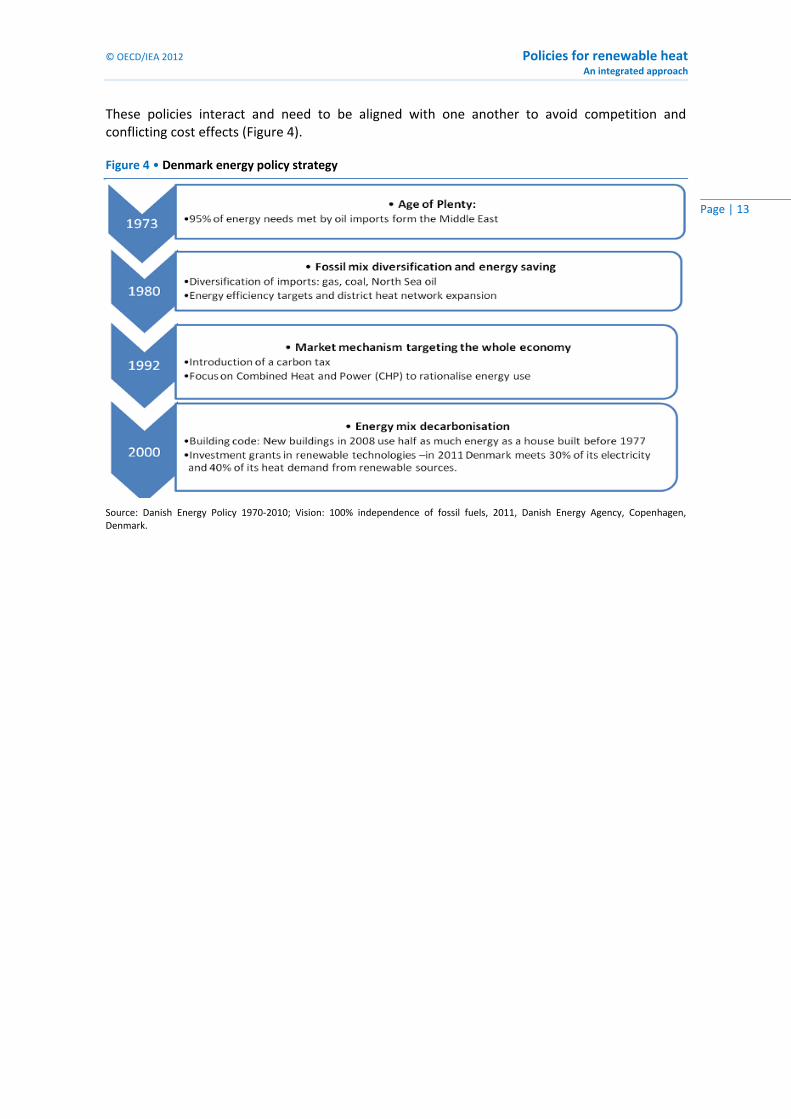
The Danish policy mix is a good example of how different policy types have been prioritised over time, building on each other’s results. Positive outcomes of such a combination include:
The decarbonisation of the entire economy.
An improved policy cost‐effectiveness.
A decrease in the overall cost implied by the decarbonisation process.
9 Heat pumps are not included in IEA renewable energy statistics. Energy from geothermal, aerothermal or hydrothermal sources that is upgraded with heat pumps is included as renewable heat within the EU legislation for renewable energy. The contribution is accounted for in the monitoring only if the COP is high enough (COP >2.62), to compensate for the energy lost in the electricity production (EC, 2009).
10 The transfer of thermal energy is realised by extracting groundwater from the underground layer and re‐injecting it at the modified temperature level at a separate location nearby.
11 A major condition for the application of this technology is the availability of a suitable geological formation. Other technologies for underground thermal energy storage are borehole, cavern and pit storage.
12 Policies affect the energy sector in different ways, as the application of a CO2 tax will have an immediate and profound effect on energy strategies while research and development or technology deployment will have longer‐term cost reduction effects.
© OECD/IEA 2012 Policies for renewable heat An integrated approach
Page | 13
These policies interact and need to be aligned with one another to avoid competition and conflicting cost effects (Figure 4).
Figure 4 • Denmark energy policy strategy
Source: Danish Energy Policy 1970‐2010; Vision: 100% independence of fossil fuels, 2011, Danish Energy Agency, Copenhagen, Denmark.

Policies for renewable heat © OECD/IEA 2012
An integrated approach
Page | 14
Challenges for renewable heat
Characteristics of the heat sector
A number of key challenges to renewable heat may deter its deployment. Some are associated with the overall characteristics of the heat sector, others are specific to the introduction of renewable options:
The investor climate is fragmented: variety of stakeholders, millions of investors.
The heat market is very heterogeneous: “gatekeepers”, fuel suppliers, complex heat infrastructures.
Regional climate conditions play an important role
Investor climate
Fragmented market and investors
Target groups that (renewable) heat policies need to address include all stakeholders producing heat, i.e. industries, district heating operators and millions of building owners,. Building owners include commercial real estate developers as well as social housing associations, private households and tenants,13 each with very different motivations affecting decisions on investing in low carbon technology.
When comparing the investor climate in the heat market with that in electricity, a clear difference appears:
The electricity sector design is dominated by centralised large‐scale power supply facilities.
The heat sector mainly consists of distributed heat generation. A limited number of cold climate countries have chosen (semi‐)centralised heat production by means of combined heat and power (CHP) plants and distribution of so‐called “commercial heat” in district heating systems.
Diverging investment criteria and split incentives
Private households’ investment decision criteria for heating technology often differ from commercial ones:
Private households use simple payback to assess whether or not to implement an energy measure; they tend to take a "safe" approach investing in those measures with paybacks of typically two to five years.14
For most commercial investors, rates of 8% to 10% are acceptable in OECD economies.
Also, split incentives occur when participants in an economic exchange have different goals or incentives (IEA, 2007). A classic example is the ”landlord‐tenant problem”, where the landlord provides the tenant with a heating system but the tenant is responsible for paying the energy bills. In this case, landlords and tenants face different goals:
13 In the privately‐owned part of the building sector, implementation of restrictive heat policies can be sensitive since these would directly affect individuals’ comfort and may provoke concerns about fuel poverty.
14 An investment in an energy technology with a payback period of two to five years corresponds with a 15% to 45% rate of return for a lifetime of 20 years, roughly equivalent to the return expected by a high risk investor.

© OECD/IEA 2012 Policies for renewable heat An integrated approach
Page | 15
The landlord wants to minimise the capital cost of the appliance (with little regard to energy efficiency).
The tenant wants to maximise the energy efficiency of the appliance to save on energy costs.
Market infrastructure
Gatekeepers and suppliers of heating fuels as liable parties
Decisions on investment in low carbon heating technologies can also be complicated by the numerous participants involved in applying heating technology.
Gatekeepers (installers, architects, engineering consultants, contractors or, in the existing building sector, housing associations) are in a position of power as they can influence the client’s decisions. If they have a specific incentive to include renewable technologies, e.g. investment grants, they can support deployment substantially. If gatekeepers have no incentive to apply renewable technology, e.g. where the installer will also be responsible for maintenance, they may deter deployment.
Because heat is mainly produced in individual domestic systems without a country‐wide transmission and distribution network, power relations between renewable and traditional fuel suppliers are very different from the corresponding relationship in the electricity sector (Bürger et al., 2008).
Incumbent heat system can cause lock‐in effect
The competitiveness of renewable heating technologies is influenced by two main variables:
The price competition with fossil fuel prices used in conventional heating systems.
The type of energy infrastructure system in place.15 For instance, countries with an extensive gas infrastructure or high dependence on oil might face more difficulties in moving towards renewable heat – although they might need it most.
Strong climate influence
Even though nearly half of global final energy demand for heat is consumed in industry (Figure 3), the other half is subject to a strong climate influence:
Cold climate countries face high final energy demand for space heating.
Warm climate countries show rising cooling demand as GDPs attain levels where ownership of air conditioning systems becomes within reach of many people.
Space heating is generally considered not to be correlated with income, since it is an essential demand to be fulfilled, although there is concern for fuel poverty in some regions where people restrict their space heating expenses due to financial constraints. However, cooling is generally to be considered a latent demand that is only fulfilled once there is sufficient capital.
Numerous heat sector situations
The combination of specific characteristics in the heat market, determined by climate conditions, the incumbent heat infrastructure and different types of investors, results in numerous possible
15 A country with an extensive gas infrastructure will have a strong industry, which will be able to invest in improving gas technology in order to meet new (building) standards. The success of heat policies in the past (Austria, Sweden) might correlate with the absence of extensive (gas) infrastructures. On the other hand, an extensive gas grid infrastructure might offer opportunities to use the grid for sustainable alternatives, e.g. distribution of biogas.
Policies for renewable heat © OECD/IEA 2012
An integrated approach
Page | 16
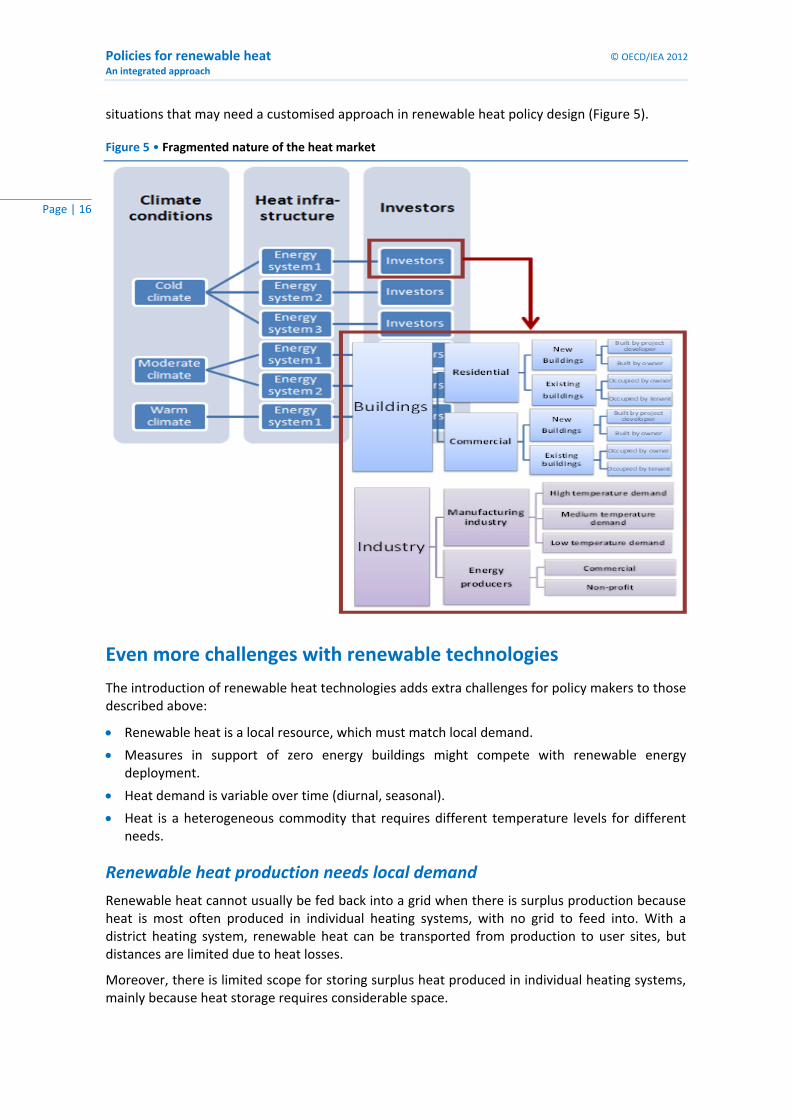
situations that may need a customised approach in renewable heat policy design (Figure 5).
Figure 5 • Fragmented nature of the heat market
Even more challenges with renewable technologies
The introduction of renewable heat technologies adds extra challenges for policy makers to those described above:
Renewable heat is a local resource, which must match local demand.
Measures in support of zero energy buildings might compete with renewable energy deployment.
Heat demand is variable over time (diurnal, seasonal).
Heat is a heterogeneous commodity that requires different temperature levels for different needs.
Renewable heat production needs local demand
Renewable heat cannot usually be fed back into a grid when there is surplus production because heat is most often produced in individual heating systems, with no grid to feed into. With a district heating system, renewable heat can be transported from production to user sites, but distances are limited due to heat losses.
Moreover, there is limited scope for storing surplus heat produced in individual heating systems, mainly because heat storage requires considerable space.

© OECD/IEA 2012 Policies for renewable heat An integrated approach
Page | 17
Renewable heat and energy efficiency: competition and synergy
Renewable heat supply may, to some extent, compete with developments in zero‐energy buildings.16 Very high levels of insulation, usage of passive solar energy and balanced ventilation systems with heat recovery could reduce demand for space heating to the point where zero‐energy buildings might not need a heating system at all. Buildings with very low residual heat demand might meet this with electric heat pumps, e.g. in combination with PV panels, and end up with all‐electric systems.
Investors in energy efficiency can be largely the same as investors in renewable heat technology: building owners and the industry sector. This may lead to competition between energy efficiency and renewable heat in investment decisions.
On the other hand, there is a possible synergy between energy efficiency and renewable energy as lower heat demand might make renewable heat more affordable. For example, energy efficient buildings might deploy solar heat with compact thermochemical energy storage that could otherwise be too expensive.
Time and temperature affect heat supply
Heat demand and production can vary over time
It is not only space heating demand that varies according to the weather:
Solar thermal heat will most commonly be produced when heating demand is low and so is best suited to supply of domestic hot water, when compact seasonal storage is unavailable or unaffordable.17
Heat pump technology can show some seasonal constraints, depending on the (renewable) energy source used. A heat pump boiler working on outside air will show lower coefficients of performance (COP)18 in wintertime, when outside air temperatures are low and the temperature lift between the outside air and the inside space heating requirements is large.
(Renewable) heat is a heterogeneous commodity
Whereas electricity is a homogeneous energy carrier, heat demand shows different temperature levels per application (Table 3):
Hydraulic space heating traditionally requires water temperatures of 90⁰C but today, low temperature heating systems, e.g. for use in underfloor heating systems, need only 45⁰C water temperature.
Domestic hot water usually needs a temperature of around 60⁰C.
16 In EU member states, the Energy Performance of Buildings Directive requires regulations for new buildings to progress towards zero‐energy buildings (EC, 2010).
17 Seasonal storage is currently being developed mostly for district or block heating systems, where more space is available and thus costs are lower. Improved technology for compact seasonal thermal storage, expected to be commercially viable between 2020 and 2030, may allow more solar energy to be captured in summer and stored for use in winter.
18 Heat pumps using surface water as their renewable energy source can also face seasonal temperature differences affecting the heat pump COP. Ground source heat pumps are generally not affected by seasonal temperature differences, nor are deep geothermal heat and heat from bioenergy.
Policies for renewable heat © OECD/IEA 2012
An integrated approach
Page | 18
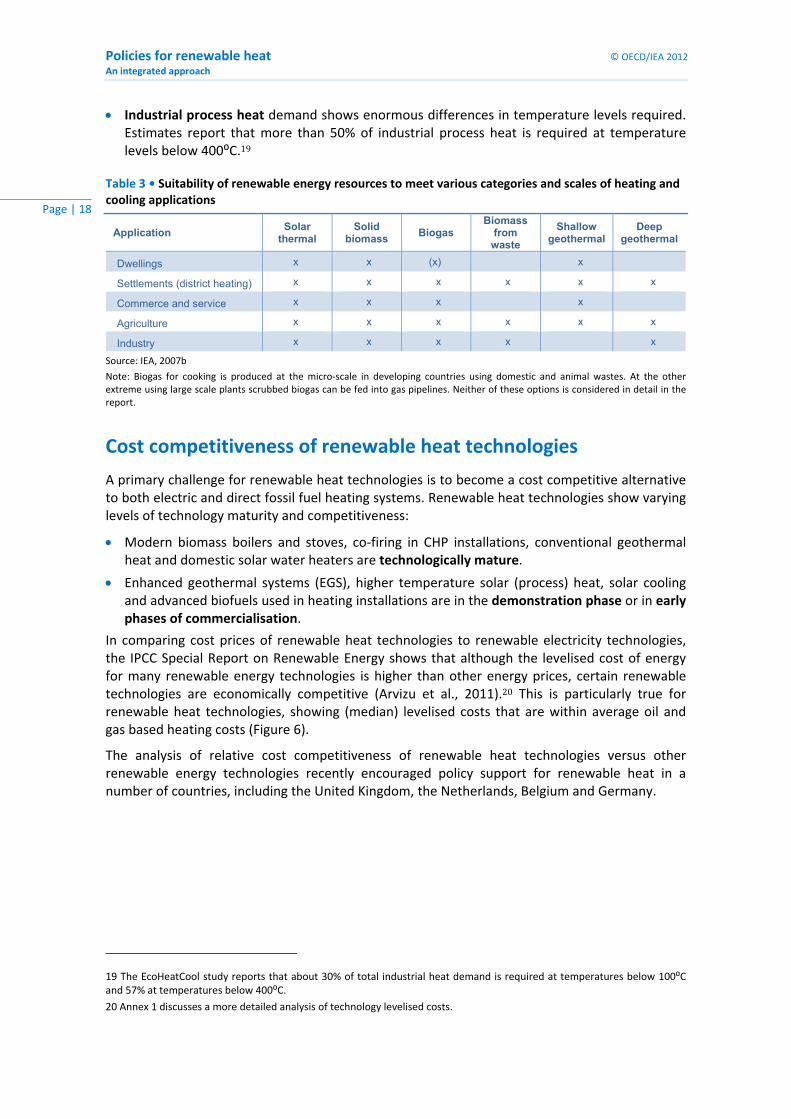
Industrial process heat demand shows enormous differences in temperature levels required. Estimates report that more than 50% of industrial process heat is required at temperature levels below 400⁰C.19
Table 3 • Suitability of renewable energy resources to meet various categories and scales of heating and cooling applications
Application Solar
thermal Solid
biomass Biogas
Biomass from
waste
Shallow geothermal
Deep geothermal
Dwellings x x (x) x
Settlements (district heating) x x x x x x
Commerce and service x x x x
Agriculture x x x x x x
Industry x x x x x
Source: IEA, 2007b
Note: Biogas for cooking is produced at the micro‐scale in developing countries using domestic and animal wastes. At the other extreme using large scale plants scrubbed biogas can be fed into gas pipelines. Neither of these options is considered in detail in the report.
Cost competitiveness of renewable heat technologies
A primary challenge for renewable heat technologies is to become a cost competitive alternative to both electric and direct fossil fuel heating systems. Renewable heat technologies show varying levels of technology maturity and competitiveness:
Modern biomass boilers and stoves, co‐firing in CHP installations, conventional geothermal heat and domestic solar water heaters are technologically mature.
Enhanced geothermal systems (EGS), higher temperature solar (process) heat, solar cooling and advanced biofuels used in heating installations are in the demonstration phase or in early phases of commercialisation.
In comparing cost prices of renewable heat technologies to renewable electricity technologies, the IPCC Special Report on Renewable Energy shows that although the levelised cost of energy for many renewable energy technologies is higher than other energy prices, certain renewable technologies are economically competitive (Arvizu et al., 2011).20 This is particularly true for renewable heat technologies, showing (median) levelised costs that are within average oil and gas based heating costs (Figure 6).
The analysis of relative cost competitiveness of renewable heat technologies versus other renewable energy technologies recently encouraged policy support for renewable heat in a number of countries, including the United Kingdom, the Netherlands, Belgium and Germany.
19 The EcoHeatCool study reports that about 30% of total industrial heat demand is required at temperatures below 100⁰C and 57% at temperatures below 400⁰C.
20 Annex 1 discusses a more detailed analysis of technology levelised costs.

© OECD/IEA 2012 Policies for renewable heat An integrated approach
Page | 19
Figure 6 • Range in recent levelised cost of energy for selected renewable energy technologies
Source: Arvizu et al., 2011
Case studies
Countries have adopted different strategies to meet the challenges and characteristics of the heating sector in introducing renewable technologies, as the examples of Denmark and South Africa show (Figure 7).
In Denmark, space heating demand is high and mainly met through district heating in urban areas. The combination of extensive district heating networks and high use of wind‐generated electricity has proven to create synergy:
When electricity prices are at medium or low levels in winter, heat pumps are put to use for the district heating network.
When electricity prices are low due to high wind electricity outputs in summer, a combination of technologies – solar hot water and heat pumps – is used.
Variable wind energy can – under certain circumstances ‐ become a profitable market for district heating operators because, when electricity prices fall below a certain threshold, gas fuelled CHPs for district heating systems are turned off and heat is produced by electric heat pumps at very affordable prices to be sold to district heating system users at average price levels.

Policies for renewable heat © OECD/IEA 2012
An integrated approach
Page | 20
Figure 7 • Case studies: contexts of Denmark and South Africa
In South Africa, where space heating demand hardly exists, domestic hot water is increasingly leading to peaks in electricity demands. To avoid power shortages at peak hours due to the overwhelming reliance on electrical water heaters, of which there were 4.2 million in 2010, the South African government launched the Solar Water Heating Programme, which aims to install 1 million solar heaters by 2013.21
21 Solar Water Heating Programme is a rebate programme for solar water heater purchasers supported by ESKOM and funded by a tariff levied on consumer electricity bills fixed by NERSA (National Energy Regulator of South Africa).
Example Denmark: Combine extensive district heat system with wind penetration
Example South Africa: Avoid peak electricity consumption
from hot water boilers

© OECD/IEA 2012 Policies for renewable heat An integrated approach
Page | 21
Towards an integrated policy approach for renewable heat
The integrated policy approach and journey
Over the past few years the IEA has developed and promoted an integrated approach to policy support for renewable technologies, emphasising that different policies are required at different phases of the technology maturity pathway, following the S‐curve theory (Figure 8, see also Annex 4) (IEA 2008, 2011c).
Figure 8 • Policy journey: main policy instruments over time
TimeRD&D Inception Mass Deployment Consolidation
Prototype and demonstration
High cost gap technologies
Low cost gap technologies
Mature technologies
Market de
ploymen
t
3: Transition to techno‐logy neutral and declining
support
4: Address market barriers for long term consolidation1: R&D
finance andinfrastructure planning
2: Stable and technology‐specific incentives
capital grants, investment support for RD&D and information campaigns
Feed‐in tariffs, tax credits, loan guarantees
Green certificates, RPS, CO2 tax
Building codes, Obligation of use, non economic barriers
Source: IEA analysis based on: IEA, 2008 and IEA, 2011c
Policy instruments used during each phase of the journey would respond to different drivers, and meet specific needs.
In the research, development and deployment phase, policies focus on:
The level of natural resource endowment.
The assessment of resource accessibility.
The technical barriers for technology deployment.
And the economic risk related to technology demonstration.
Because the cost‐gap relative to conventional technologies is in this phase still very high, policies need to attract investment for the technology to successfully demonstrate. RD&D funding is then expected to flow from private parties and required during the rest of the Policy Journey to support high quality products and innovation.
Policies for renewable heat © OECD/IEA 2012
An integrated approach
Page | 22
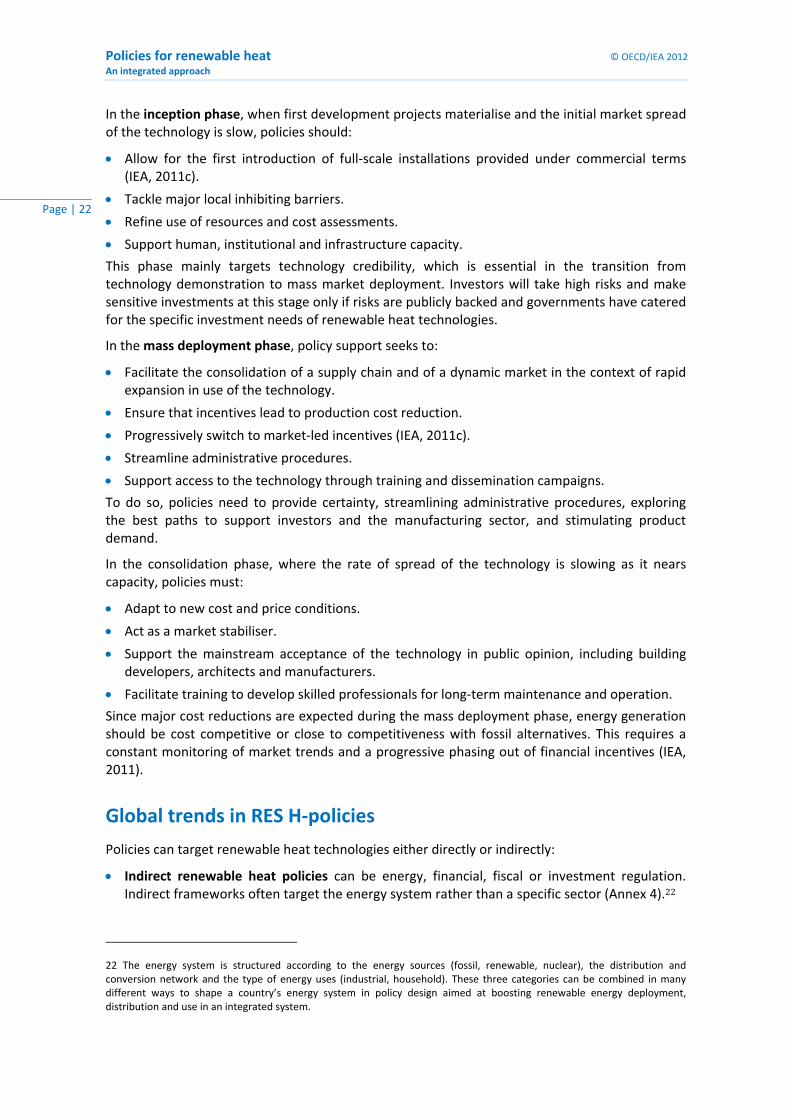
In the inception phase, when first development projects materialise and the initial market spread of the technology is slow, policies should:
Allow for the first introduction of full‐scale installations provided under commercial terms (IEA, 2011c).
Tackle major local inhibiting barriers.
Refine use of resources and cost assessments.
Support human, institutional and infrastructure capacity.
This phase mainly targets technology credibility, which is essential in the transition from technology demonstration to mass market deployment. Investors will take high risks and make sensitive investments at this stage only if risks are publicly backed and governments have catered for the specific investment needs of renewable heat technologies.
In the mass deployment phase, policy support seeks to:
Facilitate the consolidation of a supply chain and of a dynamic market in the context of rapid expansion in use of the technology.
Ensure that incentives lead to production cost reduction.
Progressively switch to market‐led incentives (IEA, 2011c).
Streamline administrative procedures.
Support access to the technology through training and dissemination campaigns.
To do so, policies need to provide certainty, streamlining administrative procedures, exploring the best paths to support investors and the manufacturing sector, and stimulating product demand.
In the consolidation phase, where the rate of spread of the technology is slowing as it nears capacity, policies must:
Adapt to new cost and price conditions.
Act as a market stabiliser.
Support the mainstream acceptance of the technology in public opinion, including building developers, architects and manufacturers.
Facilitate training to develop skilled professionals for long‐term maintenance and operation.
Since major cost reductions are expected during the mass deployment phase, energy generation should be cost competitive or close to competitiveness with fossil alternatives. This requires a constant monitoring of market trends and a progressive phasing out of financial incentives (IEA, 2011).
Global trends in RES H‐policies
Policies can target renewable heat technologies either directly or indirectly:
Indirect renewable heat policies can be energy, financial, fiscal or investment regulation. Indirect frameworks often target the energy system rather than a specific sector (Annex 4).22
22 The energy system is structured according to the energy sources (fossil, renewable, nuclear), the distribution and conversion network and the type of energy uses (industrial, household). These three categories can be combined in many different ways to shape a country’s energy system in policy design aimed at boosting renewable energy deployment, distribution and use in an integrated system.

© OECD/IEA 2012 Policies for renewable heat An integrated approach
Page | 23
Direct policies primarily address the specifics of the renewable heat sector to diversify the heat mix.
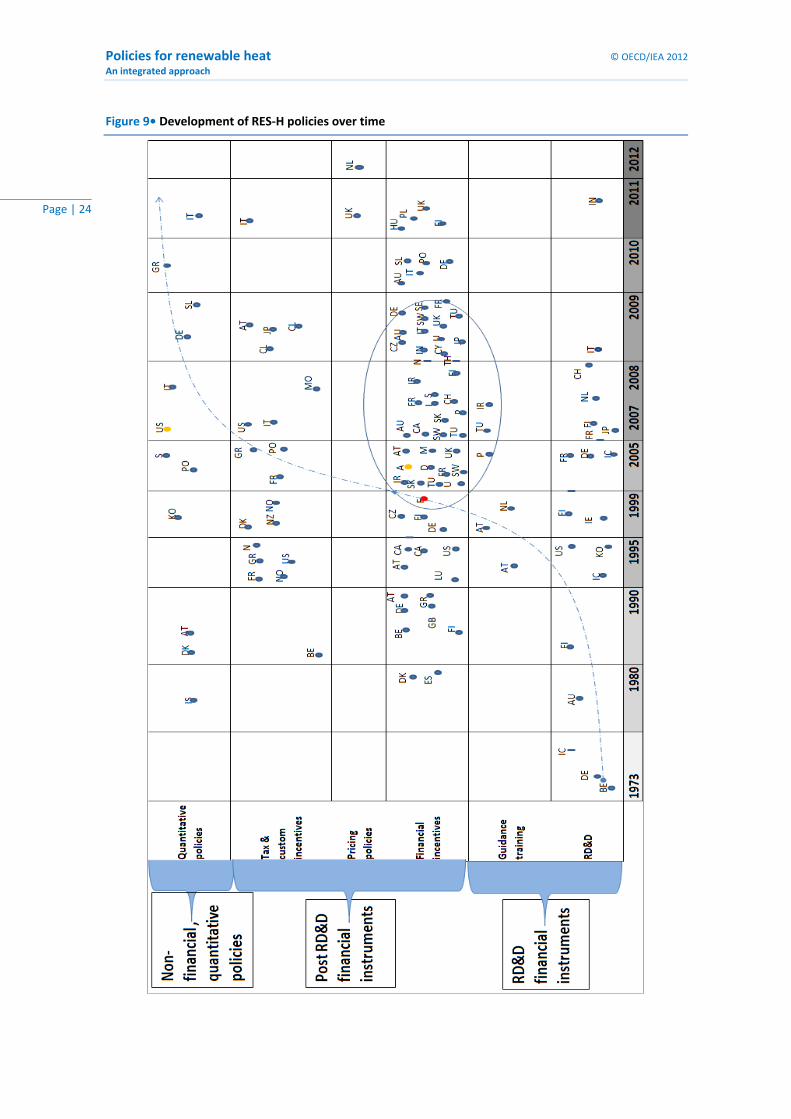
To analyse the trends in policy design, the main direct policies worldwide have been plotted since 1973 against the different types of policy instruments available (Figure 9).
Policies for renewable heat © OECD/IEA 2012
An integrated approach
Page | 24
Figure 9• Development of RES‐H policies over time

© OECD/IEA 2012 Policies for renewable heat An integrated approach
Page | 25
The overview shows the rapid increase in number of renewable heat specific policies since 2005:
In OECD countries, the recent interest in renewable heat policies is most likely to have been stimulated by Directive 2009/28/EC on the Promotion of the Use of Energy from Renewable Sources.23 Since the heat sector dominates the final energy balance (see Figure 10), renewable heat will be a very important contributor to meeting the 2020 renewable energy targets.
In non‐OECD countries such as India, South Africa and Tunisia, several policies have targeted solar thermal deployment.
Figure 10 • EU Member States RES‐H generation targets by 2020
0%
10%
20%
30%
40%
50%
60%
70%
RES‐H 2005
RES‐H 2020
Source: IEA analysis of EU Member States RE Action Plans 2010.
Policy tools and government strategies
Over the years, governments have relied on different types of instrument to support renewable heat, which fall under four main categories:
RD&D policies: Exploration and demonstration grants, resource assessment.
Fiscal policies: Tax exemption, reduction, carbon tax.
Pricing policies: Feed‐in tariffs, CHP feed‐in premiums.
Quantitative policies: obligations, certification schemes with minimum quotas and building procurements.
RD&D policies
As shown in Figure 9, there is a decline in number of RD&D policies. This is to a large extent explained by the fact that R&D policies often encompass renewables in general, but also shows a declining interest in RD&D public programmes over time, mainly because:
Several technologies have reached technical maturity and economic competitiveness.
23 http://eur‐lex.europa.eu/LexUriServ/LexUriServ.do?uri=OJ:L:2009:140:0016:0062:en:PDF

Policies for renewable heat © OECD/IEA 2012
An integrated approach
Page | 26
Governments tend to downplay the role of innovation and the need for continual development of a technology.
However, governments in some countries (e.g. Italy, Japan and more recently India) have long term strategies for advanced heat technologies, and have continuing research support frameworks either to restore a collapsed market (Japan), or to upgrade one that is taking off (India).
Fiscal policies
Governments have often relied on tax incentives to improve the cost‐competitiveness of RES‐H technologies against fossil‐based solutions. Tax incentives have different impacts on the commercial and residential sectors:
Tax reductions or exemptions in the manufacturing sector set free a budget for manufacturers and installers that can then be re‐invested. They have proved efficient in supporting the development of a supply chain and consolidating installation markets.
In the residential sector, tax breaks have been less appealing than direct rebate or cash grants, as they affect household budgets at least a year later (IEA, 2007). Also, tax reduction and exemption would only benefit taxable households, therefore excluding low‐income households that might face greater need for cheaper, more energy efficient and accessible renewable heat.
Because they are budget‐dependent, it appears that fiscal instruments should be limited to the first two phases of the journey to build up technology competitiveness.
Pricing policies
Pricing policies are still rare in the heating sector. While many electricity feed‐in tariffs (FITs) include a premium for combined heat and power to remunerate useful heat output, only a few countries have tariff policies dedicated to renewable heat generation.
Two main challenges make it very complicated to remunerate renewable heat production under a FIT scheme:
Tariff beneficiaries in the heat sector comprise millions of (building) owners.
Obliged parties consist of the producers and importers of heating fuels (gas and oil).
A feed‐in tariff for renewable heat exists in the United Kingdom. Launched in March 2011, the Renewable Heat Incentive (RHI) seeks to increase the share of renewable heat from 1% to 12% of total heat generation by 2020. In designing such a framework, British policy makers faced several challenges:
Numerous heat producers.
Different stakeholders and investors.
The absence of a district heating network to transport surplus production.
Problematic accounting for direct use.
High cost of heat metering in small‐scale applications.
To leave some room for adaptability of the new scheme, it was decided that the RHI would first apply to the industrial sector, and then the building sector.
Germany explored a renewable heat feed‐in tariff policy, which led to the idea of creating so called “transactors” (Bürger et al., 2008). To avoid remunerating millions of building owners, the transactor would distribute the FIT payments to the beneficiaries and aggregate these to claim

© OECD/IEA 2012 Policies for renewable heat An integrated approach
Page | 27
the payments from the obliged parties. With only a limited number of liable parties (about 1 000 in Germany) such a pricing policy would be relatively easy to manage.
Box 2 • Competitiveness of renewable heat technologies in the 2012 SDE+
Quantitative policies
In the heating sector, few states have implemented policies with a strong regulatory component such as obligations, certification schemes with a minimum quota, or building procurements. Renewable heat obligations in new buildings are, however, starting to become more common: they can now be based on reliable estimates of future market growth, so investment risks should be low (Roulleau and Lloyd, 2008).24
The 2011 amendment of the German Act on the Promotion of Renewable Energies in the Heat Sector, first implemented in 2008, extends the renewable heat obligation initially applying to new buildings to all existing public buildings used for legislative or executive purposes. This public procurement programme is paving the way for the obligation to become standard for the entire building stock.
Many countries initially relied on obligations for public building procurements in the inception phase of the policy journey to boost technology demonstration and awareness of the benefits of renewable heat technologies. Some studies nevertheless pointed out that, without an integrated quality standard or verification scheme, obligation policies might have limited effects or might remunerate installations that perform poorly or have never actually been activated:
In Spain, where the 2006 Solar Obligation initially resulted in the uptake of poor quality solar hot water systems (Connor et al 2009), quality standards have been added.
In Italy Law 28 approved on March 3 2011 stipulates that all solar collectors will have to be Solar Keymark certified by 2013 to benefit from any support. This new regulation also adopted an integrated approach to building heat demand by extending the obligation to 50% of hot water demand and 20% of space heating demand from renewable sources in new and refurbished residential building.
Notably, almost nowhere is there a policy to specifically promote renewable heat for industry and services, although there is considerable potential. It can be argued, however, that some energy efficiency policies, such as White Certificates systems (Box 3), are likely to have an effect on the deployment of renewable heat in the industry.
24 Roulleau, T., C.R. Lloyd, (2008), “International policy issues regarding solar water heating, with a focus on New Zealand”, Energy Policy, Vol. 36, pp. 1843‐1857.
In 2011, the Netherlands implemented the Renewable Energy Stimulating (SDE+) scheme, which introduces price competition in awarding renewable energy feed‐in premiums: renewable technologies all compete for contributions from the same budget, with the less costly technologies eligible for funding first.
Since January 31st 2012, the system also applies to renewable heat and four of the six newly eligible heat categories fall under the lowest first‐phase cost band, introducing several renewable heat technologies as the most cost competitive options (Annex 2).
This way, the Netherlands aims at coping with its EU 2020 targets of 14% of final energy consumption from renewable sources in a cost efficient manner, therefore prioritising lower cost options.

Policies for renewable heat © OECD/IEA 2012
An integrated approach
Page | 28
Box 3 • Energy efficiency schemes affect renewable heat deployment
Implemented in 2004, the Italian White Certificate system obliges electricity and gas system operators to meet a fixed target of energy efficiency and/or energy saving annually. In some cases, savings are fixed on the basis of the installed unit. For instance, the replacement of an electric boiler with a solar thermal installation saves 0.154 toe/m2 of glazed solar thermal panel installed. Higher coefficients apply to fuel switching from conventional to renewable energy.
© OECD/IEA 2012 Policies for renewable heat An integrated approach
Page | 29
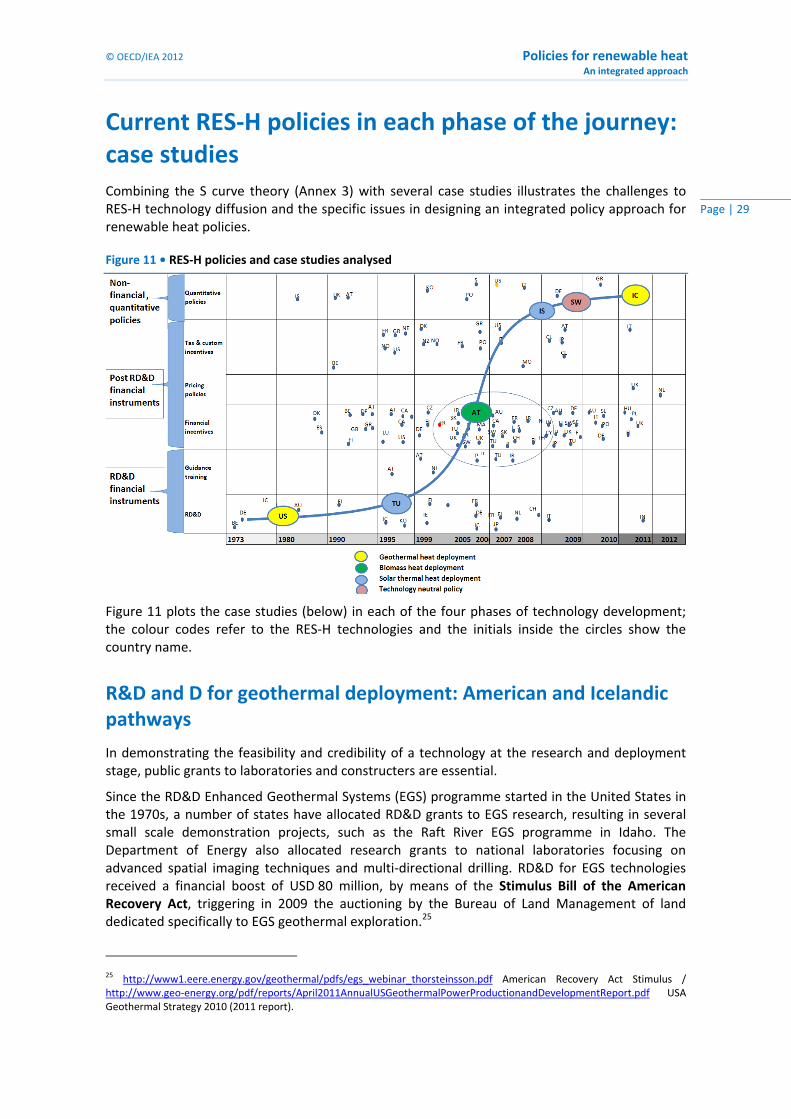
Current RES‐H policies in each phase of the journey: case studies Combining the S curve theory (Annex 3) with several case studies illustrates the challenges to RES‐H technology diffusion and the specific issues in designing an integrated policy approach for renewable heat policies.
Figure 11 • RES‐H policies and case studies analysed
Figure 11 plots the case studies (below) in each of the four phases of technology development; the colour codes refer to the RES‐H technologies and the initials inside the circles show the country name.
R&D and D for geothermal deployment: American and Icelandic pathways
In demonstrating the feasibility and credibility of a technology at the research and deployment stage, public grants to laboratories and constructers are essential.
Since the RD&D Enhanced Geothermal Systems (EGS) programme started in the United States in the 1970s, a number of states have allocated RD&D grants to EGS research, resulting in several small scale demonstration projects, such as the Raft River EGS programme in Idaho. The Department of Energy also allocated research grants to national laboratories focusing on advanced spatial imaging techniques and multi‐directional drilling. RD&D for EGS technologies received a financial boost of USD 80 million, by means of the Stimulus Bill of the American Recovery Act, triggering in 2009 the auctioning by the Bureau of Land Management of land dedicated specifically to EGS geothermal exploration.25
25 http://www1.eere.energy.gov/geothermal/pdfs/egs_webinar_thorsteinsson.pdf American Recovery Act Stimulus / http://www.geo‐energy.org/pdf/reports/April2011AnnualUSGeothermalPowerProductionandDevelopmentReport.pdf USA Geothermal Strategy 2010 (2011 report).
Policies for renewable heat © OECD/IEA 2012
An integrated approach
Page | 30
The Icelandic government supported RD&D for geothermal exploration and technology innovation from the 1940s. In 2009, the country met 100% of its space heating demand through geothermal heat. The long‐term strategy of RD&D grants and loans for geothermal exploration, drilling and technologies (Icelandic National Energy Authority Fund) and the creation of a dedicated institution – the Iceland Geosurvey – enhanced the exploitation of its geothermal rich resources. In parallel, the government built a large‐scale distribution system and district heating network, allowing for efficient transport and distribution of renewable heat from geothermal energy.
During the RD&D phase it is also essential to support projects related to assessing resource availability and accessibility.
Inception of solar thermal in Tunisia
The key strategic decision for programme sponsors in the inception phase is the division of resources between infrastructure support and financial incentives to stimulate market demand. These should include training for producers, suppliers and distributors; and the development and dissemination of support tools (e.g. generic specifications, design software, case studies, marketing articles, fact sheets on environmental benefits).
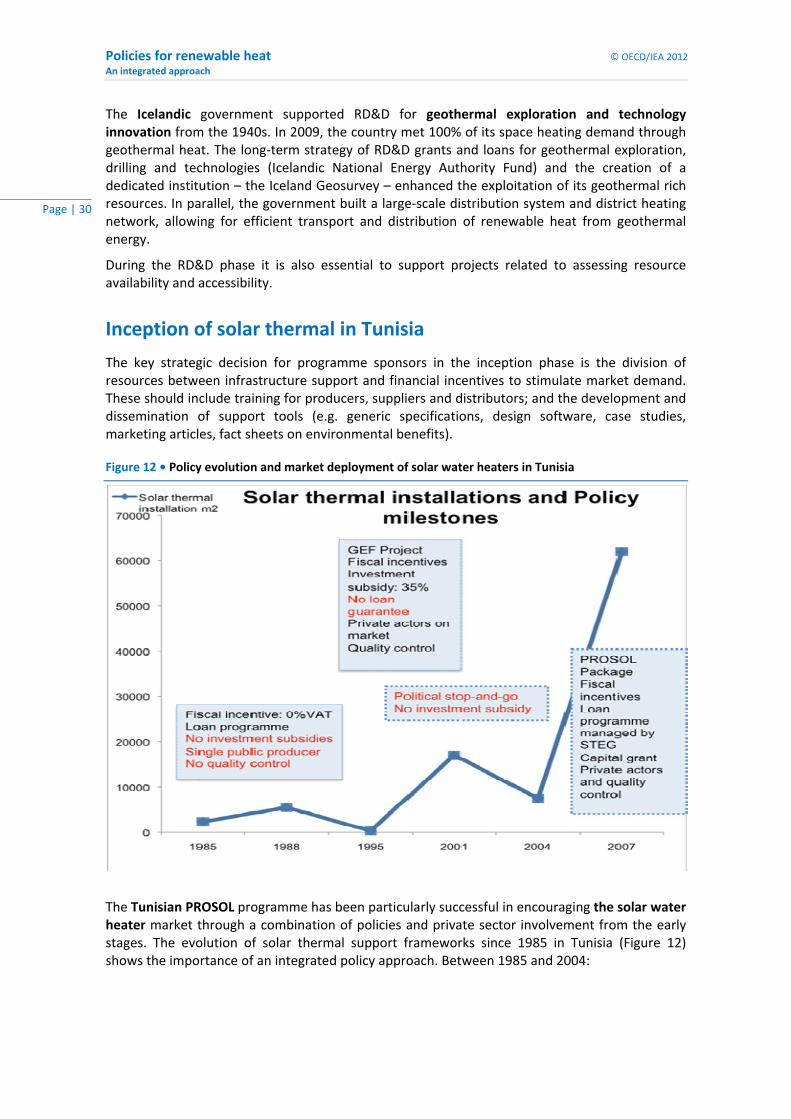
Figure 12 • Policy evolution and market deployment of solar water heaters in Tunisia
The Tunisian PROSOL programme has been particularly successful in encouraging the solar water heater market through a combination of policies and private sector involvement from the early stages. The evolution of solar thermal support frameworks since 1985 in Tunisia (Figure 12) shows the importance of an integrated policy approach. Between 1985 and 2004:

© OECD/IEA 2012 Policies for renewable heat An integrated approach
Page | 31
The Tunisian solar water heater programme was primarily based on VAT exemption for producers and a state monopoly in installation activities.
The sector experienced stop‐and‐go investment subsidies and cash grants.
A quality control system was introduced, but it was of poor quality, unstable and short‐lived.
Since 2004, PROSOL has been successful through its efforts to actively involve all the sector stakeholders and particularly the finance sector:26
A loan mechanism that enables domestic customers to purchase solar water heater systems, repaying through their electricity bills.
A government capital cost subsidy, up to 100 Dinars (EUR 57)/m2.
Discounted interest rates on loans progressively phased out.
By identifying new lending opportunities, banks have started building dedicated loan portfolios, helping to shift the solar water heater market from a cash‐based to a credit‐based market.
The programme includes other important measures:
Supply side promotion.
Quality control of the system.
Awareness raising campaign.
Capacity building programme.
The PROSOL programme proved successful in combining policy tools to guarantee the framework is stable and minimises risk for private investors, demonstrating political will and showing that the public sector is sharing the cost burden of solar water heaters until it reaches cost competitiveness with fossil fuels. The installation rate for solar water heaters increased considerably from 2005, reaching a cumulative installed capacity of 180 000 m2 in 2008 and 400 000 m2 at the end of 2009.
Biomass heat take‐off in Austria
Providing a combined and flexible set of policy tools to meet the needs of the different stakeholders and end users is a major challenge in the take off phase of technology diffusion.
In Austria, where in 2009 40.45% of total commercial heat came from biomass sources (liquid, solid and gas), a high dependency on oil and high oil prices provoked an interest in renewable heat (Kalt & Kranz, 2009). In addition to incentives supporting solar heat, Austria implemented an integrated policy package in support of bioenergy used for heating purpose:
The Austrian federal 2010 Electricity Feed‐in Tariff supports renewable heat through a combined heat and power premium.
Subsidies for district heating generators are included in the 2009 Combined Heat and Power Law.
The commercial sector is entitled to cash grants as part of the Environmental Support Act.
At the Provincial scale, different legislations apply in support of renewable heat:
In Upper Austria, farmer cooperatives receive an investment grant – 40% of their initial investment cost – if they create and feed a biomass district heating system connecting surrounding areas.
26 Detailed information on the PROSOL incentives package: ANME website http://www.anme.nat.tn/index.asp?pId=246

Policies for renewable heat © OECD/IEA 2012
An integrated approach
Page | 32
In Burgenland Province, households can apply for installation grants for domestic biomass heaters and income tax reduction for energy saving.
Renewable heat consolidation in carbon taxed Sweden and obliged Israel
To consolidate the uptake of a technology on the market, policy makers must respond to drops in market prices following the mass deployment of the technology, and turn their focus to adaptation of the energy system. Some governments have adopted regulations that affect the entire energy sector and aim at shifting their economy towards carbon neutral solutions.
Box 4 • Technology neutral policy in support of renewable heat
Several countries such as Sweden, Denmark and Finland applied a carbon tax to the energy sector, or any kind of productive activities, to balance the cost competitiveness of renewable technologies against conventional ones (Box 4).
In the case of Israel, the country started focusing on energy savings and independence from fossil fuel imports as early as the mid‐1970s. Among other strategies, in 1980 Israel was the first country to impose a solar thermal obligation on all new buildings, requiring a certain amount of
An example of a policy package that resulted in the market consolidation of renewable heat technologies is the introduction of the CO2 Tax in Sweden. In 1991 Sweden implemented a tax on carbon emissions of fossil fuel use with reduced rates for industries.1 In the residential sector, the carbon tax gradually evolved from 25 EUR/ton CO2 in the early 1990s to about 101 EUR/ton CO2 in 2008 (IEA, 2008b). As a consequence of this fiscal policy renewable heat became cheaper than any other fossil‐based alternative for households as well as for industries, although less remarkably for the latter (Figure 13).
Figure 13 • Energy prices in Sweden for various customer categories, 2009
The Swedish carbon tax greatly affected energy consumption in the residential sector in the context of sufficient biomass resources. The decision to upgrade and expand district heating networks allowed for efficient renewable heat distribution and access in urban areas.
© OECD/IEA 2012 Policies for renewable heat An integrated approach
Page | 33
daily heat output to be met with solar hot water, the amount determined by the size of the property and the type of installation.27
Some 30 years after the obligation came into force, solar thermal has become a mainstream technology in the energy market:
Installation rates grew steadily to reach a total installed collector area in operation of 2 101 344 m2 in 2009.
The market showed self‐sustained growth without any financial support or price‐affecting mechanism. Today about 90% of the Israeli solar thermal market is in the voluntary market (ESTIF, 2007).
The replacement of electric boilers, with about 1.3 million solar water heaters representing a total installed capacity in operation of about 2 848.5 MWth (Weiss and Mauthner, 2011).28
Israel saved between 4% and 8% of its total electricity demand each year (according to different estimates). This share is highly relevant in a country with high energy dependence and forecast electricity demand growth of 6.3% in 2010.29
27 Except for those higher than 27 metres and those used for industrial and trade purposes. 28 REEP, Renewable energy country profiles, Israel, Accessible online at: http://www.reegle.info/countries/israel‐energy‐profile/IL 29 Israel Renewable Energy Association, Energy efficiency policies in Israel: Opportunities and prospects, Accessible online at: http://www.eclareon.eu/sites/default/files/praesentation_eitan_parnass.pdf

Policies for renewable heat © OECD/IEA 2012
An integrated approach
Page | 34
Principles and next steps for policy makers
Policy principles
Some policy principles adopted in developing and deploying renewable heat technology may need greater attention than they have had so far. We aim to explore these principles by discussing the specific barriers for development and deployment of renewable heat technology in the context of its past development and the overall IEA approach to determining policy principles.
As a technology progresses towards maturity, there is a need for a combination of technology push – RD&D and inception phases – and market pull – take‐off and consolidation phases (Figure 14).
Figure 14 • Technology push versus market pull instruments
Source: (IEA, 2011C)
Figure 14 shows the general renewable energy policy principles as explained in the context of the policy journey (IEA, 2011c). In the early RD&D phase of a technology development, policies will be concentrated on technology push, but they must gradually move to market pull in the inception and take‐off phase while eventually fading out in the consolidation phase as the technology matures. Some key questions need to be asked: how are these principles applied to renewable heat? Does it have specific policy challenges in terms of technology and market? Are additional policy principles to those illustrated in Figure 14?
An examination of deviations or additional challenges for renewable heat in each of the four phases should demonstrate the extent to which additional policy attention for renewable heat is justified.

© OECD/IEA 2012 Policies for renewable heat An integrated approach
Page | 35
Additional challenges for policy makers
In the RD&D phase
Renewable heat technologies do not seem to be particularly different from other renewable energy technologies in terms of innovation and technology development needs.
RD&D investment from the public sector should target areas with high risk and long‐term perspectives.
Private sector involvement usually tends to be in pre‐competitive, short‐term demonstration and commercialisation of technologies.
In the inception phase
In the inception phase, market pull policies are needed to address the characteristics of the heat and renewable heat market. General policy principles for encouraging deployment of renewable energy in the inception phase state that investor confidence can be created by the development of a clear roadmap that illustrates how the market is bound to grow sustainably and at a considerable volume (IEA, 2011c). In designing a roadmap or strategy for the renewable heat market, additional effort may be needed as a consequence of limitations in transportability of (renewable) heat:
In the inception phase, it is crucial to address the variety of investors, tackling their specific investment decision criteria.
Renewable heat policy design should address the relation to and competition with energy efficiency.
Developing a national renewable heat strategy will need to address limitations in transportability of (renewable) heat and recognise its variability in time and in temperature levels.
Training of gatekeepers and strengthening the market infrastructure is crucial in this phase.
In the take‐off phase
In the take‐off phase, the deployment of the particular technology is underway within the national market, the supply chain is in place even if not fully developed and investors have increased knowledge of the technology (IEA, 2011c). The priority for policy makers is to maintain or accelerate market growth, while managing overall policy costs.
As a general policy principle in this phase, it is considered important to establish a predictable support environment that is flexible enough to adapt to market and technology developments:
Schemes are needed that avoid “stop‐and‐go” cycles and do not overburden government budgets. Finance could come from policy support outside the government budget or by earmarking funds ahead of time in combination with a guaranteed time period that the scheme will continue to be in place.
Only a small part of the heat market shows resemblance with the electricity market: district heating. In these cases successful policies based on support on the basis of output (FIT) may be a good strategy.
However, applying renewable electricity policy successes, such as feed‐in‐tariff schemes, to the renewable heat market is not straightforward in end‐use sectors without heat metering. Absence of a heat grid may sometimes even make such schemes counterproductive.

Policies for renewable heat © OECD/IEA 2012
An integrated approach
Page | 36
In the building sector, the financing of domestic heat appliances by private households and the split‐incentive problem are important non‐economic barriers that should be addressed by innovative business models and policies.
In this phase non‐economic barriers should be removed in both building and industry sectors. Non‐economic barriers like the split‐incentive also affect renewable heat deployment in the industry sector and must be tackled (Ecofys, 2010).
In the consolidation phase
In the consolidation phase, technologies are well established, the market has grown substantially, supply chains are robust and financing and public institutions have streamlined their procedures (IEA, 2011c). The technologies are close to or fully cost‐competitive (ibid.).
Economic support mechanisms are being phased out at this stage, as technologies are able to compete with alternatives. The specific challenges for the heat sector that are related to the dispersed and heterogeneous group of stakeholders are therefore no longer an issue in this stage of renewable heat technology deployment.
In the consolidation phase, the system integration of renewable heat might be less challenging than that of renewable electricity, as grid integration is no issue.
The local character of heat is likely to encourage public acceptance. Evidence shows that the local, or at the most regional, production of heat – e.g. in community projects with communal heat systems or in district heat systems on a city scale – has often gained strong support from local communities.

© OECD/IEA 2012 Policies for renewable heat An integrated approach
Page | 37
Conclusions and next steps The production of heat is responsible for a large share of final energy demand, with 47% of final energy used for heat in 2009 worldwide. Expanding the use of modern biomass, geothermal energy, solar energy and ambient energy to produce heat could thus make a substantial contribution to meeting energy security and climate change objectives. Encouraging greater deployment of renewable heat requires more attention to policy design and the specific challenges of this market.
The analysis of specific barriers and experience with previous renewable heat policies in the light of IEA’s general policy principles for renewable energy enables additional policy principles for renewable heat in certain phases of the policy journey to be identified (Figure 15).
Figure 15 • General policy principles for renewable energy technologies
The heat market has been described as very heterogeneous in terms of the stakeholders and investors involved, the influence of differing climate conditions and the influence of different heat energy infrastructures. Since the (renewable) heat market shows a number of very specific characteristics that differ from country to country, policy principles for renewable heat must differ, especially in the inception and take‐off phases. In those two phases of technology development, market conditions are particularly important: demand pull policies will have to persuade the various dissimilar elements of the market to invest in a technology that is not yet cost‐competitive (Figure 15).
The heat market is determined by investors in two end use sectors: building and industry. Investment decisions for renewable heat are largely taken by end‐users, which suggests parallels with investment decisions for energy efficiency in these sectors. Renewable heat policy design for
Policies for renewable heat © OECD/IEA 2012
An integrated approach
Page | 38
these end‐use sectors may therefore have more in common with energy efficiency policy design than with renewable electricity policy design.
This parallel between renewable heat and energy efficiency also affects end‐users’ investment decisions. The investors in renewable heat and in energy efficiency are often the same and these investment decisions thus compete with each other. Moreover, where energy efficiency is low, renewable heat is produced in higher quantities than strictly needed and thus investment in renewable heat is inefficient. Policy support for renewable output should address energy efficiency at the same time, as it could otherwise lead to inefficient allocation of resources and over‐subsidisation.
The district heating market is one element where decisions are not taken by end‐users. However, few countries have any central heat production and distribution through district heating networks. The district heat market is similar to the electricity market in that it has a grid and utilities are responsible for energy production. In these cases proven policies for renewable electricity, based on support of energy output, may provide a good strategy for renewable heat as well.
Countries’ heat markets differ considerably, as has been noted, as a result of the variety of their climate conditions, their heat‐producing histories and conventions and existing infrastructures (e.g. gas distribution, district heat, or indeed no infrastructure in warm climates where heat is often produced by electricity). As a result, each market may require different, customised renewable heat policy approaches suited to local conditions. The challenge will be for these approaches to target as many RES‐H technologies and stakeholders as possible, ideally with the smallest number of policies and financed outside state budgets.
On the basis of the findings in this study, the following key findings have been identified:
The heat market comprises two end‐use sectors: building and industry. Renewable heat policy design for end‐use sectors may have more in common with “energy efficiency” policy design than with renewable electricity policies.
Renewable heat investment often competes with energy efficiency investment. Moreover, renewable heat policy should address energy efficiency in order to avoid over‐subsidisation.
Only a small part of the heat market shows resemblance with the electricity market: district heating. Here, successful policies based on support on the basis of output may be a good strategy.
On the basis of the findings in this study, the following key actions have been identified:
The characteristics and specific challenges of the (renewable) heat market require greater attention to the design of renewable heat policies.
General principles for the design of renewable policy support (as discussed in IEA, 2011c) should be taken into account in renewable heat policies.
Renewable heat policy design needs additional attention in the inception and take‐off phases.
More attention is needed for differentiation of renewable heat policies along different renewable heat sectors:
Feed‐in‐tariffs or renewable heat portfolio standards may be considered for commercial heat, which shows metering and grid similarities with the electricity sector.
Subsidies and tax incentives may be useful approaches for renewable heat technologies in end‐use sectors, which do not have metering or a heat grid.

© OECD/IEA 2012 Policies for renewable heat An integrated approach
Page | 39
Support and facilitation for new business models that address financing and up‐front investment barriers is needed, to facilitate investment in renewable heat technologies, particularly in the building sector.
It is recommended that governments should seek options to make economic incentive schemes independent of annual government budget appropriations, e.g. by means of levies to fossil fuel consumption. This would avoid the “stop‐and‐go” policies experienced in the past for renewable heat technologies in end‐use sectors.
The heterogeneity of the heat sector, with its great variety of stakeholders, climate conditions and heat infrastructures, requires customised approaches to renewable heat policy based on local market conditions.

Policies for renewable heat © OECD/IEA 2012
An integrated approach
Page | 40
Acronyms, abbreviations and units of measure
Acronyms and abbreviations
CHP combined heat and power COP coefficient of performance CO2 carbon dioxide EGS enhanced geothermal system FIT feed‐in tariff RHI renewable heat incentive VAT value added tax
Units of measure
GWth gigawatt thermal toe tonne of oil equivalent m2 square metre
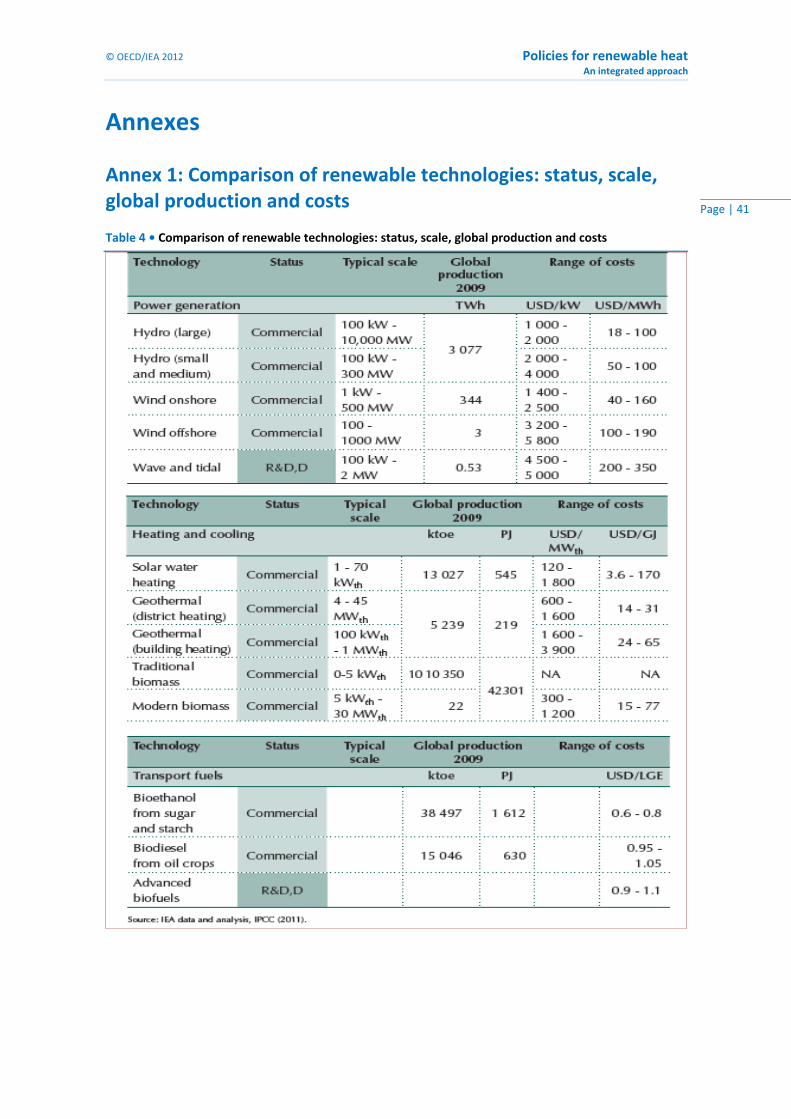
© OECD/IEA 2012 Policies for renewable heat An integrated approach
Page | 41
Annexes
Annex 1: Comparison of renewable technologies: status, scale, global production and costs
Table 4 • Comparison of renewable technologies: status, scale, global production and costs

Policies for renewable heat © OECD/IEA 2012
An integrated approach
Page | 42
Annex 2: Cost of heat and electricity technologies
Figure 16 • Cost of heat and electricity technologies as included in the Dutch SDE+ scheme

© OECD/IEA 2012 Policies for renewable heat An integrated approach
Page | 43
Annex 3: The S‐curve approach
The S curve shows the maturity of a technology on a market, i.e. the level of technology diffusion accumulated over time. Maturity is a plural concept. Technological maturity relates to the technical feasibility, accessibility and efficiency of a renewable technology. Market maturity shows the level of competitiveness of the renewable technology against fossil sourced generation (IEA, 2011c).
Figure 17 • S‐curve approach
TimeRD&D Inception Mass Deployment Consolidation
Prototype and demonstration stage
technologies
High cost ‐ gap technologies
Lowcost‐gap technologies
Mature technologies
M
a
r
k
e
t
d
e
p
l
o
y
m
e
n
t
Price going down as market diffusion
acceleratesLearning Curve
Technology‐neutral competition
The level of market maturity of a certain technology can vary dramatically from one national market to another, and at the regional or global scale.
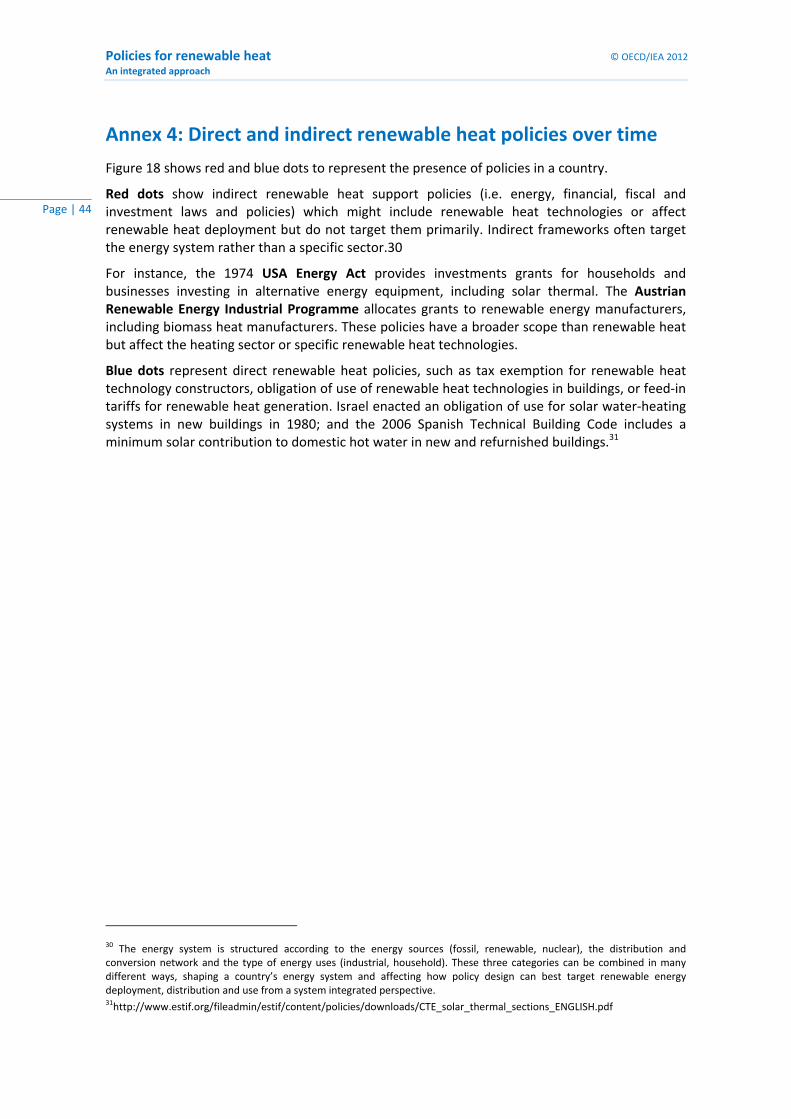
Policies for renewable heat © OECD/IEA 2012
An integrated approach
Page | 44
Annex 4: Direct and indirect renewable heat policies over time
Figure 18 shows red and blue dots to represent the presence of policies in a country.
Red dots show indirect renewable heat support policies (i.e. energy, financial, fiscal and investment laws and policies) which might include renewable heat technologies or affect renewable heat deployment but do not target them primarily. Indirect frameworks often target the energy system rather than a specific sector.30
For instance, the 1974 USA Energy Act provides investments grants for households and businesses investing in alternative energy equipment, including solar thermal. The Austrian Renewable Energy Industrial Programme allocates grants to renewable energy manufacturers, including biomass heat manufacturers. These policies have a broader scope than renewable heat but affect the heating sector or specific renewable heat technologies.
Blue dots represent direct renewable heat policies, such as tax exemption for renewable heat technology constructors, obligation of use of renewable heat technologies in buildings, or feed‐in tariffs for renewable heat generation. Israel enacted an obligation of use for solar water‐heating systems in new buildings in 1980; and the 2006 Spanish Technical Building Code includes a minimum solar contribution to domestic hot water in new and refurnished buildings.31
30 The energy system is structured according to the energy sources (fossil, renewable, nuclear), the distribution and conversion network and the type of energy uses (industrial, household). These three categories can be combined in many different ways, shaping a country’s energy system and affecting how policy design can best target renewable energy deployment, distribution and use from a system integrated perspective. 31http://www.estif.org/fileadmin/estif/content/policies/downloads/CTE_solar_thermal_sections_ENGLISH.pdf

© OECD/IEA 2012 Policies for renewable heat An integrated approach
Page | 45
Figure 18 • Renewable heat policies (direct or indirect) from 1973 to 2011
Quantitative
policies
Tax &
custom
incentives
Pricing
policies
Financial
incentives
Guidance training
RD&D
1973‐1979
1980‐89
1990‐94
1995 ‐ 1999
1999 ‐ 2004
2005 2
006
2007 20
082009
2010
2011
US
JP
IC
CA
FIAU
IE
NOUKHU
DK
AUAT
CA
DEGR
CA
CASW
LUJP
US
CZ FIFR
DENO
UK
NO
NE
USGR
SWUS
DK
NZ
FR NO
USKO
TU
SPIT
CH
USGR
DE
AU DE
FR DE IC
FR
AT
JP
CA FI US
CA
NL CH
AU
US
IT
IR SK TU UK
AT
SWUK
AU TUSWCA
CA IR SK US
NZFR SI
BRAU
IR
LUFR
SA
NL
CHTH
FRDE
IN
FRAU
CZ
ITSW
SE
CYUS
UK
AU
IT
PO
HU
PL
UK
CZ SAFR
GR
IT
USKO NZ US
US CL
AT JP
IT
JP
MO
IN
TU
MO
CL
IT
DK
KO
DE
SW
UK
AT
AT
BU
CZDK
DK
FI
FI
FI
FR
LU
MA
NL
PO
PO
PO
SK
SL
SL
BECA
DEDE
NL
CHUS
ITGB
NZNO
PT
SE
DK
KR
ATJP
IE
DK
US
TRAU
ESFR
USFR
ITTR
KR
FR TR IE
IS
DK
PTES
FI
LU
ATGR
NL
HUAT
CH
AUPT
BE FI
DE ITLUGR
GB
FR
BEKR
CAFI
SE
IT
NL
GRLU
NZ DK CH
AT
FIAT
NL
PLIR
ATTU
AT
US
CH PT
Econ
omica
l incentives
UK
Non‐econ
omica
lincentives
RD&D
incentives

Policies for renewable heat © OECD/IEA 2012
An integrated approach
Page | 46
References Arvizu, D., T. Bruckner, H. Chum, O. Edenhofer, S. Estefen, A. Faaij, M. Fischedick, G. Hansen, G.
Hiriart, O. Hohmeyer, K. G. T. Hollands, J. Huckerby, S. Kadner, A. Killingtveit, A. Kumar, A. Lewis, O. Lucon, P. Matschoss, L. Maurice, M. Mirza, C. Mitchell, W. Moomaw, J. Moreira, L. J. Nilsson, J. Nyboer, R. Pichs‐Madruga, J. Sathaye, J. Sawin, R. Schaeffer, T. Schei, S. Schlomer, K. Seyboth, R. Sims, G. Sinden, Y. Sokona, C. von Stechow, J. Steckel, A. Verbruggen, R. Wiser, F. Yamba, and T. Zwickel (2011), Technical Summary of the IPCC Special Report on Renewable Energy Sources and Climate Change Mitigation [O. Edenhofer, R. Pichs‐Madruga, Y. Sokona, K. Seyboth, P. Matschoss, S. Kadner, T. Zwickel, P. Eickemeier, G. Hansen, S. Schlomer, C. von Stechow (eds)], Cambridge University Press, Cambridge, United Kingdom and New York, NY, USA.
Bürger, V., S. Klinski, U. Lehr, U. Leprich, M. Nast and M. Ragwitz(2008), Policies to support renewable energies in the heat market, Energy Policy, Vol 36, CITY OF PUBLI, pp 3150‐3159
Danish Energy Agency (2011), Danish Energy Policy 1970‐2010: Vision: 100% independence of fossil fuels, Copenhagen, Denmark, available online at: http://www.ens.dk/en‐US/Info/news/Factsheet/Documents/DKEpol.pdf%20engelsk%20til%20web.pdf
Ecofys (2010), Prijsbeleid voor een versnelde energietransitie, Utrecht, The Netherlands
ECN (2011) Basisbedragen in de SDE 2012, Petten, The Netherlands
European Commission (2009), Directive 2009/28/EC of the European Parliament and of the Council, available at: http://eur‐lex.europa.eu/LexUriServ/LexUriServ.do?uri=OJ:L:2009:140:0016:0062:en:PDF
European Commission (2010), Directive 2010/31/EU of the European Parliament and of the Council, available at: http://eur‐lex.europa.eu/LexUriServ/LexUriServ.do?uri=OJ:L:2010:153:0013:0035:EN:PDF
Green Alliance, (2011), Cost effective renewables: The role of the Renewable Heat Incentive in decarbonising energy, London, United Kingdom, accessible online at: http://www.green‐alliance.org.uk/uploadedFiles/Themes/Climate_and_Energy/Low%20cost%20renewables%20final(1).pdf
IEA (2007), Mind the gap: Quantifying Principal‐Agent Problems in Energy Efficiency, OECD/IEA, Paris
IEA (2007b), Renewables for Heating and Cooling: untapped potential, OECD/IEA, Paris
IEA (2008), Deploying renewables, principles for effective policies, OECD/IEA, Paris
IEA (2008b) Energy policies of IEA countries – Sweden 2008 review, OECD/IEA Paris
IEA (2009a), Renewable Energy Essentials: Solar Heating and Cooling, OECD/IEA, Paris
IEA (2009b), Energy policies of IREA countries: Italy, OECD/IEA, Paris
IEA (2010), Energy Statistics Manual, OECD/IEA, Paris
IEA (2011a), Energy Balances of non‐OECD countries, OECD/IEA, Paris
IEA (2011b), Energy Balances of OECD countries, OECD/IEA, Paris
IEA (2011c), Deploying renewables 2011 – Best and future policy practice, OECD/IEA, Paris
IEA (2011d), Solar Energy Perspectives, OECD/IEA, Paris
© OECD/IEA 2012 Policies for renewable heat An integrated approach
Page | 47
IEA (2011e), Technology Roadmap Energy‐efficient Buildings: Heating and Cooling Equipment, OECD/IEA, Paris
Kalt G., L. Kranzl, 2009, Renewable Energy in the Heating and Cooling sector in Austria (including regional aspects of Styria) D3 of WP2 from the RES‐H Policy project, Energy Economics Group University of Wien, Wien
Kiviluoma, J., PMeibom (2010), Influence of wind power, plug‐in electric vehicles, and heat storages on power system investments,Energy Policy, Vol. 35, pp. 1244–1255
Lund, J.W., D. H. Freeston, and T.L. Boyd (2010), Direct Utilization of Geothermal Energy 2010 Worldwide Review, World Geothermal Congress 2010, Bali, Indonesia, 25‐29 April 2010
RETD (2010), Best practice for the deployment of renewable energy for heating and cooling in the residential sector, Accessible online at http://www.solar‐hot‐water.ca/resources/IREHC‐Final‐Report‐20100726.pdf
RETD (2011), Business models for renewable energy in the built environment, Accessible online at http://iea‐retd.org/wp‐content/uploads/2012/01/RE‐BIZZ‐final‐report.pdf
SEA (2008), Energy in Sweden ‐ Facts and Figures 2008, VolET2008, No 20, Eskilstuna, Sweden
Van Wees, J. D. (2010), Verduurzaming van Nederland kan goedkoper: Geef (aard)warmte de stimulering die het verdient, available at: http://geothermie.nl/fileadmin/user_upload/documents/bestanden/JD_v_Wees_artikel_geothermie.pdf
Weiss, W. and F, Mauthner (2011), Solar Heat Worldwide‐ Markets and contributions to the energy supply 2009, Solar Heating and Cooling programme, AEE Intec, Gleisdorf, Austria

International Energy Agency • 9 rue de la Fédération • 75739 Paris Cedex 15, France
Buy IEA publications online:
www.iea.org/books
PDF versions available at 20% discount
Books published before January 2011
- except statistics publications -
are freely available in pdf
Onlinebookshop
Tel: +33 (0)1 40 57 66 90
E-mail: [email protected]