policies and strategies for promoting food security in sierra leone with special reference to rice
TRANSCRIPT
POLICIES AND STRATEGIES FOR
PROMOTING FOOD SECURITY IN SIERRA
LEONE WITH SPECIAL REFERENCE TO RICE
1.0. The Food Security Pledge: “Fellow Sierra Leoneans, my own principal objective in this second leg of our journey together is also centered on a Basic Human Right-
The Right to Food. So today with the new mandate you have given me, I shall make another pledge. This time, I pledge to work even harder and with greater resolve to do everything in my power to ensure that within the next five years, No Sierra Leonean should go to bed hungry. Alhaji Dr. Ahmed Tejan Kabba, May 19, 2002. 1.2 Implications on timing, preparedness and logistics Infrastructural damage (including agric machinery) 70% of 550,000 FF displaced (over 500 fled to Guinea) Disrupted local authority Middle of 2002 cropping season Reliance on poor returnee farmers (lack shelter, seeds, tools) Reliance on food pipe-line agencies 1. 3 Stakeholder institutions involved Donor family Line Ministeries Farmers and community organisations Youth and women groups Traditional rulers NGOs in Agric.

1. 4 Supportive policies, strategies and legislations National Recovery strategy Medium Term strategic Agric. Plan Poverty Reduction Strategy Paper (All its 3 pillars are supportive) Fisheries, Forestry, Education, Health, Nutrition and Sanitation Legislations Special Programme for Food Security (Farmers Field School) NGOs operational policy Investment Promotion Act (2004) 1. 5 Reasons for supporting Food Security Goal Support peace building/maintenance Foreign exchange limitations Comparative Advantage in food production Economic independence Fuel development in all sectors Fresh food available Sovereignty more meaningful Health for all more effective 1.6 Food Security Policy pillars Agricultural intensification Crop diversification Natural Resources Conservation Food safety nets

•2.0 Reasons for failure of Past Agric. policies Inconsistency due to limited support, dependence on and influence of donors Inadequate inter-sectoral collaboration/cooperation Limited private sector involvement Limited post project follow-up Overlap in sectoral mandates resulting in conflicting signals Differences in donor preferences and priorities Food scarcity not a major issue
•2.2 Phases of Past Agric. policies• COLONIAL PERIOD• (i) Emphasised upland conservation/ lowland cultivation Lowland irrigation in Scarcies river areas Yields affected by soil acidity, iron and aluminum toxicity problems Lately support to and involvement of small farmers Input subsidy produced some success • • (ii) Independence to military rule in 1967 Direct GOSL intervention in rice production SLPMP- export crops Rice Cooperation-
rice production in lowland with little success Est. of NUC - Agric Extension workers.• •
(iii) Period 1968 - 1990
• Focused on small farmers problems• Stimulated investment in Agric sector – IADPs• IDPS generally failed because:
(a) Were location specific (b) Non continuous funding (c) Had ambitions targets (d) No marketing and price incentives (e) Poor loan recovery efforts. (f) Limited impacts on stakeholders
• Early tractorization failed (poor resource management)• Green revolution programme focused on improved yield, pesticides
and fertilizer input, credit provision and extension support• Short lived due to non fulfillment of donor conditions• ASSP focused on technological development; institutions and incentive packages in favour of privatization, research extension linkage etc. second phase never operational
(iv) Period 1990-2000
Structural Adjustment Policy adopted
• Liberalized domestic pricing and trade policies• Liberalized exchange rate• Better expenditure control and revenue generation• Private sector development policies resulted in removal of subsidies on rice, fuel, fertilizer; resulted in low yields and high haulage costs.
(v) Interim statement of policy intent
Defined MAFFS mandate as creating enabling environment by supporting:
• Increased productivity through enhanced input support• Applied research into high yielding varieties and best practices• Market information and price incentives• Value addition and agro-processing
Focused on the following supportive policies• Land use and development• Pricing/marketing• Crop production• Livestock production• Forest conservation• Fisheries development• Support services• Decentralization• Land development
Rice policy developmentPeriod 1991 – 2004 saw the implementation of 7 Agricultural Development Projects, most with rice production as major component.
• Rice produced for consumption (about 5% for seed). Rice consumed with sauce as main meal. Use in porridge, puddings etc. limited.
• ROK 3 used in brewing in late 90s• 16 local sorghum varieties being developed for suitability in beer and
“maltina” production.

Failure of Rice Cooperation
• Political interference• Inadequate financial support from GOSL• Unrealistically low prices offered to producers• Corruption• Nepotism
SLPMBs efforts to salvage situation failed because of:
• Liquidity problem• Low export quality Low prices∴• Delayed payment for produce• Private sector involvement supported, leading to competition
Rice Trade Policies • To ensure adequate supplies of good quality rice• To provide stable prices to producers• Rice mill division est. 1936 supply Dept WWII Rice Corporation• Est. mill in Freetown (1936) }Aimed at reducing -• Est. mill in Mambolo (1951) }post harvest processing losses
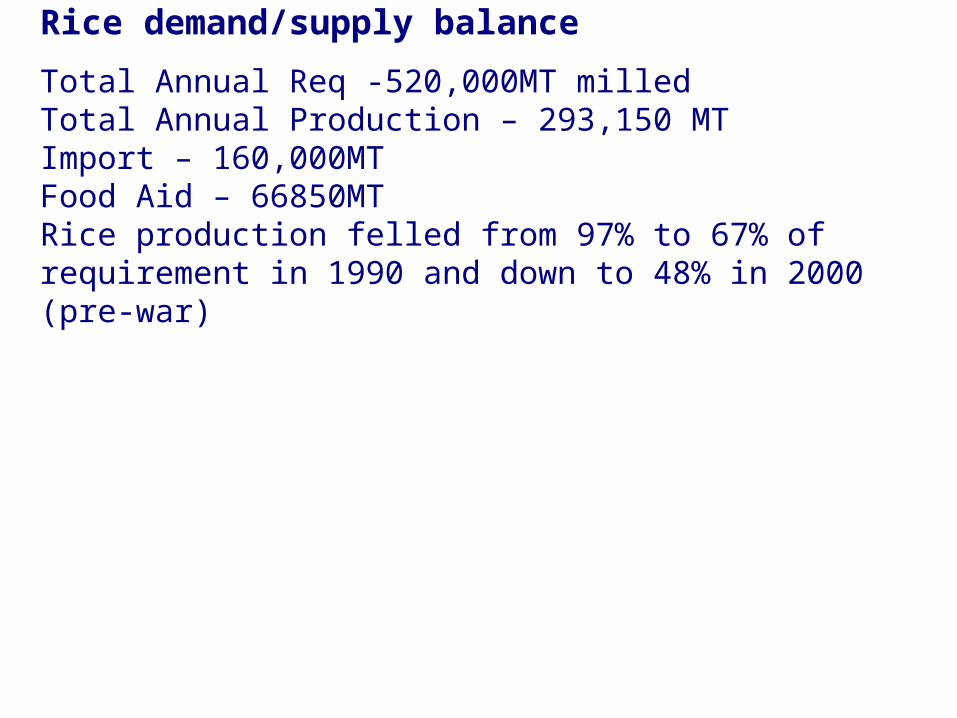
Rice demand/supply balance
Total Annual Req -520,000MT milledTotal Annual Production – 293,150 MTImport – 160,000MTFood Aid – 66850MTRice production felled from 97% to 67% of requirement in 1990 and down to 48% in 2000 (pre-war)

3. 1 Crop production potential Total arable land = 5.4 million hectares of which: IVS = 630,000ha, Bolis (grassland depressions) = 45,000haRiverine grasslands = 130,000haMangroves = 2000,000ha 3.2 Reasons for low crop yield Lack of or limited farm inputs Poor timing and low intensity of essential tending operations and applications Generally infertile soils (nitrate deficiency) Short fallow periods (incomplete recovery of nutrients) Heavy leaching and erosion of nutrients Use of local (low yielding) varieties High weed/pest damage 30% post harvest losses Poor time management amongst competing demands
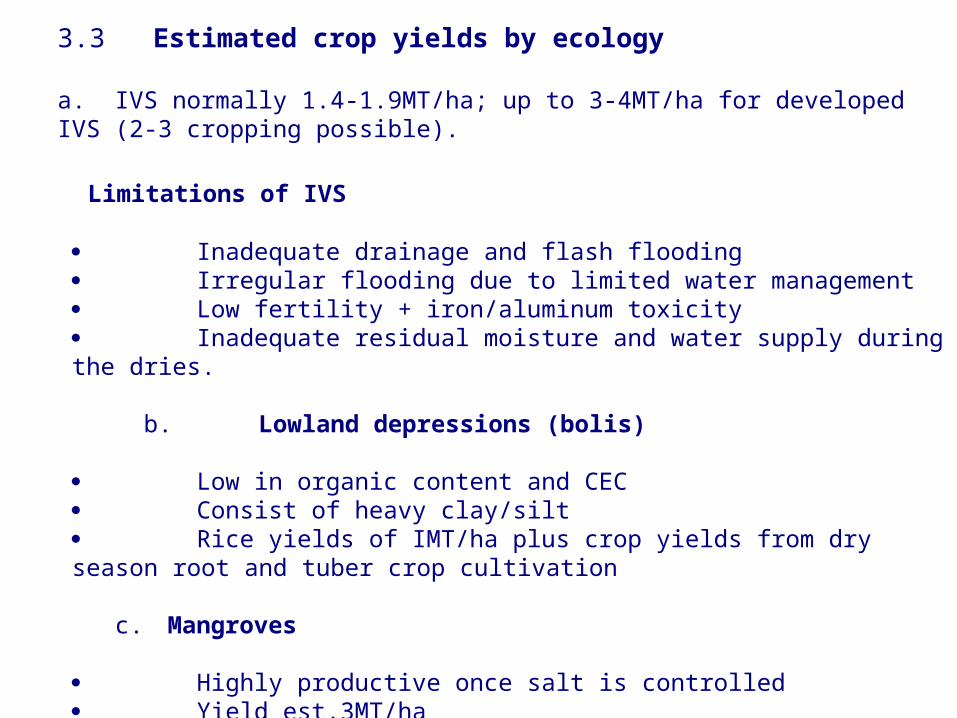
3.3 Estimated crop yields by ecology a. IVS normally 1.4-1.9MT/ha; up to 3-4MT/ha for developed IVS (2-3 cropping possible).
Limitations of IVS Inadequate drainage and flash flooding Irregular flooding due to limited water management Low fertility + iron/aluminum toxicity Inadequate residual moisture and water supply during the dries. b. Lowland depressions (bolis) Low in organic content and CEC Consist of heavy clay/silt Rice yields of IMT/ha plus crop yields from dry season root and tuber crop cultivation c. Mangroves Highly productive once salt is controlled Yield est.3MT/ha
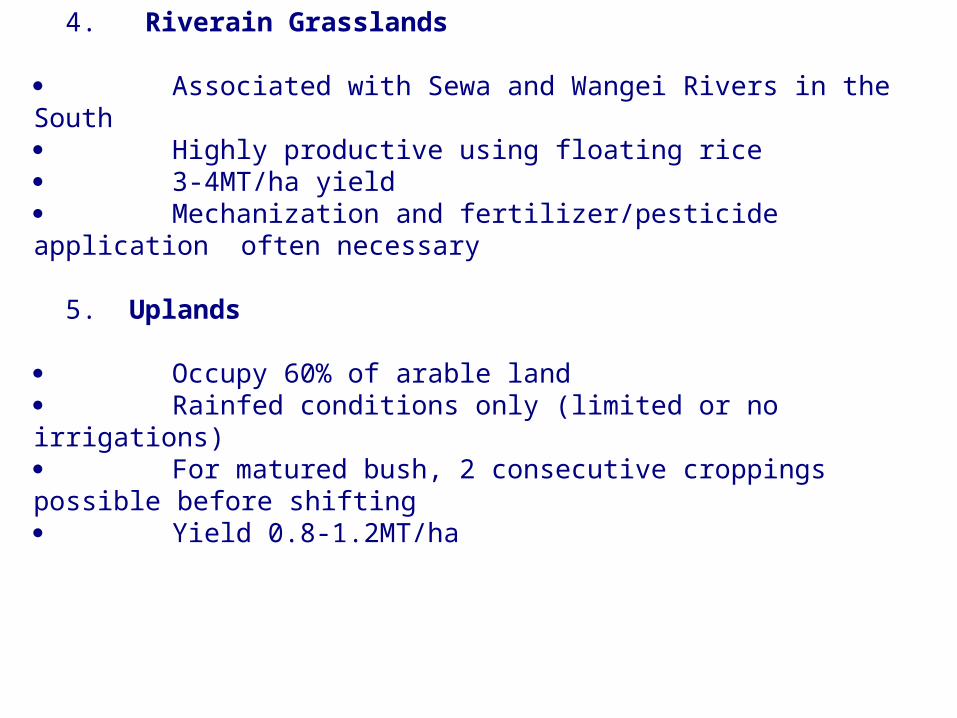
4. Riverain Grasslands Associated with Sewa and Wangei Rivers in the South Highly productive using floating rice 3-4MT/ha yield Mechanization and fertilizer/pesticide application often necessary 5. Uplands Occupy 60% of arable land Rainfed conditions only (limited or no irrigations) For matured bush, 2 consecutive croppings possible before shifting Yield 0.8-1.2MT/ha
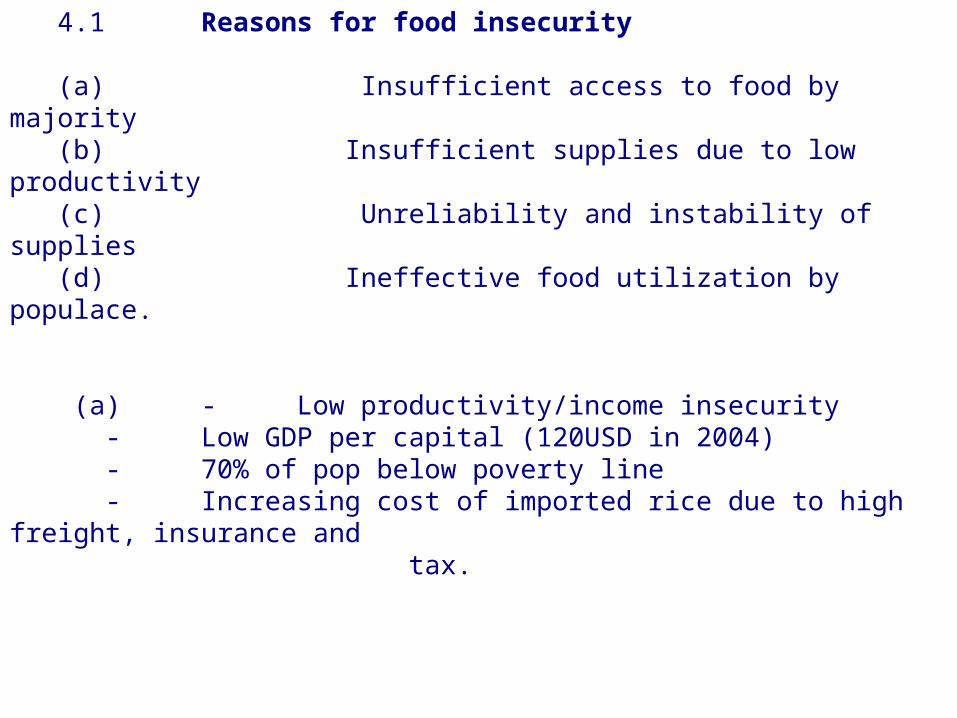
4.1 Reasons for food insecurity (a) Insufficient access to food by majority(b) Insufficient supplies due to low productivity(c) Unreliability and instability of supplies(d) Ineffective food utilization by populace. (a) - Low productivity/income insecurity
- Low GDP per capital (120USD in 2004)- 70% of pop below poverty line- Increasing cost of imported rice due to high freight, insurance and
tax.

(b) - Dependence on small farmer (risky)- State farms not feasible- Poor/limited food distribution- Most of the 7800Km of roads in bad state- Feeder roads are terrible in wet season; hence smuggling- Poor food stock management strategies
(c) - High haulage costs during the rains
- Fewer haulage vehicles during the rains- Sole rice importer in Sierra Leone- Eratic weather conditions (distortion of farming
calendar)- limited availability of HYVs
(d) - Poor health
- Inadequate knowledge of nutritional status of food- Inadequate water and energy for processing- 27% of children under 5 are under weight- 34% of children under 5 are stunted - Infant and child mortality of 170/1000 and 316/1000
respectively

4.2 On-going strategies 4.2.1 Support to small farmers • Develop seed bank through food aid
• Provide credit facilities (NaCSA &NGOs, Cooperative Department)• Input and tools support• Support the development, rehab and expansion of cash crop plantations.• Women targeted programmes (vegetable production, poultry, small ruminant development)• Stem rural urban migration
4.2.2. Safety net • Provide support to vulnerables victims of war, insane, sick etc• Community involvement better• Coordinate to avoid duplication• Impact assessment necessary• Dependency syndrome to be avoided

4.2.4. Strategies to improve stability of supply
• Improve feeder roads• Support with transportation and storage• Reduce post harvest through stores, drying floors construction.• Introduce HYVs• Inculcate good tending practices
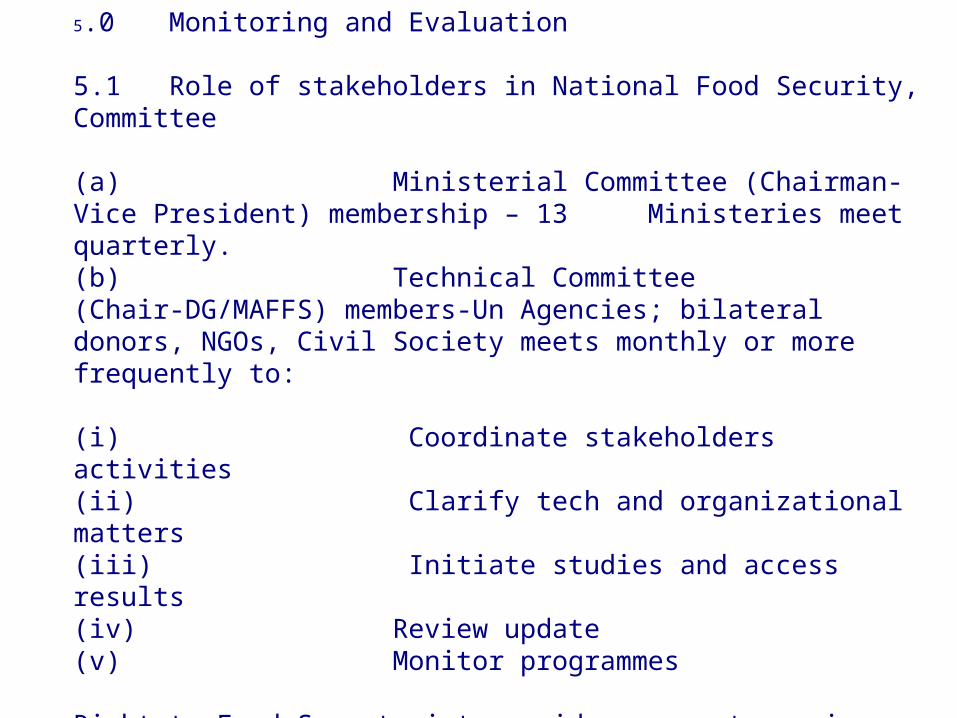
5.0 Monitoring and Evaluation 5.1 Role of stakeholders in National Food Security, Committee (a) Ministerial Committee (Chairman-Vice President) membership – 13
Ministeries meet quarterly.(b) Technical Committee (Chair-DG/MAFFS) members-Un Agencies; bilateral donors, NGOs, Civil Society meets monthly or more frequently to: (i) Coordinate stakeholders activities(ii) Clarify tech and organizational matters(iii) Initiate studies and access results(iv) Review update(v) Monitor programmes Right to Food Secretariat provides support services.Food Security coordinating unit to be est in MAFFs and be replicated in all 14 Agricultural Districts.
Conclusions Food security Policy clearly over ambitious; problems of varying magnitude; resources limited but planning and implementation on the right path. With adequate logistics and expertise dream could be realised by 2007.
Thank you !

Table 1. Arable and Cultivated Land by Ecosystem
Ecology Specific Area (ha) % of Arable Area % of Total Area
Upland 4,200,000 78.0 58.1
Inland Valley Swamp 690,000 12.9 9.5
Mangrove Swamp 200,000 3.6 2.7
Bolilands 145,000 2.7 2.0
Riverine Grassland 130,000 2.4 1.8
Total Arable Land 5,365,000 100.0 74.1
Other 1,870,000 - 25.9
Grand Land 7,235,000 - 100.0
A/ consist of basins with little drainage, covered with perennial grass b/ include 294 000 ha of forest reserve
Sources: Ministry of Agriculture, Special Programme for Food Security, 4 October 2001
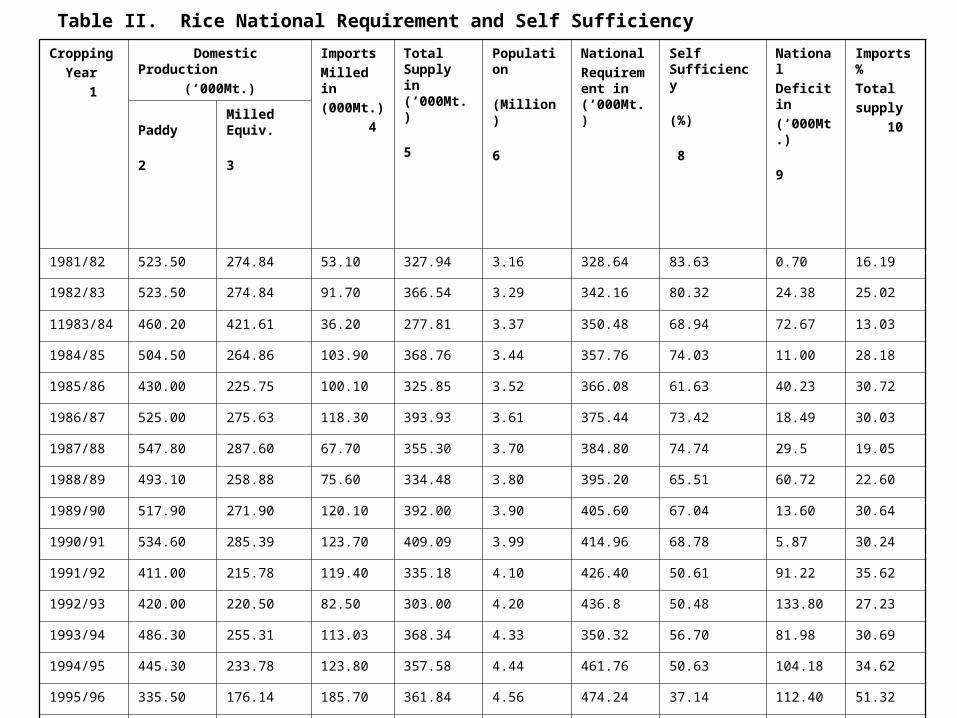
Table II. Rice National Requirement and Self Sufficiency
Cropping
Year
1
Domestic Production
(‘000Mt.)
Imports
Milled in
(000Mt.)
4
Total Supply in (‘000Mt.)
5
Population
(Million)
6
National
Requirement in (‘000Mt.)
Self Sufficiency
(%)
8
National
Deficit in
(‘000Mt.)
9
Imports %
Total
supply
10
Paddy
2
Milled Equiv.
3
1981/82 523.50 274.84 53.10 327.94 3.16 328.64 83.63 0.70 16.19
1982/83 523.50 274.84 91.70 366.54 3.29 342.16 80.32 24.38 25.02
11983/84 460.20 421.61 36.20 277.81 3.37 350.48 68.94 72.67 13.03
1984/85 504.50 264.86 103.90 368.76 3.44 357.76 74.03 11.00 28.18
1985/86 430.00 225.75 100.10 325.85 3.52 366.08 61.63 40.23 30.72
1986/87 525.00 275.63 118.30 393.93 3.61 375.44 73.42 18.49 30.03
1987/88 547.80 287.60 67.70 355.30 3.70 384.80 74.74 29.5 19.05
1988/89 493.10 258.88 75.60 334.48 3.80 395.20 65.51 60.72 22.60
1989/90 517.90 271.90 120.10 392.00 3.90 405.60 67.04 13.60 30.64
1990/91 534.60 285.39 123.70 409.09 3.99 414.96 68.78 5.87 30.24
1991/92 411.00 215.78 119.40 335.18 4.10 426.40 50.61 91.22 35.62
1992/93 420.00 220.50 82.50 303.00 4.20 436.8 50.48 133.80 27.23
1993/94 486.30 255.31 113.03 368.34 4.33 350.32 56.70 81.98 30.69
1994/95 445.30 233.78 123.80 357.58 4.44 461.76 50.63 104.18 34.62
1995/96 335.50 176.14 185.70 361.84 4.56 474.24 37.14 112.40 51.32
1996/97 391.70 205.60 171.02 376.66 4.67 485.68 42.34 109.02 45.40
1997/98 411.30 215.93 28.90 244.83 4.76 495.04 43.62 250.21 11.80
1998/99 371.84 195.22 249.1 444.32 4.88 507.52 38.47 63.2 56.06
1999/2000 247.20 129.78 93.51 223.29 4.90 509.60 25.87 286.3 41.88
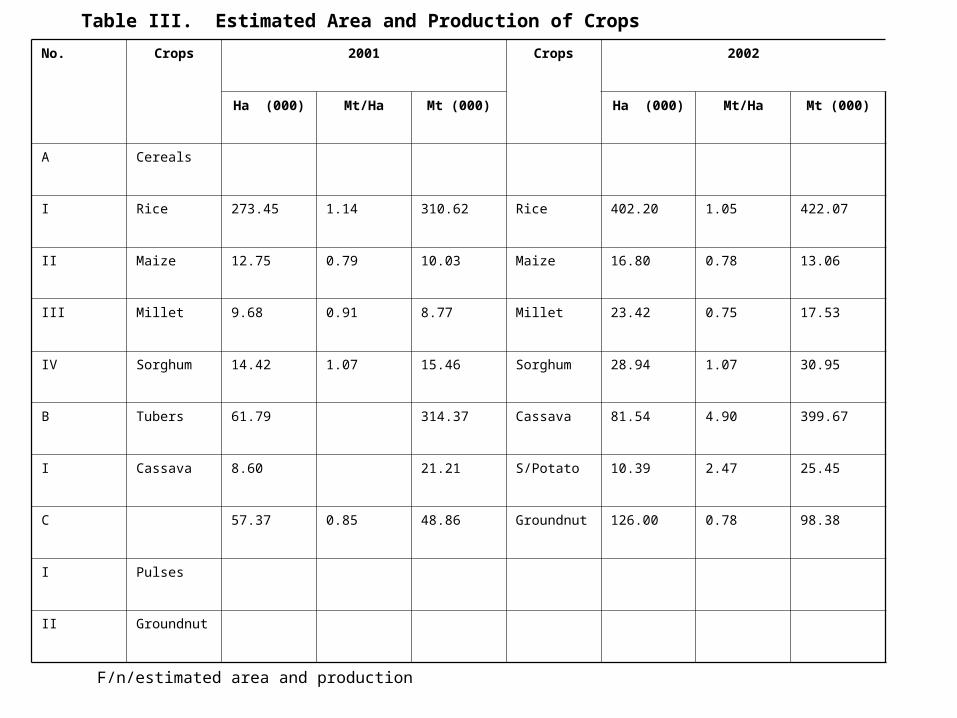
Table III. Estimated Area and Production of Crops
No. Crops 2001 Crops 2002
Ha (000) Mt/Ha Mt (000) Ha (000) Mt/Ha Mt (000)
A Cereals
I Rice 273.45 1.14 310.62 Rice 402.20 1.05 422.07
II Maize 12.75 0.79 10.03 Maize 16.80 0.78 13.06
III Millet 9.68 0.91 8.77 Millet 23.42 0.75 17.53
IV Sorghum 14.42 1.07 15.46 Sorghum 28.94 1.07 30.95
B Tubers 61.79 314.37 Cassava 81.54 4.90 399.67
I Cassava 8.60 21.21 S/Potato 10.39 2.47 25.45
C 57.37 0.85 48.86 Groundnut 126.00 0.78 98.38
I Pulses
II Groundnut
F/n/estimated area and production

Table IV. Production of Major Food Crops (1987 – 2001)
Item Year Mt 1000
1987/88 1988/89 1989/90 1990/91 1991/92 1992/93 1993/94 1994/95 2000/2001
Paddy 549.9 493.1 517.8 543.7 411.1 420.0 486.3 445.3 310.6
Maize 11.0 11.4 11.7 12.3 11.0 10.0 9.6 8.6 10.0
Millet 22.0 22.0 22.0 24.0 22.0 22.0 21.0 28.0 8.7
Sorghum 19.0 19.0 20.0 21.0 22.0 22.0 21.0 25.0 15.4
Cassava 133.0 147.7 174.2 182.4 163.4 203.4 240.5 243.5 314.4
Sweet Potato 32.6 33.6 35.6 38.8 40.8 34.8 39.5 43.9 21.2
Groundnuts 21.7 25.7 28.5 30.0 34.0 31.0 37.8 39.8 48.9
Beans 35.0 35.0 37.0 38.0 39.0 38.0 37.0 40.0 NA
Sources: Ministry of Agriculture, Special Programme for Food Security, National Programme Document, 4 October2001 and MAFS Crops Survey of 2001