policies and strategies for increased biomass and bioenergy use in the united states helena li chum...
TRANSCRIPT

Policies and Strategies for Increased Biomass and Bioenergy Use in the
United States
Helena Li ChumNational Renewable Energy Laboratory,
Golden, Colorado, USA
February 2002Conference on Sustainability in Energy Production and Utilization
in Brazil: The Next Twenty Years, UNICAMP, Sao Paulo, Brasil

Outline
• Context – R&D – Portfolio of incentives
• Retrospective of 25 Years• Role of Biomass, Bioenergy and
Biobased Products for a Sustainable Future

USA Renewable Energy 2000

Energy Health
Defense
Carter BushReagan Clinton PresidentBush

197800.51.52.52.03.0
1.019931983
NuclearOil, Gasand Shale Coal
Renewables
Budget Year1988 1998Billion Dollars (1999)
1978GeothermalHydroelectric and OtherBiomass and Biofuels
Wind, Photovoltaicand Other Solar
00.40.80.61.0
0.2 19931983 Budget Year1988 1998Billion Dollars (1999)
Billion Dollars (1999)
Policy2b
19780
0.5
1.5
2.5
2.0
3.0
1.0
19931983
Nuclear
Oil, Gasand Shale
Coal
Renewables
Budget Year1988 1998
Billio
n D
ollars
(199
9)
1978
Geotherm al
Hydroelectric and O ther
Biomass and B iofuels
W ind, Photovoltaicand Other Solar
0
0.4
0.8
0.6
1.0
0.2
19931983Budget Year
1988 1998
Bill
ion D
olla
rs (199
9)
Bill
ion D
olla
rs (199
9)
Po lic y2 b
Million Dollars (1999)
78 1980050100150200250
1985
Transportation
Unallocated FEMPIndustrialBuilding Technology
1990 1995 1999Budget Year policy2d
19780
400600800
200 19931983 Budget Year
Advanced Clean Fuels (Coal)
Advanced Research Technology (Coal) Clean Coal TechnologyAdvanced PowerSystems(Coal)Petroleum& SyntheticFuelsNatural Gas 1988 1998Million Do
llars (1999)
p o lic y2d
19780
400
600
800
200
19931983Budget Year
Advanced C lean Fuels (Coal)
Advanced R esearch Techno logy (Coal)
C lean C oal Technology
Advanced Pow er
System s(Coal)
Petroleum& S ynthetic
Fuels
Natural G as
1988 1998
Millio
n D
ollars
(1999)
Comparative U.S. DOE R&D Funding for Energy Technologies
Federal Financial Interventions and Subsidies in Energy Markets: Primary Energy. SR/01AF/99-03 Washington D.C., USA, Energy Information Administration, 1999. (www.eia.doe.gov/fuelrenewable.html); Federal Financial Interventions and Subsidies in Energy Markets1999: Energy Transformation and End Use. SR/01AF/2000-02 Washington D.C., USA, Energy Information Administration 2000. (www.eia.doe.gov/fuelrenewable.html)
12%RE $

$0
$20
$40
$60
$80
$100
$120
$140
77 79 81 83 85 87 89 91 93 95 97 99
Fiscal Year
Mill
ion
200
0 $
Biobased Products - includes Forest Products and Agriculture
Energy from Municipal Waste-EMW
Alcohol Fuels R&D & Market Development
Biomass, Biofuels, Biopower, Bioenergy
DOE Bioenergy and Biobased ProductsKey policies shifted periodically
• Reduce dependence ofenergy imports - mainly oil
• Resolve supply and demand imbalances with market forces &supporting government policies• Move to R&D role
• Increase renewable energy and energy efficiency priority• Cost-share R&D throughpublic-private partnerships
Carter BushReagan ClintonPresident

Land PlantsFresh water
PlantsSea water
Plants
Technical Processes
BiologicalProcesses
Wolfdraw.cdr
Bio logicalPhotosynthesis
TechnicalPhotosynthesis Photolysis
Hydrogen
Food
Agriculture Forestry Fishery
Feed ConstructionMaterial
Chemical RawMaterial
Wastes
Energy Resource
Bio logical Conversion
to M ore D esirable Fuel Form
M ethane Hydrogen
DirectCom bustion
Pyrolysis
Low Btu Gas
Heavy O ils Char
Hydrogenation
High Btu Gas Oil
Solar Energy
Wolf, M. (1974). Utilization of Solar Energy by Bioconversion - An Overview. Subcommittee on Energy, Washington, D.C., Congress of the United States: 2 - 23. Used to guide the NSF Research Applied toNational Needs that generated the programs onFuels from Biomass in FEA/ERDA/DOE (1974-1977)
1974

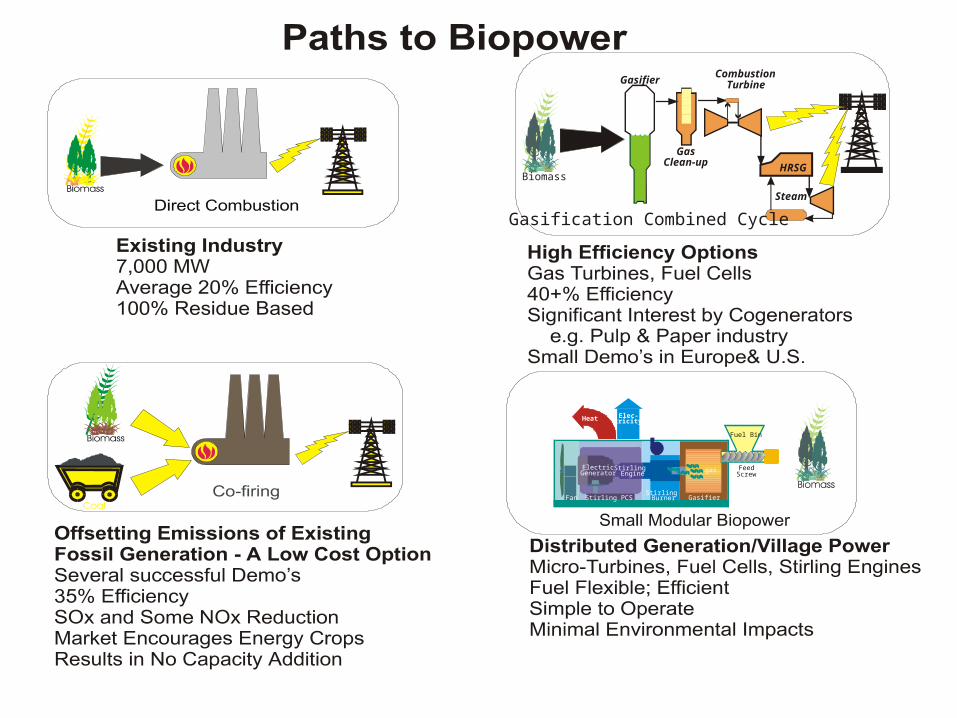
Biomass: 2000
Fuels
Primarily Ethanol from lignocellulosic
Heat, Electricity, Combined Heat and Power
Chemical ProductsForest/Paper
Products
Hydrogen from Renewables a Separate Program

Bioenergy Pathways - 2000
Resource Transformation Marketplace
Co-firing
&
Bioprocess
AdvancedTurbine
Fuel Cells
SNGDMEH2
Fischer TropschLiquids
Mixed Alcohols
Methanol
MTG
Ethanol
Fermentation
Chemicals
Direct Combustion
LignocellulosicCrops orResidues
Electricity
Gasification
HydrolysisDedicatedCrops

Biomass Feedstocks – DOE/ORNL andCollaborators
Species Studied
1977-1983 1985 1991
>100 woody species
screened
25 woody species
experimentaltrials 2 woody
modelspeciesselected
35 herbaceous species
screened
1 herbaceous model
speciesselected
1984-1990
Time

Protein Engineering at DOE/NREL
•Discovery of thermal tolerant enzymes: cellulases and xylanases
• 2 - endoglucanase patents• 1 - -D-glucosidase patent• 1 - dextranase patent• 1 - exoglucanase patent (filed)
A. cellulolyticus EI
B. Adney, M. Himmel 1996J. Sakon 1997
J. Sakon 1999J. Baker M. Himmel 1999
Ki EIwt = 2 mM CB
Ki EI245G = 30 mM CB
•Site Directed Mutagenesis–Acidothermus EI and T. reesei CBH I
Yellowstone Natl ParkProspecting early ’80sPermit #2621YELL
More than 200 peer reviewed papers20 patents and applications
Several awards

Systems ApproachesThe Salix Project
Location: Dunkirk and Geneva NY
Project Details 2 x 10.0 M W biom ass additions to 100 M W coal fired bo ilers
Feedstocks: u rban and w ood res idues increasing contribu tion of dedicatedfeedstock supply - hundreds o f acres
sa lix
Environmental, Ecological, Institutional and Life Cycle

Biomass Power Life Cycle Greenhouse Gas Emissions
-600
-400
-200
0
200
400
600
800
1000
1200
-150
-100
-50
0
50
100
150
200
250
300
350
g C
O2-
equi
v / k
Wh
g C
arbo
n-eq
uiv
/ kW
h
DedicatedBiomass
IntegratedGasificationCombined
Cycle
AveragePulverized
CombustionCoal
Coal/biomasscofiring (15%)
Direct-firedBiomass ResidueCurrent industry
Natural gascombined cycle
Mann, M. K.; Spath, P. L. (2001). Comparison of the Environmental Consequences of Power from Biomass, Coal, and Natural Gas. Kyritsis, S., et al., eds. 1st World Conference on Biomass for Energy and Industry: Proceedings of the Conference held 5-9 June 2000, Sevilla, Spain. London, UK: James & James Ltd.; Vol. I: pp. 65-68
a

January 2001
Biomass ResearchAnd Development
Board Created in 1999
in responseto Executive Orderand the BiomassResearch and
Development Act of 2000.
Biomass R&D TechnicalAdvisory Panel started
in 2000See http://www.bioproducts-bioenergy.gov/
Increased FederalGovernment Coordination

From Inventory of FY98R&D Activities: $253 MiDOE + USDA = $228 Mi
DOE = $108 MiUSDA = $120 Mi
Key Agencies

Portfolio of Non-R&D Actions
• Payments either directly to consumers or producers or indirectly through energy excise taxes foregone;
• Reduced taxes through preferential tax rates, tax credits (R&D expenses offsetting taxes), tax deferrals, and income-reducing measures;
• Investment incentives such as accelerated capital depreciation;
• A variety of loan programs;• A number of voluntary programs with industry;• Use of the federal government purchasing power to
increase biomass and bioenergy use.

1971
500
0
1000
2000
3000
1500
2500
3500
Industry
Com m ercial
M SW & LFG
Residential
EthanolUtility
1975 1980
Year B iom assp rim ary
1985 1990 1995 1999
CleanAirAct
Amend.
1000 Peta Joules = 1 Exa Joule =0.95 Quads
OTA (1981). Energy from Biological Processes. Washington, D.C., Congress of the United States, Office of Technology Assessment: p 113. EIA (2000). Renewable Energy Annual 1999. DOE/EIA 0603(99) Washington D.C., USA, 117. (www.eia.doe.gov/fuelrenewable.html)
PublicUtility
RegulatoryPolicy
ActPURPA
Crude OilWindfallProfitsTax Act
EnergyPolicy
ActEPAct
TransportationEquity
Act
EnergyTax Act
EnergyConservation &Reauthorization
Act
BiomassR&DAct of2000

Examples of Bioenergy and Biobased Products Facilities

Bioenergy Electricity Generation, 1981 - 1997
0
2,000
4,000
6,000
8,000
10,000
12,000
1981 1983 1985 1987 1989 1991 1993 1995 1997
Year
Cap
acit
y, M
W
0.0
10.0
20.0
30.0
40.0
50.0
60.0
70.0
Gen
erat
ion
, T
Wh
Ref: EIA, Annual Energy Review 1997, Renewable Energy Annual 1995
700,000 MWUS capacity
3,000 TWhUS generation
Brazil: 350 TWh; Portugal: 39 TWh; UK: 343 TWh
Bi kWh=TWh
$15 billion capital
66,000 jobs
IPP
PURPACreated
Market Certainty

California’s 20 years of BioPower
NNNNNNF
gas
Elec-tricityHeat
Fan
ElectricGenerator
StirlingBurner Gasifier
FeedScrew
Fuel Bin
Stirling PCS
StirlingEngine
Biomass
Gasifier
GasClean-up
CombustionTurbine
Steam
HRSG
Gasification Combined Cycle

Historical U.S. Ethanol Consumption
0.00
0.02
0.04
0.06
0.08
0.10
0.12
1981 1984 1987 1990 1993 1996
Year
Ref: Energy Information Administration, http://www.eia.doe.gov/pub/energy.overview/aer98/txt/aer1003.txt
6-7 billion6-7 billionLitersLiters
1% gasoline1% gasoline
• Capacity 2000Capacity 20009 billion Liters9 billion Liters
• 2010 projected2010 projectedcapacitycapacity
12 billion Liters12 billion Liters
Ethanol in Ethanol in BrazilBrazil10-15 10-15
billion Litersbillion Liters
45 firms$3 billion invested
40,000 jobsReplaceReplaceMTBE?MTBE?
Quads

Ethanol and Corn TrendsPartial Waiver of Excise Taxes Continues Through 2007

Bioethanol Production
+ =
“Cooking” catalyst
+ heat+
time
sugarsand
residual solids
(lignin)
ethanolfermentationand recovery
ligninutilization(boiler fuel)
Decouple sugar cost from commodity food marketLower production cost

Alternative-Fueled Vehicles by Type - Year 2000
LPG
CNG
LNG
MeOH 85%
MeOH
EtOH 85%
EtOH 95%
Electricity
Total Number: 432,000/220 million vehicles
EPAct 1992

Replacement of boilers at the equipment Replacement of boilers at the equipment replacement time with integrated gasification replacement time with integrated gasification combined cycle could make the industry an combined cycle could make the industry an exporter of up to 30GW by 2030exporter of up to 30GW by 2030
- RD&D- RD&D- support of demonstration- support of demonstration-1st of a kind commercial1st of a kind commercial
-Several conceptsSeveral concepts- Lower cost learning - Lower cost learning curve curve
Agenda 2020American Forest &Paper Association

EPA (2001). Basic Facts - Municipal Solid Waste, Office of Solid Waste Information. 2001.
www.epa.gov/epsoswer/non-hw/muncpl/facts.htm

Summary of Key Bioenergy Federal Subsidies -- 1999
Type Amount,
million 2000 $
Use/Uptake by Private
Sector*
Renewable Energy Production Incentive (direct expenditure)
$2.6 Wood residues & landfill gas. Year to year appropriation – considered less effective than others
Internal Revenue Code, Section 29 Tax Credits
$4.0 Alternative fuel (non-conventional) production credit - effective
Alcohol Fuel Credit $15 -- Somewhat effective production credit
Revenue loss estimate for the partial exemption from Excise Tax for Alcohol Fuels
$680-$725
Primarily used for ethanol – very effective in driving increased production. This revenue loss is offset by less direct govt payment to farmers due to increased grain consumption*EIA/SR/01AF/99-03, Federal Financial Interventions and Subsidies in Energy Markets 1999:
Energy Transformation and End Use, 2000; Renewable Energy 2000: Issues and Trends, Feb 2001, DOE/EIA –0628 (2000).GAO/RCED-00-301R Tax Incentives for Petroleum and Ethanol Fuels, 2000

Tax Incentives for Ethanol Fuels Created Market Certainty
Tax IncentiveExpressed as Federal Outlay Equivalents
Summed over
Years
Adjusted to
2000$
Ethanol – Partial exemption from the excise tax for alcohol fuels
1979-2000 $7.5 to $11 billion(Treasury or Joint Committee on Taxation calculations). This revenue loss is offset by less direct govt payment to farmers due to increased grain consumption
Income Tax Credits for Alcohol Fuels
1980-2000 $198-$478 million(Treasury or Joint Committee on Taxation calculations)
Petroleum industry excess of percentage over cost depletion
1968-2000 $82 billion
Petroleum industry expensing of exploration and development cost
1968-2000 $42-$54 billion(Treasury or Joint Committee on Taxation calculations)
Alternative (non-conventional) Fuel Production Credit
1980-2000 $8.4-$10.5 billion(Treasury or Joint Committee on Taxation calculations)GAO/RCED-00-301R Tax Incentives for Petroleum and Ethanol Fuels, 2000
Foss
il Fu
els
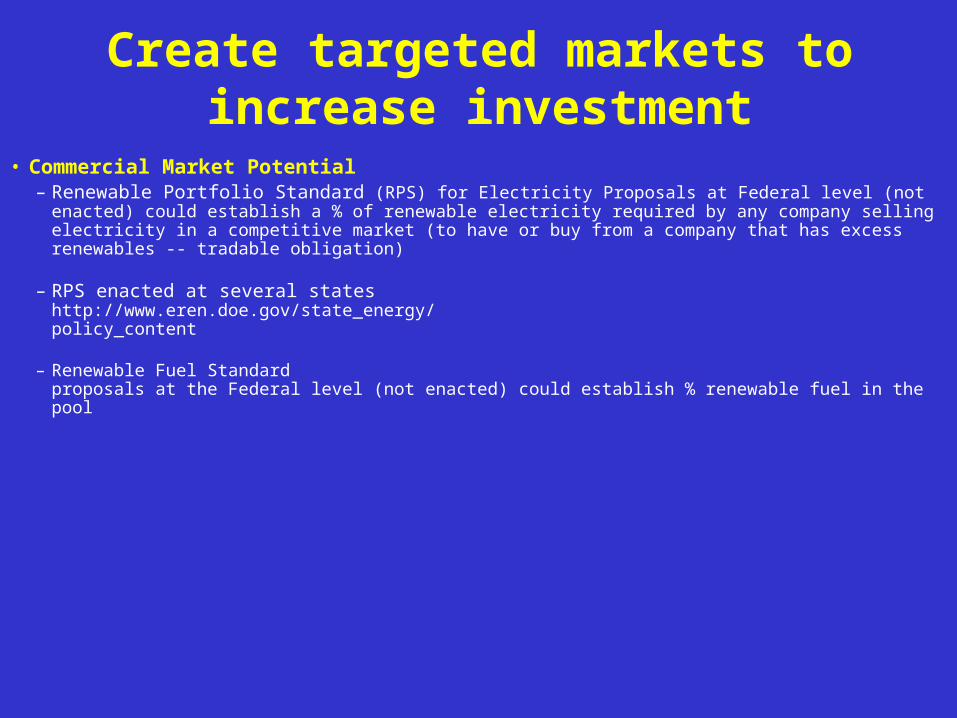
Create targeted markets to increase investment
• Commercial Market Potential– Renewable Portfolio Standard (RPS) for Electricity Proposals at Federal level (not enacted)
could establish a % of renewable electricity required by any company selling electricity in a competitive market (to have or buy from a company that has excess renewables -- tradable obligation)
– RPS enacted at several stateshttp://www.eren.doe.gov/state_energy/policy_content
– Renewable Fuel Standard proposals at the Federal level (not enacted) could establish % renewable fuel in the pool

States with Renewable Portfolio Standard
State Portfolio StandardConnecticut New Renewables: 0.5% by 7/1/2000 increasing by 0.25 %
each year through 7/2009.
Existing renewables increase from 5.5 percent to 7% by 2009.
Maine 30% standard.
Massachusetts 1% starting in 2003, increasing by 0.5% through 2009, and an additional 1% per year thereafter.
Nevada 0.2% and increasing to 1% by 2010, half of which is to come from solar power.
New Jersey 2.5% in 2000 increasing to 6.5% by 2012.
Pennsylvania 2% increasing by 0.5% annually subject to cost limitations.
Texas 2000 megawatts new renewable generating capacity by 2009 with 400 MW to be installed by 2003.
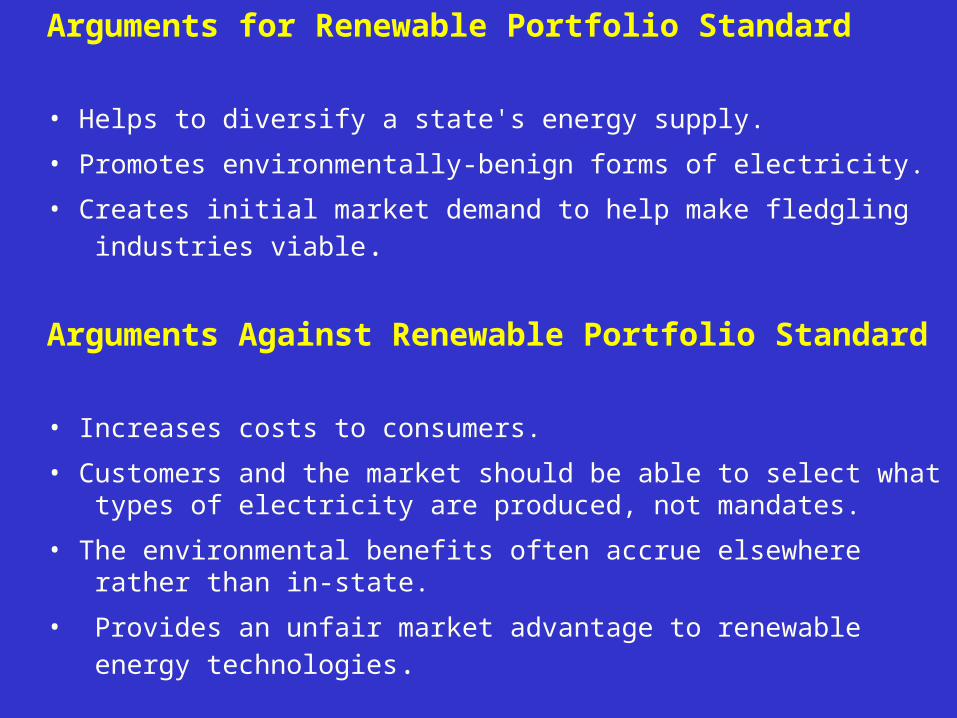
Arguments for Renewable Portfolio Standard
• Helps to diversify a state's energy supply.
• Promotes environmentally-benign forms of electricity.
• Creates initial market demand to help make fledgling industries viable.
Arguments Against Renewable Portfolio Standard
• Increases costs to consumers.
• Customers and the market should be able to select what types of electricity are produced, not mandates.
• The environmental benefits often accrue elsewhere rather than in-state.
• Provides an unfair market advantage to renewable energy technologies.

Outcomes of Government Actions 25 Years
• Primary Energy – doubled in 20 years• Electricity Production – tripled in 10 years• Ethanol Fuels Production – increased a factor of 16 in 20 years• Forest Products Energy Self-sufficiency increased by nearly
50% in 20 years. • Forest Products/Pulp and Paper Energy Intensity decreased initially and resumed increase in
the 1992-1998 period.• Overall Agriculture/Energy Interactions – complex (somewhat negative for soybean and
cattle; somewhat positive for poultry)• Municipal solid waste management --
– Safe and responsible. – Recycling rates tripled in 30 years. – Primary energy from MSW/landfills increased by a factor of
6 in 20 years.
• Significant emissions reductions, including carbon, and landfill reduction were achieved.• Significant economic development including rural.

National Renewable Energy Laboratory
Operated for the U.S. Department of Energy by M idwest Research Institute • Battelle • Bechtel
Bottom Line• Bioenergy - Biopower – Biofuels - Bioproducts
– Intersection of • Energy• Agriculture• Forestry• Environment• Regional/Municipal Residue Management• Chemical Industry Feedstocks• Economic Development
– Understanding and fostering important and productive interactions is key.– Outstanding scientific/technological progress
can help design sustainable integrated systems.
Policies, with multiple objectives to be achieved simultaneously,Policies, with multiple objectives to be achieved simultaneously,science, and technology can lead to sustainable use of the resourcescience, and technology can lead to sustainable use of the resource

References
• Helena L. Chum & Ralph Overend, “Biomass and Bioenergy in the United States”, in press Advances in Solar Energy Conversion (2002)
• Fostering the Bioeconomic Revolution in Biobased Products and Bioenergy,http://www.bioproducts-bioenergy.gov
• Helena L. Chum & R. Costello, 2001). Overview of Policies and Strategies for Biomass and Bioenergy in the United States. Kyritsis, S., et al., eds. 1st World Conference on Biomass for Energy and Industry: Proceedings of the Conference held 5-9 June 2000, Sevilla, Spain. London, UK: James & James Ltd; pp. 1248-1252
• Chum, H. L.; Overend, R. P. (2001). Biomass and Renewable Fuels. Fuel Processing Technology. Vol. 71(1-3), June 2001; pp. 187-195