polatuzumab vedotin with rituximab and bendamustine for
TRANSCRIPT

in collaboration with:
ID1576: Polatuzumab vedotin with rituximab and bendamustine for
treating relapsed or refractory diffuse large B-cell lymphoma
Produced by Kleijnen Systematic Reviews Ltd. in collaboration with Erasmus
University Rotterdam (EUR) and Maastricht University
Authors Nigel Armstrong, Health Economist, KSR Ltd
Nasuh Büyükkaramikli, Health Economics Researcher, Erasmus School
of Health Policy and Management, EUR, The Netherlands
Hannah Penton, Health Economics Researcher, Erasmus School of
Health Policy and Management, EUR, The Netherlands
Debra Fayter, Reviews Manager, Kleijnen Systematic Reviews Ltd, UK
Pim Wetzelaer, Health Economics Researcher, Erasmus School of Health
Policy and Management, EUR, The Netherlands
Isaac Corro Ramos, Health Economics Researcher, Institute for Medical
Technology Assessment, EUR, The Netherlands
Annette Chalker, Reviewer, Kleijnen Systematic Reviews Ltd, UK
Gill Worthy, Statistician, KSR Ltd
Janine Ross, Information Specialist, KSR Ltd
Robert Wolff, Reviews Manager, Kleijnen Systematic Reviews Ltd, UK
Maiwenn Al, Health Economics Researcher, Erasmus School of Health
Policy and Management, EUR, The Netherlands
Jos Kleijnen, Director, KSR Ltd, Professor of Systematic Reviews in
Health Care, Maastricht University
Copyright 2019 Queen's Printer and Controller of HMSO. All rights reserved
CONFIDENTIAL UNTIL PUBLISHED
2
Correspondence to Nigel Armstrong, Kleijnen Systematic Reviews
Unit 6, Escrick Business Park
Riccall Road, Escrick
York, UK
YO19 6FD
Date completed 01/10/2019
Source of funding: This report was commissioned by the NIHR HTA Programme as project number
12/96/88
Declared competing interests of the authors
None.
Acknowledgements
None.
**********************************************************************************
**********************************************************************************
Copyright belongs to Kleijnen Systematic Reviews Ltd.
Rider on responsibility for report
The views expressed in this report are those of the authors and not necessarily those of the NIHR HTA
Programme. Any errors are the responsibility of the authors.
This report should be referenced as follows:
Armstrong N, Büyükkaramikli N, Penton H, Fayter D, Wetzelaer P, Corro Ramos I, Chalker A, Worthy
G, Ross J, Wolff R, Al M, Kleijnen J. Polatuzumab vedotin with rituximab and bendamustine for
treating relapsed or refractory diffuse large B-cell lymphoma: a Single Technology Assessment. York:
Kleijnen Systematic Reviews Ltd, 2019.
Contributions of authors
Nigel Armstrong acted as project lead, health economist and systematic reviewer on this assessment,
critiqued the clinical effectiveness and cost effectiveness methods and evidence and contributed to the
writing of the report. Nasuh Büyükkaramikli acted as health economic project lead, critiqued the
company’s economic evaluation and contributed to the writing of the report. Hannah Penton, Pim
Wetzelaer and Isaac Corro Ramos acted as health economists on this assessment, critiqued the
company’s economic evaluation and contributed to the writing of the report. Debra Fayter, Annette
Chalker and Robert Wolff acted as systematic reviewers, critiqued the clinical effectiveness methods
and evidence and contributed to the writing of the report. Gill Worthy acted as statistician, critiqued the
analyses in the company’s submission and contributed to the writing of the report. Janine Ross critiqued
the search methods in the submission and contributed to the writing of the report. Maiwenn Al acted as
health economist on this assessment, critiqued the company’s economic evaluation, contributed to the
writing of the report and provided general guidance. Jos Kleijnen critiqued the company’s definition of
the decision problem and their description of the underlying health problem and current service
provision, contributed to the writing of the report and supervised the project.
Copyright 2019 Queen's Printer and Controller of HMSO. All rights reserved

CONFIDENTIAL UNTIL PUBLISHED
3
Abbreviations
ADA Anti-drug antibodies
AE Adverse event
AF Acceleration factor
AIC Akaike information criterion
ALT Alanine aminotransferase
ANC Absolute neutrophil count
ASCO American Society of Clinical Oncology
ASCT Autologous stem cell transplant
ASH American Society of Haematology
AST Aspartate aminotransferase
AWMSG All Wales Medicines Strategy Group
bd/b.i.d Twice daily
BI Budget impact
BIC Bayesian information criterion
BNF British National Formulary
BOR Best overall response
BR Bendamustine plus rituximab
BSA Body surface area
BSC Best supportive care
BSH British Society of Haematology
CADTH Canadian Agency for Drugs and Technologies in Health
CAR-T Chimeric antigen receptor-T cell
CDF Cancer Drugs Fund
CDSR Cochrane Database of Systematic Reviews
CE Cost effectiveness
CEA Cost effectiveness analysis
CEAC Cost effectiveness acceptability curve
CHMP Committee for Medicinal Products for Human Use
CT Computed tomography
CI Confidence interval
CNS Central nervous system
CR Complete response
CRD Centre for Reviews and Dissemination
CrI Credible interval
CS Company’s submission
CSR Clinical study report
CHMP Committee for Medicinal Products for Human Use
CTCAE Common Terminology Criteria for Adverse Events (National Cancer Institute)
CUA Cost-utility analysis
DALY Disability-adjusted life year
DC Day case
DCR Disease control rate
Den Denominator
df Degrees of freedom
DLBCL Diffuse large B-cell lymphoma
DOR Duration of response
DPG Disease population group
DSU Decision Support Unit
ECG Electrocardiogram
ECOG Eastern Cooperative Oncology Group
ECOG-PS Eastern Cooperative Oncology Group performance status
EED Economic Evaluation Database
EFS Event-free survival
Copyright 2019 Queen's Printer and Controller of HMSO. All rights reserved
CONFIDENTIAL UNTIL PUBLISHED
4
EHA European Haematology Association
EMA European Medicines Agency
eMIT Electronic Market Information Tool
EORTC European Organisation for Research and Treatment of Cancer
EORTC QLQ-C30 European Organisation for Research and Treatment of Cancer quality of life
questionnaire
EPAR European public assessment report
EQ-5D European Quality of Life-5 Dimensions
EQ-5D-3L European Quality of Life-5 Dimensions, three-level scale
ERG Evidence Review Group
ESMO European Society for Medical Oncology
EUR Erasmus University Rotterdam
FDA Food and Drug Administration
5-FU 5-Fluorouracil
G-CSF Granulocyte colony stimulating factor
GP General Practitioner
HAS Haute Autorité de Sante
HMRN Haematological Malignancy Research Network
HMRN Haematological Malignancy Research Network
HR Hazard ratio
HRQoL Health-related quality of life
HTA Health technology assessment
HTAi Health Technology Assessment International
IC Indirect comparison
ICD International Classification of Diseases
ICER Incremental cost effectiveness ratio
ICML International Conference on Malignancy Lymphoma
IDMC Independent data monitoring committee
INAHTA International Network of Agencies for Health Technology Assessment
Incr Incremental
INESSS Institut National D’excellence en services sociaux
INV Investigator
IPI International Prognostic Index
IRC Independent review committee
IRR Infusion-related reaction
ISPOR International Society for Pharmacoeconomics and Outcomes Research
ITT Intention to treat
IV Intravenous
KM Kaplan–Meier
KSR Kleijnen Systematic Reviews
LDH Lactate dehydrogenase test
LYGs Life years gained
LYO Lyophilised formulation
LYS Life year saved
MAH Marketing authorisation holder
MedDRA Medical Dictionary for Regulatory Activities
MeSH Medical subject headings
MHRA Medicines and Healthcare Products Regulatory Agency
mg Milligram
MR Minimal response
MRI Magnetic resonance imaging
MRU Medical resource utilisation
MTC Mixed treatment comparison
Copyright 2019 Queen's Printer and Controller of HMSO. All rights reserved

CONFIDENTIAL UNTIL PUBLISHED
5
MUGA Multiple-gated acquisition scan
NA Not applicable
NCCN National Comprehensive Cancer Network
NE Not estimable
NEL Non-elective inpatient
NES Non-elective short stay
NHL Non-Hodgkin lymphoma
NHS National Health Services
NICE National Institute for Health and Care Excellence
NIHR National Institute for Health Research
NR Not reported
Num Numerator
od Once daily
OR Odds ratio
ORR Overall response rate
OS Overall survival
PBAC Pharmaceutical Benefits Advisory Committee
PCT Primary Care Trust
PD Progressive disease
PET-CT Positron emission tomography – computed tomography
PFS Progression-free survival
PK Pharmacokinetic
PN Peripheral neuropathy
PMBCL Primary mediastinal B-cell lymphoma
Pola Polatuzumab vedotin
PR Partial response
PRESS Peer Review of Electronic Search Strategies
PRISMA Preferred Reporting Items for Systematic Reviews and Meta-Analyses
PRO Patient-reported outcome
PS Performance status
PSA Probabilistic sensitivity analyses
PSS Personal Social Services
QALY(s) Quality-adjusted life year(s)
PSSRU Personal Social Services Research Unit
QoL Quality of life
R Rituximab
RCT Randomised Controlled Trial
RECIST Response Evaluation Criteria In Solid Tumours
RePEc Research Papers in Economics
RGCVP Rituximab, gemcitabine, cyclophosphamide, vincristine and prednisolone
R-GDP Rituximab, gemcitabine, cisplatin and dexamethasone
R-GemOx Rituximab plus gemcitabine plus oxaplatin
RPSFTM Rank preserving structure failure time model
RR Relative risk; risk ratio
R/R Relapsed or refractory
SAE Serious adverse events
SC Subcutaneous
ScHARR School of Health and Related Research
sCR Stringent complete response
ScHARRHUD School of Health and Related Research Health Utilities Database
SCT Stem cell transplant
SD Standard deviation
SF-36 Short form 36
SHTAC Southampton Health Technology Assessments Centre
Copyright 2019 Queen's Printer and Controller of HMSO. All rights reserved

CONFIDENTIAL UNTIL PUBLISHED
6
SIGN Scottish Intercollegiate Guidelines Network
SLR Systematic literature review
SMC Scottish Medicines Consortium
SMDM Society for Medical Decision Making
SPC Summary of product characteristics
STA Single technology appraisal
UMC University Medical Centre
TA Technology appraisal
TCS Treatment continuation scheme
TEAEs Treatment-emergent adverse events
TESAEs Treatment-emergent serious adverse events
TINAS Therapy-Induced Neuropathy Assessment Scale
TLS Tumour lysis syndrome
TSD Technical Support Document
TTF Time to failure
TTOT Time to off treatment
TTP Time to progression
UK United Kingdom
ULM Upper limit of normal
US United States (of America)
USA United States of America
VEGF Vascular endothelial growth factor
VGPR Very good partial response
WHO World Health Organisation
WTP Willingness-to-pay
Copyright 2019 Queen's Printer and Controller of HMSO. All rights reserved

CONFIDENTIAL UNTIL PUBLISHED
7
Table of Contents
Abbreviations .................................................................................................................................... 3
Table of Tables ................................................................................................................................ 10
Table of Figures .............................................................................................................................. 12
1. EXECUTIVE SUMMARY ........................................................................................................ 13
1.1 Critique of the decision problem in the company’s submission .......................................... 13
1.2 Summary of the key issues in the clinical effectiveness evidence ...................................... 13
1.3 Summary of the key issues in the cost effectiveness evidence ............................................ 14
1.4 Summary of the ERG’s preferred assumptions and resulting ICER ................................... 17
1.5 Summary of exploratory and sensitivity analyses undertaken by the ERG ......................... 18
2. BACKGROUND......................................................................................................................... 21
2.1 Introduction ......................................................................................................................... 21
2.2 Critique of company’s description of underlying health problem ....................................... 21
2.3 Critique of company’s overview of current service provision ............................................ 21
3. CRITIQUE OF COMPANY’S DEFINITION OF DECISION PROBLEM ........................ 24
3.1 Population ............................................................................................................................ 27
3.2 Intervention .......................................................................................................................... 27
3.3 Comparators ........................................................................................................................ 29
3.4 Outcomes ............................................................................................................................. 30
3.5 Other relevant factors .......................................................................................................... 30
4. CLINICAL EFFECTIVENESS ................................................................................................ 31
4.1 Critique of the methods of review(s) ................................................................................... 31
4.1.1 Searches ........................................................................................................................ 31
4.1.2 Inclusion criteria ........................................................................................................... 31
4.1.3 Critique of data extraction ............................................................................................. 32
4.1.4 Quality assessment ........................................................................................................ 32
4.1.5 Evidence synthesis ........................................................................................................ 33
4.2 Critique of trials of the technology of interest, the company’s analysis and interpretation (and
any standard meta-analyses of these) .................................................................................. 33
4.2.1 Included studies ................................................................................................................... 33
4.2.2 Design of the included study ............................................................................................... 35
Copyright 2019 Queen's Printer and Controller of HMSO. All rights reserved
CONFIDENTIAL UNTIL PUBLISHED
8
4.2.3 Baseline characteristics ....................................................................................................... 36
4.2.4 Statistical analyses............................................................................................................... 38
4.2.5 Results ................................................................................................................................. 39
4.2.6 Adverse events .................................................................................................................... 45
4.2.7 Ongoing studies............................................................................................................. 50
4.3 Critique of trials identified and included in the indirect comparison and/or multiple treatment
comparison .......................................................................................................................... 51
4.4 Critique of the indirect comparison and/or multiple treatment comparison ........................ 51
4.5 Additional work on clinical effectiveness undertaken by the ERG ..................................... 51
4.6 Conclusions of the clinical effectiveness section ................................................................ 51
5. COST-EFFECTIVENESS ......................................................................................................... 53
5.1 ERG comment on company’s review of cost effectiveness evidence ................................. 53
5.1.1 Searches performed for cost effectiveness section ........................................................ 53
5.1.2 Inclusion/exclusion criteria ........................................................................................... 55
5.1.3 Identified studies ........................................................................................................... 56
5.2 Summary and critique of company’s submitted economic evaluation by the ERG ............ 60
5.2.1 NICE reference case checklist (TABLE ONLY) .......................................................... 64
5.2.2 Model structure ............................................................................................................. 64
5.2.3 Population ..................................................................................................................... 65
5.2.4 Interventions and comparators ...................................................................................... 66
5.2.5 Perspective, time horizon and discounting .................................................................... 67
5.2.6 Treatment effectiveness and extrapolation .................................................................... 68
5.2.7 Adverse events .............................................................................................................. 85
5.2.8 Health-related quality of life ......................................................................................... 87
5.2.9 Resources and costs ...................................................................................................... 92
6. COST-EFFECTIVENESS RESULTS .................................................................................... 104
6.1 Company’s cost effectiveness results ................................................................................ 104
6.2 Company’s sensitivity analyses ......................................................................................... 105
6.2.1 Probabilistic sensitivity analysis ................................................................................. 105
6.2.2 Deterministic sensitivity analysis ................................................................................ 107
Copyright 2019 Queen's Printer and Controller of HMSO. All rights reserved

CONFIDENTIAL UNTIL PUBLISHED
9
6.2.3 Scenario analyses ........................................................................................................ 108
6.2.4 Subgroup analysis ....................................................................................................... 112
6.3 Model validation and face validity check .......................................................................... 112
7. EVIDENCE REVIEW GROUP’S ADDITIONAL ANALYSES ......................................... 114
7.1 Exploratory and sensitivity analyses undertaken by the ERG ........................................... 114
7.1.1 Explanation of the company adjustments after the request for clarification ............... 114
7.1.2 Explanation of the ERG adjustments .......................................................................... 115
7.1.3 Additional scenarios conducted by the ERG .............................................................. 120
7.2 Impact on the ICER of additional clinical and economic analyses undertaken by the ERG
........................................................................................................................................... 121
7.2.1 Results of the ERG preferred base-case scenario........................................................ 121
7.2.2 Results of the ERG additional exploratory scenario analyses ..................................... 125
7.3 ERG’s preferred assumptions ............................................................................................ 129
7.4 Conclusions of the cost effectiveness section .................................................................... 133
8. END OF LIFE .......................................................................................................................... 136
9. REFERENCES ......................................................................................................................... 137
Appendix 1: Eligibility criteria for the systematic review ........................................................ 143
Appendix 2: Supplementary Information - Searching .............................................................. 145
Appendix 3: Summary of GO29365 study methodology ........................................................... 149
Appendix 4: Goodness of fit assessment of parametric survival models received with the
response to the clarification letter (*******************) .......................................... 153
Copyright 2019 Queen's Printer and Controller of HMSO. All rights reserved

CONFIDENTIAL UNTIL PUBLISHED
10
Table of Tables
Table 3.1: The decision problem........................................................................................................... 25
Table 4.1: Study details, GO29365 ....................................................................................................... 34
Table 4.2: Key demographic and baseline disease characteristics in GO29365 ................................... 36
Table 4.3: Efficacy outcome measures ................................................................................................. 38
Table 4.4: CR rate with PET at primary response assessment (IRC-assessed) ..................................... 39
Table 4.5: Progression-free survival (IRC-assessed) ............................................................................ 40
Table 4.6: Updated progression-free survival (IRC-assessed) .............................................................. 40
Table 4.7: Overall survival ................................................................................................................... 41
Table 4.8: Updated overall survival cut-off date ************* ....................................................... 42
Table 4.9: CR rate with PET at primary response assessment (IRC-assessed) endpoint, excluding the
16 patients who had received an ASCT (30 April 2018) ...................................................................... 43
Table 4.10: Objective response (CR/PR) rates by PET at primary response assessment (IRC-assessed)
endpoint, excluding the 16 patients who had received an ASCT (30 April 2018) ............................... 43
Table 4.11: Progression-free survival (IRC-assessed), excluding the 16 patients who had received an
ASCT (*************) ....................................................................................................................... 44
Table 4.12: Overall survival, excluding the 16 patients who had received an ASCT (latest data update)
(*************) .................................................................................................................................. 44
Table 4.13: Overview of safety profile in GO29365 ............................................................................ 46
Table 4.14: Overview of treatment-related adverse events in GO29365 .............................................. 47
Table 4.15: Most frequently reported adverse events (>10%) .............................................................. 48
Table 4.16: Most frequently reported Grade 3-5 adverse events (>5%) ............................................... 49
Table 4.17: Summary of deaths in GO29365 ....................................................................................... 50
Table 5.1: Data sources for the cost effectiveness and HRQoL systematic reviews ............................ 53
Table 5.2: Data sources for the cost and healthcare resource identification, measurement and valuation
.............................................................................................................................................................. 54
Table 5.3: Summary of included studies in the economic evaluations SLR ......................................... 57
Table 5.4: Summary of the company submission economic evaluation ............................................... 61
Table 5.5: NICE reference case checklist ............................................................................................. 64
Table 5.6: Baseline characteristics of the patients used in the model ................................................... 66
Table 5.7: Incidence of TRAEs included in the model (CTCAE ≥ Grade 3, serious) .......................... 86
Table 5.8: Adverse event disutility values and durations used in the model ........................................ 90
Table 5.9: Health state utility values for base-case ............................................................................... 92
Table 5.10: Drug acquisition costs and costs per cycle ........................................................................ 93
Copyright 2019 Queen's Printer and Controller of HMSO. All rights reserved

CONFIDENTIAL UNTIL PUBLISHED
11
Table 5.11: Drug administration tariffs and costs per cycle ................................................................. 95
Table 5.12: Supportive care unit costs .................................................................................................. 96
Table 5.13: Annual frequency of resource use in PFS and PD ............................................................. 98
Table 5.14: Per cycle supportive care costs for PFS and PD health states ......................................... 100
Table 5.15: Subsequent treatment costs based on GO29365 data....................................................... 101
Table 5.16: Unit costs of treatment-related AEs ................................................................................. 102
Table 6.1: Company base-case cost effectiveness results (discounted) .............................................. 104
Table 6.2: Summary of QALYs disaggregated by health state ........................................................... 104
Table 6.3: Summary of costs disaggregated by health state ............................................................... 104
Table 6.4: Summary of disaggregated costs by category .................................................................... 105
Table 6.5: Company base-case probabilistic cost effectiveness results (discounted) ......................... 105
Table 6.6: Scenario analyses conducted by the company ................................................................... 109
Table 6.7: Comparison of model median PFS and median OS vs. GO29365 .................................... 112
Table 6.8: Validation efforts undertaken by the company on the economic model ............................ 113
Table 7.1: Company base-case cost effectiveness results after clarification (discounted) ................. 114
Table 7.2: Company base-case probabilistic cost effectiveness results after clarification (discounted)
............................................................................................................................................................ 114
Table 7.3: Company and ERG base-case preferred assumptions........................................................ 117
Table 7.4: ERG base-case deterministic results (discounted) ............................................................. 121
Table 7.5: ERG base-case disaggregated discounted QALYs ............................................................ 121
Table 7.6: ERG base-case disaggregated costs ................................................................................... 122
Table 7.7: ERG base-case probabilistic results (discounted) .............................................................. 122
Table 7.8: ERG PFS scenario analyses ............................................................................................... 125
Table 7.9: ERG OS scenario analyses ................................................................................................ 126
Table 7.10: ERG treatment effect scenario analyses .......................................................................... 126
Copyright 2019 Queen's Printer and Controller of HMSO. All rights reserved

CONFIDENTIAL UNTIL PUBLISHED
12
Table of Figures
Figure 2.1: Proposed positioning of Pola+BR in the DLBCL treatment pathway ................................ 23
Figure 4.1: GO29365 study design schema (R/R DLBCL polatuzumab and BR populations only) .... 35
Figure 4.2: Updated Kaplan-Meier Curve for PFS by IRC .................................................................. 41
Figure 4.3: Updated Kaplan-Meier Curve for OS cut-off date ************* ............................ 42
Figure 4.4: Company subgroup analyses according to line of treatment .............................................. 45
Figure 5.1: Company model structure ................................................................................................... 65
Figure 5.2: Example of the how the cure-mixture model estimates OS by combining estimates
(illustration only) .................................................................................................................................. 69
Figure 5.3: PFS standard extrapolation functions (dependent fit, GO29365, Oct. 2018 cut-off) ......... 72
Figure 5.4: PFS standard extrapolation functions (independent fit GO29365, Oct. 2018 cut-off) ....... 73
Figure 5.5: PFS cure mixture model extrapolation functions (GO29365, October 2018 cut-off) ........ 74
Figure 5.6: Empirical hazard plots of the investigated PFS curves ...................................................... 76
Figure 5.7: OS standard extrapolation functions (dependent fit, GO29365, Oct. 2018 cut-off) ........... 78
Figure 5.8: OS standard extrapolation functions (independent fit GO29365, Oct. 2018 cut-off) ......... 78
Figure 5.9: OS cure-mixture model extrapolation functions (OS informed by PFS, from GO29365, Oct
2018 cut-off) ......................................................................................................................................... 79
Figure 5.10: OS cure-mixture model extrapolation functions (OS not informed by PFS, same OS for
not-long-term survivors, data from GO29365, Oct 2018 cut-off) ........................................................ 80
Figure 5.11: Base case PFS and OS extrapolations .............................................................................. 81
Figure 6.1: Scatterplot from the probabilistic sensitivity analysis ...................................................... 106
Figure 6.2: Cost effectiveness acceptability curve .............................................................................. 106
Figure 6.3: Tornado diagram – company’s preferred assumptions ..................................................... 107
Figure 7.1: ERG preferred cost effectiveness plane ............................................................................ 124
Figure 7.2: ERG preferred cost effectiveness acceptability curve ...................................................... 124
Copyright 2019 Queen's Printer and Controller of HMSO. All rights reserved

CONFIDENTIAL UNTIL PUBLISHED
13
1. EXECUTIVE SUMMARY
1.1 Critique of the decision problem in the company’s submission
The population defined in the National Institute for Health and Care Excellence (NICE) scope is ‘adults
with relapsed or refractory diffuse large B-cell lymphoma (R/R DLBCL) for whom hematopoietic stem
cell transplant is not suitable’. The company considered the following patients to be eligible for
polatuzumab vedotin with rituximab and bendamustine (Pola+BR):
• R/R patients who are clear non-candidates for transplant (unfit for intensive therapy based on
physician assessment), either as second-line treatment or as a third-line treatment and beyond
for patients who have relapsed following or are refractory to their last-line of therapy
• R/R patients who would be candidates for transplant but fail to respond to salvage therapy (and
are therefore transplant ineligible)
• R/R patients who receive salvage therapy and autologous stem cell transplant (ASCT) but
subsequently relapse
Patient numbers in the main trial in the company submission (CS) (GO29365) were too small to provide
meaningful subgroup results by type of patient or line of therapy.
Although the NICE scope specifies that the population is those for whom hematopoietic stem cell
transplant is not suitable, 16 of the patients in the included trial had received prior autologous stem cell
transplant (ASCT) and as seen above the company did consider this group to be relevant to the decision
problem. The company did provide some results excluding those patients in response to clarification.
Since it is not clear if patients who have undergone ASCT (and become ineligible because of that) are
part of the population eligible for Pola+BR in clinical practice, it is also unclear which results are most
appropriate. However, removal of those 16 patients only seems to improve outcomes.
The company is to supply polatuzumab vedotin in its lyophilised formulation. GO29365 used the liquid
formulation although two ongoing arms are to evaluate the lyophilised formulation. In the absence of
full evidence, the committee will need to decide if it is satisfied that the lyophilised formulation of
polatuzumab will have similar efficacy and safety to the liquid formulation.
Whilst the comparator in the main GO29365 trial is consistent with the scope, it seems likely that it is
not the only suitable one, rituximab plus gemcitabine plus oxaplatin (R-GemOx) also being likely to be
increasingly used in clinical practice. In the absence of direct evidence, it is not clear if R-GemOx can
be assumed to have equal efficacy and safety outcomes to BR.
1.2 Summary of the key issues in the clinical effectiveness evidence
The company conducted a systematic review to identify evidence relevant to this appraisal. They
considered 16 studies for inclusion (four RCTs, 12 observational studies). The Evidence Review Group
(ERG) examined the four RCTs identified and agreed that a network could not be constructed to inform
an indirect comparison between Pola+BR and other relevant treatments. Equally, in examination of the
observational studies a match-adjusted indirect comparison did not appear to be appropriate given the
differences identified by the company in populations and line of treatment across the studies.
Therefore, the only study presented in relation to clinical effectiveness was a Phase Ib/II, multicentre,
open-label trial (GO29365) of polatuzumab in combination with BR in patients with R/R DLBCL, and
polatuzumab in combination with bendamustine and obinutuzumab (BG) in patients with R/R follicular
Copyright 2019 Queen's Printer and Controller of HMSO. All rights reserved

CONFIDENTIAL UNTIL PUBLISHED
14
lymphoma (the latter not relevant to this appraisal). Issues relating to the population, intervention and
comparator in the trial have been discussed in the previous section.
GO29365 was randomised and was well conducted. It was, however, open label. Both patients and
healthcare professionals involved in their care were aware of treatment allocation. The ERG considers
the independent review committee outcome results to be more appropriate and has highlighted these in
the report. Although the trial was multinational, it was relatively small (40 patients were randomised
to Pola+BR) so the evidence on which results are based is limited. Three patients were included from
the UK. The company was asked to justify the applicability of the trial to UK clinical practice. They
stated that the baseline characteristics of the population of G029365 were similar to a UK study of
pixantrone in R/R DLBCL patients.1 The company also obtained advice from clinical experts who
‘confirmed that the baseline characteristics of patients enrolled in GO29365 are reflective of the
population seen in UK clinical practice and corroborates the comparison to the retrospective analysis’2
The ERG considered this reasonable but noted that non-white participants were underrepresented in the
trial and that most patients had Eastern Cooperative Oncology Group (ECOG status) of 0 or 1. The
ERG also noted that there were some baseline imbalances between the treatment groups including more
patients in the Pola+BR having a lower International Prognostic Index (IPI) score and more patients in
the BR group having bulky disease. Adjustment to overall survival (OS) was performed for both of
these factors, but not to progression-free survival (PFS) for bulky disease, which could favour Pola+BR.
Pola+BR showed superior results to BR in outcomes relevant to this appraisal. At 24 months there was
an increase in median PFS of approximately ********** and an increase in median survival of about
**********. Given the limited life expectancy of patients with relapsed or refractory DLBCL, the
intervention does meet end-of-life criteria specified by NICE. Adverse events were similar although
peripheral neuropathy was more frequently reported with Pola+BR. As yet no information is available
on long-term ‘cure’ rates and longer-term rarer adverse events. The trial is ongoing.
1.3 Summary of the key issues in the cost effectiveness evidence
To assess the cost effectiveness of polatuzumab vedotin (Pola), in combination with bendamustine and
rituximab (BR), compared to BR alone, the company developed a three-state partitioned survival model
that includes the following health states: progression-free, progressed disease and death. Transitions
between health states were informed by extrapolated survival curves for PFS and OS from the GO29365
trial. Patients started in the progression-free state, where they remained until progression or death. Upon
progression, patients either remained in the progressed disease state, or they died. After 2 years in the
progression-free state, patients were considered to have characteristics similar to the general population.
Therefore, age/sex adjusted general population utility values and zero healthcare resource use cost
values were assigned to those patients who did not progress in their first two years. Cost and health
outcomes were discounted at 3.5%.
In the progression-free state, patients received treatment according to time-to-off-treatment (TTOT)
data from GO29365. However, also a maximum number of six treatment cycles of three weeks was
applied for Pola+BR, as well as for BR. An additional scenario was performed to assess cost
effectiveness against a different comparator, R-GemOx. For R-GemOx, effectiveness was assumed
equivalent to BR, and a maximum number of three treatment cycles of three weeks was assumed. It is
unclear to what extent these assumptions, particularly that of equivalent effectiveness, reflect the actual
comparative effectiveness in clinical practice. Therefore, the ERG is cautious about the use of the R-
GemOx comparator in this model.
Copyright 2019 Queen's Printer and Controller of HMSO. All rights reserved

CONFIDENTIAL UNTIL PUBLISHED
15
The company base-case assumed cure-mixture models for both OS and PFS extrapolation. Instead of
using standard cure-mixture modelling codes available in statistical programs, the company developed
its own code, which was not transparent and clear enough for the ERG to assess the correctness of the
implementation of the methods in the provided code. The “cure” assumption of the company was based
on: literature from the natural history of newly diagnosed DLBCL patients, which suggested no
significant difference between the mortality of those patients event free at two years and the age- and
gender-matched general population; clinical expert opinion; the company’s observation of low risk of
relapse or death in the Kaplan–Meier (KM) plots for Pola+BR towards the end of follow-up and the
precedent for cure-mixture modelling accepted in previous NICE appraisals in R/R DLBCL patients.3-
5 However, the ERG felt that there was a lack of robust long-term evidence to be confident in a cure
assumption, especially given the small number of patients remaining alive and event free at the end of
a relatively short follow-up period. The ERG also note that the previous technology appraisals were for
Chimeric antigen receptor-T cell (CAR-T) therapies which represent a distinct form of therapy and
alternative literature suggests that excess mortality in DLBCL remains for at least five years. 6
Additionally, the company’s base-case assumptions of cure-mixture models led to OS and PFS hazard
ratios, which were not in line with the empirical hazard plots for OS and PFS from the GO29365 trial
and which conferred an overly optimistic treatment benefit, even decades after the treatment is received.
Therefore, the ERG explored alternative independent standard parametric survival extrapolation models
in their base-case and scenario analyses, and also a logical constraint was enforced, which ensured that
the OS extrapolation from the trial provided a lower survival estimate from the age/sex adjusted general
population at any given point time.
The ERG considered the company’s assumption of no excess mortality in DLBCL long-term survivors
compared to the general population to be overly optimistic. This assumption was based on a US study
by Maurer et al (2014) which found no statistically significant difference between the mortality of newly
diagnosed DLBCL who survived event free to two years and the age- and gender-matched general
population. 4 However a more recent study based on a substantially larger sample of DLBCL patients
suggests that excess mortality remains up to five years and that overall, DLBCL survivors are at excess
risk of mortality due to non-cancer causes as well as the risk of late relapse. 6 Therefore this excess
mortality due to non-cancer causes was incorporated into the ERG base-case.
Another important issue was the way the non-cancer background mortality was included in the model.
In contrast to the cohort-based approach followed for modelling the cancer-related progression and
death events, the company followed an individual patient-level approach while modelling the non-
cancer, background mortality risks. The economic model calculates the weighted mortality risk from
the individual age- and sex-matched specific mortality risks from a cohort of 160 patients (50%-50%
male-female, characterizing the age distribution of the GO29365 trial). This created an inconsistency,
as the relatively younger patients’ lifetable based survival estimates are taken into the weighted average,
hence leading to instances where a significant proportion is still alive after 40 or 50 years, which is not
realistic from a cohort modelling perspective, as the average age of the cohort was 69. Therefore, the
ERG switched to cohort based modelling for non-cancer background mortality risks.
Additional important sources of uncertainty in the model are the assumptions made regarding the health-
related quality of life (HRQoL) and costs of long-term survivors. In the company submission, the
argument of a lack of statistically significant excess mortality at two years, was extended to argue that
the HRQoL of DLBCL patients would be equivalent to that of the age- and gender-matched general
population after two years in the PFS state. When the ERG requested evidence specific to HRQoL, the
company provided two literature reviews which provided some support for equivalence in HRQoL in
long-term survivors.7, 8 However one of these explicitly specified that HRQoL between these two groups
Copyright 2019 Queen's Printer and Controller of HMSO. All rights reserved

CONFIDENTIAL UNTIL PUBLISHED
16
was more comparable after three years. 8 Given the parallel uncertainty regarding the assumption of
equivalent healthcare costs after two years, which have been previously noted in TA559, in the ERG
base-case the assumption of two years was extended to three years for both HRQoL and costs to provide
a more conservative estimate.
Adverse events (AEs) were incorporated for Pola+BR and BR based on incidences from GO29365, and
for R-GemOx based on findings from the study by Mournier et al., 2013. 9 The ERG identified several
inconsistencies between the AE incidences used in the model and the incidences presented in clinical
effectiveness section of this ERG report for the GO29365 trial, in terms of the number of serious AEs
reported in each treatment arm. Therefore, the ERG updated the model incidences to reflect the
incidences for the most frequently reported Grade 3-5 adverse events (>5%).
In response to a lack of HRQoL data collection in the GO29365 trial, the company conducted a thorough
literature search for relevant health state utility values. The base-case utility values, estimated from the
safety management population of the ZUMA-1 trial using the EQ-5D-5L were based on a small sample
(34 patients provided 87 observations) of mixed histology lymphoma patients. The progressed disease
value in particular was based on a very small sample as it was estimated from only five observations.
The patient characteristics of the members of the ZUMA-1 trial who provided HRQoL data were not
available and therefore it is unclear how similar this group were to the GO29365 population or the R/R
DLBCL patients who would be expected to receive polatuzumab in clinical practice. However, despite
these limitations, the ERG agrees that none of the alternative utility sources identified provided a better
alternative, when considering the alignment with the NICE reference case and therefore this source of
utility values was retained in the ERG base-case. Disutilities for those adverse events (AEs) included
in the model were appropriately sourced from previous appraisals in R/R DLBCL.
The economic analysis was performed from the National Health Service (NHS) and Personal and Social
Services (PSS) perspective and included state-specific costs for drug acquisition and administration,
treatment-related AEs, routine supportive care (professional and social services, health care
professionals and hospital resource use, treatment follow-up; for a maximum of two years), and
subsequent treatment costs. Healthcare unit costs were obtained from the National Audit Office 200810,
Personal Social Services Research Unit (PSSRU) 201811, and NHS reference costs.12 The frequencies
of healthcare resource use were primarily sourced from TA306.13 Drug costs were taken from the British
National Formulary (BNF) and electronic Market Information Tool (eMIT) databases. The dose
information was derived from the GO29365 trial, whereas for the R-GemOx, it was obtained from
Mounier et al.9 Administration and adverse event costs were mostly obtained from NHS reference costs
and percentage of the treatments used in the subsequent treatments were from the GO29365 trial and
clinical expert opinion.
The ERG was also concerned with several assumptions made in the company base-case regarding costs
and resource use. Polatuzumab is currently only available in 140 mg vials. However, in the company
base-case, the company also included 30 mg vials, stating that they plan to provide these from
*********. However, given that this statement is subject to uncertainty and no formal agreement is in
place, the ERG feel that the base-case should conservatively assume that the current situation will
remain. The ERG also felt that the costing of a maximum of six cycles of Pola+BR and BR, contrary to
the included TTOT data from the trial was incorrect. Since the treatment effectiveness from the trial is
based on the application of the treatment longer than six cycles, not including the costs of these
treatments beyond cycle six would create a bias. In the ERG base-case these treatments were costed
according to the TTOT data provided. The company also excluded the costs of stem-cell transplant
(SCT) and CAR-T treatment, despite these having been received by trial participants. The ERG feels
Copyright 2019 Queen's Printer and Controller of HMSO. All rights reserved

CONFIDENTIAL UNTIL PUBLISHED
17
that this was inappropriate and therefore attempted to include these costs in the ERG base-case. CAR-
Ts are currently available of the NHS only under confidential PAS and therefore the cost of SCT was
utilised for both treatments.
Alongside their clarification response the company submitted an updated model using data from the
latest data cut-off point of the clinical trial, corrected utility values for the proximity to death scenario,
corrected administration costs for R-GemOx and corrected AE incidences for R-GemOx. This resulted
in an updated company base-case incremental cost effectiveness ratio (ICER) of £25,307.
1.4 Summary of the ERG’s preferred assumptions and resulting ICER
The changes made by the ERG to the company base-case (after clarification) are described in
Section 7.1.2 and summarised below:
1. General population mortality based on “average patient” (i.e. cohort approach instead of
individual patient level approach).
2. OS from the general population with excess mortality must always be higher than or equal to
the OS extrapolations from the GO29365 survival data.
3. PFS extrapolation to independent review committee (IRC) data was selected from a standard
lognormal distribution independently fitted to both arms. OS extrapolation was selected from a
standard generalised gamma distribution independently fitted to both arms.
4. A standardised mortality ratio of 1.41 was applied to model excess mortality compared to age-
and gender-matched general population mortality.
5. The time point at which equivalence in HRQoL and costs with the general population was
changed from two to three years.
6. Acquisition costs of polatuzumab based on the current availability of vial sizes (140 mg vials
only, with no vial sharing).
7. Treatment costs for the Pola+BR and BR regimens were applied for as long as patients in the
trial received treatment (i.e. based on TTOT data) instead of up to a maximum of six treatment
cycles.
8. Costs for post-progression treatment with SCT and CAR-T, were based on the incidence that
follows from the trial data.
9. Adverse event incidences from the most frequently reported Grade 3-5 adverse events (Table
4.16 in the ERG report) were utilised in the model.
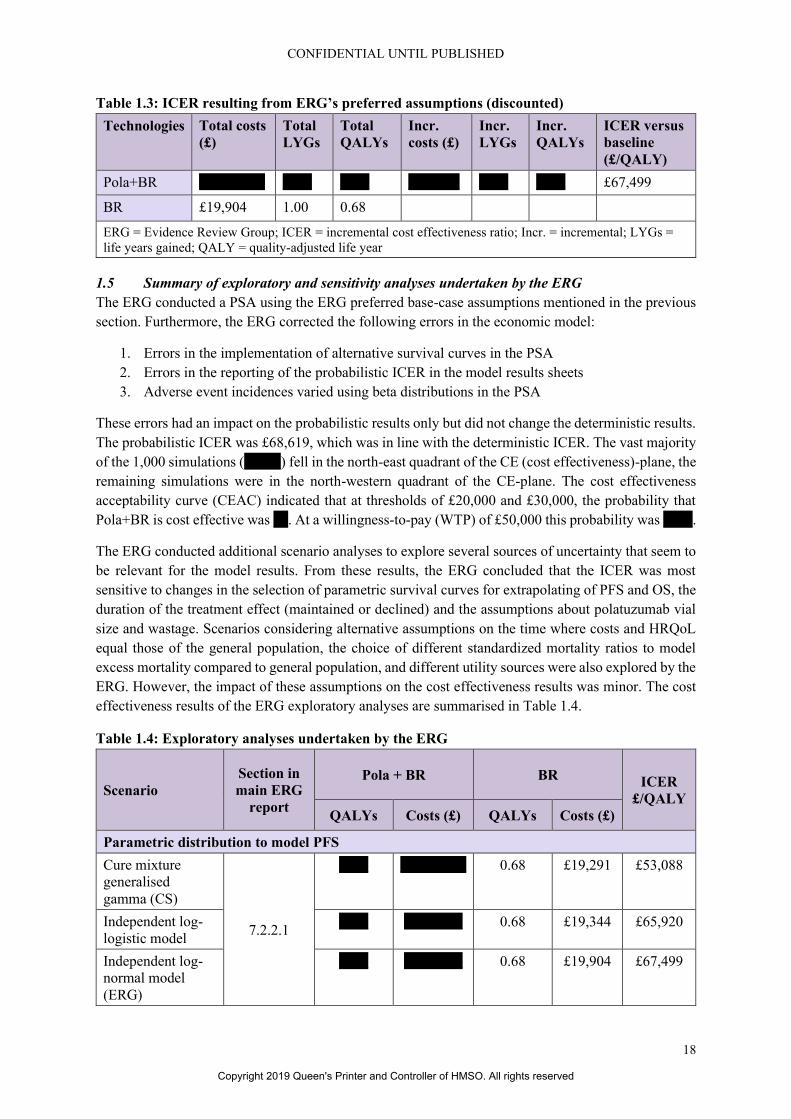
The discounted cost effectiveness results of the ERG preferred base-case are presented in Table 1.3.
The implementation of the ERG preferred assumptions resulted in Pola+BR generating **** more
quality adjusted life years (QALYs) than BR at higher costs (*******). The resulting ICER was
£67,499. Therefore, Pola+BR was not cost effective at a threshold ICER of £50,000 in the ERG base-
case. The assumption with the largest impact on the incremental ICER was changing the OS and PFS
extrapolations from cure-mixture models to standard independently fitted parametric models (using IRC
PFS data). This resulted in an ICER increased by £14,664. Calculating polatuzumab treatment costs
based on the currently available vial size (140 mg) increased the ICER by £12,851. Following a cohort
approach to model background mortality, instead of a patient-level approach, increased the ICER by
£10,480. All the other changes made by the ERG resulted in in changing the ICER with less than £3,000
(in absolute value). The base-case ICER in the company submission was £26,877. The ICER based on
the ERG preferred assumptions was £67,499.
Copyright 2019 Queen's Printer and Controller of HMSO. All rights reserved
CONFIDENTIAL UNTIL PUBLISHED
18
Table 1.3: ICER resulting from ERG’s preferred assumptions (discounted)
Technologies Total costs
(£)
Total
LYGs
Total
QALYs
Incr.
costs (£)
Incr.
LYGs
Incr.
QALYs
ICER versus
baseline
(£/QALY)
Pola+BR ********* **** **** ******* **** **** £67,499
BR £19,904 1.00 0.68
ERG = Evidence Review Group; ICER = incremental cost effectiveness ratio; Incr. = incremental; LYGs =
life years gained; QALY = quality-adjusted life year
1.5 Summary of exploratory and sensitivity analyses undertaken by the ERG
The ERG conducted a PSA using the ERG preferred base-case assumptions mentioned in the previous
section. Furthermore, the ERG corrected the following errors in the economic model:
1. Errors in the implementation of alternative survival curves in the PSA
2. Errors in the reporting of the probabilistic ICER in the model results sheets
3. Adverse event incidences varied using beta distributions in the PSA
These errors had an impact on the probabilistic results only but did not change the deterministic results.
The probabilistic ICER was £68,619, which was in line with the deterministic ICER. The vast majority
of the 1,000 simulations (*****) fell in the north-east quadrant of the CE (cost effectiveness)-plane, the
remaining simulations were in the north-western quadrant of the CE-plane. The cost effectiveness
acceptability curve (CEAC) indicated that at thresholds of £20,000 and £30,000, the probability that
Pola+BR is cost effective was **. At a willingness-to-pay (WTP) of £50,000 this probability was ****.
The ERG conducted additional scenario analyses to explore several sources of uncertainty that seem to
be relevant for the model results. From these results, the ERG concluded that the ICER was most
sensitive to changes in the selection of parametric survival curves for extrapolating of PFS and OS, the
duration of the treatment effect (maintained or declined) and the assumptions about polatuzumab vial
size and wastage. Scenarios considering alternative assumptions on the time where costs and HRQoL
equal those of the general population, the choice of different standardized mortality ratios to model
excess mortality compared to general population, and different utility sources were also explored by the
ERG. However, the impact of these assumptions on the cost effectiveness results was minor. The cost
effectiveness results of the ERG exploratory analyses are summarised in Table 1.4.
Table 1.4: Exploratory analyses undertaken by the ERG
Scenario
Section in
main ERG
report
Pola + BR BR ICER
£/QALY
QALYs Costs (£) QALYs Costs (£)
Parametric distribution to model PFS
Cure mixture
generalised
gamma (CS)
7.2.2.1
**** ********* 0.68 £19,291 £53,088
Independent log-
logistic model
**** ******** 0.68 £19,344 £65,920
Independent log-
normal model
(ERG)
**** ******** 0.68 £19,904 £67,499
Copyright 2019 Queen's Printer and Controller of HMSO. All rights reserved

CONFIDENTIAL UNTIL PUBLISHED
19
Scenario
Section in
main ERG
report
Pola + BR BR ICER
£/QALY
QALYs Costs (£) QALYs Costs (£)
Parametric distribution to model PFS
Cure mixture
generalised
gamma (CS)
7.2.2.2
**** ******** 0.66 £19,462 £63,867
Independent log-
normal model
**** ******** 0.65 £19,185 £82,399
Independent
generalised
gamma model
(ERG)
**** ******** 0.68 £19,904 £67,499
Treatment effect duration assumptions
Treatment effect
maintained (CS
and ERG BC)
7.2.2.3
**** ********* 0.68 £19,904 £67,499
Declining OS
treatment effect
duration
**** ********* 0.68 £19,904 £78,312
Declining PFS
treatment effect
duration
**** ********* 0.68 £19,904 £69,711
Declining OS and
PFS treatment
effect duration
**** ********* 0.68 £19,904 £81,245
Long-term survivor assumptions (time where costs and HRQoL equal the general population)
2 years (Company
BC)
7.2.2.4
**** ********* 0.68 £19,625 £66,151
3 years (ERG BC) **** ********* 0.68 £19,904 £67,499
5 years (Howlader) **** ********* 0.67 £20,115 £69,068
10 years **** ********* 0.67 £20,231 £70,523
Changing excess mortality compared to general population
SMR = 1
(Company BC)
7.2.2.5
**** ********* 0.68 £19,906 £66,662
SMR = 1.09
(Company SA)
**** ********* 0.68 £19,906 £66,845
SMR = 1.18 **** ********* 0.68 £19,905 £67,031
SMR = 1.41 (ERG
BC)
**** ********* 0.68 £19,904 £67,499
Source of utility values
TA559 (PFS=0.72
PD=0.65) (ERG
BC)
7.2.2.6
**** ********* 0.68 £19,904 £67,499
Copyright 2019 Queen's Printer and Controller of HMSO. All rights reserved

CONFIDENTIAL UNTIL PUBLISHED
20
Scenario
Section in
main ERG
report
Pola + BR BR ICER
£/QALY
QALYs Costs (£) QALYs Costs (£)
TA567 (PFS=0.83
PD=0.71)
**** ********* 0.74 £19,904 £63,353
TA306 (PFS=0.81
PD=0.60)
**** ********* 0.69 £19,904 £67,596
TA176 FAD
(PFS=0.76
PD=0.68)
**** ********* 0.71 £19,904 £65,085
Costs and resource use
140mg vial only
and no vial sharing
(ERG BC)
7.2.2.7
**** ********* 0.68 £19,904 £67,499
140 mg and 30 mg
vial sizes for
polatuzumab
vedotin available
(CS BC)
**** ******* 0.68 £19,904 £53,910
No wastage /
100% vial sharing
for polatuzumab
vedotin
**** ******* 0.68 £19,904 £51,574
ERG = Evidence Review Group; ICER = incremental cost effectiveness ratio, iDFS = invasive disease-free
survival; Incr. = incremental, PDRS = post-distant recurrence survival; QALY = quality-adjusted life years;
TP = transition probability
Copyright 2019 Queen's Printer and Controller of HMSO. All rights reserved

CONFIDENTIAL UNTIL PUBLISHED
21
2. BACKGROUND
2.1 Introduction
In this report, the ERG provides a review of the evidence submitted by Roche in support of polatuzumab
vedotin, trade name Polivy™, for patients with relapsed or refractory diffuse large B-cell lymphoma
for whom hematopoietic stem cell transplant is not suitable. In this section, the ERG summarises and
critiques the company’s description of the underlying health problem and the company’s overview of
the current provision of service. The information for this critique is taken from Document B of the
Company Submission (CS). 14
2.2 Critique of company’s description of underlying health problem
The health problem at the focus of this appraisal is a specific subtype of non-Hodgkin lymphoma
(NHL), diffuse large B-cell lymphoma (DLBCL). The company notes DLBCL comprises 30-58% of
NHL cases. 14 According to the CS, 14 5,510 new cases of DLBCL are identified in the United Kingdom
(UK) each year. 15 Five hundred and ninety-one patients are reported to be treated for relapsed or
refractory (R/R) per year, but are unsuitable for a stem cell transplant. 14 In the UK the median age at
diagnosis is 70 years old. 16
The CS 14 describes R/R DLBCL as having a poor prognosis with an estimated median survival of 10
months. The company emphasises age as being a relevant prognostic indicator, with patients over 65
years old having a poorer prognosis than younger patients. 14 Outcomes worsen further for patients who
are refractory at the first-line therapy stage, with a median overall survival of 6.3 months and 22% of
patients alive at two years. 14, 17
According to the CS, patients with DLBCL will typically note symptoms including a rapidly enlarging
symptomatic mass, typically a nodal enlargement, in the neck, abdomen, or mediastinum. 14 Symptoms
reported for 30% of patients include the systemic “B” symptoms such as fever, weight loss, and night
sweats, while 50% of patients experience elevated serum lactate dehydrogenase.
The company highlights the limited availability of data regarding the impact of quality of life (QoL) on
DLBCL patients. 14 However, the CS notes the relationship between patients with high grade NHL who
experience a lower QoL. This is attributed to the uncertainty of the prognosis of the disease, treatment
side effects, and relapse-related fears. 14, 18, 19 The QoL can be further impacted in patients who are R/R
at first-line treatment. The company emphasises that diminishing QoL and prognosis among R/R
DLBCL patients can increase the demand on further treatments and hospital or hospice services.14, 20
ERG comment: The ERG checked the references cited by the company and considers the company to
have provided an appropriate description of the underlying health problem of this appraisal.
2.3 Critique of company’s overview of current service provision
The company notes numerous treatment guidelines are available for DLBCL, including the NICE
clinical guideline (NG52) 21, the British Society for Haematology (BSH) 22, ESMO 23, and the National
Comprehensive Cancer Network (NCCN) 24. However, there are currently no universal guidelines in
place for R/R DLBCL. 14 Due to this, current clinical practice will likely vary according to location of
the treatment centre, the expertise of the health provider, and preference of the clinician and the
patient.14
The gold standard for the management of DLBCL is rituximab plus cyclophosphamide, doxorubicin,
vincristine, and prednisone (R-CHOP) regimen. However, in the event the R-CHOP regimen fails, a
Copyright 2019 Queen's Printer and Controller of HMSO. All rights reserved

CONFIDENTIAL UNTIL PUBLISHED
22
reported 20% of patients experience primary refractory disease, while 30% of patients relapse after
complete remission. 14, 25 The next step will be to determine if the patient is fit for salvage therapy or is
a suitable candidate for an autologous stem cell transplant (ASCT). Factors including age and fitness
will determine suitability for ASCT. However, in UK clinical practice, there is no guidance to assist in
assessing patients regarding suitability for intensive therapy.
Patients who are deemed suitable, or are borderline candidates, for ASCT will receive rituximab-based
salvage chemotherapy and eventually a high-dose regimen. Tolerance of and response to the treatment
is used to determine if ASCT is suitable for borderline candidates.
For patients who are suitable for salvage chemotherapy NICE recommends multi-agent
immunochemotherapy with rituximab with gemcitabine, dexamethasone and cisplatin (R-GDP). 21 The
company emphasises the evidence regarding superiority over different types of salvage therapy is
lacking. Patients in the UK typically receive platinum-based treatment regimens, R-GDP, R-DHAP, R-
ICE and R-ESHAP, with R-Gem-Ox being an option for older patients. If a patient fails salvage
chemotherapy, additional treatment options are limited.
For patients who are ineligible for ASCT after intensive therapy, palliative care is the typical treatment
approach. The company states that there is variability in the regimen and lists the rituximab and
rituximab-free regimens that may be used. Pixantrone monotherapy is recommended by NICE as a
third- or fourth-line option for adults with R/R DLBCL but the company state that, based on clinical
expert opinion, it is not widely used. CAR-T cell therapies may be offered to those who have had two
or more systemic therapies. However, patients may not be suitable for these treatments. Two CAR-T
therapies have recently been approved by NICE for use in the Cancer Drugs Fund (CDF).3, 5
The company concludes that there are no universally established therapies for R/R DLBCL patients
who are ineligible for ASCT. The company also highlights the need for treatment of patients who
relapse after ASCT.
The proposed position in the treatment pathway is shown in Figure 2.1. The company stated that the
following would be considered eligible for Pola+BR:
• R/R patients who are clear non-candidates for transplant (unfit for intensive therapy based on
physician assessment), either as second-line treatment or as a third-line treatment and beyond
for patients who have relapsed following or are refractory to their last-line of therapy
• R/R patients who would be candidates for transplant but fail to respond to salvage therapy (and
are therefore transplant ineligible)
• R/R patients who receive salvage therapy and ASCT but subsequently relapse
Copyright 2019 Queen's Printer and Controller of HMSO. All rights reserved

CONFIDENTIAL UNTIL PUBLISHED
23
Figure 2.1: Proposed positioning of Pola+BR in the DLBCL treatment pathway
Source: Figure 2 of the CS
ASCT = autologous stem cell transplant; CR = complete response; PR = partial response; R = rituximab
ERG comment
• The ERG considered that the company highlighted the need for new treatment options in this
difficult to treat group of patients.
• Although the company performed subgroup analysis for the different patient groups in the
pathway at the request of the ERG, numbers of patients were too small to be reliable.
• The company reiterated at clarification that patients who had received prior transplant (but have
since progressed) are within the expected marketing authorisation if they are not eligible for
another transplant at this point. However they stated that ‘It was not possible to perform a
subgroup analysis of patients who received pola+BR beyond third-line as these patients could
not be clearly defined.’2 The committee will need to consider if those patients who have
previously received an ASCT will form part of the population eligible for Pola+BR in clinical
practice.
Copyright 2019 Queen's Printer and Controller of HMSO. All rights reserved

CONFIDENTIAL UNTIL PUBLISHED
24
3. CRITIQUE OF COMPANY’S DEFINITION OF DECISION PROBLEM
The company’s decision problem is shown in Table 3.1.
Copyright 2019 Queen's Printer and Controller of HMSO. All rights reserved

Table 3.1: The decision problem
Final scope issued by NICE Decision problem addressed in
the company submission
Rationale if different from the
final NICE scope
ERG comment
Population Adults with relapsed or refractory
diffuse large B-cell lymphoma
for whom hematopoietic stem
cell transplant is not suitable.
As per final scope issued by
NICE
N/A The ERG consider that it
remains unclear if patients
who have undergone ASCT
(and become ineligible
because of that) are part of
the population eligible for
Pola+BR in clinical
practice.
Intervention Polatuzumab vedotin (with
rituximab and bendamustine)
As per final scope issued by
NICE
N/A In the absence of complete
evidence, the ERG
concludes that there is some
doubt as to whether the
lyophilised formulation of
pola will offer similar
efficacy and safety to the
liquid formulation when
used in clinical practice.
Comparator(s) Rituximab in combination with
one or more chemotherapy agents
such as:
R-GemOx (rituximab,
gemcitabine, oxaliplatin),
R-Gem (rituximab gemcitabine),
R-P-MitCEBO (rituximab,
prednisolone, mitoxantrone,
cyclophosphamide, etoposide
bleomycin, vincristine),
(R-)DECC (rituximab,
dexamethasone, etoposide,
chlorambucil, lomustine),
Rituximab in combination with
one or more chemotherapy
agents such as:
BR (bendamustine, rituximab).
R-GemOx (rituximab,
gemcitabine, oxaliplatin).
There is no clear standard of
care regimen for the population.
BR was the comparator in the
randomised phase II study
GO29365. It was not feasible to
conduct a robust treatment
comparison with other
comparator regimens in the
scope because of the limited
evidence available (section
B.2.9). Clinical opinion and the
limited data available suggest
that there is no significant
difference in outcomes between
In the absence of direct
evidence, it is not clear that
R-GemOx can be assumed
to have equal efficacy and
safety to BR. Furthermore,
it is also not clear that the
two comparators in the CS
are a reasonable reflection
of the comparators
currently used in practice.
Copyright 2019 Queen's Printer and Controller of HMSO. All rights reserved
CONFIDENTIAL UNTIL PUBLISHED
26
Final scope issued by NICE Decision problem addressed in
the company submission
Rationale if different from the
final NICE scope
ERG comment
BR (bendamustine, rituximab). the comparator regimens. A
scenario with an assumption of
equal efficacy of BR and R-
GemOx was implemented in the
economic model (section
B.3.2.3).
Outcomes The outcome measures to be
considered include:
overall survival
progression-free survival
response rates
adverse effects of treatment
health-related quality of life
As per final scope issued by
NICE
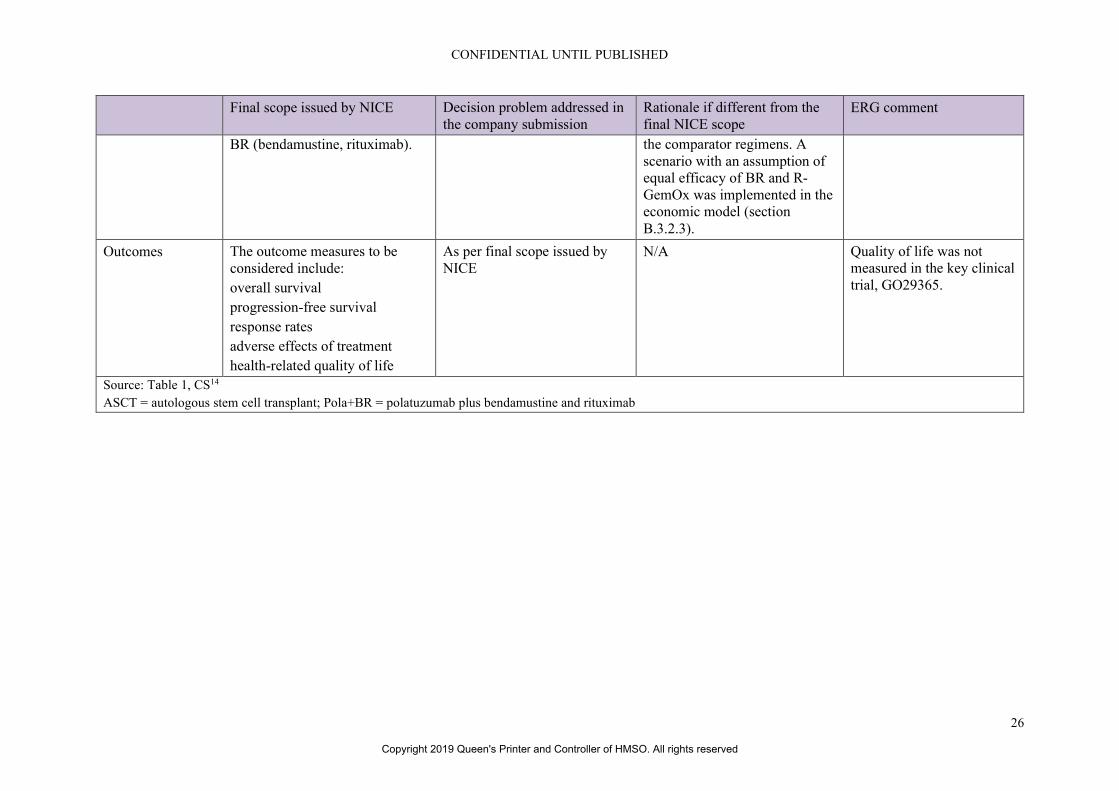
N/A Quality of life was not
measured in the key clinical
trial, GO29365.
Source: Table 1, CS14
ASCT = autologous stem cell transplant; Pola+BR = polatuzumab plus bendamustine and rituximab
Copyright 2019 Queen's Printer and Controller of HMSO. All rights reserved

3.1 Population
ERG comment: The population appeared to be consistent with that in the NICE scope which is adults
with relapsed or refractory diffuse large B-cell lymphoma for whom hematopoietic stem cell
transplant (SCT) is not suitable.26 However, the company submission (CS) stated, as indicated in
Figure 2 of the CS, that the position of polatuzumab vedotin with bendamustine, rituximab (Pola+BR)
includes those who have undergone autologous stem cell transplant (ASCT).14 In contrast, Appendix D
of the CS stated that studies were excluded from the systematic review of relevant clinical evidence if
they “…enrolled transplant eligible patients or transplant or chemotherapy relapsed patients” (p.17).27
Therefore, the company were requested in the clarification letter to:
• confirm that such patients are not within the NICE scope or the decision problem.
• conduct an analysis of the GO29365 trial, which excludes the 16 patients who had received an
ASCT.
The company confirmed that transplant-eligible patients were not within the NICE scope and the
decision problem. In GO29365, the main trial in the submission, the company clarified that ‘patients
who were eligible for ASCT or had completed ASCT within 100 days prior to Cycle 1 Day 1 were
excluded from the trial.’2 However, they stated that patients who had received prior transplant (but
have since progressed) are within the expected marketing authorisation if they are not eligible for
another transplant at this point. The ERG therefore consider that it remains unclear if such patients are
part of the population eligible for Pola+BR in clinical practice.
The company provided results of the GO29365 trial excluding the 16 patients who had received an
ASCT. These results are provided in Section 4.2.5. Unfortunately, despite request at the clarification
stage, the economic analysis was not updated with survival analyses excluding these patients.2
GO29365 enrolled 86 patients at 38 study sites in 11 countries including three patients from the UK.
The company was asked to justify the applicability of the trial to UK clinical practice. They stated that
the baseline characteristics of the population of G029365 were similar to a UK study of pixantrone in
R/R DLBCL patients.1 The company also obtained advice from clinical experts who ‘confirmed that
the baseline characteristics of patients enrolled in GO29365 are reflective of the population seen in UK
clinical practice and corroborates the comparison to the retrospective analysis’2 The ERG considered
this reasonable.
3.2 Intervention
As described in Table 2 of the CS, the anticipated marketing indication for Pola+BR is for the treatment
of adult patients with relapsed/refractory diffuse large B-cell lymphoma (DLBCL) who are not
candidates for haematopoietic stem cell transplant.14 The dosing is as follows:
Polatuzumab vedotin
• 1.8 mg/kg intravenous infusion (IV) on day 1
• The initial dose should be administered as a 90-minute infusion
• If well tolerated, subsequent doses may be administered as a 30-minute infusion
Bendamustine
• 90 mg/m2 IV on days 1 and 2
Copyright 2019 Queen's Printer and Controller of HMSO. All rights reserved

CONFIDENTIAL UNTIL PUBLISHED
28
Rituximab
• 375 mg/m2 IV on day 1
ERG comment: The intervention appeared to be as in the final scope. However, The CS states that
‘Data from the Phase Ib and the randomised Phase II portion of GO29365 was generated with a liquid
formulation of pola; however, a lyophilised formulation of pola suitable for commercialisation and use
in ongoing and future clinical studies was subsequently developed and two arms have been added to
the trial to assess this formulation.14 Therefore, the company were asked in the clarification letter to:
• provide a rationale for the two formulations.
• state which formulation of polatuzumab vedotin (pola) they expected to be administered in
clinical practice.
• justify the applicability of the randomised trial data to the efficacy and safety of the lyophilised
formulation.
Briefly, the company stated that ‘A lyophilised formulation of polatuzumab vedotin was developed to
enhance drug product stability and enable administration using standard IV bags and infusion sets.’
The company clarified that ‘The 140 mg/vial lyophilised formulation of polatuzumab vedotin will be
administered in clinical practice.’2
In relation to the two arms (G and H) added to GO29365 the company stated in the CS that
‘*********************************************************************************
**********************************************************************************
**********************************************************************************
**********************************************************************************
**********************************************************************************
**************.’14
The company stated that
‘*********************************************************************************
**********************************************************************************
*******************************************************************.’ 14 The ERG
agrees that these comparisons should be treated with caution, but noted that response rates, median PFS
and OS tended to be numerically lower (worse) in Arm G, the lyophilised formulation arm. The
company stated that
‘******************************************************************************’ 14
and it is also noted that follow up was shorter in the lyophilised group
(***************************). In regard to safety the company stated at clarification that
‘*********************************************************************************
**********************************************************************************
**********************************************************************************
**********************************************************************’Full details of
the safety and efficacy results of Arm G are provided in Appendix L of the CS.
In the absence of complete evidence, the ERG concludes that there is some doubt as to whether the
lyophilised formulation of Pola will offer similar efficacy and safety to the liquid formulation when
used in clinical practice.
Copyright 2019 Queen's Printer and Controller of HMSO. All rights reserved

CONFIDENTIAL UNTIL PUBLISHED
29
3.3 Comparators
ERG comment: Only one comparator (bendamustine with rituximab; BR) was fully included in the
decision problem while rituximab, gemcitabine, oxaliplatin (R-GemOx) were only included in the
economic model by assuming equal efficacy with BR. The ERG questioned whether evidence might be
available on other comparators given that Appendix D of the CS reported a systematic review of 16
studies considered in an indirect comparison feasibility assessment. The company were requested in
the clarification letter to:27
• complete the systematic review by reporting the effectiveness and safety results of the 16
studies.
• state the reasons for each of the 16 studies as to why the results could not be included in a meta-
analysis with those from GO29365.
• state the reasons for each of the 16 studies as to why the results could not be incorporated in
the economic model.
The company provided the above data.2 The ERG examined the RCTs identified and agreed that a
network could not be constructed to inform an indirect comparison based on the RCTs of other
treatments available. Equally, in examination of the observational studies a match-adjusted comparison
did not appear to be appropriate given the differences identified by the company in populations and line
of treatment across the studies. Indeed, studies for only one additional comparator in the scope, R-
GemOx, were presented. However, all of these studies included a large proportion of non-rituximab
experienced patients, the effect of which would be difficult to estimate given that data were not reported
separately by rituximab experience.
Nevertheless, the company noted in Table 3 of the CS regarding European Society for Medical
Oncology (ESMO) guidelines for patients with first and second relapse or progression that following
advice from UK clinical experts, oxaplatin is the preferred platinum regimen for transplant-ineligible
patients in UK clinical practice.14 However, further in the text, clinical experts reported that R-Gem-Ox
is not widely used in clinical practice. They were therefore requested to clarify this apparent
discrepancy. The company reiterated that ‘Clinical experts reported that R-Gem-Ox…. is not widely
used in UK clinical practice as a salvage regimen for transplant-eligible patients’ but did not provide
the data to support this assertion.2 They further stated that ‘R-Gem-Ox is an option considered by NHS
England for older and / or transplant-ineligible patients. Further advice sought by Roche also reported
that the familiarity of this regimen has occurred very recently (in the last few years) and its use in the
transplant-ineligible setting may increase among treatment centres that are enrolling patients to the
ARGO study.’ 2
Although there are no comparative data, in the two trials of R-Gem-Ox where it was reported, median
OS was considerably higher, at 9.1 and 11.0 months (see Table 11 of the response to clarification), than
the *** months for BR in the GO29365 trial.2, 14 However, it was reported by the company that two
clinical advisors stated: “…the responses seen in the BR (control) arm of the GO29365 study is in-line
with what they would expect in this population with the use of other treatment options.” (p. 5)28 Also,
at clarification the company stated that ‘Other regimens used in the treatment of R/R DLBCL, such as
R-Gem-Ox (a platinum-based regimen) is associated with a high incidence (38%) and severity (Grade
3: 8%) of PN (9). Therefore, there was concern that combining polatuzumab vedotin with R-Gem-Ox
would result in significant additive toxicity, specifically PN.’2
Copyright 2019 Queen's Printer and Controller of HMSO. All rights reserved

CONFIDENTIAL UNTIL PUBLISHED
30
Therefore, in the absence of direct evidence, it is not clear that R-GemOx can be assumed to have equal
efficacy and safety to BR. Furthermore, it is also not clear that the two comparators in the CS are a
reasonable reflection of the comparators currently used in practice.
3.4 Outcomes
ERG comment: The outcomes in the CS were as per the NICE scope.26 However, health-related quality
of life was not directly assessed in the main trial, GO29365.
Primary outcomes in the main trial GO29365 were assessed by IRC and by investigators.14 Independent
outcome assessment is the method preferred by the ERG and these results are presented in Section 4.2.5
of the ERG report.
3.5 Other relevant factors
Equity considerations were not mentioned by the company and there is no patient access scheme.
Copyright 2019 Queen's Printer and Controller of HMSO. All rights reserved

CONFIDENTIAL UNTIL PUBLISHED
31
4. CLINICAL EFFECTIVENESS
4.1 Critique of the methods of review(s)
The company conducted a systematic review to identify evidence relevant to this appraisal. Section 4.1
critiques the methods of the review including searching, inclusion criteria, data extraction, quality
assessment and evidence synthesis.14
4.1.1 Searches
Appendix D of the CS details a systematic search of the literature used to identify clinical effectiveness
literature undertaken on 4 September 2018, the search was updated (electronic databases and congress
proceedings) on 4 June 2019.27 A summary of the sources searched is provided in Appendix 2, Table 1.
ERG comment
• The selection of databases searched was comprehensive, and searches were on the whole clearly
reported and reproducible. The database name, host and date searched were provided for most
searches. An extensive range of resources additional to database searches was included in the
SLR to identify further relevant studies and grey literature.
• Reporting of dates searched are unclear. The text in Appendix D.1 states that searches took
place on 4 September 2018, but the search strategies report a search date of 6 September 2018.
• The Cochrane Library Central Register of Controlled Trials (CENTRAL) date span was
reported as up to October 2017, but the searches took place on 6 September 2018 so it is unclear
why a longer date span was not searched.
• The Cochrane Database of Systematic Reviews (CDSR) date span is reported as 2005-
November 2016, but again the searches took place on 6 September 2016 so it is unclear why
longer date spans were not searched.
• Study design filters to identify clinical trials were applied. The filters were not referenced, so it
was unclear whether they were published objectively-derived filters. The filters contained a
combination of subject heading terms (MeSH and Emtree) and free text terms, and the ERG
deemed them to be adequate. Additional terms were also employed in the strategy to identify
non-randomised studies.
• A broad range of additional sources were ‘hand’ searched, the sources and terms used were not
reported in full detail (i.e. website addresses and terms used to search them).
4.1.2 Inclusion criteria
As stated above, the company conducted a systematic review to identify evidence relevant to this
appraisal, the details of which were presented in Appendix D.27 A summary of the eligibility criteria is
given in Appendix 1 of this report.
ERG comment
• The inclusion criteria of the review were slightly different to the inclusion criteria specified by
NICE in the scope. The population in the review was ‘Adult patients (≥18years) with R/R
DLBCL who are receiving second or third-line (or beyond) therapy’ 14 whereas in the scope it
was ‘Adults with relapsed or refractory diffuse large B-cell lymphoma for whom hematopoietic
stem cell transplant is not suitable’26. However, no comparators appear to have been excluded.
Copyright 2019 Queen's Printer and Controller of HMSO. All rights reserved
CONFIDENTIAL UNTIL PUBLISHED
32
• The study designs in the review included RCTs, prospective (but not retrospective) single arm
studies and comparative observational studies. The inclusion of non-RCTs was appropriate
given the smaller number of RCTs available in this population and to allow the possibility of
exploring a mixed-treatment comparison.
• There were no date or country restrictions but only English language publications were eligible
which meant that studies could have been missed. It was noted that across the review and its
subsequent update search that five papers were excluded based on title and abstract and eight
based on the full paper. It was unclear if these studies would have been otherwise eligible for
inclusion.
• It was unclear if more than one reviewer was involved in selecting studies for inclusion in the
review which helps to minimise bias and error.
• The company reported that 36 unique studies met the eligibility criteria of the review. Sixteen
studies were considered for extraction. Twenty were not as they enrolled either transplant
eligible patients or transplant or chemotherapy relapsed patients. This appeared initially
appropriate to the ERG given the NICE scope. However, the company stated in the clarification
letter that ‘Patients who had received prior transplant (but have since progressed are within
the expected marketing authorisation for pola+BR if they are not eligible for another transplant
at this point.’2 If NICE considers this population to be part of the scope then some of the non-
extracted studies could be relevant especially as the main trial in the submission also included
16 of 80 patients who had received an ASCT.
• Four of the 16 extracted studies in the CS were RCTs and 12 were observational/single arm
trials. Two of the RCTs were not specifically in transplant ineligible but ‘included elderly, frail
patients that could be considered as transplant ineligible’14 according to the company. This
appeared reasonable to the ERG.
• The company performed an update search on 10 June 2019 which generated three new studies
to be extracted and considered in the indirect comparison feasibility assessment (see section
4.1.5). The 19 studies now comprised six RCTs and 13 single arm studies.2 The company was
asked to report on the effectiveness and safety of the studies considered for the indirect
comparison. These results are available in the response to clarification letter.2
4.1.3 Critique of data extraction
No information was provided on the number of reviewers who extracted data from included studies.
ERG comment: It is normally recommended that two reviewers are involved in data extraction for a
systematic review to avoid bias and error.
4.1.4 Quality assessment
The company assessed the quality of GO29365, the main trial of polatuzumab in combination with BR
in patients with R/R DLBCL, and the three original RCTs to be considered for the indirect comparison.
The quality tool used was as recommended in the NICE STA user guide.29 Elements assessed were
randomisation procedures, allocation concealment, blinding of participants, personnel and outcome
assessors, methods of dealing with incomplete outcome data, selective outcome reporting and any other
biases. The company gave the trial positive ratings in all categories but one – blinding of participants
and personnel as the trial was open label.
Copyright 2019 Queen's Printer and Controller of HMSO. All rights reserved

CONFIDENTIAL UNTIL PUBLISHED
33
Observational studies considered for indirect comparison were also assessed by the company using the
Quality Assessment Tool for Quantitative Studies produced as part of the Effective Public Health
Practice Project (EPHPP).30
No information was provided on the number of reviewers who assessed the quality of included studies.
ERG comment
• It is normally recommended that two reviewers are involved in the assessment of study quality
to avoid bias and error.
• The ERG agrees with the company’s quality assessment of the main trial, GO29365. It is drawn
to the attention of the committee that this is an open label trial so both patients and healthcare
professionals involved in their care are aware of treatment allocation.
• Primary outcomes were assessed by independent review committee and by investigators.
Independent outcome assessment is the method preferred by the ERG and these results are
presented in the report.
• The ERG did not re-assess the quality of the studies (RCTs and observational) considered for
the indirect comparison given that no indirect comparison was undertaken.
4.1.5 Evidence synthesis
As the company identified only one relevant trial, no meta-analysis was possible. As stated above, the
company investigated the feasibility of an indirect treatment comparison of Pola+BR with comparators
in the NICE scope. However a limited number of RCTs were eligible and the company reported that no
connected network of evidence could be constructed. The company also stated that three single arm
studies of R-GemOx was identified, but as the study did not report KM data for rituximab pre-treated
and naïve patients separately it was not possible to conduct a robust matching-adjusted indirect
comparison.2
ERG comment: The ERG examined the RCTs identified and agreed that a network could not be
constructed to inform an indirect comparison based on the RCTs available. Equally a matching-adjusted
indirect comparison did not appear to be appropriate given the differences identified by the company in
populations and line of treatment across the studies (Also see Section 3.3 of ERG report).
4.2 Critique of trials of the technology of interest, the company’s analysis and interpretation
(and any standard meta-analyses of these)
4.2.1 Included studies
One study is mentioned in the CS as relevant to the technology being appraised:
• A Phase Ib/II, multicentre, open-label study (GO29365) of polatuzumab in combination with
BR in patients with R/R DLBCL, and polatuzumab in combination with bendamustine and
obinutuzumab (BG) in patients with R/R follicular lymphoma.
Details of the study are listed in Table 4.1.
Copyright 2019 Queen's Printer and Controller of HMSO. All rights reserved

CONFIDENTIAL UNTIL PUBLISHED
34
Table 4.1: Study details, GO29365
Study GO29365 (NCT02257567)
Study design Phase Ib/II, multicentre, open-label study
Population Patients with R/R DLBCL
Age ≥18 years’ old
ECOG PS 0–2
At least 1 bi-dimensionally measurable lesion ≥1.5 cm in its longest
dimension
Adequate haematologic function
If received prior bendamustine, response duration must have been
>1 year
Intervention(s) Polatuzumab vedotin plus bendamustine and rituximab (Pola+BR)
Comparator(s) Bendamustine and rituximab (BR)
Indicate if trial supports
application for marketing
authorisation
Yes ✓ Indicate if trial used in the
economic model
Yes ✓
No No
Rationale for use/non-use in
the model
GO29365 is a Phase Ib/II trial providing efficacy and safety
evidence for the combination of Pola+BR in patients with R/R
DLBCL. Data from GO29365 were used to inform the efficacy and
safety of Pola+BR in the economic model. Data for PFS and OS
from the most recent data cut (11 October 2018) were used to
inform the economic model – this data and analysis for other
endpoints from the previous data cut (30 April 2018) is reported in
this submission
Reported outcomes specified
in the decision problem
Overall survival
Progression-free survival
Response rates
Adverse effects of treatment
Health-related quality of life
All other reported outcomes Duration of response
Event-free survival
Source: CS, Table 6, page 2414
DLBCL = Diffuse large B-cell lymphoma; ECOG PS = Eastern Co-operative Oncology Group performance
status; R/R = Relapsed/refractory
ERG comment
• According to these characteristics, the population is in line with the scope except insofar as it
is not stated that hematopoietic stem cell transplant is not suitable.26 However, this aspect is
addressed in Section 4.1.2.
• The intervention is consistent with the scope.
• The comparator is one of those in the scope, although none of the other comparators were
included in the trial.
• The outcomes are those that are listed in the scope. However, HRQoL is not assessed in the
trial.
Copyright 2019 Queen's Printer and Controller of HMSO. All rights reserved

CONFIDENTIAL UNTIL PUBLISHED
35
• The trial is open-label so treatment assignment was known to patients and care providers. See
Section 4.1.4 for a discussion of this aspect.
• The methodology of the GO29365 trial is described in more detail in Appendix 3. The ERG
noted that patients needed to have received at least one prior therapy for DLBCL and that they
must have relapsed or have become refractory to a prior regimen. Thus, in the trial, patients
were receiving treatment at second-line and beyond. Patients needed to have a life expectancy
of at least 24 weeks which is reasonable for the trial but in clinical practice this treatment is to
be offered as end-of-life care. Importantly, patients could have received a prior ASCT over 100
days previously. Implications of including this population are discussed within this report.
Outcomes were assessed by investigators and an IRC and it is the IRC results which are
preferred by the ERG and are presented in this report.
4.2.2 Design of the included study
The GO29365 trial study design is summarised in the Figure 4.1 below.
Figure 4.1: GO29365 study design schema (R/R DLBCL polatuzumab and BR populations only)
Source: CS, Figure 3, page 2514.
Lyo = lyophilised formulation
*1:1 randomisation, stratified by DOR ≤12 months or >12 months.
Treatment administered every 21 days x 6 cycles: pola 1.8 mg/kg, C1D2, then D1 for C2+; bendamustine: 90
mg/m2, C1D2/3 then D1/2 for C2+; rituximab: 375 mg/m2, D1 for C1+
ERG comment
• Six patients enrolled to receive Pola+BR in a Phase I safety run. In a phase II randomisation 40
patients were randomised to Pola+BR and 40 patients to the BR arm. Where results include the
six patients in the Phase I study this will be indicated.
• The GO29365 trial is ongoing and issues relating to the new formulation cohort in Arms G and
H are discussed in Sections 3.2 and 4.2.7.
Copyright 2019 Queen's Printer and Controller of HMSO. All rights reserved

CONFIDENTIAL UNTIL PUBLISHED
36
4.2.3 Baseline characteristics
A total of 86 patients were enrolled in the GO29365 trial and were randomly assigned to the
polatuzumab + BR group (n=40) or the BR group (n=40), whilst six patients received polatuzumab+BR
in a Phase I safety run. The median age of patients in the Pola+BR group was 66.5 and in the BR group
was 71. Approximately 66% of the trial participants are male. The majority are white and have an
ECOG status of 0 or 1. The median number of prior treatment lines is two and approximately 30% have
received one prior treatment. See Table 4.2).
Table 4.2: Key demographic and baseline disease characteristics in GO29365
Characteristics Phase Ib
(safety run-in)
Phase II
(randomised)
Phase Ib/II
(total)
Pola+BR
n=6
Pola+BR
n=40
BR
n=40
Pola+BR
N=46
Baseline demographics
Median age, years
(range)
65.0
(58–79)
67.0
(33–86)
71.0
(30–84)
66.5
(33–86)
Male, n (%) 4 (66.7) 28 (70.0) 25 (62.5) 32 (69.6)
Race, n (%)
White
Asian
American Indian or Alaska Native
Black or African American
Unknown
5 (83.3)
1 (16.7)
0
0
0
26 (65.0)
6 (15.0)
0
3 (7.5)
5 (12.5)
31 (77.5)
4 (10.0)
1 (2.5)
0
4 (10.0)
31 (67.4)
7 (15.2)
0
3 (6.5)
5 (10.9)
ECOG PS, n (%)
0 or 1
2
Unknown
6 (100.0)
0
0
33 (82.5)
6 (15.0)
1 (2.5)
31 (77.5)
8 (20.0)
1 (2.5)
39 (84.7)
6 (13.0)
1 (2.2)
Primary reason for SCT ineligibility, n
(%):
Age
Comorbidities
Failed prior transplant
Insufficient response to salvage tx
Other
Patient refusal
Performance status
1 (16.7)
0
0
2 (33.3)
1 (16.7)
2 (33.3)
0
13 (32.5)
1 (2.5)
10 (25.0)
12 (30.0)
2 (5.0)
2 (5.0)
0
19 (47.5)
1 (2.5)
6 (15.0)
9 (22.5)
1 (2.5)
2 (5.0)
2 (5.0)
14 (30.4)
1 (2.2)
10 (21.7)
14 (30.4)
3 (6.5)
4 (8.7)
0
Baseline disease characteristics
Median months since diagnosis at study
entry (range)
0.5
(0–1)
0.7
(0–20)
0.8
(0–15)
0.7
(0–20)
Ann Arbor Stage III or IV, n (%) 4 (66.7) 34 (85.0) 36 (90.0) 38 (82.6)
Bulky disease (≥7.5 cm), n (%) 1 (16.7) 10 (25.0) 15 (37.5) 11 (23.9)
Extranodal involvement, n (%) 4 (66.6) 27 (67.5) 29 (72.5) 31 (67.4)
IPI score at enrolment, n (%)
0–1 (low)
2 (low-intermediate)
1 (16.7)
3 (50.0)
9 (22.5)
9 (22.5)
3 (7.5)
8 (20.0)
10 (21.7)
12 (26.1)
Copyright 2019 Queen's Printer and Controller of HMSO. All rights reserved

CONFIDENTIAL UNTIL PUBLISHED
37
Characteristics Phase Ib
(safety run-in)
Phase II
(randomised)
Phase Ib/II
(total)
Pola+BR
n=6
Pola+BR
n=40
BR
n=40
Pola+BR
N=46
3 (high-intermediate)
4–5 (high)
2 (33.3)
0
13 (32.5)
9 (22.5)
12 (30.0)
17 (42.5)
15 (32.6)
9 (19.6)
Prior anti-lymphoma chemotherapy, n (%)
Median no. of lines (range)
1 line
2 lines
≥3 lines
6 (100.0)
2.0 (1–2)
2 (33.3)
4 (66.7)
0
40 (100.0)
2.0 (1–7)
11 (27.5)
11 (27.5)
18 (45.0)
40 (100.0)
2.0 (1–5)
12 (30.0)
9 (22.5)
19 (47.5)
46 (100.0)
2.0 (1–7)
13 (28.3)
15 (32.6)
18 (39.1)
Prior treatments, n (%)
Anti-CD20
Bendamustine
Stem cell transplant
Cancer radiotherapy
6 (100.0)
0
0
1 (16.7)
39 (97.5)
1 (2.5)
10 (25.0)
11 (27.5)
40 (100.0)
0
6 (15.0)
10 (25.0)
45 (97.8)
1 (2.2)
10 (21.7)
12 (26.1)
Refractory to last prior anti-CD20 txa n
(%)
No
Unknown
4 (66.7)
1 (16.7)
1 (16.7)
18 (45.0)
10 (25.0)
12 (13.0)
18 (45.0)
6 (15.0)
16 (40.0)
22 (47.8)
11 (23.9)
13 (28.3)
Refractory to last prior anti-lymphoma
therapyb, n (%) 5 (83.3) 30 (75.0) 34 (85.0) 35 (76.1)
Median time from last anti-lymphoma
therapyc, days (range)
53.0
(43–1477)
131.0
(17–11744)
82.0
(21–2948)
114.0
(17–11744)
Duration of response to prior txd, n (%)
≤12 months
5 (83.3)
32 (82.0)
33 (82.5)
37 (80.4)
Source: CS, Table 7, pages 32-33. a Defined as no response or progression or relapse within 6 months of last anti-lymphoma therapy end date among patients
whose last prior regimen contained anti−CD20 b Defined as no response or progression or relapse within 6 months of last anti−lymphoma therapy end date c Defined as time from end date of last anti−lymphoma therapy to first dose date d Duration of response to prior therapy based on IxRS for randomised cohorts and CRF for non-randomised cohorts
ECOG PS = Eastern Cooperative Oncology Group performance status; IPI = international prognostic index; IxRS =
Interactive Voice/Web Response System; SCT = stem cell transplant
ERG comment
• As only three patients were from the UK it is important to consider whether the baseline
characteristics of the patients in the trial reflect those typically seen in clinical practice in this
country. The ERG noted an underrepresentation of non-white participants. The majority of
patients had an ECOG status of 0 or 1. The primary reasons for SCT ineligibility were age and
insufficient response to salvage therapy.
• The ERG noted that there were some baseline imbalances between the treatment groups
including variation in IPI score with more patients in the Pola+BR having a lower score. More
patients in the BR group had bulky disease. These factors could be advantageous for outcomes
in the Pola+BR group. The company conducted multivariable Cox regression analysis to adjust
for Ann Arbor stage, baseline ECOG status and IPI (OS and PFS) and also bulky disease (OS
only) and concluded that these results were robust and similar to the unadjusted results.
Copyright 2019 Queen's Printer and Controller of HMSO. All rights reserved

CONFIDENTIAL UNTIL PUBLISHED
38
However, bulky disease showed the greatest imbalance at baseline (25% vs. 37.5%) and this
was not included in the PFS analysis so this imbalance could favour Pola+BR.
4.2.4 Statistical analyses
Forty patients were planned for each treatment arm in the Phase II randomisation phase in patients with
R/R DLBCL in order to evaluate the safety and efficacy of polatuzumab+BR compared with BR with
acceptable accuracy. The primary outcome was CR and the sample size was based on the estimation of
the CR rate for each treatment. Forty patients per treatment arm would provide a confidence interval of
+/- 17% assuming an observed CR of at least 60% and an exact Clopper-Pearson 95% CI of 43% to
75%. Assuming 40% CR with BR and an increase to 65% with Pola+BR then the estimated 95% CI for
the difference is 3.8% to 46.2%.
Efficacy analyses were based on two populations: intention-to-treat (ITT) population which was all
randomised patients analysed in the group to which they were randomised and the safety-evaluable
population, which was all patients who received any study medication, analysed according to treatment
received. The primary, secondary and exploratory efficacy endpoints in the GO29365 study are
summarised in Table 4.3.
Table 4.3: Efficacy outcome measures
Primary efficacy
endpoint
Secondary efficacy endpoints Exploratory efficacy endpoints
• CR at primary response
assessment (6−8 weeks
after Cycle 6 Day 1 or last
dose of study medication)
based on PET-CT, as
determined by the
investigator and IRC
The percentage with CR
and the Clopper-Pearson
exact 95% CI was
calculated for each arm.
Differences between arms
were compared with a
CMH chi-square test
adjusted for the
randomisation
stratification factors
Response rates measured at the primary
response assessment:
• CR (INV-assessed) and OR (INV- and
IRC assessed CR or PR) based on PET
alone
• CR and OR (INV- and IRC-assessed)
based on CT alone
• BOR (INV-assessed) at any assessment
while on study based on PET alone or CT
alone
• DOR (IRC-assessed)
• PFS (IRC-assessed)
Binary outcomes were analysed using the
same method as CR
Median DOR with 95% CI were estimated
using the Brookmeyer and Crowley
method, no treatment comparisons were
made.
Time-to-event outcome
measures:
• DOR (INV-assessed)
• PFS (INV-assessed)
• EFS (INV-assessed)
• OS
PFS, EFS and OS durations and
estimates of one and two-year
survival were estimated using
the Kaplan-Meier method.
There was no pre-specified
alpha control plan; p-values are
provided for descriptive
purposes only.
Source: based on CS, Table 9, page 35
BOR = best overall response; CMH = Cochran-Mantel-Haenszel; CR = complete response; DOR = duration of response;
EFS = event-free survival; IRC = Independent Review Committee; OR = overall response; OS = overall survival; PET-
CT = positron emission tomography-computed tomography; PFS = progression-free survival; PR = partial response
Copyright 2019 Queen's Printer and Controller of HMSO. All rights reserved

CONFIDENTIAL UNTIL PUBLISHED
39
Patients who did not have response assessments (for any reason) were considered as non-responders.
For OS, patients for whom death had not been documented had observations censored on the last date
at which they were known to be alive. Also, patients had observations censored on the date of the last
tumour assessment or, if no tumour assessments were performed after the baseline visit, at the time of
randomisation and enrolment day +1 if they did not have documented disease progression or death.
The patient-reported outcome analyses included patients in the intent-to-treat population and were
analysed according to assigned treatment. For the total score and each of the Therapy-Induced
Neuropathy Assessment Scale (TINAS) single symptom items, descriptive statistics for recorded values
at each visit and changes from baseline were calculated. In cases, where TINAS data were missing, per
developer scoring instructions, such that a prorated total score was calculated if ≥50% of items were
answered, were used.
ERG comment: The statistical analyses used appropriate methods. However, the sample size
calculation was based on estimating the CR rate in each arm and was not powered for detecting
differences between the treatment arms. It only considered CR and not time to event outcomes such as
PFS, OS and EFS which, given the small sample size of this phase II study, were likely to be
underpowered. The analysis methods for the exploratory endpoints (OS, investigator-assessed PFS and
EFS) specified that p-values were provided for descriptive purposes only, although they have been
presented and used in the conclusion of the CS.
4.2.5 Results
The Phase Ib/II study GO29365 evaluated the efficacy and safety of pola 1.8 mg/kg in combination
with rituximab or obinutuzumab plus bendamustine in relapsed or refractory follicular lymphoma or
DLBCL in patients with R/R DLBCL. The primary analysis presented in the CS was from the clinical
cut-off date 30 April 2018, although data for PFS and OS from the most recent data cut (11 October
2018) were also presented. Because the ERG believe that they are more reliable, only the results of the
IRC are presented below.
4.2.5.1 Complete response rate
In the randomised Phase II part of the GO29365 study, polatuzumab+BR (40.0% [16/40 patients]; 95%
CI: 24.9%, 56.7%) demonstrated a statistically significant improvement in CR at the primary response
assessment by PET-CT as assessed by the IRC compared to patients in the BR arm (17.5% [7/40
patients], 95% CI: 7.3%, 32.8%) (see Table 4.4).
Table 4.4: CR rate with PET at primary response assessment (IRC-assessed)
Outcome Pola+BR
n=40
BR
n=40
Complete response, n (%)
95% CI
16 (40.0)
(24.86, 56.67)
7 (17.5)
(7.34, 32.78)
Difference in response rates, n (%)
(95% CI)
p value
22.5
(2.62, 40.22)
p=0.0261
Source: CS, Table 11, page 38
Copyright 2019 Queen's Printer and Controller of HMSO. All rights reserved

CONFIDENTIAL UNTIL PUBLISHED
40
4.2.5.2 Progression-free survival
The number of patients with R/R DLBCL who had a PFS event (PD or death) at the time of the clinical
cut off was higher in the BR arm in comparison to polatuzumab+BR arm (80.0% [32/40 patients] vs.
62.5% [25/40 patients]) (see Table 4.5). The risk of PD or death was reduced in patients treated with
Pola+BR compared to BR (stratified HR=0.36; 95% CI: 0.21, 0.63).
Table 4.5: Progression-free survival (IRC-assessed)
Outcome Pola+BR
n=40
BR
n=40
Patients with event, n (%) 25 (62.5) 32 (80.0)
Earliest contributing event, n
Disease progression
Death
14
11
13
19
Median time to event, months
95% CI
9.46
(6.24, 13.93)
3.71
(2.07, 4.53)
Stratified HR %
(95% CI)
p value (log-rank)
0.36
(0.21, 0.63)
p<0.0002
Source: CS, Table 19, page 42
CCOD: 30 April 2018
Tumour assessment is based on PET-CT wherever it is available and valid and uses CT only result if PET-CT
is missing
HR = hazard ratio
The updated PFS by IRC was provided to the ERG with the clarification response.2 This time the clinical
cut-off date was *************. After 30 months the number of patients with a PFS event (PD or
death) was higher in the BR arm (*******************]) compared to the Pola+BR arm
(*********************** (see Table 4.5). The risk of PD or death was reduced compared to BR
(stratified **************************** The results of the updated PFS analysis are shown in
Table 4.6. An updated KM curve is provided in Figure 4.2.
Table 4.6: Updated progression-free survival (IRC-assessed)
Outcome Pola+BR
n=40
BR
n=40
Patients with event, n (%) ********* *********
Earliest contributing event, n
Disease progression
Death
****** ******
Median time to event, months
95% CI
*************** **************
Stratified HR %
(95% CI)
p value (log-rank)
**************************
Source: Response to clarification, Table 15, page 26
****************
HR, hazard ratio
Copyright 2019 Queen's Printer and Controller of HMSO. All rights reserved
CONFIDENTIAL UNTIL PUBLISHED
41
Figure 4.2: Updated Kaplan-Meier Curve for PFS by IRC
Source: Response to clarification, Figure 3, page 27
4.2.5.3 Overall survival
A total of 51 patients with R/R DLBCL in the randomised Phase II had died at the time of the clinical
cut-off of 30 April 2018 (28 patients in the BR arm and 23 patients in the Pola+BR arm). The risk of
death was reduced by 58% in patients treated with Pola+BR compared to BR (stratified HR=0.42; 95%
CI: 0.24, 0.75) (see Table 4.7).
Table 4.7: Overall survival
Outcome Pola+BR
n=40
BR
n=40
Patients with event, n (%) 23 (57.5) 28 (70.0)
Median time to event, months
95% CI
12.39
(9.04, NE)
4.73
(3.71, 8.31)
Stratified HR %
(95% CI)
p value (log-rank)
0.42
(0.24, 0.75)
p=0.0023
Source: CS, Table 24, page 46.
CCOD: 30 April 2018
HR = hazard ratio; NE = not estimated
An updated OS was provided to the ERG with clarification response.2 The clinical cut-off date was
**********************************************************************************
**********************************************************************************
**********************************************************************************
*****************. The results of the updated OS analysis are shown in Table 4.9. An updated KM
curve is provided in Figure 4.3.
Copyright 2019 Queen's Printer and Controller of HMSO. All rights reserved

CONFIDENTIAL UNTIL PUBLISHED
42
Table 4.8: Updated overall survival cut-off date *************
Outcome Pola+BR
n=40
BR
n=40
Patients with event, n (%) ********* *********
Median time to event, months
95% CI
**************** **************
Stratified HR %
(95% CI)
p value (log-rank)
**************************
Source: Response to clarification, Table 17, page 28.
****************
HR = hazard ratio; NE = not estimated
Figure 4.3: Updated Kaplan-Meier Curve for OS cut-off date *************
Source: Response to clarification, Figure 5, page 29.2
4.2.5.4 Patient-reported outcomes
Patients self-reported the severity of symptoms and neuropathy related to polatuzumab treatment impact
on daily functioning by using the TINAS v1.0 instrument.31 The company made an assumption that
peripheral neuropathy (PN) is specific to polatuzumab, therefore, data from Pola+BR and Pola+BG
arms were pooled across the Phase Ib and Phase II stages to maximise the sample size available for
analyses given the extent of missing data. Patients in both the Pola+BR/BG and BR arms reported low
mean scores for individual TINAS items (≤1.5) at the beginning of treatment. Moreover, the severity
of PN symptoms was rated as low by the end of treatment, with the highest means observed for
numbness/tingling in hands/feet, although still ≤2.
Copyright 2019 Queen's Printer and Controller of HMSO. All rights reserved

CONFIDENTIAL UNTIL PUBLISHED
43
ERG comment: There was a clear and statistically significant advantage with Pola+BR in comparison
to BR in all outcomes. This included an increase in median OS of about *********** and an increase
in median PFS of about **********, as shown in Table 4.6. However, the ERG noted an error in the
KM curve for OS where the curve for BR reached zero when it should have remained at approximately
17%.
4.2.5.5 Results from GO29365 excluding 16 patients who had received an ASCT
The company was asked at clarification to conduct an analysis excluding the 16 patients from GO29365
who had received an ASCT.2 The company provided data from both the 30 April 2018 data cut and the
************* data cut. The data provided are given below.
Table 4.9: CR rate with PET at primary response assessment (IRC-assessed) endpoint,
excluding the 16 patients who had received an ASCT (30 April 2018)
Outcome Pola+BR
n=30
BR
n=34
Complete response, n (%)
95% CI
************************* ***********************
Difference in response rates, n (%)
(95% CI)
p- value (stratified)
****************************
Source: Response to clarification2
BR = bendamustine, rituximab; CI = confidence interval
Table 4.10: Objective response (CR/PR) rates by PET at primary response assessment (IRC-
assessed) endpoint, excluding the 16 patients who had received an ASCT (30 April 2018)
Outcome Pola+BR
n=30
BR
n=34
Overall response, n (%)
95% CI
************************ ***********************
Complete response, n (%)
95% CI
************************* ***********************
Partial response, n (%)
95% CI
********************** **************
Difference in OR response rates, n
(%)
(95% CI)
********************
Source: Response to clarification2
BR = bendamustine, rituximab; CI = confidence interval; OR = overall response
Copyright 2019 Queen's Printer and Controller of HMSO. All rights reserved

CONFIDENTIAL UNTIL PUBLISHED
44
Table 4.11: Progression-free survival (IRC-assessed), excluding the 16 patients who had
received an ASCT (*************)
Outcome Pola+BR
n=30
BR
n=34
Patients with event, n (%) ********* **********
Earliest contributing event, n
Disease progression
Death
****** *****
Median time to event, months 95% CI ****************** *****************
Stratified HR % (95% CI) *****************
Source: Response to clarification2
BR = bendamustine, rituximab; CI = confidence interval; HR = Hazard ratio
Table 4.12: Overall survival, excluding the 16 patients who had received an ASCT (latest data
update) (*************)
Outcome Pola+BR
n=30
BR
n=34
Patients with event, n (%) ********** **********
Median time to event, months 95% CI ******************* *****************
Stratified HR % (95% CI) ********************
Source: Response to clarification2
BR = bendamustine, rituximab; CI = confidence interval; HR = Hazard ratio
ERG comment: The ERG considers that the results appear comparable to those including the 16 who
had received an ASCT prior to entering the trial.
4.2.5.6 Subgroups according to line of treatment
ERG comment: Although the NICE scope did not specify any subgroups of interest, the ERG
considered that the committee might need to consider data on the effectiveness of Pola+BR at the
different lines of treatment in the proposed pathway. Accordingly, the ERG asked:
‘Figure 2 in the CS shows that pola + BR might be positioned at either second-line (immediately after
rituximab, cyclophosphamide, doxorubicin, vincristine, prednisone; R-CHOP), third-line (after R-
based chemotherapy/palliative care) or second-line (after R-based salvage chemotherapy).
Please conduct subgroup analyses of the GO29365 trial appropriate to each of these three positions.’2
The company provided subgroup analyses as illustrated in the Figure 4.4.2
Copyright 2019 Queen's Printer and Controller of HMSO. All rights reserved

CONFIDENTIAL UNTIL PUBLISHED
45
Figure 4.4: Company subgroup analyses according to line of treatment
Source: Clarification response2
Clear non-candidates for transplant (transplant-ineligible), second-line (Box A in Figure)
Clear non-candidates for transplant (transplant-ineligible), third-line (Box B)
Clear or borderline candidate for transplant, third-line after failing salvage therapy and therefore transplant-
ineligible (Box C)
The company stated ‘It was not possible to perform a subgroup analysis of patients who received
pola+BR beyond third-line as these patients could not be clearly defined.’2
The company concluded that patient number in the subgroups were too small to provide reliable results.
The ERG agrees with this conclusion.
4.2.6 Adverse events
The population that could be evaluated for safety included 45 patients who received at least one dose
of study drug during Phase Ib/II and 39 patients who only received BR in the Phase II randomisation.
The company stated that ‘Overall, no new safety signals were noted with the addition of pola to BR
relative to the known safety profile of Pola, and the safety and tolerability profile of the pola+BR
regimen was acceptable within the context of this pre-treated population of patients with R/R DLBCL.’14
A summary of the safety profile of Pola+BR in GO29365 is shown in Table 4.13. Treatment related
adverse events were provided by the company in response to clarification (See Table 4.14).2
Copyright 2019 Queen's Printer and Controller of HMSO. All rights reserved

CONFIDENTIAL UNTIL PUBLISHED
46
Table 4.13: Overview of safety profile in GO29365
n, (%)
Phase Ib Phase II Phase Ib/II
Pola+BR
n=6
Pola+BR
n=39
BR
n=39
Pola+BR
n=45
Patients with at least one:
Any AE
Grade 3–4 AE
Grade 5 AE
Serious AE
6 (100)
5 (83.3)
0
4 (66.7)
39 (100)
33 (84.6)
9 (23.1)
25 (64.1)
38 (97.4)
28 (71.8)
11 (28.2)
24 (61.5)
45 (100)
38 (84.4)
9 (20.0)
29 (64.4)
AE leading to discontinuation of:
Pola
Any study drug
0
1 (16.7)
12 (30.8)
13 (33.3)
n/a
6 (15.4)
12 (26.7)
14 (31.1)
AE leading to modification/interruption of:
Pola
Any study drug
2 (33.3)
3 (50.0)
22 (56.4)
28 (71.8)
n/a
19 (48.7)
24 (53.3)
31 (68.9)
AEs to monitor:
Grade ≥2 peripheral neuropathy
Grade ≥3 neutropenia
Grade ≥3 hepatoxicity
Grade ≥3 infections and infestations
0
2 (33.3)
0
2 (33.3)
6 (15.4)
23 (59.0)
2 (5.1)
13 (33.3)
2 (5.1)
18 (46.2)
1 (2.6)
12 (30.8)
6 (13.3)
25 (55.6)
2 (4.4)
15 (33.3)
Total no. of deaths
Deaths due to PD
2 (33.3)
2 (100)
23 (59.0)
14 (60.9)
28 (71.8)
17 (60.7)
25 (55.6)
15 (64.0)
Source: CS, Table 30, page 53.14
CCOD: 30 April 2018
AE = adverse event; PD = progressive disease
ERG comment
• In the randomised Phase II trial, all patients treated with pola and 38 out of 39 patients in the
BR arm had at least one AE during the study.
• Adverse events appeared similar although there appeared to be more discontinuation and
modification of study drugs in the Pola+BR group.
• In the randomisation Phase Ib and Phase II, a total of 57 serious AEs (SAEs) were reported in
29/45 patients (64.4%) with R/R DLBCL treated with Pola+BR. In the randomisation Phase II,
the rate of SAEs was similar between the arms (64.1% [25/39 patients] Pola+BR arm vs 61.5%
[24/39 patients] BR)
• The ERG noted that Grade ≥2 peripheral neuropathy was more frequently reported with
Pola+BR.
Copyright 2019 Queen's Printer and Controller of HMSO. All rights reserved
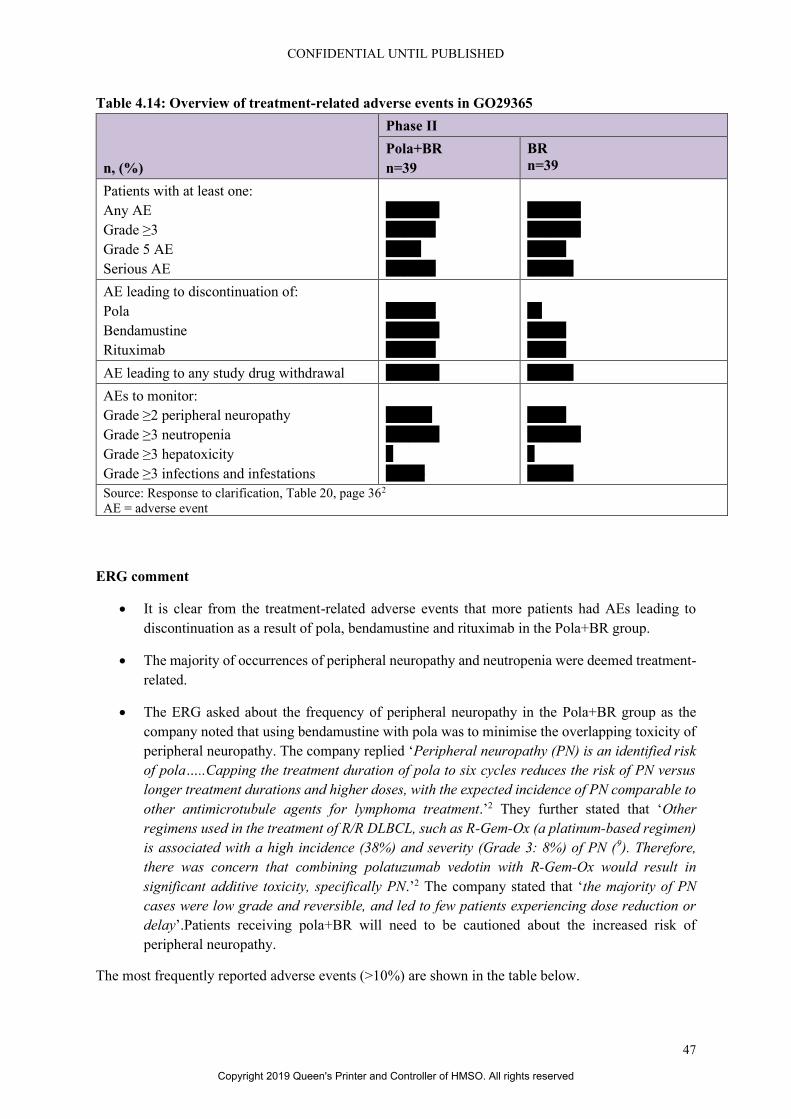
CONFIDENTIAL UNTIL PUBLISHED
47
Table 4.14: Overview of treatment-related adverse events in GO29365
n, (%)
Phase II
Pola+BR
n=39
BR
n=39
Patients with at least one:
Any AE
Grade ≥3
Grade 5 AE
Serious AE
** (**.*)
**(**.*)
*(*.*)
**(**.*)
** (**.*)
** (**.*)
* (*.*)
* (**.*)
AE leading to discontinuation of:
Pola
Bendamustine
Rituximab
**(**.*)
** (**.*)
**(**.*)
**
* (*.*)
* (*.*)
AE leading to any study drug withdrawal ** (**.*) * (**.*)
AEs to monitor:
Grade ≥2 peripheral neuropathy
Grade ≥3 neutropenia
Grade ≥3 hepatoxicity
Grade ≥3 infections and infestations
* (**.*)
** (**.*)
*
* (*.*)
* (*.*)
** (**.*)
*
* (**.*)
Source: Response to clarification, Table 20, page 362
AE = adverse event
ERG comment
• It is clear from the treatment-related adverse events that more patients had AEs leading to
discontinuation as a result of pola, bendamustine and rituximab in the Pola+BR group.
• The majority of occurrences of peripheral neuropathy and neutropenia were deemed treatment-
related.
• The ERG asked about the frequency of peripheral neuropathy in the Pola+BR group as the
company noted that using bendamustine with pola was to minimise the overlapping toxicity of
peripheral neuropathy. The company replied ‘Peripheral neuropathy (PN) is an identified risk
of pola…..Capping the treatment duration of pola to six cycles reduces the risk of PN versus
longer treatment durations and higher doses, with the expected incidence of PN comparable to
other antimicrotubule agents for lymphoma treatment.’2 They further stated that ‘Other
regimens used in the treatment of R/R DLBCL, such as R-Gem-Ox (a platinum-based regimen)
is associated with a high incidence (38%) and severity (Grade 3: 8%) of PN (9). Therefore,
there was concern that combining polatuzumab vedotin with R-Gem-Ox would result in
significant additive toxicity, specifically PN.’2 The company stated that ‘the majority of PN
cases were low grade and reversible, and led to few patients experiencing dose reduction or
delay’.Patients receiving pola+BR will need to be cautioned about the increased risk of
peripheral neuropathy.
The most frequently reported adverse events (>10%) are shown in the table below.
Copyright 2019 Queen's Printer and Controller of HMSO. All rights reserved

CONFIDENTIAL UNTIL PUBLISHED
48
Table 4.15: Most frequently reported adverse events (>10%)
n, (%)
Phase Ib Phase II Phase Ib/II
Pola+BR
n=6
Pola+BR
n=39
BR
n=39
Pola+BR
n=45
Total number of patients with at least one AE: 6 (100) 39 (100) 38 (97.4) 45 (100)
Blood and Lymphatic System Disorders
Neutropenia
Anaemia
Thrombocytopenia
Febrile neutropenia
Leukopenia
Lymphopenia
Pancytopenia
0
0
2 (33.3)
1 (16.7)
0
0
1 (16.7)
21 (53.8)
21 (53.8)
19 (48.7)
4 (10.3)
5 (12.8)
5 (12.8)
2 (5.1)
15 (38.5)
10 (25.6)
11 (28.2)
5 (12.8)
5 (12.8)
0
0
21 (46.7)
21 (46.7)
21 (46.7)
5 (11.1)
5 (11.1)
5 (11.1)
3 (6.7)
Gastrointestinal Disorders
Diarrhoea
Nausea
Constipation
Vomiting
Abdominal pain
Abdominal pain upper
2 (33.3)
3 (50.0)
1 (16.7)
1 (16.7)
1 (16.7)
0
15 (38.5)
12 (30.8)
7 (17.9)
7 (17.9)
4 (10.3)
5 (12.8)
11 (28.2)
16 (41.0)
8 (20.5)
3 (7.7)
4 (10.3)
2 (5.1)
17 (37.8)
15 (33.3)
8 (17.8)
8 (17.8)
5 (11.1)
5 (11.1)
General disorders and administration site conditions
Fatigue
Pyrexia
Chills
Asthenia
Oedema, peripheral
4 (66.7)
2 (33.3)
1 (16.7)
1 (16.7)
0
14 (35.9)
13 (33.3)
4 (10.3)
4 (10.3)
2 (5.1)
14 (35.9)
9 (23.1)
3 (7.7)
6 (15.4)
3 (7.7)
18 (40.0)
15 (33.3)
5 (11.1)
5 (11.1)
2 (4.4)
Infections and infestations
Pneumonia
Herpes zoster
Upper respiratory tract infection
Urinary tract infection
2 (33.3)
1 (16.7)
2 (33.3)
1 (16.7)
5 (12.8)
1 (2.6)
2 (5.1)
1 (2.6)
4 (10.3)
2 (5.1)
1 (2.6)
2 (5.1)
7 (15.6)
2 (4.4)
4 (8.9)
2 (4.4)
Metabolism and nutrition disorders
Decreased appetite
Hypokalaemia
Hypoalbuminaemia
Hypocalcaemia
Hypomagnaesmia
Dehydration
Hypophosphataemia
2 (33.3)
3 (50.0)
1 (16.7)
2 (33.3)
2 (33.3)
2 (33.3)
1 (16.7)
10 (25.6)
4 (10.3)
5 (12.8)
3 (7.7)
1 (2.6)
2 (5.1)
2 (5.1)
8 (20.5)
3 (7.7)
2 (5.1)
1 (2.6)
4 (10.3)
0
1 (2.6)
12 (26.7)
7 (15.6)
6 (13.3)
5 (11.1)
3 (6.7)
4 (8.9)
3 (6.7)
Musculoskeletal and connective tissue disorders
Back pain
Bone pain
Muscular weakness
Pain in extremity
0
0
0
0
2 (5.1)
0
2 (5.1)
2 (5.1)
4 (10.3)
0
1 (2.6)
2 (5.1)
2 (4.4)
0
2 (4.4)
2 (4.4)
Copyright 2019 Queen's Printer and Controller of HMSO. All rights reserved

CONFIDENTIAL UNTIL PUBLISHED
49
n, (%)
Phase Ib Phase II Phase Ib/II
Pola+BR
n=6
Pola+BR
n=39
BR
n=39
Pola+BR
n=45
Nervous system disorders
Peripheral neuropathy
Dizziness
Peripheral sensory neuropathy
Headache
Paresthesia
0
1 (16.7)
0
1 (16.7)
0
9 (23.1)
5 (12.8)
6 (15.4)
3 (7.7)
2 (5.1)
1 (2.6)
3 (7.7)
0
2 (5.1)
0
9 (20.0)
6 (13.3)
6 (13.3)
4 (8.9)
2 (4.4)
Psychiatric disorders
Anxiety
0
3 (7.7)
2 (5.1)
3 (6.7)
Respiratory, thoracic and mediastinal disorders
Cough
Dyspnoea
Pleural effusion
1 (16.7)
0
1 (16.7)
6 (15.4)
3 (7.7)
2 (5.1)
8 (20.5)
2 (5.1)
4 (10.3)
7 (15.6)
3 (6.7)
3 (6.7)
Skin and subcutaneous disorders
Pruritus
Rash
1 (16.7)
1 (16.7)
5 (12.8)
2 (5.1)
4 (10.3)
5 (12.8)
6 (13.3)
3 (6.7)
Vascular disorders
Hypotension
0
3 (7.7)
2 (5.1)
3 (6.7)
Source: CS, Table 32, page 54-55.
Table only shows preferred terms reported in >10% of all patients with R/R DLBCL treated with Pola+BR (at least 5/45
patients in Phase Ib/II combined)
CCOD: 30 April 2018
The most frequently reported Grade 3-5 adverse events (>5%) are shown in Table 4.16 and deaths in
Table 4.17.
Table 4.16: Most frequently reported Grade 3-5 adverse events (>5%)
n, (%)
Phase Ib Phase II Phase Ib/II
Pola+BR
n=6
Pola+BR
n=39
BR
n=39
Pola+BR
n=45
Blood and Lymphatic System Disorders
Neutropenia
Thrombocytopenia
Anaemia
Febrile neutropenia
Lymphopenia
Leukopenia
0
1 (16.7)
0
1 (16.7)
0
0
18 (46.2)
16 (41.0)
11 (28.2)
4 (10.3)
5 (12.8)
3 (7.7)
13 (33.3)
9 (23.1)
7 (17.9)
5 (12.8)
0
3 (7.7)
18 (40.0)
17 (40.0)
11 (24.2)
5 (11.1)
5 (11.1)
3 (6.7)
Gastrointestinal Disorders
Diarrhoea
Nausea
1 (16.7)
0
1 (2.6)
0
1 (2.6)
0
2 (4.4)
0
General disorders and administration site
conditions
Fatigue
Asthenia
1 (16.7)
0
1 (2.6)
0
1 (2.6)
0
2 (4.4)
0
Copyright 2019 Queen's Printer and Controller of HMSO. All rights reserved

CONFIDENTIAL UNTIL PUBLISHED
50
n, (%)
Phase Ib Phase II Phase Ib/II
Pola+BR
n=6
Pola+BR
n=39
BR
n=39
Pola+BR
n=45
Infections and infestations
Pneumonia
Herpes zoster
1 (16.7)
0
3 (7.7)*
0
1 (2.6)*
1 (2.6)
4 (8.9)
0
Metabolism and nutrition disorders
Hypokalaemia
Hypophosphataemia
0
0
3 (7.7)
1 (2.6)
1 (2.6)
1 (2.6)
3 (6.7)
1 (2.2)
Respiratory, thoracic and mediastinal
disorders
Hypoxia
0
1 (2.6)
1 (2.6)
1 (2.2)
Skin and subcutaneous disorders
Rash
0
0
3 (7.7)
0
Cardiac disorders
Atrial fibrillation
0
0
1 (2.6)
0
Source: CS, page 56.
AE preferred terms reported in >5% of all patients with R/R DLBCL treated with Pola+BR (at least 3 patients
out of total of 45 in Phase Ib/II combined)
*All AEs shown in this table of most frequently reported Grade 3-5 AEs (with onset from first dose of study drug
through 90 days after last dose of study drug) were Grade 3 or 4 except for two fatal (Grade 5) events of
pneumonia (one event each in Pola+BR arm and BR arm of randomised Phase II)
CCOD: 30 April 2018
Table 4.17: Summary of deaths in GO29365
n, (%)
Phase Ib Phase II Phase Ib/II
Pola+BR
n=6
Pola+BR
n=40
BR
n=40
Pola+BR
n=46
Total number of deaths
Adverse events
Disease progression
2
0
2 (100)
23
9 (39.1)
14 (60.9)
28
11 (39.3)
17 (60.7)
25
9 (36.0)
16 (64.0)
No. of deaths ≤30 days of last dose
Adverse events
Disease progression
1
0
1 (100)
1
1(100)
0
8
3 (37.5)
5 (62.5)
2
1 (50.0)
1 (50.0)
No. of deaths >30 days of last dose
Adverse events
Disease progression
1
0
1(100)
22
8 (36.4)
14 (63.6)
20
8 (40.0)
12 (60.0)
23
8 (34.8)
15 (65.2)
Source: CS, Table 33, page 57.
CCOD: 30 April 2018
ERG comment: It can be observed that in the Pola+BR group that deaths due to adverse events and
disease progression tend to occur ≥30 days after the last dose of treatment.
4.2.7 Ongoing studies
The main study in the CS, GO29365, is ongoing. As stated earlier in the report, the company provided
data from a ************* data cut which gave a median follow up of *********. These data have
been included in the ERG’s report.
Copyright 2019 Queen's Printer and Controller of HMSO. All rights reserved

CONFIDENTIAL UNTIL PUBLISHED
51
The CS stated that ‘Two cohorts were added to confirm the efficacy, safety and pharmacokinetics of the
new lyophilised formulation of pola in combination with BR (Arm G [N=42]), w and Arm H [N=60])
**********************************************************************************
**********************************************************************************
**********************************************************************************
**********************************************************************************
**********************************************************************************
*************.’ 14
The company did not mention any further ongoing studies.
ERG comment: In the absence of full evidence, the committee will need to decide if it is satisfied that
the lyophilised formulation of pola will have similar efficacy and safety to the liquid formulation. See
Section 3.2 for a fuller discussion of this issue.
4.3 Critique of trials identified and included in the indirect comparison and/or multiple
treatment comparison
Not applicable.
4.4 Critique of the indirect comparison and/or multiple treatment comparison
Not applicable.
4.5 Additional work on clinical effectiveness undertaken by the ERG
No additional work was undertaken by the ERG.
4.6 Conclusions of the clinical effectiveness section
The company conducted a systematic review to identify evidence relevant to this appraisal. They
considered 16 studies for inclusion (four RCTs, 12 observational studies). The ERG examined the four
RCTs identified and agreed that a network could not be constructed to inform an indirect comparison
between Pola+BR and other relevant treatments. Equally, in examination of the observational studies a
match-adjusted comparison did not appear to be appropriate given the differences identified by the
company in populations and line of treatment across the studies.
One study was mentioned in the CS as relevant to the technology being appraised, a Phase Ib/II,
multicentre, open-label trial (GO29365) of polatuzumab in combination with BR in patients with R/R
DLBCL, and polatuzumab in combination with bendamustine and obinutuzumab (BG) in patients with
R/R follicular lymphoma. The data from this trial do seem to be consistent with the scope in term of
population, intervention, comparator and outcomes.14, 26 However, the ERG had a number of concerns
detailed below.
The company considered the following patients to be eligible for Pola+BR:
• R/R patients who are clear non-candidates for transplant (unfit for intensive therapy based on
physician assessment), either as second-line treatment or as a third-line treatment and beyond
for patients who have relapsed following or are refractory to their last-line of therapy
• R/R patients who would be candidates for transplant but fail to respond to salvage therapy (and
are therefore transplant ineligible)
• R/R patients who receive salvage therapy and ASCT but subsequently relapse
Copyright 2019 Queen's Printer and Controller of HMSO. All rights reserved

CONFIDENTIAL UNTIL PUBLISHED
52
However patient numbers in the main trial were too small to provide meaningful subgroup results by
type of patient or line of therapy. The committee will need to decide if overall results are equally
relevant to all groups and lines of therapy.
Although the NICE scope specifies that the population is those for whom hematopoietic stem cell
transplant is not suitable, 16 of the patients in the trial had received prior ASCT and as seen above the
company did consider this group to be relevant to the decision problem. The company did provide
some results excluding those patients in response to clarification.2 Since it is not clear to the ERG if
patients who have undergone ASCT (and become ineligible because of that) are part of the population
eligible for Pola+BR in clinical practice, it is also unclear which results are most appropriate. However,
removal of those 16 patients only seems to improve outcomes.
The ERG also would highlight some doubt as to the suitability of the intervention, at least in its
lyophilised formulation. In the absence of full evidence (relevant arms with this formulation are
ongoing), the committee will need to decide if it is satisfied that the lyophilised formulation of pola will
have similar efficacy and safety to the liquid formulation.
Whilst the comparator in the GO29365 trial is consistent with the scope, it seems likely that it is not the
only suitable one, R-GemOx also being likely to be increasingly used in clinical practice. In the absence
of direct evidence, it is not clear if R-GemOx can be assumed to have equal efficacy and safety outcomes
to BR.
The main trial, GO29365, was randomised and was well conducted. It was, however, open label. Both
patients and healthcare professionals involved in their care were aware of treatment allocation. The
ERG considers the independent review committee outcome results to be more appropriate and has
highlighted these in the report. Although the trial was multinational, it was relatively small (40 patients
were randomised to Pola+BR) so the evidence base on which results are based is limited. Three patients
were included from the UK. The company was asked to justify the applicability of the trial to UK
clinical practice. They stated that the baseline characteristics of the population of G029365 were similar
to a UK study of pixantrone in R/R DLBCL patients.1 The company also obtained advice from clinical
experts who ‘confirmed that the baseline characteristics of patients enrolled in GO29365 are reflective
of the population seen in UK clinical practice and corroborates the comparison to the retrospective
analysis’2 The ERG considered this reasonable but noted that non-white participants were
underrepresented and that most patients had ECOG status of 0 or 1.
Pola+BR showed superior results to BR in outcomes relevant to this appraisal. After ********* median
follow up months there was an estimated increase in median PFS of about ********** and an increase
in median OS of **************** for patients treated with Pola+BR compared to patients treated
with BR. Given the limited life expectancy of patients with relapsed or refractory DLBCL, the
intervention does meet end-of-life criteria specified by NICE. Adverse events were similar although
there appeared to be more modification of study drugs in the Pola+BR group in the trial. Peripheral
neuropathy was more frequently reported with Pola+BR. As yet no information is available on long-
term ‘cure’ rates and longer-term rarer adverse events. The trial is ongoing.
Copyright 2019 Queen's Printer and Controller of HMSO. All rights reserved

CONFIDENTIAL UNTIL PUBLISHED
53
5. COST-EFFECTIVENESS
5.1 ERG comment on company’s review of cost effectiveness evidence
5.1.1 Searches performed for cost effectiveness section
The following paragraphs contain summaries and critiques of all searches related to cost effectiveness,
HRQoL and cost and healthcare resource identification presented in the company submission.
Appendix G of the CS details systematic searches of the literature used to identify cost effectiveness
studies. Appendix H of the CS details systematic searches of the literature used to identify HRQoL
studies. Appendix I of the CS details systematic searches of the literature used to identify cost and
healthcare resource identification, measurement and valuation studies.14
Database searches for cost effectiveness and HRQoL were undertaken on 4 September 2018 and those
for cost and healthcare resource identification, measurement and valuation took place on 19 November
2018. A summary of the sources searched is provided in Table 5.1 and Table 5.2 below.
Table 5.1: Data sources for the cost effectiveness and HRQoL systematic reviews
Search strategy
element
Resource Host/source Date range Date searched
Electronic
databases
Medline OVID 1946-Present 4 Sept 2018
Medline Epub
Ahead of Print,
In-Process &
Other Non-
Indexed Citations
Not provided
Medline Daily
Embase 1974- Present 4 Sept 2018
HTA Database OVID Not provided 4 Sept 2018
NHS EED Not provided
Econlit OVID 1961-present 4 Sept 2018
Conference
proceedings
EHA Not reported 2015-2018 8/9 October 2018
ICML
ASH
ASCO
ESMO
ISPOR
HTAi
SMDM
HTA Agencies NICE, SMC,
AWMSG, PBAC,
CADTH,
INESSS, HAS
Not reported 2015-2018 8/9 October 2018
Updated search
conducted list
sent with
clarification
response
Additional
resources
CEA Registry,
RePEc,
Websites links
provided
8/9 October 2018
Copyright 2019 Queen's Printer and Controller of HMSO. All rights reserved

CONFIDENTIAL UNTIL PUBLISHED
54
Search strategy
element
Resource Host/source Date range Date searched
INAHTA, NIHR
HTA database,
CRD databases,
ScHARRHUD,
Latin American
and Caribbean
Health Sciences
Literature
Bibliographies of all included studies and relevant SLRs were manually searched to identify additional
primary studies.
Source: Appendices G and H of the CS.14
Abbreviations: ASCO = American Society of Clinical Oncology; ASH = American Society of Hematology;
AWMSG = All Wales Medicines Strategy Group; CADTH = Canadian Agency for Drugs and Technologies
in Health; CRD = Centre for Reviews and Dissemination; EHA = European Hematology Association; ESMO
= European Society for Medical Oncology; HAS = Haute Autorite de Sante; HTA Database = Health
Technology Assessment Database; HTAi = Health Technology Assessment International; ICML =
International Conference on Malignancy Lymphoma; INAHTA = International Network of Agencies for
Health Technology Assessment; INESSS = Institut National D’excellence en services sociaux; ISPOR=
International Society for Pharmacoeconomics and Outcomes Research; NHS EED = NHS Economic
Evaluation Database; NICE = National Institute for Health and Care Excellence; NIHR = National Institute for
Health Research; PBAC = Pharmaceutical Benefits Advisory Committee; RePEc = Research Papers in
Economics; ScHARRHUD = School of Health and Related Research Health Utilities Database; SMC =
Scottish Medicine Consortium; SMDM = Society for Medical Decision Making.
Table 5.2: Data sources for the cost and healthcare resource identification, measurement and
valuation
Search strategy
element
Resource Host/source Date range Date searched
Electronic
databases
Medline OVID 1946-Nov 16
2018
19 November
2018
Medline Epub
Ahead of Print,
In-Process &
Other Non-
Indexed Citations
Up to Nov 16
2018
Medline Daily
Embase 1974- 16 Nov
2018
19 November
2018
HTA Database OVID CRD York 19 November
2018 NHS EED CRD York
Econlit EBSCO 1866-Nov 2018 19 November
2018
Conference
proceedings
ESMO Website links
provided
2016-2018 Searched
between 21
Nov/4 Dec 2018 ASCO
EHA
ASH
ICML
Copyright 2019 Queen's Printer and Controller of HMSO. All rights reserved

CONFIDENTIAL UNTIL PUBLISHED
55
Search strategy
element
Resource Host/source Date range Date searched
ISPOR
HTAi
SMDM
HTA Agencies NICE NICE website No date provided 29 Nov 2018
Bibliographies of all included studies and relevant SLRs were manually searched to identify additional
primary studies.
Source: Appendix I of the CS.14
Abbreviations: ASCO = American Society of Clinical Oncology; ASH = American Society of Hematology;
EHA = European Hematology Association; ESMO = European Society for Medical Oncology; HTA Database
= Health Technology Assessment Database; HTAi = Health Technology Assessment International; ICML =
International Conference on Malignancy Lymphoma; ISPOR= International Society for Pharmacoeconomics
and Outcomes Research; NHS EED = NHS Economic Evaluation Database; NICE = National Institute for
Health and Care Excellence SMDM = Society for Medical Decision Making.
ERG comment: The ERG considers the database searches and methodology reported in the CS to
support the systematic review of cost effectiveness data, HRQoL and resource use on the whole to be
comprehensive, transparent, reproducible and fit for purpose. There were a few minor reporting issues
as follows:
• Date spans for NHS EED and HTA databases were not reported.
• The search strategy for Econlit was not provided for the cost effectiveness search.
• Additional economics terms were included in the strategies designed to find economic studies
and HRQoL studies in NHS EED and the HTA database. These are already filtered sources and
therefore the ERG considers the use of such additional terms redundant since it could impose
unnecessary restrictions on the search in these databases.
• The cost effectiveness and HRQoL searches utilised study design filters and terms from
previous NICE HTA submissions, although references were provided for the filters used.
• A broad range of additional sources were ‘hand’ searched, the sources and terms used were
reported in detail for the resource use strategies in Appendix I (i.e. website addresses and terms
used to search them), but not reported for the searches in Appendix G or H.
5.1.2 Inclusion/exclusion criteria
The predefined eligibility criteria for the cost effectiveness, HRQoL and cost/resource use SLRs are
detailed in Table 10 (Appendix G), Table 18 (Appendix H) and Table 28 (Appendix I) of the CS
respectively.14 The inclusion/exclusion criteria were based on the PICOS criteria, to identify the
population and disease, interventions, comparators, outcomes, and study designs of interest, as well as
publication types, publication dates and language. Non-English language papers without an English
abstract were excluded for all three SLRs, except in the case of the cost/resource use SLR where, if the
full text was non-English, but the abstract contained enough data to be eligible in its own right, this
could be included. There were no exclusions based on the geographical setting of studies in the cost
effectiveness and HRQoL SLRs. However, the cost/resource use SLR excluded studies set outside of
the UK or, in the case of pooled data, where UK data was not presented separately.
The title-abstract and full-text screening were conducted by two independent reviewers. For studies
meeting the eligibility criteria after the second (full text) screening stage, data were extracted by a single
Copyright 2019 Queen's Printer and Controller of HMSO. All rights reserved

CONFIDENTIAL UNTIL PUBLISHED
56
reviewer and 20% of data elements were verified by a second independent reviewer, with disputes
referred to a third reviewer if necessary.
ERG comment: The exclusion of non-UK settings in the cost/resource use SLR is very restrictive and
could have excluded useful evidence. The SLR could have identified costs and resource use evidence
for this population from other countries and converted costs to UK costs using standard and accepted
techniques.
5.1.3 Identified studies
Cost effectiveness SLR
In total, 243 papers were identified from electronic database searches for the cost effectiveness SLR.
Upon the removal of duplicate papers, 227 records were reviewed at the title/abstract review stage. A
total of 36 were deemed to be potentially relevant and were reviewed in full; of these, 15 were excluded.
Hand searching yielded an additional three publications. This resulted in a total of 24 publications
included in the SLR of economic evaluations. Out of these, five studies reporting data for relapsed and
refractory disease were extracted. The strategy and corresponding in- and exclusions are presented
schematically in the PRISMA flow diagram in Figure 5 from Appendix G of the CS.
The review identified five relevant studies which reported data for patients with R/R DLBCL. These
studies are considered most relevant for the decision problem by NICE and are discussed further. A
summary of the five studies is provided in Table 5.3 below.
Copyright 2019 Queen's Printer and Controller of HMSO. All rights reserved

57
Table 5.3: Summary of included studies in the economic evaluations SLR
Study name
Country
Study design
Patient population Interventions and
comparators Model settings Model summary
QALYs (Interventions,
comparator)
Costs (currency)
(Intervention,
comparator)
ICER (per QALY
gained)
Kymes 2012 32
USA
R/R DLBCL
patients undergoing
ASCT at
Washington
University
N=20
Mean age (SD):
56.5 (11.6) years
G-CSF with plerixafor
G-CSF + Placebo
Perspective:
Societal
perspective
Time horizon:
Lifetime
Cycle length: 1
year
Discounting: 3%
(cost and benefits)
Markov model
using a
microsimulation
approach. The
model was made
up of 8 health
states:
1st apheresis
2nd apheresis
3rd apheresis
4th apheresis
Rescue
Transplant
Recurrence
Death
QALYs:
G-CSF alone: 5.05
Plerixafor and G-CSF:
6.80
Incremental QALYs:
Plerixafor plus G-CSF
vs G-CSF alone: 1.75
Total cost:
G-CSF alone: $67,730
Plerixafor and G-CSF:
$93,180
Incremental cost:
Plerixafor plus G-CSF
vs G-CSF alone:
$25,450
ICER (per QALY
gained):
Plerixafor and G-CSF vs
G-CSF alone: $14,574
NICE TA306
UK 13
Adults with
relapsed DLBCL
after 2 or more
chemotherapy
regimens,
including at least 1
standard
anthracycline-
containing regimen
with a response
that had lasted at
least 24 weeks
N=104
Pixantrone
Physician’s choice
Perspective: Payer
perspective (NHS)
Time horizon:
Lifetime (23 years)
Cycle length: 1
week
Discounting: 3.5%
(cost and benefits)
Semi-Markov
model that
contained 4 health
states:
Stable/PFS, on 3rd
or 4th line treatment
Stable/PFS,
discontinued 3rd or
4th line treatment
Progressive/
relapsed disease
Death
QALYs:
Pixantrone: 1.25
Physician choice: 0.83
Incremental QALYs:
Pixantrone vs physician
choice: 0.42
Total cost:
Pixantrone: £62,795
Physician choice:
£52,953
Incremental cost:
Pixantrone vs physician
choice: £9,841
ICER (per QALY
gained):
Pixantrone vs physician
choice: £23,699
Copyright 2019 Queen's Printer and Controller of HMSO. All rights reserved

CONFIDENTIAL UNTIL PUBLISHED
58
Study name
Country
Study design
Patient population Interventions and
comparators Model settings Model summary
QALYs (Interventions,
comparator)
Costs (currency)
(Intervention,
comparator)
ICER (per QALY
gained)
NICE
ID1115/TA559
UK 5
Adults with R/R
DLBCL who either
failed auto SCT or
were ineligible for
or did not consent
to autologous SCT
Axicabtagene ciloleucel
(Axi-cel)
BSC
Perspective: Payer
perspective (NHS)
Time horizon:
Lifetime (44 years)
Cycle length: 1
month
Discounting: 3.5%
(cost and benefits)
De novo model
with 3 health
states:
Pre-progression
Post progression
Death
QALYs:
Axi-cel vs BSC: 4.30
Incremental cost:
Axi-cel vs BSC:
£289,571
ICER (Cost/QALY):
Axi-cel vs BSC: £67,323
NICE
ID1166/TA567
UK 3
Adults with R/R
DLBCL who either
failed auto ASCT
or were ineligible
for or did not
consent to
autologous ASCT
N=111
Tisagenlecleucel
Pixantrone monotherapy
R-GEMOX
R-GDP
Perspective: Payer
perspective (NHS)
Time horizon:
Lifetime (46 years)
Cycle length: 1
month
Discounting: 3.5%
(cost and benefits)
A de novo cost-
utility model with 3
health states:
Progression free
Progressed disease
Death
NR (all values in
submission were
secured)
NR (all values in
submission were
secured)
ICER (Cost/QALY):
Tisagenlecleucel vs R-
GemOx: £47,684
Tisagenlecleucel vs R-
GDP: £47,526
Tisagenlecleucel vs
Pixantrone
monotherapy: £44,648
Wang 2017
UK 33
Patients newly
diagnosed with
DLBCL in
the UK’s
population-based
Haematological
Malignancy
Research Network
Second-line
treatment: N=577
Third-line
treatment: N=106
Not specific to particular
treatment, overall
treatment pathway costs
(including first-line,
second-line plus ASCT,
without ASCT, and
untreated patients)
Perspective: NHS
and social service
perspective
Time horizon:
Lifetime
Cycle length: NR
Discounting: 3.5%
(cost and benefits)
Discrete event
based micro-
simulation model
The model
structure was based
on patient
treatment pathways
determined from
empirical HMRN
data, expert
opinion and
clinical guidelines
Life days, mean cost
(95% CI):
Second-line with ASCT:
6,837 (6,797–6,877)
Second-line without
ASCT: 2,628 (2,610–
2,646)
Mean cost (95% CI):
Second-line treatment:
£23,449 (£23,365–
£23,534)
With ASCT: £56,442
(£56,409–£56,474)
Without ASCT: £9,956
(£9,932–£9,981)
End-of-life care:
For untreated patients:
£2,930 (£2,918–2,942)
For treated patients:
£4,767 (£4,755–£4,780)
NR
Source: Table 11 in Appendix G of the CS.14
Copyright 2019 Queen's Printer and Controller of HMSO. All rights reserved

CONFIDENTIAL UNTIL PUBLISHED
59
Study name
Country
Study design
Patient population Interventions and
comparators Model settings Model summary
QALYs (Interventions,
comparator)
Costs (currency)
(Intervention,
comparator)
ICER (per QALY
gained)
Abbreviations: ASCT = autologous stem cell transplantation; BSC = best supportive care; CI = confidence interval; CUA = cost-utility analysis; DLBCL = diffuse large B cell lymphoma; G-
CSF = granulocyte colony-stimulating factor; HMRN = Haematological Malignancy Research Network; ICER = incremental cost-effectiveness ratio; NHS = National Health Service; NR = not
reported; PMBCL = primary mediastinal B-cell lymphoma; QALY =quality-adjusted life year; R-GDP = rituximab, gemcitabine, cisplatin and dexamethasone; R-GEMOX = rituximab,
gemcitabine and oxaliplatin; RGCVP = rituximab, gemcitabine, cyclophosphamide, vincristine and prednisolone; R/R = relapsed/refractory; SCT = stem cell transplant; SD = standard deviation;
UK = United Kingdom; USA = United States of America.
Copyright 2019 Queen's Printer and Controller of HMSO. All rights reserved

60
Quality assessment of the five economic evaluations extracted was performed using the 36-item
checklist in Section 5.1.3 of the NICE Single Technology Appraisal (STA) Specification for
manufacturer/sponsor submission of evidence (January 2015), adapted from Drummond and Jefferson,
1996.34 The results are presented in Table 14 in Appendix G of the CS.
The five studies identified in the SLR of cost effectiveness studies were not presented in the main body
as they did not evaluate polatuzumab vedotin in combination with bendamustine and rituximab or any
of the comparators in the NICE scope as the primary intervention under consideration.
HRQoL SLR
The electronic database searches for the HRQoL SLR identified 258 unique records to be screened at
title and abstract level, of which 23 were deemed potentially relevant and read at full text. Six of these
were included and an additional three studies were identified by hand searching. Of these nine
publications, seven reported utility values for R/R DLBCL and were extracted. A summary of the seven
included studies is shown in Table 19 in Appendix H of the CS and a summary of each, with regards to
their relevance to the NICE reference case, is provided in Table 20 in the CS.14
Cost/Resource use SLR
Two hundred and thirty-five unique records were identified from electronic database searching and
screened at the title and abstract stage, of which 18 records were reviewed at full test. Only one study
was identified which met the inclusion criteria as it included patients with R/R DLBCL and presented
data relevant to the UK NHS and PSS. The company did not identify any additional studies that met the
eligibility criteria through manual searching of relevant congresses and NICE Technology Appraisals
or through hand searching the bibliographies of relevant SLRs, meta-analyses and economic
evaluations. Details and results of the included study are displayed in Table 29 in Appendix I of the CS.
ERG comment: The review was generally well reported and identified a range of cost effectiveness,
HRQoL, cost/resource use evidence relevant to the indication and potentially useful for the cost
effectiveness analysis. However, none of the identified studies were investigating pola, specifically.
Therefore, the identified evidence did not negate the necessity to develop a de novo economic model.
5.2 Summary and critique of company’s submitted economic evaluation by the ERG
Copyright 2019 Queen's Printer and Controller of HMSO. All rights reserved

61
Table 5.4: Summary of the company submission economic evaluation Approach Source/Justification in the company submission Signpost
(location in
ERG report)
Model Three state partitioned survival model.
The states are progression-free survival, progressed disease and
death.
The approach is in line with NICE Decision Support
Unit (DSU) guidance35 and consistent with previous
appraisals conducted in this disease setting (TA306,
TA559, TA567).13,5,3 The modelling of OS and PFS
is based on study-observed events, which should
accurately reflect disease progression and the long-
term expected survival profile of patients treated with
Pola+BR.
Section 5.2.2
States and
events
Patients start in the progression-free survival state, where they remain
until progression or death. Upon progression, patients either remain
in the progressed disease state, or they die.
Consistent with previous appraisals in oncology. Section 5.2.2
Comparators Base-case comparator is a combination of bendamustine and
rituximab (BR). In a scenario analysis R-GemOx was included as an
additional comparator, assuming equivalent efficacy with BR.
BR was the comparator in the randomised phase II
GO29365 trial, thus enabling a robust direct
comparison with Pola+BR. R-GemOx was the only
additional comparator from the NICE scope, for
which the company identified efficacy evidence. The
company stated that no connected network was
available for indirect comparison. Due to the
differences between study populations, the company
stated that robust unanchored comparison was not
possible. Therefore, equal efficacy with BR was
assumed.
Section 5.2.4
Natural
history
Based on partitioned survival model. Transitions between PFS and OS estimates were modelled independently,
with the proportion of progressed patients at each Section 2.1 and
5.2.2
Copyright 2019 Queen's Printer and Controller of HMSO. All rights reserved

CONFIDENTIAL UNTIL PUBLISHED
62
Approach Source/Justification in the company submission Signpost
(location in
ERG report)
states were based on GO29365 trial, also it is assumed that after 2
years in the PFS state, patients are assumed as cured and general
population mortality, utility and cost values are assigned.
cycle calculated as the difference between the OS and
the PFS curves.
The cure assumption was justified by the company
according to consultation with clinical experts and
previous literature.
Treatment
effectiveness
Treatment effectiveness (in terms of OS and PFS) of Pola+BR and
BR treatments are based on the extrapolation curves fitted to the OS
and PFS KM from the GO29365 study. In terms of TTOT, the
survival probabilities that were calculated from the KM curves are
used for Pola+BR and BR treatment arms.
For the R-GemOx treatment, same effectiveness as BR treatment was
assumed.
A de novo cure-mixture modelling method was used
in the extrapolation of PFS and OS from the
GO29365 study. The cure assumption was justified
by the company according to the clinical experts and
literature.
Section 5.2.6
Adverse
events
The effects of AEs are captured by applying a one-off cost and a
utility decrement over a stated time period based on data from the
clinical trial, previous NICE technology appraisals, and other related
literature.
For Pola+BR and BR, while calculating the type and
frequency of the treatment-related AEs, the grade 3-5
AE data from the GO29365 study, using the clinical
cut-off date of April 2018, were used.
The type and frequency of AEs experienced with R-
GemOx treatment were derived from Grade 3–5 AEs
affecting >5% of patients in a Phase II study on the
treatment of R/R DLBCL patients with R-GemOx. 9
Duration of the AEs were sourced primarily from
GO29365 and also TA306 13
Section 5.2.7
Health related
QoL
HRQoL data was not collected in GO29365. The company conducted
a systematic review to identify utility values for R/R DLBCL patients
in the progression-free and progressed disease health states as well as
Base-case utility values were taken from the previous
NICE technology appraisal TA559, which used
HRQoL data collected in the ZUMA-1 trial,
investigating the efficacy of axicabtagene in patients
Section 5.2.8
Copyright 2019 Queen's Printer and Controller of HMSO. All rights reserved

CONFIDENTIAL UNTIL PUBLISHED
63
Approach Source/Justification in the company submission Signpost
(location in
ERG report)
utility decrements associated with AEs experienced in the GO29365
trial.
with mixed histology lymphoma (including
DLBCL).5
Resource
utilisation and
costs
The economic analysis was performed from the NHS and PSS
perspective.
The following state-specific costs were included:
• drug acquisition and administration
• treatment-related AEs
• routine supportive care (professional and social services,
health care professionals and hospital resource use, treatment
follow-up; for a maximum of two years)
• subsequent treatment costs.
Healthcare unit costs were obtained from the National
Audit Office 200810, PSSRU 201811, and NHS
reference costs. 12
The frequency of the healthcare resource use is
primarily sourced from TA306.13
Drug costs were taken from the BNF and eMIT
databases.
The dose information was derived from the GO29365
trial, whereas for the R-GemOx, it is obtained from
Mounier et al.9
Administration costs and adverse event were mostly
obtained from NHS reference costs and percentage of
the treatments used in the subsequent treatments were
from the GO29365 trial and clinical expert opinion.
Section 5.2.9
Discount rates Cost and health outcomes discounted at 3.5% As per NICE reference case Section 5.2.5
Sensitivity
analysis
Probabilistic, deterministic one-way sensitivity analysis and scenario
analyses conducted
As per NICE reference case Section 6.2.1
Abbreviations: AE = adverse event; BNF = British National Formulary; BR = bendamustine + rituximab; DLBCL = diffuse large B cell lymphoma; eMIT = electronic Market
Information Tool; HRQoL = health-related quality of life; KM = Kaplan-Meier; NHS = National Health Service; NICE = National Institute for Health and Care Excellence; OS =
overall survival; PFS = progression-free survival; Pola+BR = polatuzumab + bendamustine + rituximab; PSS = personal social services; PSSRU = Personal Social Services
Research Unit; R-GemOx = rituximab + gemcitabine + oxaliplatin; R/R = relapsed/refractory; TTOT = time to off treatment.
Copyright 2019 Queen's Printer and Controller of HMSO. All rights reserved

64
5.2.1 NICE reference case checklist (TABLE ONLY)
Table 5.5: NICE reference case checklist
Element of health
technology assessment
Reference case ERG comment on company’s
submission
Perspective on outcomes All direct health effects, whether
for patients or, when relevant,
carers.
Direct health effects for patients
included.
Perspective on costs NHS and PSS. NHS and PSS perspective taken.
Type of economic
evaluation
Cost–utility analysis with fully
incremental analysis.
Cost-utility analysis with fully
incremental analysis undertaken.
Time horizon Long enough to reflect all
important differences in costs or
outcomes between the technologies
being compared.
The model time horizon of 45
years is appropriate for a lifetime
horizon as the average age of
patients at the start of treatment
was 69 years.
Synthesis of evidence on
health effects
Based on systematic review. Systematic review conducted to
identify evidence on health effects.
Measuring and valuing
health effects
Health effects should be expressed
in QALYs. The EQ-5D is the
preferred measure of health-related
quality of life in adults.
Health effects expressed in
QALYs. HRQoL measured using
the EQ-5D-5L.
Source of data for
measurement of health-
related quality of life
Reported directly by patients
and/or carers.
HRQoL reported by R/R DLBCL
patients in a previous trial
(treatments differ).
Source of preference
data for valuation of
changes in health-related
quality of life
Representative sample of the UK
population.
Representative sample of UK
population. Van Hout mapping
algorithm used to translate EQ-5D-
5L utility values to EQ-5D-3L
values.36
Equity considerations An additional QALY has the same
weight regardless of the other
characteristics of the individuals
receiving the health benefit.
No equity issues have been
identified.
Evidence on resource use
and costs
Costs should relate to NHS and
PSS resources and should be
valued using the prices relevant to
the NHS and PSS.
Costs were sourced from NHS
Reference Costs 2017–18, PSSRU
2018, and the BNF and eMIT.
Discounting The same annual rate for both costs
and health effects (currently 3.5%).
Costs and health effects are
discounted at 3.5%.
Abbreviations: BNF = British National Formulary; eMIT = electronic Market Information Tool; EQ-5D-3/5L =
EuroQol, 5 dimensions, 3/5 levels; NHS = National Health Service; PSS = personal social services; PSSRU =
Personal Social Services Research Unit; QALYs = quality-adjusted life years;
5.2.2 Model structure
The company model, developed in Excel, is a partitioned survival model containing three states, as
shown in Figure 5.1. All patients start in the PFS state. They remain there until progression or death. At
Copyright 2019 Queen's Printer and Controller of HMSO. All rights reserved

CONFIDENTIAL UNTIL PUBLISHED
65
progression, patients enter the progressed disease (PD) state. Patients who enter the progressed disease
state, remain there until their death. Transitions between health states are determined by PFS and OS
survival curves calculated from the GO29365 trial data, with the proportion of patients in the PD health
state calculated as the difference between OS and PFS at any given time point. The proportion of the
patients that are on treatment is informed by the TTOT curves.
The company employed a cure mixture modelling approach, where it is implicitly assumed that a
proportion of patients entered long-term remission (PFS) and are therefore likely to experience long-
term survival similar to the general population. In line with this assumption, for the patients who are
still in the PFS state after two years, it is assumed that there is no healthcare resource utilisation and
also age/gender adjusted general population utilities are assigned to them.
Figure 5.1: Company model structure
Source: Figure 9 in CS.34
The model has a cycle length of one week. Half-cycle correction is applied to account for the fact that
events can happen at any time during the cycle. Costs and utilities are applied to each health state,
weighted according to half-cycle corrected state occupancy, to calculate per-cycle costs and QALYs.
ERG comment: The modelling approach considered by the company is in line with previous NICE
technology appraisals in R/R DLBCL (TA30613, TA5673 and TA5595). Among these three appraisals,
only in TA567 and TA559 (both CAR-T therapies), cure mixture modelling approach was followed.
The ERG has concerns about the cure assumption in this CS, but it will be discussed further in Section
5.2.6.
5.2.3 Population
The company stated that the population considered in the economic evaluation is patients with R/R
DLBCL, who are ineligible for SCT.
The baseline characteristics of the patients used in the model are given in Table 5.6 below:
Copyright 2019 Queen's Printer and Controller of HMSO. All rights reserved

CONFIDENTIAL UNTIL PUBLISHED
66
Table 5.6: Baseline characteristics of the patients used in the model
Patient characteristics
Starting age, years 69.0
Male, % 50.0
Mean weight, kg 74.86
Mean BSA, m2 1.85
Source: Based on Table 59 from the CS.14
Abbreviation: BSA = body surface area.
ERG comment: Even though the population considered is R/R DLBCL patients who are ineligible for
SCT, in section B.3.5.5 of the CS it was stated that two patients received SCT after progression from
their assigned first-line treatment. It is not clear to the ERG how an SCT-ineligible patient at baseline
can become SCT-eligible at a later point in the disease course.
Most of the baseline population characteristics used in the model are based on the GO29365 trial. In
contrast to the trial data, the percentage of males in the model is assumed to be equal to 50%, whereas
the percentage of male patients was 66% in the trial. This deviation has a negligible impact on the cost
effectiveness results, as it was being solely used for the background, non-cancer related mortality in the
model. However, the ERG has corrected this for consistency.
5.2.4 Interventions and comparators
Intervention
The intervention considered in the model is polatuzumab vedotin in combination with bendamustine
and rituximab (Pola+BR), given to patients every three weeks (i.e. one treatment cycle consists of three
weeks) for a maximum number of six treatment cycles. The dosing for Pola+BR assumed in the model
matches the dosing schedule implemented in GO29365 and the anticipated marketing authorisation.
Doses for each component are as follows:
• Polatuzumab vedotin - 1.8 mg/kg intravenous infusion (IV) on day 1. The initial dose should
be administered as a 90-minute infusion. If well tolerated, subsequent doses may be
administered as a 30-minute infusion.
• Bendamustine - 90 mg/m2 IV on days 1 and 2.
• Rituximab - 375 mg/m2 IV on day 1.
No additional tests or investigations are required alongside the provision of Pola+BR.
Comparator
The company argued that there is no universally accepted standard of care for patients with R/R DLBCL
who are ineligible for SCT. These patients are usually prescribed one of the available gemcitabine
and/or platinum-based therapies, or BR according to clinician preference. The company stated that there
is no strong evidence that one regimen is superior to another. The NICE scope listed a number of
treatments used in NHS clinical practice including BR, R-GemOx, R-Gem, R-P-MitCEBO and (R-
)DECC.26 However the company only identified studies for R-GemOx in the clinical SLR. There was
no connected network of randomised studies available to perform an indirect comparison between
Pola+BR and R-GemOx. The company also argued that a robust unanchored comparison was infeasible
“due to significant or unknown differences in prognostic factors in the study populations for GO29365
Copyright 2019 Queen's Printer and Controller of HMSO. All rights reserved

CONFIDENTIAL UNTIL PUBLISHED
67
and captured R-GemOx studies, including proportion of refractory patients, prior rituximab exposure
and number of prior lines of treatment”p.73.14
The base-case comparator chosen by the company is a combination of bendamustine and rituximab
(BR). The company argue that this choice enabled a robust comparison with Pola+BR using data from
the GO29365 trial. The choice was further justified by reference to clinical opinion that the range of
available chemotherapy regimens for R/R DLBCL are considered equally effective. In a scenario
analysis the company also included R-GemOx as an additional comparator, assuming equivalent
efficacy to BR.
ERG comment: In the final scope, there are many comparators (i.e. R-Gem, R-P-MitCEBO and (R-
)DECC) that were not included in the cost effectiveness analyses conducted by the company.14
Other than BR, only R-GemOx was included, assuming same effectiveness as BR. This assumption was
based on a recent real-world evidence study using the US Veterans Health Association database which
found no statistically significant difference in OS between patients with R/R DLBCL treated with BR
and R-GemOx (i.e. median OS of 11 and 13 months, respectively).37
The ERG has concerns regarding the inclusion of only BR and R-GemOx as relevant treatment options
for the SCT ineligible R/R DLBCL patients in the UK. Therefore, the ERG asked whether UK-specific
studies were searched in the literature and whether any of the UK based databases, such as
Haematological Malignancy Research Network (HMRN). were consulted. In their response to the
ERG’s clarification questions, the company mentioned that the clinical SLR had included single arm
studies and the literature was pragmatically searched for additional published data. Additionally, the
company stated that the question on published standard of care data sets was also asked to UK clinicians
at an advisory board. However, no other UK published data were mentioned in addition to the clinical
studies that were subsequently identified in the SLR. Since the meeting transcripts of the advisory board
and the details of the pragmatic literature search approach were not provided in the reference pack, the
ERG could not verify the claims by the company regarding the lack of UK specific data on the UK
clinical practice for this population. Following the ERG’s suggestion,
**********************************************************************************
**********************************************************************************
**********************************************************************************
**********************************
The ERG also considers that the equal effectiveness assumption between the R-GemOx and the BR
therapy was not sufficiently substantiated (comparable OS based on a database study from USA and
clinical experts).37 Therefore, the ERG finds the scenario analyses with R-GemOx comparator (having
equal effectiveness as BR) as uninformative, and therefore this scenario analysis is not explored in
Section 7.
5.2.5 Perspective, time horizon and discounting
The economic analyses were conducted from the perspective of the NHS and Personal Social
Services (PSS). The model has a time horizon of 45 years, which is considered appropriate as a lifetime
horizon given that the average age of patients at the start of treatment is 69 years. Costs and QALYs
were discounted at 3.5% per annum according to the NICE method guidance.
Copyright 2019 Queen's Printer and Controller of HMSO. All rights reserved

CONFIDENTIAL UNTIL PUBLISHED
68
5.2.6 Treatment effectiveness and extrapolation
5.2.6.1 Survival analysis
General approach
The primary source of clinical data for the Pola+BR and BR arms of the economic model is the
GO29365 study. In the original CS, data from the October 2018 data cut point was used to inform the
clinical parameters for PFS and OS. For treatment duration and treatment-related AE rates, the data
from the clinical cut-off date of April 2018 were used, which is when all the patients had completed
treatment with Pola+BR or BR.
PFS and OS results from GO29365 were extrapolated to the model lifetime time horizon. The company
mentioned that the recommendations outlined in NICE DSU Technical Support Document (TSD) 14 38
were followed to identify appropriate parametric survival models. For this purpose, the company
claimed that the following steps were taken while deciding for the appropriate extrapolation choice for
the OS and PFS to be used in the economic model:
• Visual inspection of the log-cumulative hazard plots, based on patient level data for the two
arms of GO29365, to test for the plausibility of the proportional hazards assumption and to
examine the hazard of progression or death in each arm over time
• The Akaike Information Criterion (AIC) and the Bayesian Information Criterion (BIC)
goodness-of-fit statistics were calculated to assess statistical fit of the models to both arms of
the PFS and OS KM data from GO29365
• The clinical plausibility of the long-term extrapolations for the base case parametric models
was validated by comparing the long-term behaviour of the models with suitable data sources
and the expectations of clinical experts
For both PFS and OS, standard parametric survival models (exponential, Weibull, Gompertz, log-
normal, generalised gamma and log-logistic for both joint and independent modelling) were explored.
In addition, cure-mixture models were explored.
Cure-mixture modelling justification
In the CS, a discussion for the justification of the cure-mixture modelling was provided. The company
used the following arguments for the justification of the use of the cure-mixture models:
• A study of the natural history of newly diagnosed DLBCL patients treated with
immunochemotherapy that indicated that the survival of patients who did not experience a
progression or death event after two years was equivalent to that of the age- and gender-matched
general population 4.
• The clinical experts that the company consulted confirmed that patients who achieve two years
PFS are at a very low risk of subsequent progression, and their risk of death can be assumed as
similar to that of the age- and gender-matched general population. 28
• The company considered the risk of relapse or death that was observed in the KM plots for PFS
and OS for Pola+BR towards the end of follow-up as very low, which is indicative of a very
low risk of relapse or death for patients who were still alive towards the end of follow-up.
Copyright 2019 Queen's Printer and Controller of HMSO. All rights reserved

CONFIDENTIAL UNTIL PUBLISHED
69
• The company claimed that the precedent of cure-mixture modelling in NICE appraisals for R/R
DLBCL was established in TA567 and TA559, where the respective committees accepted that
patients who are able to demonstrate sustained remission are likely to experience long-term
survival.
Cure-mixture modelling method
In the CS, the company did not use any of the standard available statistical packages (e.g. flexsurvcure
in R) while fitting mixture cure models, but instead used code that was developed by the company in-
house. In the CS, the mixture models were fitted according to the following steps:
• Classifying patients into either long-term survivor or not.
In the CS, it was reported that the classification was done by applying standard machine learning
methods such as clustering using the expectation–maximisation (EM) algorithm. The purpose of the
clustering is to create two clusters (long-term survivors and non-long-term survivors) based upon a
logistic regression with a number of exploratory variables from the baseline characteristics such as age,
sex, and country., to determine the probability that a patient becomes a long-term survivor or not.
• After the classification, long-term survivors are assumed to be free from disease-specific
mortality whereas parametric survival curves are fitted to the survival data from non-long-term
survivors.
• The weighted mixture of the long-term survivor and non-long-term survivors’ survival data
provide the survival extrapolation for the whole population (See Figure 5.2 for visualisation)
Figure 5.2: Example of the how the cure-mixture model estimates OS by combining estimates
(illustration only)
Source: based on Figure 9 from the Appendix M from the company submission.14
ERG comment: The critique of the ERG on the general survival analysis approaches are listed under
the subheadings below:
Copyright 2019 Queen's Printer and Controller of HMSO. All rights reserved

CONFIDENTIAL UNTIL PUBLISHED
70
Exclusion of other flexible parametric models
The ERG considers that the company could have explored other survival modelling options in addition
to cure mixture modelling (e.g. flexible parametric modelling using splines, landmark models based on
response, cure non-mixture models or other mixture modelling methods than cure), however the
company chose to explore only cure-mixture models when they considered that standard parametric
models were not appropriate.
Upon the request from the ERG for a justification for excluding other flexible parametric models, the
company stated that the spline models were originally dismissed as “they may fit the observed data, but
a better fit may not result in a more plausible extrapolation... Our opinion is that by using a spline, the
extrapolation would be mainly based on the KM curve at the end of the follow up period with very few
patients at risk and therefore be more uncertain and less robust and could change substantially with a
small number of additional events. This is less the case for standard parametric functions or cure-
mixture models. Furthermore, the use of cure-mixture models was justified by the natural history of the
disease.”2
The ERG disagrees with the company and considers that the justification of the company for not using
spline models (i.e. extrapolation would be mainly based on the KM curve at the end of the follow-up
period) was in conflict with their own justification for using cure-mixture models, which indeed use the
low number of deaths/progressions observed in the KM curve at the end of the follow-up period.
Upon the request of the ERG, the company provided the visual fit of a 3-knot spline model to the KM
survival curves for Pola+BR and BR arms, in their response to the clarification letter.2 Without
providing the details of the spline modelling exercise followed (e.g. the distribution used, how the knots
were determined etc.) the company concluded that spline models would not result in a more plausible
long-term extrapolation and therefore they were not included in the economic model. The ERG
considers that a conclusion on the implausibility of the spline models that is based only on a single
example, and without providing further details, as questionable. Therefore, the ERG considers that other
type of extrapolation methods should have been investigated next to the cure-mixture modelling.
Not using available standard codes for cure mixture modelling
The company used their in-house developed cure-mixture modelling code in R, instead of the standard
packages available such as “flexsurv cure” package in R. The in-house codes were accessible on github.
However, the explanation of the code provided by the company upon the ERG’s request did not provide
sufficient clarity. Therefore, the ERG could not verify the correctness and plausibility of the in-house
code of the company.
From the description of the in-house code in the Appendix M of the CS, the ERG has concerns on the
clustering algorithm (expectation maximisation) used by the company. First of all, the company stated
that the clustering algorithm uses “age”, “gender”, “country” and “year of the trial” to determine the
chances of an individual being a long-term survivor or not, separately for Pola+BR and BR arms. The
ERG thinks that many other prognostic factors exist that could have been used while predicting the
chances of “cure” for PFS and OS. Furthermore, the ERG has doubts if machine learning based
algorithms (such as expectation maximisation) that were originally designed for applications that are
characterised by the availability of big data, would be suitable for determining the cure probabilities
based on a dataset that is limited to 80 patients. Also, it is unclear to the ERG how the individual cure
probabilities are translated to the cure fractions used in the parametric extrapolations of the cure-mixture
models.
Copyright 2019 Queen's Printer and Controller of HMSO. All rights reserved
CONFIDENTIAL UNTIL PUBLISHED
71
Arguments used for the justification of the “cure” assumption by the company
The ERG would like to comment on the arguments provided by the company for the justification of the
“cure” assumption. The other arguments, based on the particular PFS and OS data from the trial will be
discussed in the following subsections.
The company referred to the long-term survival pattern observed in a study of the natural history of
newly diagnosed DLBCL patients treated with immunochemotherapy.4 The ERG is doubtful if the
findings of this study would hold for the indicated population for Pola+BR, which is R/R DLBCL.
Secondly, the company claimed that the precedent of cure-mixture modelling in NICE appraisals for
R/R DLBCL was established in TA567 and TA559, where the respective committees accepted that
patients who are able to demonstrate sustained remission are likely to experience long-term survival.
The ERG considers that the acceptance of cure-mixture modelling in previous appraisals does not
provide a convincing argument, as each case should be handled separately. Furthermore, the ERG noted
that these two appraisals were focusing on CAR-T type interventions, which are very different from the
intervention considered in this appraisal.
5.2.6.2 Progression free survival
For the extrapolation of PFS in the model, the company has chosen the investigator-assessed PFS from
the October 2018 data cut-off from the GO29365 trial. The company considered that the investigator-
assessed PFS was more suitable for inclusion in the model, since providing a patient with the next line
of treatment was often based on progression as measured by the investigator. Therefore, investigator-
assessed data were considered as more consistent with the treatment pathway.
Assessment of the proportional hazards assumption
The log-cumulative hazard plots for the investigator assessed PFS from GO29365 was provided in
Figure 11 of the CS.14 Based on the approximately parallel lines, the company deemed the proportional
hazards assumption to be plausible. Therefore, the company considered both independent and
dependent (joint) models (in the latter, treatment received is the covariate), for the PFS extrapolation,
using standard distributions (e.g. exponential, Weibull, lognormal, loglogistic, generalised gamma) to
be plausible.
Assessment of the cure-mixture modelling
The company considered that the cure-mixture modelling for the PFS extrapolation is justifiable,
because the company interpreted from the KM PFS curves and log cumulative hazard plots that the
relapse rates after the 24 month time-point were very low, that the hazard of progression declines toward
the end of the follow-up period, and that the cumulative incidence of the progression events (Figure 13
in the CS14) suggested that most of the events occurred within the first 12 months. Therefore, the
company investigated independently fitted cure-mixture parametric models. In these models, it is
assumed that a proportion of patients achieving long-term remission is a parameter that can be fitted
from the observed GO29365 data via logistic regression. This ‘cure fraction’ of patients is assumed not
to progress or be susceptible to cancer-related death.
Statistical fit of the data
The company provided the AIC and BIC goodness of fit results for the functions used to model PFS for
Pola+BR and BR in GO29365, as well as the subjective qualitative impression of visual fit to the
observed KM curve in Table 40 from the CS.14
Copyright 2019 Queen's Printer and Controller of HMSO. All rights reserved
CONFIDENTIAL UNTIL PUBLISHED
72
The company did not include the Gompertz distribution in the extrapolation of the PFS curves, as the
parameterisation for the Gompertz model did not converge for OS in both arms.
Among the standard models (dependently and independently fit), the AIC and BIC statistics indicated
that all models had a similar statistical fit to the KM data in both arms. The top-ranking models (both
arms) for both dependent and independently-fitted extrapolations were the log-normal, generalised
gamma and log-logistic. Similarly, for the cure-mixture models, minimal variation was observed among
the goodness of fit statistics. The best ranking models, in terms of AIC, were the generalised gamma
and log-logistic for Pola+BR, and the log-normal, log-logistic and exponential for BR.
Investigation of the visual fit of the extrapolations
The visual fit investigation of the extrapolations were conducted separately for dependent, independent
and cure-mixture models. The fitted dependent and independent standard parametric extrapolations, as
well as the cure-mixture models, are presented in Figure 5.3, Figure 5.4 and Figure 5.5 below
respectively.
Figure 5.3: PFS standard extrapolation functions (dependent fit, GO29365, Oct. 2018 cut-off)
Source: Figure 14 from the CS.14
The Gompertz extrapolation was not considered for either arm for PFS due failure of parameterisation for this
function for OS; this extrapolation is therefore not presented.
Abbreviations: BR = bendamustine + rituximab; KM = Kaplan-Meier; Pola+BR = polatuzumab + bendamustine
+ rituximab.
Copyright 2019 Queen's Printer and Controller of HMSO. All rights reserved

CONFIDENTIAL UNTIL PUBLISHED
73
Figure 5.4: PFS standard extrapolation functions (independent fit GO29365, Oct. 2018 cut-off)
Source: Figure 15 from the CS.14
The Gompertz extrapolation was not considered for either arm for PFS due failure of parameterisation for this
function for OS; this extrapolation is therefore not presented.
Abbreviations: BR = bendamustine + rituximab; KM = Kaplan-Meier; Pola+BR = polatuzumab + bendamustine
+ rituximab.
Copyright 2019 Queen's Printer and Controller of HMSO. All rights reserved

CONFIDENTIAL UNTIL PUBLISHED
74
Figure 5.5: PFS cure mixture model extrapolation functions (GO29365, October 2018 cut-off)
Source: Figure 16 from the CS.14
The Gompertz extrapolation was not considered for either arm for PFS due failure of parameterisation for this
function for OS; this extrapolation is therefore not presented.
Abbreviations: BR = bendamustine + rituximab; KM = Kaplan-Meier; Pola+BR = polatuzumab + bendamustine
+ rituximab.
For the dependently modelled standard extrapolations (Figure 5.3), the company considered that the
exponential and Weibull models appeared to overestimate PFS KM in both the Pola+BR and BR arms
initially, and that those extrapolations did not capture the expected decline in progression rates at the
end of the follow-up period. In the Pola+BR arm, the log-logistic, log-normal and generalised gamma
appeared to provide better visual fits in the first 24 months, but those also did not capture the expected
decline in progression rates, in both arms towards the end of the follow-up duration.
For dependently modelled extrapolations, the company concluded that the generalised gamma, log-
logistic and log-normal curves offered reasonable fits to the BR arm.
The company drew similar conclusions from the visual inspection of the independent fit extrapolations
as the dependent fit extrapolations (Figure 5.4); in the Pola+BR arm, functions typically either
overestimated PFS stages in the earlier months and/or underestimated the decline in patient progression
towards the end of follow-up. Of all the explored functions, the company found that the generalised
gamma provided the most reasonable fit in the Pola+BR arm, and in the BR arm, the generalised
gamma, log-logistic and log-normal appeared to fit the observed data reasonably well.
The company suggested that introducing cure-mixture models had improved the visual fit of all models
to both arms of the KM data (Figure 5.5). According to the company, log-logistic, log-normal and
generalised gamma cure-mixture models provided good fits to the observed data in the Pola+BR and
BR arms.
Copyright 2019 Queen's Printer and Controller of HMSO. All rights reserved

CONFIDENTIAL UNTIL PUBLISHED
75
The predicted cure fractions by the cure mixture models (i.e. the proportion of patients achieving long-
term remission) are presented in Table 41 of the CS.14 The proportion of patients achieving long-term
remission were between 20.8% and 25.9% in the Pola+BR arm, and between 0.0% and 4.4% in the BR
arm.
Based on visual fit, plausibility of the long-term extrapolation, and alignment with the selected OS
distribution, the company chose cure-mixture generalised gamma survival curve for the base case for
both arms, whilst the log-normal and log-logistic extrapolations were considered in the scenario
analyses from the company.
In the economic model, minimum value of the PFS and OS extrapolations was used while determining
the proportion of the patients that were not progressed at a given cycle.
ERG comment: The critique of the ERG on the PFS extrapolation approaches are listed under the
subheadings below:
Choosing investigator assessed PFS as the base case
The company has chosen investigator assessed PFS data for the base-case. In line with the clinical
effectiveness section, the company considered the IRC assessed PFS data to be more reliable.
Not including Gompertz PFS in the economic model
The company did not include Gompertz PFS extrapolations in the economic model, because the OS
extrapolation for Gompertz distributions did not converge. The ERG could not understand the rationale
of the company to exclude Gompertz distribution for PFS, since the distribution of choice for OS and
PFS extrapolations can be different.
Disagreement on the interpretation that PFS evidence demonstrated “cure” type of behaviour towards
the end of the follow-up period.
The company justified the use of the cure-mixture model, because the company interpreted from the
KM PFS curves that the relapse rates after 24 months were very low. The ERG disagrees with the
company, as at least two events could be observed after 24 months in the Pola+BR arm from the PFS
KM curve (Figure 4.2 in this report). Furthermore, the ERG asked the company to provide empirical
hazard rate plots for the PFS data from the GO29365 trial, which are presented below (Figure 5.6). As
the company did not provide any further explanation, the ERG does not know which plot corresponds
to the Pola+BR treatment. However, the empirical hazard does not seem to approach zero in either of
the plots.
Copyright 2019 Queen's Printer and Controller of HMSO. All rights reserved

CONFIDENTIAL UNTIL PUBLISHED
76
Figure 5.6: Empirical hazard plots of the investigated PFS curves
Source: appendix in company’s response to the clarification letter.2
5.2.6.3 Overall survival
For the extrapolation of OS in the model, the company used OS data from the October 2018 data cut-
off from the GO29365 trial.
Assessment of the proportional hazards assumption
The log-cumulative hazard plots for the OS from GO29365 was presented in Figure 17 of the CS.14
Based on the approximately parallel lines, the company deemed the proportional hazards assumption to
be plausible and therefore considered both independent and dependent (joint) models (in the latter,
treatment received is the covariate), for the OS extrapolation, using standard distributions (e.g.
exponential, Weibull, lognormal, loglogistic, generalised gamma) to be plausible.
Assessment of the cure-mixture modelling for OS
The company followed similar steps to PFS, while providing justifications for the cure-mixture
modelling for the OS extrapolation. The company argued that judging from the KM OS curves and log
cumulative hazard plots, the death rates after 24-month time-point were very low, and the hazard of
death declines toward the end of the follow-up period. Therefore, the company investigated cure-
mixture parametric models.
In these models, it is assumed that a proportion of patients achieving long-term survival is a parameter
that can be fitted from the observed GO29365 trial data via logistic regression. This ‘cure fraction’ of
patients is assumed not to be susceptible to cancer-related death.
For the OS cure-mixture modelling, two different approaches were followed in comparison to the cure-
mixture modelling of the PFS (cure modelling informed by PFS and cure modelling assuming same
non-long-term survivor OS).
In the first approach, OS cure-mixture modelling was informed by PFS. In previous economic
evaluations (TA559, TA567) it was stated that only patients that have not yet progressed could be
Copyright 2019 Queen's Printer and Controller of HMSO. All rights reserved

CONFIDENTIAL UNTIL PUBLISHED
77
considered to be long-term survivors based on clinical expert opinion. Hence, in this approach, an
additional constraint was added while categorising the patients to long-term and non-long-term
survivors, in such a way that only those subjects which did not progress can be classified as potential
long-term survivors.
In the second OS cure-mixture model by the company (same non-long-term survivor OS), it was
considered that OS was not constrained by PFS, but it was assumed that non-long-term survivors in the
Pola+BR and BR arms would essentially follow the same survival function but that there would be a
difference solely in the proportion of long-term survivors.
Statistical fit of the data
The company provided the AIC and BIC goodness of fit results for the functions used to model OS for
Pola+BR and BR in GO29365, as well as the subjective qualitative impression of visual fit to the
observed KM curves in Table 42 from the CS.14
The company mentioned that for all extrapolations, parameterisation of the Gompertz extrapolation for
both arms did not converge, and therefore AIC and BIC statistics were not presented for any of the
Gompertz extrapolations.
The company considered that the main conclusions from the AIC and BIC values for OS were similar
to those from PFS. They indicated a similar statistical fit to the KM data for the standard models
(dependently and independently fit) for both arms. The best ranking models in both arms for standard
parametric extrapolation were the log-normal, log-logistic and generalised gamma distributions. For the
two cure-mixture models, the AIC/BIC statistics also indicated a similar statistical fit among different
extrapolations, with the log-logistic and log-normal curves suggesting the best statistical fit in both
arms.
Investigation of the visual fit of the extrapolations
The visual fit investigation of the extrapolations was conducted separately for dependent, independent
and cure-mixture models. The fitted dependent and independent standard parametric extrapolations as
well as the cure-mixture models are presented in Figure 5.7, Figure 5.8, Figure 5.9 and Figure 5.10
below.
Copyright 2019 Queen's Printer and Controller of HMSO. All rights reserved

CONFIDENTIAL UNTIL PUBLISHED
78
Figure 5.7: OS standard extrapolation functions (dependent fit, GO29365, Oct. 2018 cut-off)
Source: Figure 19 from the CS.14
The Gompertz extrapolation was not considered for either arm for OS due failure of parameterisation for this
function for OS; this extrapolation is therefore not presented.
Abbreviations: BR, bendamustine + rituximab; KM, Kaplan-Meier; Pola+BR, polatuzumab + bendamustine +
rituximab
Figure 5.8: OS standard extrapolation functions (independent fit GO29365, Oct. 2018 cut-off)
Source: Recreated from the original economic model as the Figure 20 was the same as Figure 19 from the CS.14
Copyright 2019 Queen's Printer and Controller of HMSO. All rights reserved

CONFIDENTIAL UNTIL PUBLISHED
79
The Gompertz extrapolation was not considered due failure of parameterisation for this function for OS.
Abbreviations: BR = bendamustine + rituximab; KM = Kaplan-Meier; Pola+BR = polatuzumab + bendamustine
+ rituximab.
Figure 5.9: OS cure-mixture model extrapolation functions (OS informed by PFS, from
GO29365, Oct 2018 cut-off)
Source: Figure 22 from the CS.14
Gompertz extrapolation was not considered for either arm due to the failure of parameterisation for this function.
Abbreviations: BR = bendamustine + rituximab; KM = Kaplan-Meier; Pola+BR = polatuzumab + bendamustine
+ rituximab.
Copyright 2019 Queen's Printer and Controller of HMSO. All rights reserved

CONFIDENTIAL UNTIL PUBLISHED
80
Figure 5.10: OS cure-mixture model extrapolation functions (OS not informed by PFS, same OS
for not-long-term survivors, data from GO29365, Oct 2018 cut-off)
Source: Figure 21 from the CS.14
The Gompertz extrapolation was not considered for either arm for PFS due to failure of convergence for this
parameterisation function for OS; this extrapolation is therefore not presented.
Abbreviations: BR = bendamustine + rituximab; KM = Kaplan-Meier; Pola+BR = polatuzumab + bendamustine
+ rituximab.
Based on visual inspection, according to the company, none of the standard models (applied
dependently or independently) fitted the observed OS data in Pola+BR arm particularly well, as they
tended to overestimate OS initially and did not capture the decline in the observed mortality rate at the
end of the follow-up period. In the BR arm, the company considered that only the log-logistic, log-
normal and generalised gamma extrapolations provided a reasonable visual fit (Figure 5.7 and Figure
5.8).
For the cure-mixture models, the company found that the functions estimated by the second approach
(i.e. OS not informed by PFS, same OS for non-long-term survivors) were all found to have a poor fit
to the KM data (see Figure 5.10). In the Pola+BR arm, all curves underestimated OS initially. In the
BR arm, all extrapolations overestimated OS initially, and the majority of them were not considered to
be sufficiently capturing the decline in mortality late in follow-up. On the other hand, the functions
estimated by the first method (OS informed by PFS), provided an improved fit to the KM data in both
arms (see Figure 5.9). The company claimed that these functions also better reflect the expected decline
in mortality later in the follow-up compared to the standard functions.
The predicted cure fractions by the cure mixture models (i.e. the proportion of patients achieving long-
term remission) are presented in Table 43 (first cure mixture modelling approach) and Table 44 (second
cure-mixture modelling approach) of the CS.14 The proportion of patients achieving long-term survival
were between 20.8% and 36% in the Pola+BR arm, and between 0.0% and 11.5% in the BR arm.
Copyright 2019 Queen's Printer and Controller of HMSO. All rights reserved

CONFIDENTIAL UNTIL PUBLISHED
81
Based on the fit to the observed data of all extrapolations to both the Pola+BR and BR arms, the cure-
mixture model informed by PFS approach was selected in the company base-case. The company chose
generalised gamma because of the better visual fit, statistical fit, and more conservative cure fraction.
In the scenario where R-GemOx is explored as a comparator, the base case OS extrapolations for BR
are adopted.
The best fitting functions for both arms based on visual inspection were the log-normal and generalised
gamma (Figure 5.11). Note that the generalised gamma with cure mixture modelling was chosen for the
company base-case for both PFS and OS, in the latter one, the cure fractions were informed by PFS
(Figure 5.11).
Figure 5.11: Base case PFS and OS extrapolations
Source: Figure 22 from the CS.14
Abbreviations: BR = bendamustine + rituximab; KM = Kaplan-Meier; PFS = progression-free survival; Pola =
polatuzumab.
ERG comment
Disagreement on the interpretation that OS evidence demonstrated “cure” type of behaviour towards
the end of the follow-up period.
The company used similar arguments for the justification of the cure-mixture models for OS
extrapolation as were used for PFS. However, the ERG considers that the evidence is not sufficiently
convincing, since death events could be observed towards the end of the follow-up time in the OS KM
curve (Figure 4.3 in this report). Also, the empirical hazard rate plots for the OS data from the GO29365
trial presented as below (Figure 5.12) do not seem to approach zero in either of the plots.
Copyright 2019 Queen's Printer and Controller of HMSO. All rights reserved

CONFIDENTIAL UNTIL PUBLISHED
82
Figure 5.12: Kernel smoothed hazard plots of the investigated OS curves
Source: appendix in company’s response to the clarification letter.2
Doubts on the choice of the distributions for extrapolations
The ERG is doubtful on whether the most appropriate distribution was chosen (generalised gamma) for
the OS and PFS extrapolation. The ERG considers that the visual fit of the generalised gamma
distribution for the PFS was particularly poor (Figure 5.11) and the goodness of fit of the generalised
gamma distribution with cure-mixture was worse than other distributions for the OS (Table 42 in the
CS). 14
In order to assess long-term plausibility, the ERG plotted the OS and PFS base-case extrapolations
together with the general population survival of a 69-year-old cohort, reflecting the same male to female
ratio as in the GO29365 trial (see Figure 5.13). It can be seen that the OS extrapolation from the
company for Pola+BR overestimated the overall survival from the general population after 20 years,
which was deemed implausible by the ERG. Hence, the ERG enforces the OS included in the model at
a given time to be always smaller than or equal to the OS estimated from a general population in its
preferred analyses.
Copyright 2019 Queen's Printer and Controller of HMSO. All rights reserved

CONFIDENTIAL UNTIL PUBLISHED
83
Figure 5.13: Base case PFS and OS extrapolations
Source: ERG analysis.
Abbreviations: BR = bendamustine + rituximab; KM = Kaplan-Meier; PFS = progression-free survival; Pola =
polatuzumab.
In addition, the ERG plotted the OS hazard ratio estimates from the company’s OS extrapolation at
different time points, which is presented below in Figure 5.14.
Figure 5.14: Hazard ratio values, from the company’s OS extrapolation at different time points
Source: ERG analysis.
Abbreviations: HR = hazard ration, OS = overall survival, t = time (in years).
Copyright 2019 Queen's Printer and Controller of HMSO. All rights reserved

CONFIDENTIAL UNTIL PUBLISHED
84
From Figure 5.14, it can be seen that the OS extrapolation of the company would result in an increased
treatment effect for Pola+BR vs. BR, in terms of preventing death, even years after the Pola+BR
treatment is given. The ERG considers that such a claim was not substantiated by the available evidence.
Finally, the company provided some arguments for the long-term survival justification from the
ROMULUS trial.39 However, the ERG noted that the intervention investigated in the ROMULUS trial
is different from Pola+BR. Therefore, the ERG is unsure if the findings from the ROMULUS trial are
applicable to Pola+BR.
Due to the lack of convincing arguments for the cure-mixture modelling, the ERG preferred standard
parametric models and independent lognormal and generalised gamma distributions for the PFS and
OS extrapolation, respectively. This is based on statistical goodness-of-fit, visual assessment of fit, as
well as the long-term extrapolation plausibility.
In all the models, it was assumed that the treatment effect would be maintained throughout a patient’s
lifetime. However, in the exploratory analyses, the ERG explored scenarios in which the treatment
effect decreases over time and becomes null at given time points.
5.2.6.4 Non-cancer related mortality
In their base-case, the company assumed a cure-mixture model for OS, which assumed that a proportion
of patients were long-term survivors. The long-term survivor patients were subject to non-cancer related
mortality in the model. Additionally, the patients who did not die among the non-long-term survivors
were also subject to non-cancer related mortality in the model.
The company assumed that the non-cancer mortality risks would be equivalent to the age- and gender-
matched general population mortality risks. This was based on a study from the US by Maurer et al
(2014), who found no statistically significant difference between the mortality of 767 newly diagnosed
DLBCL patients who survived event free to two years and the age- and gender-matched general
population (SMR=1.09).4 The company used the 1.09 mean estimate from Maurer et al (2014) in a
scenario analysis, as this value had been used in scenario analyses in appraisals TA559 and TA567 as
well.4
In contrast to the cohort-based approach followed for modelling the cancer-related progression and
death events, the company followed an individual patient-level approach while modelling the non-
cancer, background mortality risks. The economic model calculates the weighted mortality risk from
the individual age- and gender-matched specific mortality risks from a cohort of 160 patients (50%-
50% male-female, characterising the age distribution of the GO29365 trial).
ERG comment: The ERG found a more recent US study of 18,047 DLBCL patients that reported an
excess risk of mortality in DLBCL patients up to five years.6 This excess mortality was not only due to
the chance of late relapse, but DLBCL patients were also found to be at a higher risk of death due to
non-cancer causes such as gastrointestinal and blood diseases and infections (SMR=1.41; 95% CI (1.35,
1.48). Given that this SMR only includes non-cancer mortality, it is likely to be an underestimate of the
overall excess mortality in these patients. Given the fact that this study includes more recent data (up to
2012 versus 2009 and 2010 in the US and French studies respectively) and a substantially larger number
of patients, the ERG feel that this study should have been considered by the company in their base-case.
The ERG considers that the application of non-cancer mortality to the non-long-term survivors who did
not die in a cycle in the economic model might have led to a double counting, since the death events in
the OS data from the GO29365 trial might have included non-cancer related deaths as well.
Copyright 2019 Queen's Printer and Controller of HMSO. All rights reserved
CONFIDENTIAL UNTIL PUBLISHED
85
Finally, the ERG disagrees with the individual modelling approach followed by the company for the
background mortality risks, as it led to unrealistic mortality estimates. Furthermore, the ERG considers
that this individual patient level modelling approach for background mortality created an inconsistency
with the cohort-level approach followed while estimating the progression and cancer-related deaths.
Therefore, in the preferred analysis conducted by the ERG, the background (non-cancer-related)
mortality is calculated based on an average patient that is reflective of the GO29365 trial, instead of
finding the weighted average of individually calculated background mortality risks.
5.2.6.5 Time on treatment
Time-to-off-treatment (TTOT) data from the GO29365 study were mature, at the end of the six months
all patients stopped treatment for both Pola+BR and BR arms. TTOT KM estimates were therefore used
directly in the model base case, using separate curves for each medicine in the respective regimens. The
TTOT KM plots for Pola+BR and BR are presented in Figure 5.15 below. For the scenario comparing
Pola+BR to R-GemOx, three cycles of R-GemOx were assumed, based on the assumption used in
TA567.3
Figure 5.15: Time to off-treatment KM plots (GO29365, ******************)
Source: Figure 11 from the response to the clarification letter.2
Abbreviations: BR = bendamustine + rituximab; KM = Kaplan-Meier; Pola+BR = polatuzumab + bendamustine
+ rituximab; TTOT, time-to-off-treatment.
5.2.7 Adverse events
Adverse event (AE) data were sourced from GO29365 wherever possible. The economic model
includes treatment-related (TR) AEs of common terminology criteria adverse events (CTCAE) Grade
3 or greater, which were deemed serious, for both Pola+BR and BR (GO29365 data cut-off April 2018),
where serious AEs were assumed to be those requiring NHS resources to treat them. For R-GemOx,
TRAEs of Grade 3–5 affecting more than 5% of patients in the Mournier 2013 study (a Phase II study
on the treatment of R/R DLBCL patients with R-GemOx) were included in the model.9 Duration of AEs
was sourced from GO29365 and TA306.13 When unavailable, the company assumed the longest
duration of an AE observed in GO29365 (72 days). A summary of the TRAEs included in the model is
presented in Table 5.7.
Copyright 2019 Queen's Printer and Controller of HMSO. All rights reserved

CONFIDENTIAL UNTIL PUBLISHED
86
Table 5.7: Incidence of TRAEs included in the model (CTCAE ≥ Grade 3, serious)
TRAE Incidence (GO29365 and
Mournier 20139)
Duration
Pola+BR BR R-GemOx Value, days Source
Acute kidney injury 2.6% 0.0% 0% *** GO29365
Atrial fibrillation 2.6% 0.0% 0% **** GO29365
Atrial flutter 2.6% 0.0% 0% *** GO29365
Anemia 0.0% 0.0% 33% 16.0 TA306
Diarrhoea 0.0% 2.6% 0% **** GO29365
Febrile neutropenia 2.6% 2.6% 4% *** GO29365
Leukopenia 2.6% 0.0% 0% **** GO29365
Neutropenia 2.6% 0.0% 73% *** GO29365
Pneumonia 0.0% 2.6% 0% *** GO29365
Lower respiratory tract
infection
5.1% 0.0% 0% *** GO29365
Pyrexia 0.0% 2.6% 0% *** GO29365
Septic shock 2.6% 0.0% 0% **** Assumption
Thrombocytopenia 0.0% 2.6% 23% **** GO29365
Vomiting 0.0% 2.6% 0% **** GO29365
Cytomegalovirus
infection
2.6% 0.0% 0% **** Assumption
Decreased appetite 0.0% 2.6% 0% **** Assumption
Supraventricular
tachycardia
2.6% 0.0% 0% *** GO29365
Herpes virus infection 0.0% 2.6% 0% *** GO29365
Meningoencephalitis
herpetic
0.0% 2.6% 0% **** Assumption
Myelodysplastic
syndrome
0.0% 2.6% 0% **** Assumption
Neutropenic sepsis 2.6% 0.0% 0% **** GO29365
Oedema peripheral 2.6% 0.0% 0% **** Assumption
Leukoencephalopathy 2.6% 0.0% 0% **** Assumption
Pulmonary oedema 0.0% 2.6% 0% **** Assumption
Source: Based on Table 45 from the CS14
Abbreviations: AE = adverse event; BR = bendamustine + rituximab; CTCAE = Common Terminology Criteria
for Adverse Events; Pola+BR = polatuzumab + bendamustine + rituximab; R-GemOx = Rituximab +
gemcitabine + oxaliplatin; TRAE = treatment-related adverse event.
ERG comment: Enterocolitis viral was included as an AE in the model, but not reported in the company
submission (Table 5.7). This has an effect on the Pola+BR arm only with an incidence of 2.6% (one
occurrence in 39 patients observed).
The ERG found the 5% threshold used by the company to be included in the model rather arbitrary. In
addition, the ERG has doubts about the assumption of the company that whenever data was unavailable
the longest duration observed in the GO29365 trial was assumed.
Copyright 2019 Queen's Printer and Controller of HMSO. All rights reserved

CONFIDENTIAL UNTIL PUBLISHED
87
Furthermore, the ERG was not able to validate the incidence values used in the model (those in Table
5.7 above), which do not seem to be in line with the incidence values presented in the clinical
effectiveness section of this report. For instance, Table 4.14 reported 11 serious AEs in the Pola+BR
arm, while in the model 15 AE incidences were included. There is a discrepancy in the BR arm, as well.
For instance, there are nine serious AEs in Table 4.14 vs. 14 in the model. Therefore, it is unclear to the
ERG, how the serious TRAE incidences of Grade 3-5 were included in the model. The categorisation
of the Grade 3-5 adverse events as “serious” and “not serious” was not clear and transparent to the ERG.
For the reasons mentioned above, the ERG preferred to use in the model the incidence values reported
in Table 4.16 (column Phase II) whenever possible. These incidence values from Table 4.16 refer to the
most frequently reported Grade 3-5 adverse events (>5%), under the assumption that all these AEs can
occur regardless of whether considered “treatment-related” and, hence, require NHS resources to treat
them. In the ERG base-case, all AE incidences in Table 4.16 were updated in the model. For those AEs
included in the model but not in Table 4.16, the incidence values remained unchanged. The AEs in
Table 4.16 that were not originally in the model were not included in the ERG base-case. Since a limited
impact on the incremental results is expected, different assumptions on AE incidences were not
explored by the ERG in this report.
5.2.8 Health-related quality of life
5.2.8.1 Identification and selection of utility values
Health-related quality of life data was not collected in the GO29365 trial. The company searched for
published sources of health state utility values in patients with DLBCL through a systematic literature
review. The systematic review identified seven studies which reported HRQoL data in patients with
relapsed or refractory disease. An additional relevant study was identified after searches had been
performed 40. Details of all studies identified are provided in Tables 46 and 47 of the CS 14 Three of the
eight utility sources identified were previous NICE appraisals (TA306, TA567 and TA559) 3, 5, 13. These
three studies each provided utility values for the required PFS and PD health states. TA567 and TA559
obtained utility data directly from trials, while TA306 utilised published sources of utility data. TA567
used SF-36 data (mapped to EQ-5D) from 34 patients from the JULIET trial, assessing tisagenlecleucel
in DLBCL patients. TA559 used EQ-5D-5L data (mapped to EQ-5D-3L) from 34 patients (87
observations) from the ZUMA-1 trial assessing axicabtagene in mixed histology lymphoma, (including
DLBCL). TA306 provided several sources of utility values. The company chose to include the base-
case utility values, estimated in R/R NHL patients from Doorduijn et al (2005), cited in Uyl de Groot
et al (2005) and values sourced from the FAD of TA176 estimated in patients with renal cell carcinoma. 41, 42
Of the remaining five sources of utility values, three utilised existing published sources of utility
values43, one used an existing but non-published source of utility data 44 and one based its utility values
on real world data 40. None of these five potential sources of values provided relevant utility values for
both required model health states. Additionally, studies based on existing published sources of utility
data tended to be based on older data, with the most recent source being from 200645 and the oldest
from 1999. 46 Values were also often not specific to DLBCL patients. Since the source data used in the
Knight 2004 study was unpublished, the validity and reliability of this source could not be assessed.44
In the base-case the company chose to adopt the TA559 health state utility values obtained from the
ZUMA-1 trial data. This source was chosen as the use of the van Hout mapping algorithm36 to estimate
EQ-5D-3L values from 5L values aligns with the NICE reference case and position statement on the
use of the EQ-5D-5L valuation set for England. 40 The company also considered the patient population
Copyright 2019 Queen's Printer and Controller of HMSO. All rights reserved

CONFIDENTIAL UNTIL PUBLISHED
88
of the ZUMA-1 to be similar to that of the GO29365 trial as it contained a subgroup of
relapsed/refractory DLBCL patients, the majority of patients had an ECOG performance status of 1 and
had received three or more lines of therapy 47. The TA559 values were also noted by the company to be
more conservative than the majority of values identified in the systematic literature review and the PFS
value is considered to have face validity as it is below the average utility value for the general population
at the mean baseline age in the GO29365 trial.
In line with the company’s modelling of survival, in the base-case, patients who have remained
progression-free for two years revert to age- and gender-matched general population utilities for the UK
(obtained from Ara and Brazier 201048). The company state that this HRQoL assumption was also
adopted in TA559.
The company conducted several scenario analyses to test HRQoL assumptions made in the base-case.
First the utility values sourced from the two alternative NICE appraisals (TA306 and TA567) were
tested. To explore the uncertainty surrounding the time-point at which patients are considered to be in
long-term remission (cured), the company tested switching patients in the progression-free health state
to the gender- and age-matched general population utility value at five years, instead of two years.
Lastly, the company tested the impact of assuming a decrease in utility in the last three months before
death. The end of life utility value of 0.47 (initially presented at 0.49 in the company submission but
altered to 0.47 when queried by the ERG at the clarification stage) was sourced from Färkkilä et al.
2014.49
ERG comment: Given that HRQoL data was not collected in the GO29365 trial, the ERG consider that
the company conducted a thorough search for relevant health state utility values. The TA559 utility
values utilised in the base-case were obtained from the safety population of the single arm ZUMA-1
trial. This was a small sample, including only 34 patients and 87 observations. The PFS utility value
was estimated from 49 observations, while the PD health state utility value was estimated from only
five observations. The ERG in appraisal TA559, noted that this very small sample size for progressed
disease may suggest that progressed utility was measured soon after occurrence. They were therefore
concerned that the value may not be reflective of the full progression period. However, the ERG also
noted that despite substantial uncertainty surrounding this value, patients tend to remain in the
progressed state for a relatively short period before death and therefore it is unlikely that the progressed
disease value is a key driver in the model.5
Another issue with the use of utilities from this source is that no information is available to the ERG on
the characteristics of the patients who provided HRQoL data in the ZUMA-1 safety management
sample. ZUMA-1 included patients with a variety of forms of lymphoma. It is unclear how many (if
any) of the 34 patients who provided HRQoL data had DLBCL and how the age, sex and other clinical
characteristics of these patients compare to the patients in GO29365. The ERG report in TA559 shows
that in comparison to the ZUMA-1 population, the safety management population were younger, with
a higher proportion of males, were at an earlier stage of disease and had a better prognostic IPI score.
Therefore, it is clear (from comparing to the characteristics of the entire ZUMA-1 population) that the
median age of the safety population of ZUMA-1 was less than 58, at least 33% were male, more than
15% of patients had stage I or II disease and more than 27% had a prognostic IPI score of 0-1. However,
exact percentages for the safety population have been redacted.
Despite uncertainties related to the use of the utility values from the ZUMA-1 trial, the ERG does not
feel that the other utility sources identified would have more appropriate for the base-case. While the
utility values from the JULIET trial were obtained from solely R/R DLBCL patients (rather than mixed
histology lymphoma in ZUMA-1), the sample size was still small (34 patients – the same as the ZUMA-
Copyright 2019 Queen's Printer and Controller of HMSO. All rights reserved

CONFIDENTIAL UNTIL PUBLISHED
89
1 safety management population). The company also noted that the PFS utility value of 0.83 from the
JULIET data and the PFS value from TA306 of 0.81 are both above the age adjusted general population
utility value of 0.79 at the starting age of the model (age 68), which lacks face validity. The ERG also
feel that HRQoL measured using the EQ-5D-5L, converted into EQ-5D-3L using the recommended
cross-walk algorithm (as adopted using the ZUMA-1 data), more closely aligns with the NICE reference
case than utilising SF-36 data, mapped to EQ-5D-3L (as used for the JULIET data). Other sources of
utility values identified by the company do not provide values for both required health states, and would
therefore require the ERG to mix data sources, which is not preferred to sources which provide both
required values. Therefore, given the data available, the ERG is satisfied to leave the base-case source
of utility values as those estimated from ZUMA-1, despite the acknowledged issues.
A key concern in the HRQoL base-case adopted by the company is the uncertainty surrounding the
assumption that patients who have remained progression-free for two years are assumed to have the
same utility as the age- and gender-matched UK general population. The assumption of a two-year cure
point is based on clinical expert opinion and evidence from the findings of a single study of no
statistically significant excess mortality between newly diagnosed DLBCL patients who survive to two
years and the general population 4. However, the details of the clinical expert meeting were not provided
and a more recent and larger study suggests that excess mortality remains up to five years.6 The
company do not refer to this more recent study in their CS, despite it being referred in the ERG report
of TA559, where the utilities and assumption of the two-year switch to general population utility values
were obtained. However, the company do test an extension of the cure point to five years for HRQoL
in a scenario analysis.
Furthermore, the company extend the identified evidence of no excess mortality beyond two years, to
argue that it is therefore likely that the HRQoL of the two groups (patients who are progression free
longer than 2 years and non-cancer patients) would be equivalent from two years. However, no evidence
was provided in the company submission to suggest that a lack of difference in mortality between the
two groups translates into equivalent HRQoL. Justification for this assumption was requested by the
ERG at clarification. In their clarification response the company argued that this approach was used in
TA559 and is supported by studies of HRQoL in long-term cancer survivors. The company identified
two recent systematic reviews to support their assumption. The first, conducted by the Office of Health
Economics (OHE) found that the majority of studies comparing the HRQoL of long-term cancer
survival against the HRQoL of the general population found their HRQoL to be similar. The review
concluded that, while the evidence base was limited, this finding could provide some support for
applying general population utilities to long-term cancer survivors.7 The other systematic review,
carried out in aggressive non-Hodgkin lymphoma (NHL) found that the HRQoL of NHL becomes more
comparable with the HRQoL of general population the longer they survive.8 The company also added
that one of the studies included in that review also found that older patients had smaller differences or
small-size effects in HRQoL compared to the general population.50
However, these arguments presented by the company ignore several important factors within these
studies. In the OHE review, it is noted that mean length of survival was five years or more in all but
two of the 20 included studies (in the two remaining studies the mean lengths of survival were three
and 4.5 years). 7 There are also several warnings about the potential for selection bias, small sample
sizes and the low quality of analysis in many of the included studies. Additionally in the NHL-specific
review, the abstract states “Compared to the general population, overall HRQoL was more comparable
when assessed at ≥3 years from baseline (3/3 better or comparable) versus assessment at <3 years (2/3
better or comparable).” 8 Similarly, the included study referred to by the company as having seen a
smaller difference in older age groups, had a mean time since diagnosis of 3.4 years. 50 Therefore, the
Copyright 2019 Queen's Printer and Controller of HMSO. All rights reserved

CONFIDENTIAL UNTIL PUBLISHED
90
ERG would argue that while there may be limited evidence to suggest that HRQoL of long-term
survivors does become more comparable with that of the general population over time, there is a lack
of evidence presented to suggest that this applies as early as two years.
Additionally, in the previous appraisals there is a tendency to test decrements in utility, even for those
assumed to be cured, suggesting that it is thought to be likely that utility may remain lower than the
general population over the long-term, due to long lasting effects of the condition and treatments
received. The company did not test any scenarios on the utility of long-term survivors.
5.2.8.2 Adverse event disutilities
As HRQoL data were not available from the trial, the company searched for disutilities related to the
Grade 3 or higher AEs observed in the trial. These disutilities were sourced from previous NICE
appraisals in R/R DLBCL (TA306 and TA559) 13 5 and brentuximab vedotin in R/R systemic anaplastic
large cell lymphoma (TA478) 51. Disutilities, shown in Table 5.8, were weighted according to their
incidence and duration for each treatment.
Table 5.8: Adverse event disutility values and durations used in the model
AE Disutility Standard
error Source
Duration
(days) Source
Acute kidney
injury 0.27 0.03
Assumption same
as renal failure in
TA306 13
* GO29365
Atrial
Fibrillation 0.37 0.04
Assumption same
as ejection fraction
decreased from
TA306 13
** GO29365
Atrial Flutter 0.37 0.04
Assumption same
as ejection fraction
decreased from
TA306 13
* GO29365
Anaemia 0.25 0.03 TA306 13 16 TA306
Diarrhoea 0.10 0.01 Lloyd 2006 52 ** GO29365
Febrile
neutropenia 0.15 0.02 Lloyd 2006 52 * GO29365
Leukopenia 0.09 0.01 Assumption same
as neutropenia ** GO29365
Neutropenia 0.09 0.01 Nafees 2008 53 * GO29365
Pneumonia 0.20 0.02 Beusterien 2010 54 * GO29365
Lower
respiratory tract
infection
0.20 0.02 Assumption same
as pneumonia *** GO29365
Pyrexia 0.11 0.01 Beusterien 2010 54 * GO29365
Septic Shock 0.37 0.04
Assumption
(maximum
disutility from
TA306) 13
**
Assumption –
maximum of
reported durations
GO29365
Thrombocytope
nia 0.11 0.01 Tolley 2013 55 ** GO29365
Copyright 2019 Queen's Printer and Controller of HMSO. All rights reserved

CONFIDENTIAL UNTIL PUBLISHED
91
AE Disutility Standard
error Source
Duration
(days) Source
Vomiting 0.05 0.01 Nafees 2008 53 ** GO29365
Cytomegalovir
us infection 0.15 0.02
Assumption same
as febrile
neutropenia
**
Assumption –
maximum of
reported durations
GO29365
Decreased
appetite 0.37 0.04
Assumption same
as anorexia in
TA306 13
**
Assumption –
maximum of
reported durations
GO29365
Supraventricula
r tachycardia 0.37 0.04
Assumption same
as ejection fraction
decreased from
TA306 13
* GO29365
Herpes virus
infection 0.15 0.02
Assumption same
as febrile
neutropenia
* GO29365
Meningoenceph
alitis herpetic 0.15 0.02
Assumption same
as febrile
neutropenia
**
Assumption –
maximum of
reported durations
GO29365
Myelodysplasti
c syndrome 0.37 0.04
Assumption same
as malignant
neoplasm
progression from
TA306 13
**
Assumption –
maximum of
reported durations
GO29365
Neutropenic
sepsis 0.15 0.02
Assumption same
as febrile
neutropenia
** GO29365
Oedema
peripheral 0.37 0.04
Assumption same
as pulmonary
oedema
**
Assumption –
maximum of
reported durations
GO29365
Leukoencephal
opathy 0.37 0.04
Assumption
(maximum
disutility from
TA306 13
**
Assumption –
maximum of
reported durations
GO29365
Pulmonary
oedema 0.37 0.04
Assumption
(maximum
disutility from
TA306) 13
**
Assumption –
maximum of
reported durations
GO29365
Source: Table 48 and electronic model in CS.14
Abbreviation: AE = adverse event.
ERG comment: The sources used to identify disutilities associated with the included AEs appear
appropriate. For a selection of included AEs, the company assume the maximum of reported durations
in the GO29365 trial. The model states that this assumption is used where no duration was recorded in
the trial or where the issue remained ongoing. The maximum duration seen for an AE in the GO29365
Copyright 2019 Queen's Printer and Controller of HMSO. All rights reserved

CONFIDENTIAL UNTIL PUBLISHED
92
trial was ** days for vomiting, with an assumed associated disutility of 0.05. This assumed AE duration
of ** days was used for eight of the included AEs: septic shock, cytomegalovirus infection, decreased
appetite, meningoencephalitis herpetic, myelodysplastic syndrome, oedema peripheral,
leukoencephalopathy and pulmonary oedema. No evidence is provided to support the likelihood of such
a duration for any of these AEs. In addition, six of these eight AEs (with the exception of
cytomegalovirus infection and meningoencephalitis herpetic) are also assumed to have the maximum
disutility of AEs seen in TA306 of 0.37. 13 Again, there is no reference to evidence to support a disutility
of this size in these AEs. The assumption of maximum disutilities in combination with maximum
duration for these AEs may overweight the importance of these events. However, AE disutilities and
durations have a minimal impact on the ICER and therefore this is unlikely to have a substantial effect
on the results.
5.2.8.3 HRQoL data used in the cost-effectiveness analysis
Table 5.9: Health state utility values for base-case
Health state Base-case
Value (SE)
Source
PFS 0.72 (0.03) ZUMA-1 trial
PD 0.65 (0.06)
PFS – long-term follow up (>2 years) Age- and sex-match
general population values Ara and Brazier 201048
Source: Table 49 in CS.14
Abbreviations: PD = Progressed disease; PFS = Progression free disease; SE = Standard error.
5.2.9 Resources and costs
The economic analysis was performed from the NHS and PSS perspective. The following costs were
included for the PFS health state: drug acquisition and administration, treatment-related AEs, routine
supportive care (professional and social services, health care professionals and hospital resource use,
and treatment follow-up; for a maximum of two years), and subsequent treatment costs. For the PD
health state, the included costs were those for drug acquisition and administration (for further
interventions received), supportive care (professional and social services, health care professionals and
hospital resource use, and treatment follow-up), and subsequent treatment costs.
5.2.9.1 Drug acquisition costs and administration costs
The acquisition costs and cost per cycle for polatuzumab, rituximab, bendamustine, gemcitabine, and
oxaliplatin are listed in Table 5.10.
Copyright 2019 Queen's Printer and Controller of HMSO. All rights reserved

CONFIDENTIAL UNTIL PUBLISHED
93
Table 5.10: Drug acquisition costs and costs per cycle
Drug Vial
/
pack
size
(mg)
Vial / pack
price
Cost
source
Dosing Dosing
source
Cycle
length
(days)
Cost per
cycle
Polatuzumab
vedotin
140 ********** Planned
list
price
1.8 mg/kg
on day 1 of
each cycle
GO29365 21 **********
(140 mg
only, no
vial sharing
[ERG base
case])
**********
(140 mg
only, 100%
vial
sharing)
**********
(140 mg
and 30 mg,
no vial
sharing
[Company
base case])
30a ********* Planned
list
price
Rituximab
biosimilar
(Rixathron® /
Truxima®)
100 £78.59b BNF
201956
375 mg/m2
on day 1 of
each cycle
GO29365 21 £581.52 (no
vial
sharing) 500 £392.92b BNF
201956
Bendamustine 100 £28.00 BNF
201956
90 mg/m2
per day, on
days 1 and 2
of each
cycle
GO29365 21 £95.95 (no
vial
sharing) 25 £6.85 BNF
201956
Gemcitabine 200 £2.76 eMIT
201957
1,000
mg/m2 on
day 1 of
each cycle
Mounier
et al.,
20139
14 £17.84 (no
vial
sharing) 1,000 £7.96 eMIT
201957
Oxaliplatin 50 £3.81 eMIT
201957
100 mg/m2
on day 1 of
each cycle
Mounier
et al,
20139
14 £13.87 (no
vial
sharing) 100 £6.44 eMIT
201957
Source: Table 51 and the electronic model of the CS.14
a Vial size available in **** ****.
b Assumed discount of 50% applied, based on national tendering process for biosimilar rituximab.
Abbreviations: BNF = British National Formulary, CS = company submission, eMIT = electronic market
information tool.
For the Pola+BR regimen as well as for the BR regimen, patients were assumed to receive up to a
maximum of six treatment cycles (21 days per cycle). This was determined by the TTOT KM estimate
data, and also conforms to the study protocol of GO29365. For the R-GemOx regimen, patients were
assumed to receive three treatment cycles. This assumption was based on the one used in TA567.3
Copyright 2019 Queen's Printer and Controller of HMSO. All rights reserved

CONFIDENTIAL UNTIL PUBLISHED
94
For Pola+BR, drugs were administered at mean doses of 1.8 mg/kg for polatuzumab vedotin and 375
mg/m2 for rituximab (both on day 1 of each cycle), with 90 mg/m2 of bendamustine administered on
days 1 and 2 of each cycle. The mean treatment doses were derived from the weight and body surface
area (BSA) distribution of patients enrolled in the GO29365 study.
It is planned for polatuzumab vedotin to be available in 140 mg and 30 mg vials (lyophilised product
prepared for reconstitution prior to infusion). Polatuzumab vedotin will initially be available only with
a 140 mg vial size at a list price of ********** per vial. The 30 mg vial is in development and is
planned to be available at an equivalent per mg price (********* per 30 mg vial) in *********.
The use of the 140 mg vial alone prior to the availability of the 30 mg vial could initially create waste
for individual NHS Trusts due to a lack of flexibility in vial sizes to tailor the dose to patients’ individual
weights. In consultation with NHS compounding service providers, the company is planning to put
arrangements in place so hospitals can obtain bags ready for infusion with the correct patient-specific
dosing from these service providers without incurring any wastage costs. Trusts would therefore only
be charged on a per mg basis for the drug acquisition costs, resulting in a ‘no waste’ or ‘full vial sharing’
scenario. The use of compounders is already common practice for other chemotherapies in an increasing
number of NHS Trusts. Upon availability of the 30 mg vial, it is envisaged that NHS Trusts will be able
to prepare doses in-house, incurring minimal wastage. Details of the compounding arrangements for
polatuzumab vedotin are being discussed with NHS England.
Based on the above, costs per cycle in the model base case were therefore calculated based on the
availability of 140 mg and 30 mg vials under the conservative assumption of ‘no vial sharing’,
representing the way in which polatuzumab vedotin will be supplied in the long-term. Based on the
weight distribution of patients enrolled in the GO29365 study, a mean weight of 74.86 kg resulted in a
mean per cycle dose of 143.9 mg polatuzumab vedotin at an average cost of ********** per cycle.
In the CS,14 the company also included a further scenario for completeness that represents the use of
140 mg vials only, with no vial sharing.
The acquisition costs of rituximab, bendamustine, gemcitabine, and oxaliplatin were calculated
assuming all available vial sizes, and no vial sharing, and were based on the BSA distribution of the
GO29365 patient cohort.
Rituximab (Rixathron®/Truxima®) is available as a biosimilar at a list price of £157.17 for the 100 mg
vial and £785.84 for the 500 mg vial.56 An estimated discount of 50% was applied to the biosimilar
rituximab list price, based on the national tendering process for rituximab biosimilar medicines. The
rituximab dose is calculated based on the BSA distribution of the GO29365 patient cohort. Patients
were assumed to receive a dose of 375 mg/m2 of rituximab administered on day 1 of each cycle.
Assuming no vial sharing, the average cost per cycle for rituximab was calculated to be £581.52.
Bendamustine is available as a generic formulation in vials of 25 mg and 100 mg at a cost of £6.85 and
£27.77 per vial respectively.56 Patients were assumed to receive a dose of 180 mg/m2 per cycle (90
mg/m2 on days 1 and 2 of the cycle) based on the BSA distribution of the GO29365 patient cohort.
Assuming no vial sharing, the cost per cycle for bendamustine was calculated to be £95.95.
For the R-GemOx regimen, gemcitabine and oxaliplatin were assumed to be administered on day 1 of
each cycle (14 days per cycle) at doses of 1,000 mg/m2 and 100 mg/m2, respectively, as reported by
Mounier et al., 2013.9 Based on an assumption of no vial sharing, an average cost per cycle was
calculated at £17.84 for gemcitabine and £13.87 for oxaliplatin, based on the BSA distribution of the
GO29365 patient cohort.
Copyright 2019 Queen's Printer and Controller of HMSO. All rights reserved
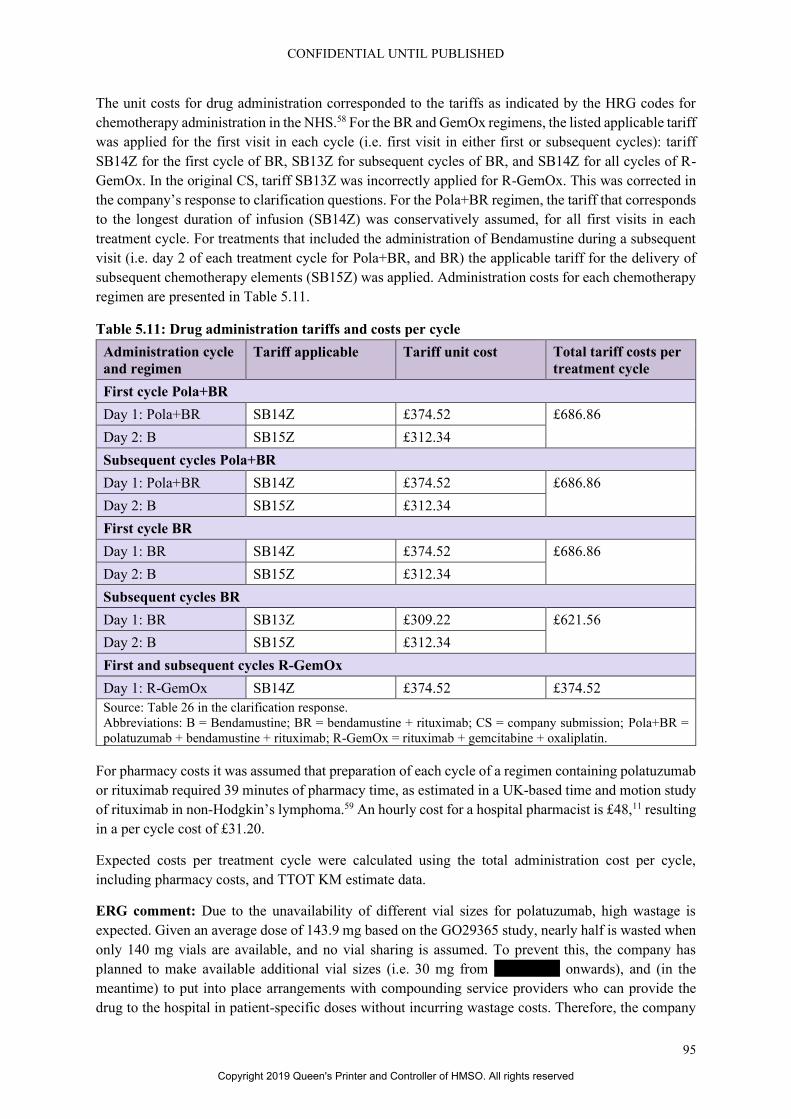
CONFIDENTIAL UNTIL PUBLISHED
95
The unit costs for drug administration corresponded to the tariffs as indicated by the HRG codes for
chemotherapy administration in the NHS.58 For the BR and GemOx regimens, the listed applicable tariff
was applied for the first visit in each cycle (i.e. first visit in either first or subsequent cycles): tariff
SB14Z for the first cycle of BR, SB13Z for subsequent cycles of BR, and SB14Z for all cycles of R-
GemOx. In the original CS, tariff SB13Z was incorrectly applied for R-GemOx. This was corrected in
the company’s response to clarification questions. For the Pola+BR regimen, the tariff that corresponds
to the longest duration of infusion (SB14Z) was conservatively assumed, for all first visits in each
treatment cycle. For treatments that included the administration of Bendamustine during a subsequent
visit (i.e. day 2 of each treatment cycle for Pola+BR, and BR) the applicable tariff for the delivery of
subsequent chemotherapy elements (SB15Z) was applied. Administration costs for each chemotherapy
regimen are presented in Table 5.11.
Table 5.11: Drug administration tariffs and costs per cycle
Administration cycle
and regimen
Tariff applicable Tariff unit cost Total tariff costs per
treatment cycle
First cycle Pola+BR
Day 1: Pola+BR SB14Z £374.52 £686.86
Day 2: B SB15Z £312.34
Subsequent cycles Pola+BR
Day 1: Pola+BR SB14Z £374.52 £686.86
Day 2: B SB15Z £312.34
First cycle BR
Day 1: BR SB14Z £374.52 £686.86
Day 2: B SB15Z £312.34
Subsequent cycles BR
Day 1: BR SB13Z £309.22 £621.56
Day 2: B SB15Z £312.34
First and subsequent cycles R-GemOx
Day 1: R-GemOx SB14Z £374.52 £374.52
Source: Table 26 in the clarification response.
Abbreviations: B = Bendamustine; BR = bendamustine + rituximab; CS = company submission; Pola+BR =
polatuzumab + bendamustine + rituximab; R-GemOx = rituximab + gemcitabine + oxaliplatin.
For pharmacy costs it was assumed that preparation of each cycle of a regimen containing polatuzumab
or rituximab required 39 minutes of pharmacy time, as estimated in a UK-based time and motion study
of rituximab in non-Hodgkin’s lymphoma.59 An hourly cost for a hospital pharmacist is £48,11 resulting
in a per cycle cost of £31.20.
Expected costs per treatment cycle were calculated using the total administration cost per cycle,
including pharmacy costs, and TTOT KM estimate data.
ERG comment: Due to the unavailability of different vial sizes for polatuzumab, high wastage is
expected. Given an average dose of 143.9 mg based on the GO29365 study, nearly half is wasted when
only 140 mg vials are available, and no vial sharing is assumed. To prevent this, the company has
planned to make available additional vial sizes (i.e. 30 mg from ********* onwards), and (in the
meantime) to put into place arrangements with compounding service providers who can provide the
drug to the hospital in patient-specific doses without incurring wastage costs. Therefore, the company
Copyright 2019 Queen's Printer and Controller of HMSO. All rights reserved

CONFIDENTIAL UNTIL PUBLISHED
96
has assumed the availability of both 30 and 140 mg vial sizes for the base case analysis, and performed
two additional scenarios in which only 140 mg vials are used, assuming either no vial sharing or 100%
sharing (i.e. no wastage in case of the latter). The ERG considers that a base case analysis that is based
on the current availability of vial sizes, and assuming no vial sharing, is a more conservative approach,
and that it is more appropriate to explore the impact of the future availability of different vial sizes in
scenario analyses.
A maximum number of six treatment cycles was assumed for the Pola+BR and BR regimens, which
was reportedly based on TTOT KM estimate data. This also corresponds to the treatments as described
in the study protocol for GO29365. The sixth treatment cycle of Pola+BR coincides with a half-cycle
corrected TTOT KM estimate of 0.5. This indicates that the assumption of six treatment cycles is a valid
reflection of the average treatment time for Pola+BR. It would therefore have been an appropriate option
to assume a treatment duration of six cycles for all patients in Pola+BR, irrespective of individual TTOT
data. However, when the individual TTOT data are used, as is the case in the electronic model, it is
incorrect to only apply costs up to a maximum of six treatment cycles and no costs for the patients that
still received additional cycles of treatment thereafter. The ERG therefore has amended the model to
apply costs for as long as patients in GO29365 received treatment according to the TTOT KM estimate
data, without the assumption of a maximum number of six treatment cycles for Pola+BR and BR.
An estimated discount of 50% was applied to the list price of rituximab. This estimation was “based on
the national tendering process for rituximab”. Given the uncertainty of this estimate due to discount
values being kept confidential by the NHS, the ERG considers that using the regular list price for the
base case analysis is a more conservative approach for the costing of rituximab. However, the ERG
notes that the impact of this assumption on the cost-effectiveness results is small.
5.2.9.2 Health state unit costs and resource use
The type and frequency of resource utilisation in the PFS and PD health states is based upon data from
the manufacturer’s submission for TA306,13 which were derived from questionnaire responses from a
set of UK physicians selected based upon publication record in the field of aggressive non-Hodgkin’s
lymphoma, prior collaboration, and referrals from other physicians. Three categories of resources were
included: professional and social services, healthcare professionals and hospital resource use, and
treatment follow-up. Table 5.12 presents the cost per unit for each type of resource included in the
model, and Table 5.13 presents the annual frequency of resource use in each health state.
Table 5.12: Supportive care unit costs
Procedure Cost per unit Source
Professional and social services
Residential care (day) £114.50 Crude average of local authority & private;
Curtis and Burns, 201811
Day care (day) £58.00 Curtis and Burns, 201811
Home care (day) £33.32 National Audit Office 200810
Per diem cost of community care = £28
(assumed by the National Audit Office to
be the same as the cost of home care);
inflation factor from 2007–08 to 2017–18
= 1.19 (PSSRU inflation index11;
inflated per diem cost of home care =
£33.32
Copyright 2019 Queen's Printer and Controller of HMSO. All rights reserved

CONFIDENTIAL UNTIL PUBLISHED
97
Procedure Cost per unit Source
Hospice (day) £157.08 National Audit Office 2008 60; Per diem
cost of hospice care = £132; inflation factor
from 2007–08 to 2017–18 = 1.19 (PSSRU
inflation index11); inflated per diem cost of
home care 2007–08 = £157.08
Health care professionals and hospital resource use
Oncologist (visit) £165.85 AF01A; Service code 303, clinical
haematology, face-to-face, non-admitteda
Haematologist (visit) £164.80 AF01A; Service code 370, medical
oncology, face-to-face, non-admitteda
Radiologist (visit) £187.30 AF01A; Service code 800, clinical
oncology (radiotherapy), face-to-face, non-
admitteda
Nurse (visit) £38.45 N02AF; District nurse, adult, face to facea
Specialist nurse (visit) £38.45 N02AF; District nurse, adult, face to facea
GP (visit) £37.40 Curtis and Burns, 2018 61
District nurse (visit) £38.45 N02AF; District nurse, adult, face to facea
CT scan £163.66 N02AF; District nurse, adult, face to facea
Inpatient day £383.47 SA17G; Malignant disorders of lymphatic
or haematological systems, with CC Score
3+, non-elective excess bed daya
Palliative care team £117.84 SD03A; Palliative care team inpatienta
Treatment follow-up
Full blood counts £2.51 RD28Z; Complex CTa
LDH £2.51 DAPS05; Haematologya
Liver function £2.51 DAPS05; Haematologya
Renal function £2.51 DAPS05; Haematologya
Immunoglobulin £2.51 DAPS05; Haematologya
Calcium phosphate £2.51 DAPS05; Haematologya
One-off costs, PD
Chemotherapy 1,116.40 Assumed GemOx cost for generic
chemotherapy and administration
R + chemotherapy 2,860.98 Assumed R-GemOx cost for generic
chemotherapy and administration
Rituximab 2,765.83 Assumed R cost for generic chemotherapy
and administration
Radiotherapy 162.88 SC42Z, day case
ECG 107.84 RD51A; Imaging:Outpatient
MUGA 285.04 RN03A; Imaging:Outpatient
PET-CT 470.71 RN03A, outpatient
Bone marrow biopsy 519.82 SA33Z, day case
MRI 140.60 RD01A; Imaging:Outpatient
Copyright 2019 Queen's Printer and Controller of HMSO. All rights reserved

CONFIDENTIAL UNTIL PUBLISHED
98
Procedure Cost per unit Source
Source: Table 54 in the CS.14 a NHS Improvement. NHS Reference Cost Schedule, 2017–18.12
Abbreviations: CS = company submission; CT = computed tomography; ECG = electrocardiogram; GP =
General Practitioner; LDH = lactate dehydrogenase test; MRI = magnetic resonance imaging; MUGA =
multiple-gated acquisition scan; PD = progressed disease; PET-CT = positron emission tomography–
computed tomography; PSSRU = Personal Social Services Research Unit; R = rituximab.
Resource use was assumed to be the same for both arms, in accordance with clinical expert opinion.28
Clinical expert opinion also considered that patients remaining in PFS for longer than two years were
in long-term remission, and it was therefore assumed that no additional supportive costs were incurred
beyond this time point. This assumption was furthermore based on ESMO guidelines23 that recommend
routine follow-up of up to 24 months, and was in line with TA 559.5
For the PFS health state, resource use was specified for patients whilst they were on- or off-treatment.
Table 5.13: Annual frequency of resource use in PFS and PD
Resource
utilisation item
PFS on
treatment
PFS off-
treatment
(up to 2
years)
PD Source
Professional and social services
Residential care
(day)
39.0 9.8 0.0 TA306, ERG Report,13 Table 37a.
Annual frequency calculated from
28-day resource use
Day care (day) 14.6 3.7 24.4 TA306, ERG Report, 13 Table 37a.
Annual frequency calculated from
28-day resource use
Home care (day) 60.9 22.2 121.7 TA306, ERG Report, 13 Table 37
Hospice (day) 0.7 0.2 12.1 TA306, ERG Report, 13 Table 38a.
Annual frequency calculated from
28-day resource use
Health care professionals and hospital resource use
Oncologist
(visit)
21.8 5.5 4.3 TA306, ERG Report, 13 Table 38a.
Annual frequency calculated from
28-day resource use
Haematologist
(visit)
10.2 2.5 13.0 TA306, ERG Report, 13 Table 38a.
Annual frequency calculated from
28-day resource use
Radiologist
(visit)
21.8 4.3 0.0 TA306, ERG Report, 13 Table 38a.
Annual frequency calculated from
28-day resource use
Nurse (visit) 52.2 13.0 0.0 TA306, ERG Report, 13 Table 38a.
Annual frequency calculated from
28-day resource use
Specialist nurse
(visit)
8.7 2.2 32.6 TA306, ERG Report, 13 Table 38a.
Annual frequency calculated from
28-day resource use
Copyright 2019 Queen's Printer and Controller of HMSO. All rights reserved

CONFIDENTIAL UNTIL PUBLISHED
99
Resource
utilisation item
PFS on
treatment
PFS off-
treatment
(up to 2
years)
PD Source
GP (visit) 26.1 6.5 43.0 TA306, ERG Report, 13 Table 38a.
Annual frequency calculated from
28-day resource use
District nurse
(visit)
19.6 5.0 52.2 TA306, ERG Report, 13 Table 38a.
Annual frequency calculated from
28-day resource use
CT scan 4.0 4.0 0.0 TA306, ERG Report, 13 Table 38a.
Annual frequency calculated from
28-day resource use
Inpatient day 3.2 3.2 2.7 TA306, ERG Report, 13 Table 40
Palliative care
team
0.0 0.0 17.3 TA306, ERG Report, 13 Table 40
Treatment follow-up
Full blood
counts
43.4 43.4 13.0 TA306, ERG Report, 13 Table 39a.
Annual frequency calculated from
28-day resource use
LDH 26.1 26.1 4.3 TA306, ERG Report, 13 Table 39a.
Annual frequency calculated from
28-day resource use
Liver function 43.4 43.4 13.0 TA306, ERG Report, 13 Table 39a.
Annual frequency calculated from
28-day resource use
Renal function 43.4 43.4 4.3 TA306, ERG Report, 13 Table 39a.
Annual frequency calculated from
28-day resource use
Immunoglobulin 8.7 8.7 4.3 TA306, ERG Report, 13 Table 39a.
Annual frequency calculated from
28-day resource use
Calcium
phosphate
8.7 8.7 13.0 TA306, ERG Report, 13 Table 39a.
Annual frequency calculated from
28-day resource use
Haematologist
(visit)
3.1 3.1 2.7 TA306, ERG Report, 13 Table 40
Oncologist
(visit)
0.6 0.6 0.3 TA306, ERG Report, 13 Table 40
Nurse (visit) 4.9 4.9 2.1 TA306, ERG Report, 13 Table 40
Radiologist
(visit)
0.03 0.03 0.03 TA306, ERG Report, 13 Table 40
GP (visit) 0.13 0.13 0.07 TA306, ERG Report, 13 Table 40
One-off costs, PD (Proportion of patients requiring resource)a
Pola+BR BR R-GemOx
Chemotherapy 12.5% 12.5% 12.5% GO29365 NALT data, pooled;
assumed the same for R-GemOx
Copyright 2019 Queen's Printer and Controller of HMSO. All rights reserved
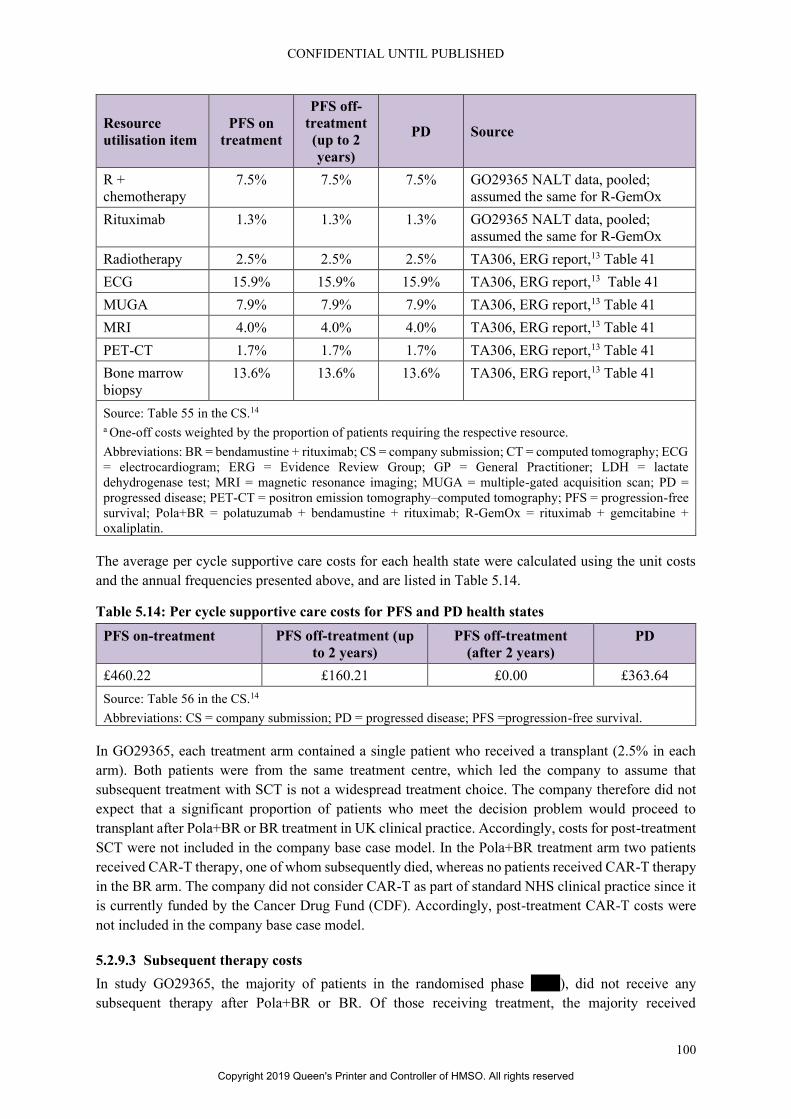
CONFIDENTIAL UNTIL PUBLISHED
100
Resource
utilisation item
PFS on
treatment
PFS off-
treatment
(up to 2
years)
PD Source
R +
chemotherapy
7.5% 7.5% 7.5% GO29365 NALT data, pooled;
assumed the same for R-GemOx
Rituximab 1.3% 1.3% 1.3% GO29365 NALT data, pooled;
assumed the same for R-GemOx
Radiotherapy 2.5% 2.5% 2.5% TA306, ERG report,13 Table 41
ECG 15.9% 15.9% 15.9% TA306, ERG report,13 Table 41
MUGA 7.9% 7.9% 7.9% TA306, ERG report,13 Table 41
MRI 4.0% 4.0% 4.0% TA306, ERG report,13 Table 41
PET-CT 1.7% 1.7% 1.7% TA306, ERG report,13 Table 41
Bone marrow
biopsy
13.6% 13.6% 13.6% TA306, ERG report,13 Table 41
Source: Table 55 in the CS.14 a One-off costs weighted by the proportion of patients requiring the respective resource.
Abbreviations: BR = bendamustine + rituximab; CS = company submission; CT = computed tomography; ECG
= electrocardiogram; ERG = Evidence Review Group; GP = General Practitioner; LDH = lactate
dehydrogenase test; MRI = magnetic resonance imaging; MUGA = multiple-gated acquisition scan; PD =
progressed disease; PET-CT = positron emission tomography–computed tomography; PFS = progression-free
survival; Pola+BR = polatuzumab + bendamustine + rituximab; R-GemOx = rituximab + gemcitabine +
oxaliplatin.
The average per cycle supportive care costs for each health state were calculated using the unit costs
and the annual frequencies presented above, and are listed in Table 5.14.
Table 5.14: Per cycle supportive care costs for PFS and PD health states
PFS on-treatment PFS off-treatment (up
to 2 years)
PFS off-treatment
(after 2 years)
PD
£460.22 £160.21 £0.00 £363.64
Source: Table 56 in the CS.14
Abbreviations: CS = company submission; PD = progressed disease; PFS =progression-free survival.
In GO29365, each treatment arm contained a single patient who received a transplant (2.5% in each
arm). Both patients were from the same treatment centre, which led the company to assume that
subsequent treatment with SCT is not a widespread treatment choice. The company therefore did not
expect that a significant proportion of patients who meet the decision problem would proceed to
transplant after Pola+BR or BR treatment in UK clinical practice. Accordingly, costs for post-treatment
SCT were not included in the company base case model. In the Pola+BR treatment arm two patients
received CAR-T therapy, one of whom subsequently died, whereas no patients received CAR-T therapy
in the BR arm. The company did not consider CAR-T as part of standard NHS clinical practice since it
is currently funded by the Cancer Drug Fund (CDF). Accordingly, post-treatment CAR-T costs were
not included in the company base case model.
5.2.9.3 Subsequent therapy costs
In study GO29365, the majority of patients in the randomised phase ****), did not receive any
subsequent therapy after Pola+BR or BR. Of those receiving treatment, the majority received
Copyright 2019 Queen's Printer and Controller of HMSO. All rights reserved

CONFIDENTIAL UNTIL PUBLISHED
101
chemotherapy with or without rituximab (*************************). For the purpose of the
economic analysis, the subsequent treatment costs for patients in PD who come off of Pola+BR or BR
treatment, were estimated based on the proportion receiving chemotherapy, chemotherapy with
rituximab, rituximab alone or radiotherapy. Other regimens, which included investigative treatments or
SCT/CAR-T, were not costed. Based on clinical opinion,28 the base case assumes the same subsequent
treatments are given in both arms. Therefore, pooled estimates across arms from GO29365 for the
proportion of patients receiving treatments in the aforementioned categories were used. For the cost of
chemotherapy with or without rituximab, the costs of three cycles of GemOx with and without rituximab
were assumed, as chemotherapies are available as generic medicines, and costs of different regimens
are broadly similar. A weighted average cost was calculated as shown in Table 5.15. The total cost of
subsequent treatments was applied as a one-off cost at the time point of progression in the model.
Table 5.15: Subsequent treatment costs based on GO29365 data
Pola+BR
N, %
BR
N, %
Pooled
N, %
Unit cost Source of cost
assumptions
Chemotherapy * ***** * ***** ** ***** £1116.40 Assumes 3 cycles of
chemotherapy and
administrationa
R-
chemotherapy
* ***** * **** * **** £2860.98 Assumes 3 cycles of
R-chemotherapy and
administrationa
Rituximab * **** * **** * **** £2765.83 Assumes 3 cycles of
rituximab and
administrationa
Radiotherapy * **** * **** * **** £162.88 National schedule of
reference costs 2017–
1812; SC42Z, day case
Other * ***** * ***** * ***** £0 Not costed (see text)
SCT * **** * **** * **** £0 Not costed (see text).
CAR-T * **** * **** * **** £0 Not costed (see text).
Weighted average cost per patient £593.16 Based on pooled
proportions of patients
receiving each therapy
Source: Table 57 in the CS.14 a Drug acquisition costs and administration for R-chemotherapy were based on those for R-GemOx; for
chemotherapy alone and rituximab alone, the costs of rituximab or chemotherapy were excluded as relevant.
Abbreviations: BR = bendamustine + rituximab; CAR-T = chimeric antigen receptor-T cell; CS = company
submission; Pola+BR = polatuzumab + bendamustine + rituximab; R-chemotherapy = rituximab-
chemotherapy; R-GemOx = rituximab + gemcitabine + oxaliplatin; SCT = stem cell transplant.
ERG comment: Similar to the ERG’s concerns regarding patients who have been in PFS for two years
being assumed to have the same mortality risk and utility as the general population, this concern also
applies to the assumption of the supportive care costs being applicable to patients in PFS for the first
two years only. Although the ESMO guidelines indeed emphasise “the need to only specifically monitor
the disease in this early period” (i.e. in reference to OS being identical to that of the general population
after two event-free years), this does not rule out that further evaluations are performed in case of
suspicious symptoms or high-risk patients. In TA559, the corresponding ERG commented that “these
assumptions on the costs and HRQoL of PFS patients in the model appear to be overly optimistic and
lacking robust evidence to support them”.5 The current ERG agrees to that statement.
Copyright 2019 Queen's Printer and Controller of HMSO. All rights reserved

CONFIDENTIAL UNTIL PUBLISHED
102
Health care resource use is based on TA306,13 for which in turn it was based on estimates from a survey
of three key opinion leaders, commissioned by the company that submitted TA306.13 As was also noted
by the ERG for TA306,13 this approach is ‘subject to higher levels of uncertainty’. For the current
submission, the ERG notes that no further validation was done regarding the applicability of these data
to the current context.
For the costs of chemotherapy in PD, the costs of GemOx were assumed. This is justified by stating
that chemotherapies are assumed 1) to be available as generic medicines and 2) that the costs of different
regimens are broadly similar. These assumptions were not validated by clinical experts. Regarding the
first assumption, the company pointed out in their response to clarification questions that seven out of
the 11 individual medicines that were listed as part of an additional chemotherapy regimen as included
in the final NICE scope were indeed generic medicines since their costs were sourced from eMIT (NHS
Drugs and Pharmaceutical electronic Market Information Tool). Regarding the second assumption, the
company refers to Table 51 in the CS (i.e. Table 5.10 in this report) to point out that the costs for the
chemotherapy regimens included in the final NICE scope are below £300 per cycle, and therefore
unlikely to significantly impact cost effectiveness results. The ERG notes that the per cycle acquisition
costs for gemcitabine and oxaliplatin, £17.84 and £13.87 respectively, do appear as substantially less
than those for bendamustine (i.e. £95.95), P-Mit-CEBO (i.e. £87.63), and DECC (i.e. £256.78).
However, the ERG confirms that variation in this parameter has a negligible effect on the ICER.
In contrast to the company’s decision to leave the costs for SCT and CAR-T out of consideration for
the cost effectiveness analysis, the ERG considers it more appropriate to include those costs based on
the incidences as indicated by the trial data. Due to uncertainty regarding the costs of CAR-T, the costs
are assumed to be the same as the costs of SCT.
5.2.9.4 Adverse event costs
Treatment-related AEs included in the model for Pola+BR and BR were derived from serious treatment-
related AEs of CTCAE Grade 3 or higher from the randomised phase of GO29365. The frequencies of
AEs are already presented in section 5.2.7. The unit costs associated with the management of the
identified AEs are presented in Table 5.16 below.
Table 5.16: Unit costs of treatment-related AEs
Event (grade) Unit cost (£) Sourcea
Acute kidney injury 332.50 Weighted average of LA07M-P; DC
Atrial fibrillation 670.13 Weighted average of EB07A-E; DC
Atrial flutter 670.13 Weighted average of EB07A-E; DC
Anaemia 309.09 Weighted average of SA01G-K, SA03G-H,
SA04G-L, SA05G-J; day case
Cytomegalovirus
infection
393.65 Weighted average of WH07B-G; DC
Decreased appetite 382.30 Assumed same as vomiting
Diarrhoea 392.26 Weighted average of
FD10J, FD10K, FD10L, FD10M; DC
Febrile neutropenia 1,847.50 TA306 (£1,627); inflated to 2018 using PSSRU
inflation index
Herpes virus infection 377.90 Weighted average of
FD10J, FD10K, FD10L, FD10M; DC
Copyright 2019 Queen's Printer and Controller of HMSO. All rights reserved

CONFIDENTIAL UNTIL PUBLISHED
103
Event (grade) Unit cost (£) Sourcea
Leukoencephalopathy 3,609.61 Weighted average of AA25C-G; NEL
Leukopenia
291.00 Weighted average of SA35A-E; DC
Lower respiratory tract
infection
377.90 Weighted average of
FD10J, FD10K, FD10L, FD10M; DC
Meningoencephalitis
herpetic
3,652.18 Weighted average of AA22C-G; NEL
Myelodysplastic
syndrome
556.99 Weighted average of SA06G-K; NES
Neutropenia 291.00 Weighted average of SA35A-E; DC
Neutropenic sepsis 1,847.50 Assumed same as febrile neutropenia
Oedema peripheral 343.16 Weighted average of WH10A-B; NES
Pneumonia 495.81 Weighted average of DZ11K-V; NES
Pulmonary oedema 2,189.85 Weighted average of DZ20D-F; NEL
Pyrexia 309.56 Weighted average of WJ07A-D; DC
Septic shock 1,037.71 Weighted average of WJ06A-F, NES
Supraventricular
tachycardia
670.13 Weighted average of EB07A-E; DC
Thrombocytopenia 281.96 Weighted average of SA12G-SA12K; DC
Vomiting 382.30 Weighted average of FD10C-M; DC
Source: Table 58 in the CS.14 a NHS Improvement. NHS Reference Cost Schedule, 2017–1812 unless stated otherwise.
Abbreviations: AE = adverse event; CS = company submission; DC = day case; NEL = non-elective
inpatients; NES = non-elective short stay; PSSRU = Personal Social Services Research Unit.
A separate cost of death was not applied to the model as it was assumed the costs for supportive care
after progression would be accounted for in the cancer-related palliative care costs for progressed
patients. Cost and resource use for death from other causes is not included in the model.
ERG comment: A comprehensive set of AEs were considered and taken into account for the economic
analysis. For the frequencies, relevant trial data (serious treatment-related AEs of CTCAE Grade 3 or
higher from the randomised phase of GO29365) were used, and costs were valued using the most recent
schedule of NHS reference costs. The ERG considers this approach as appropriate.
Copyright 2019 Queen's Printer and Controller of HMSO. All rights reserved

CONFIDENTIAL UNTIL PUBLISHED
104
6. COST-EFFECTIVENESS RESULTS
6.1 Company’s cost effectiveness results
The discounted base-case results presented in Table 6.1 indicated that Pola+BR generated ****
incremental QALYs, and **** LYGs, with higher incremental costs of ******* compared to BR.
Therefore, the incremental cost-effectiveness ratio (ICER) was £26,877 per QALY gained.
Table 6.1: Company base-case cost effectiveness results (discounted)
Technologies
Total
costs (£)
Total
LYGs
Total
QALYs
Incr.
costs (£)
Incr.
LYGs
Incr.
QALYs
ICER versus
baseline
(£/QALY)
Pola+BR ******* **** **** ******* **** **** £26,877
BR £18,019 1.00 0.68 - - - -
Source: Table 61 of the CS.14
Abbreviations: BR = bendamustine + rituximab; CS = company submission; ICER = incremental cost-
effectiveness ratio; Incr. = incremental; LYGs = life years gained; pola = polatuzumab; QALYs = quality-
adjusted life years.
The disaggregated discounted QALYs by health state are given in Table 6.2. The disaggregated
discounted costs by health state and category are given in Tables 6.3 and 6.4, respectively.
Table 6.2: Summary of QALYs disaggregated by health state
Health state QALYs
intervention
(Pola+BR)
QALY
comparator
(BR)
Increment Absolute
increment
%
absolute
increment
PFS **** 0.37 **** **** *****
PD 0.14 0.32 −0.18 **** ****
AE disutilitya 0.009 0.007 0.001 ***** ****
Total **** 0.68 **** **** 100.0%
Source: Table 32 in Appendix J of the CS.62 a Disutility from adverse events as detailed in Section B.3.4.4 of the CS.14
Abbreviations: AE = adverse event; BR = bendamustine + rituximab; CS = company submission; PD =
progressed disease; PFS = progression-free survival; pola = polatuzumab ; QALY = quality-adjusted life year.
Table 6.3: Summary of costs disaggregated by health state
Health state Costs
intervention
(Pola+BR)
Costs
comparator
(BR)
Increment Absolute
increment
%
absolute
increment
PFS ******* £8,019 ******* ******* *****
PD £4,657 £10,000 −£5,343 £5,343 8.5%
Total ******* £18,019 ******* ******* 100.0%
Source: Table 33 in Appendix J of the CS.62
Abbreviations: BR = bendamustine + rituximab; CS = company submission; PD = progressed disease; PFS =
progression-free survival; pola = polatuzumab ; QALY = quality-adjusted life year.
Copyright 2019 Queen's Printer and Controller of HMSO. All rights reserved

CONFIDENTIAL UNTIL PUBLISHED
105
Table 6.4: Summary of disaggregated costs by category
Cost category Costs
intervention
(Pola+BR)
Costs
comparator
(BR)
Increment Absolute
increment
%
increment
Polatuzumab ******* ** ******* ******* *****
Bendamustine £433 £311 £122 £122 ****
Rituximab £2,624 £1,886 £738 £738 ****
Drug administration £3,324 £2,181 £1,143 £1,143 ****
AE management £337 £386 −£49 £49 ****
Supportive care costs £8,156 £3,254 £4,902 £4,902 ****
Subsequent care
costs, PD
£4,657 £10,000 -£5,343 £5,343 ****
Total ******* ******* ******* ******* 100.0%
Source: Table 34 in Appendix J of the CS.62
Abbreviations: AE = adverse event; BR = bendamustine + rituximab; CS = company submission; PD =
progressed disease; pola = polatuzumab; QALY = quality-adjusted life year.
6.2 Company’s sensitivity analyses
6.2.1 Probabilistic sensitivity analysis
The company conducted a PSA based on 2,000 iterations. The input parameters included in the PSA,
with their corresponding probability distributions, were reported in Table 62 of the company
submission.14 Parameters of the PFS and OS survival distributions were varied according to multivariate
normal distributions with the mean values and covariance matrices reported in the economic model.
Standard errors (SEs) for the input parameters, where available, were obtained from the same data
source used to derive the point estimates. For AE disutility and cost parameters the SE was calculated
as 10% deviation from the mean, and according to the following equation: SE = (LN(mean+20%)-
LN(mean-20%))/4, respectively. Additionally, the AE incidence occurrences were also sampled using
a lognormal distribution.
The discounted PSA results are shown in Table 6.5. The average incremental costs and incremental
QALYs were ******* and **** respectively, resulting in an ICER of £41,326 per QALY gained.
Compared to the deterministic ICER in Table 6.1, the probabilistic ICER was £14,449 higher.
Table 6.5: Company base-case probabilistic cost effectiveness results (discounted)
Technologies
Total
costs (£)
Total
LYGs
Total
QALYs
Incr.
costs (£)
Incr.
LYGs
Incr.
QALYs
ICER versus
baseline
(£/QALY)
Pola+BR ******* **** **** ******* **** **** £41,326
BR £18,076 1.00 0.68 - - - -
Source: Table 63 of the CS.14
Abbreviations: BR = bendamustine + rituximab; CS = company submission; ICER = incremental cost-
effectiveness ratio; Incr. = incremental; LYGs = life years gained; pola = polatuzumab; QALYs = quality-
adjusted life years.
Copyright 2019 Queen's Printer and Controller of HMSO. All rights reserved

CONFIDENTIAL UNTIL PUBLISHED
106
The PSA outcomes were plotted in the CE plane, and, subsequently, a CEAC was derived. These are
shown in Figures 6.1 and 6.2, respectively. All the 2,000 PSA iterations provided results in the north-
eastern quadrant of the CE plane, where Pola+BR is more effective and more expensive than BR alone.
The CEAC showed that Pola+BR has a **% probability of being cost effective at a threshold of £50,000
per QALY.
Figure 6.1: Scatterplot from the probabilistic sensitivity analysis
Source: Figure 28 of the CS.14
Abbreviations: CS = company submission; PSA = probabilistic sensitivity analysis; BR= bendamustine +
rituximab; Pola+BR= polatuzumab + bendamustine + rituximab; QALY= quality-adjusted life year.
Figure 6.2: Cost effectiveness acceptability curve
Based on Figure 29 of the CS.14
CS = company submission; PSA = probabilistic sensitivity analysis; BR= bendamustine + rituximab; Pola+BR=
polatuzumab + bendamustine + rituximab; QALY= quality-adjusted life year; WTP=willingness to pay
ERG comment: The ERG pinpointed the reason for the gap between the probabilistic and the
deterministic ICER estimates in the company submission. In the company model, the ICER is calculated
at each iteration and the average value of these iteration specific ICERs were calculated. Since the ICER
frequently has outlier values, the average of the ICERs from iterations does not converge quickly, and
for that purpose, the median of the simulation iteration ICERs or the ratio of the mean incremental costs
to mean incremental QALYs would provide a more stable estimate of the probabilistic mean ICER. The
ERG corrected this in its exploratory analyses.
Copyright 2019 Queen's Printer and Controller of HMSO. All rights reserved

CONFIDENTIAL UNTIL PUBLISHED
107
The ERG found the calculation of the SEs for the AE disutilities and costs rather arbitrary, however this
is not changed in the base-case as there was no other available source from the literature and the
expected impact on the incremental results was minor. Additionally, the ERG considered that sampling
the AE incidence probabilities using beta distributions would be methodologically more plausible.
Hence in the ERG analyses, the company model is corrected in terms of how AE incidence probabilities
were sampled.
6.2.2 Deterministic sensitivity analysis
The company also conducted a deterministic sensitivity analysis (DSA). The value of each parameter
included in the analysis was provided in Table 64 of the CS.14 Total cost categories were varied at once
and AE disutilities were varied using the average disutility of all AEs, weighted by frequency and
duration. Where available, the upper and lower limits for each input parameter (or group of parameters)
were based upon the 10% and 90% percentiles obtained from the probability distributions used in the
PSA. Otherwise, parameters were varied by ±20% deviation from the mean (alternatively ±5 kg for
mean weight, ±5% for mean BSA).
The tornado diagram in Figure 6.3 shows the impact on the ICER of the 15 parameters which caused
the largest changes in the ICER. From this figure, it can be observed that changes in the discount rate
for health effects and the average patient age at baseline resulted in the largest changes in the ICER,
which remained always between £25,000 and £29,000 per QALY.
Figure 6.3: Tornado diagram – company’s preferred assumptions
Source: Figure 31 of the CS.14
Abbreviations: AE = Adverse events; BR = bendamustine + rituximab; PD = progressed disease; PFS =
progression-free survival; Pola+BR = polatuzumab + bendamustine + rituximab; QALY = quality-adjusted life
year.
ERG comment: It should be emphasised that the DSA conducted by the company is not a one-way
sensitivity analysis. Costs and AE disutilities were treated as a group. Therefore, in the DSA, individual
parameters are compared with groups of parameters, which introduces bias in the result of the DSA.
The tornado diagram also indicated that the discount rate for the health effects was the most influential
parameter. However, discount rates are usually not included in the DSA (because it would assume rate
values that are unlikely to occur in reality). Furthermore, in their response to the clarification letter
(question B21),2 the company indicated that only “independent” parameters were included in the
deterministic sensitivity analysis. As a result, important parameters like those of the survival curves or
cure rates were not included in the DSA. Finally, the range of variation for the input parameters (10%
and 90% percentiles from PSA or ±20% deviation from the mean) seems arbitrary and it is unclear
Copyright 2019 Queen's Printer and Controller of HMSO. All rights reserved

CONFIDENTIAL UNTIL PUBLISHED
108
whether it represents a comparable range of variation. Therefore, for the reasons mentioned above, the
ERG considers that the DSA results presented by the company can be misleading and should be
interpreted with caution.
6.2.3 Scenario analyses
The company undertook a series of scenario analyses in order to test the impact of a number of
assumptions on model results. The scenarios tested and results obtained are summarised in Table 6.6.
ERG comment: The scenarios which had the largest impact on results were those involving alternative
methods of survival modelling. The largest increases in the ICER were seen for methods involving
extrapolation of OS and PFS using dependent and independent parametric distribution functions, which
led to ICERs between £33,126 and £59,753. All the other scenarios led to ICERs below £50,000.
Therefore, scenarios based on alternative assumptions of survival modelling were the main focus of the
ERG in Section 7 of this report.
Copyright 2019 Queen's Printer and Controller of HMSO. All rights reserved
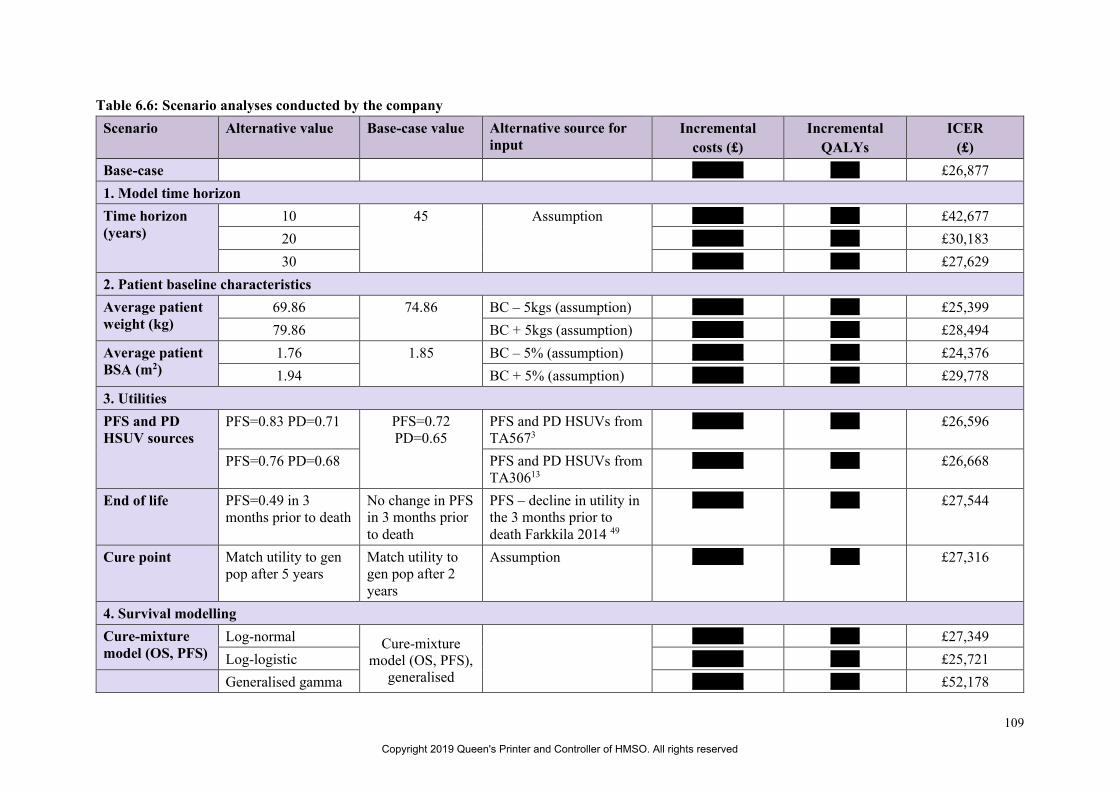
109
Table 6.6: Scenario analyses conducted by the company
Scenario Alternative value Base-case value Alternative source for
input
Incremental
costs (£)
Incremental
QALYs
ICER
(£)
Base-case ******* **** £26,877
1. Model time horizon
Time horizon
(years)
10 45 Assumption ******* **** £42,677
20 ******* **** £30,183
30 ******* **** £27,629
2. Patient baseline characteristics
Average patient
weight (kg)
69.86 74.86 BC – 5kgs (assumption) ******* **** £25,399
79.86 BC + 5kgs (assumption) ******* **** £28,494
Average patient
BSA (m2)
1.76 1.85 BC – 5% (assumption) ******* **** £24,376
1.94 BC + 5% (assumption) ******* **** £29,778
3. Utilities
PFS and PD
HSUV sources
PFS=0.83 PD=0.71 PFS=0.72
PD=0.65
PFS and PD HSUVs from
TA5673
******* **** £26,596
PFS=0.76 PD=0.68 PFS and PD HSUVs from
TA30613
******* **** £26,668
End of life PFS=0.49 in 3
months prior to death
No change in PFS
in 3 months prior
to death
PFS – decline in utility in
the 3 months prior to
death Farkkila 2014 49
******* **** £27,544
Cure point Match utility to gen
pop after 5 years
Match utility to
gen pop after 2
years
Assumption ******* **** £27,316
4. Survival modelling
Cure-mixture
model (OS, PFS)
Log-normal Cure-mixture
model (OS, PFS),
generalised
******* **** £27,349
Log-logistic ******* **** £25,721
Generalised gamma ******* **** £52,178
Copyright 2019 Queen's Printer and Controller of HMSO. All rights reserved

CONFIDENTIAL UNTIL PUBLISHED
110
Scenario Alternative value Base-case value Alternative source for
input
Incremental
costs (£)
Incremental
QALYs
ICER
(£)
Dependent
parametric
distribution
function (OS,
PFS),
Log-normal gamma. OS
informed by PFS. ******* **** £58,191
Log-logistic ******* **** £59,753
Independent
parametric
distribution
function (OS,
PFS)
Generalised gamma ******* **** £33,126
Log-normal ******* **** £59,241
Log-logistic ******* **** £56,339
OS not informed
by PFS (cure-
mixture
extrapolation)
Generalised gamma
(PFS and OS)
******* **** £26,223
Log-normal (PFS
and OS)
******* **** £27,795
Log-logistic (PFS
and OS)
******* **** £26,052
Excess mortality
for long-term
survivors
Excess hazard = 1.1 Excess hazard = 0 ******* **** £27,894
5. Costs and resource use
Vial sharing and
size assumptions
polatuzumab
Only 140 mg vials
and no vial sharing
140 mg and 30
mg vials
available. No vial
sharing.
Based on interim supply
arrangement (30 mg vials
not anticipated to be
available until
*********)
******* **** £36,502
Only 140 mg vials
and 100% vial
sharing
******* **** £25,196
Supportive care
costs
No supportive care
costs incurred by
long term survivors
after 3 years
Assumption ******* **** £27,868
Copyright 2019 Queen's Printer and Controller of HMSO. All rights reserved

CONFIDENTIAL UNTIL PUBLISHED
111
Scenario Alternative value Base-case value Alternative source for
input
Incremental
costs (£)
Incremental
QALYs
ICER
(£)
6. Alternative comparator
Alternative
comparator
Pola+BR vs R-
GemOx
Pola+BR vs BR ******* **** £28,410
Source: Table 65 in CS.14
Abbreviations: BC = base case; BR= bendamustine + rituximab; BSA = body surface area; gen pop = general population; HSUV = health state utility values; PD = progressed
disease; PFS = progression-free survival; Pola+BR= polatuzumab + bendamustine + rituximab; OS = overall survival; QALYs = quality-adjusted life years; R-GemOx = R-
GemOx = rituximab + gemcitabine + oxaliplatin.
Copyright 2019 Queen's Printer and Controller of HMSO. All rights reserved

CONFIDENTIAL UNTIL PUBLISHED
112
6.2.4 Subgroup analysis
No subgroup analysis was conducted in the original submission
6.3 Model validation and face validity check
Validation was performed by an advisory board of nine UK clinicians held in October 2018.28 During
this meeting the clinical experts discussed the assumptions made in the model, to ensure their clinical
validity and alignment with UK clinical practice.
The plausibility of PFS and OS long-term extrapolations was also validated through comparison to
long-term data for polatuzumab vedotin regimens in DLBCL (see Section 5.2.6 of this report).
A comparison of the median PFS and median OS produced by the model base case and those observed
in GO29365 was also provided by the company. This can be seen in Table 6.7.
Table 6.7: Comparison of model median PFS and median OS vs. GO29365
Technologies Median PFS (months) Median OS (months)
Model GO29365 (95% CI) Model GO29365 (95% CI)
Pola+BR 8.0 ****************** 13..1 *******************
BR 2.1 ***************** 5.1 *****************
Source: Table 66 of the CS14
Abbreviations: BR = bendamustine + rituximab; CI = confidence interval; OS = overall survival; PFS =
progression-free survival; pola = polatuzumab.
ERG comment: A summary of the validation efforts undertaken by the company are summarised in
Table 6.8.
The company indicated that a review of the model, including formula and calculation checks, was
performed by an agency in draft versions of the model. The specific tests, and whether these were
conducted in the final version of the model or not, were not reported. Therefore, the degree of internal
validation of the model cannot be assessed by the ERG. The additional validation efforts conducted by
the ERG led to the identification of several modelling errors that are described in Section 7.1.2 of this
report.
In clarification question B8, the ERG asked the company to provide probability estimates for PFS and
OS which can be used to validate the parametric curves used in the model.2 In their response, the
company indicated that during the advisory board held in October 2018, the PFS and OS data from the
clinical trial and the plausibility of the parametric extrapolations for both BR and Pola+BR arms was
discussed with UK clinicians. However, these extrapolations were based on an earlier version of the
model (April 2018 data-cut) and it is, therefore, unclear whether the extrapolations in the final version
of the model were validated by experts. Discussion was focused on the long-term behaviour of the BR
arm since experts were not able to estimate the long-term behaviour for the Pola+BR arm based on their
clinical experience. Regarding OS for the BR arm, the experts consulted by the company considered
that survival at year 1 should be comparable to other available regimens and provided an estimate of
approximately 20%. Long-term survival (from five years onwards) was estimated to be between 5% –
10%. The experts considered that PFS in the BR arm was underestimated in that earlier version of the
model: 18% of patients were in progression-free survival at six months. In the current version of the
model this estimate is 23% in the base-case. Whereas this value is higher than the previous 18%, it is
Copyright 2019 Queen's Printer and Controller of HMSO. All rights reserved

CONFIDENTIAL UNTIL PUBLISHED
113
not mentioned whether 23% met the expectations of the clinical experts and, therefore, it is not
validated. The clinical experts consulted by the company also mentioned that “2 years PFS was deemed
as indicating long-term response and survival (implying a rate of 5-10% in current practice for PFS
beyond 2 years)”.2
For the validation of the cure-mixture models, the company referred to an abstract written in
collaboration with the clinical study investigators of GO29365 who contributed and agreed to the
publication of the abstract and its conclusions.63
In clarification question B8, the ERG also asked the company to provide estimates for the standardized
mortality ratio for the “cured” relapsed or refractory diffuse large B-cell lymphoma patients and to
apply this ratio in the model for the “cured” patients.2 In their response, the company indicated that they
are only aware of a ratio of 1.09, that was applied to the background mortality for long-term survivors
in TA567 and TA559.3, 5 In both STAs, this ratio was applied in scenario analyses but not in the base-
case. In line with these STAs, the company implemented this ratio in the model and the impact of it in
the model results was investigated in an additional scenario (See Table 6.6).
Table 6.8: Validation efforts undertaken by the company on the economic model
Item Key validation steps Reference in ERG
report/clarification
questions
Partitioned
survival model
concept
Structure based on previous and recent use in
NICE technology appraisals in DLBCL
Alignment with NICE DSU guidance for
oncology modelling
Model structure was presented at advisory board
and no objections were raised by clinical
experts
Section 5.2.2
Input data The applicability of the GO29356 clinical trial
data to the UK was verified at an advisory board
of UK clinical experts
The statistical fit of PFS and OS extrapolations
was explored in detail, in line with
recommendations in NICE DSU TSD 1438
Cost inputs are from the NHS/PSS perspective,
as recommended by the NICE reference case
Section 5.2
Excel model Agency preformed a review of the model
including checking formulas and tracing
calculation errors in draft versions of the model
Clarification letter response
(question B20).2
Model outcomes The long-term extrapolation for BR based on an
earlier data cut of GO29365 was validated with
expert clinicians at an advisory board
The base case cure mixture extrapolations were
validated against available long-term data to
ensure their clinical validity
Base case cure-mixture model analysed and
published with clinical trial investigators63
Section 5.2.6,
Clarification letter response
(question B8).2
Source: CS14 and clarification letter response2.
Abbreviations: CS = company submission; DLBCL = diffuse large B-cell lymphoma; DSU = Decision Support
Unit; NICE = National Institute for Health and Care Excellence; OS = overall survival; PFS = progression-free
survival; PSS = Personal and Social Services; TSD = Technical Support Document.
Copyright 2019 Queen's Printer and Controller of HMSO. All rights reserved

CONFIDENTIAL UNTIL PUBLISHED
114
7. EVIDENCE REVIEW GROUP’S ADDITIONAL ANALYSES
7.1 Exploratory and sensitivity analyses undertaken by the ERG
7.1.1 Explanation of the company adjustments after the request for clarification
Following the clarification questions from the ERG, the company made the following amendments to
the originally submitted cost effectiveness model:
• The cost effectiveness model has been updated with clinical trial data from the new data cut
from GO29365 (**********).
• The utility values for proximity to death in the model are corrected from 0.49 to 0.47. The new
values reflect the corrected utility values from the study where it was sourced 49
• The administration costs for R-GemOx in the model are updated from £340.42 to £405.72. The
updated value reflects use of correct HRG code (SB13Z replaced with SB14Z).
• The AE incidence of R-GemOx for anemia and thrombocytopenia, which are used in the utility
decrement calculations are corrected from 33% to 0%; and from 23% to 44%, respectively.
These values reflect correct AE rates in the R-GemOx arm from Mounier 2013.9
After the changes were made in the model, the company has re-run the base-case, sensitivity and
scenario analyses. The discounted base-case deterministic and probabilistic results are presented in
Table 7.1 and 7.2, respectively. The tornado diagram from the DSA, the CE-plane and CEAC from the
PSA and the results of the scenario analyses are similar to those in the original submission and,
therefore, not reported here. Further details can be found in the response to the clarification letter
(economic appendix) submitted by the company with the responses to the clarification letter.2
Table 7.1: Company base-case cost effectiveness results after clarification (discounted)
Technologies
Total
costs (£)
Total
LYGs
Total
QALYs
Incr.
costs (£)
Incr.
LYGs
Incr.
QALYs
ICER versus
baseline
(£/QALY)
Pola+BR ******* **** **** ******* **** **** £25,307
BR £17,440 0.98 0.67 - - - -
Source: Table 2 of the response to the clarification letter (economic appendix).2
Abbreviations: BR = bendamustine + rituximab; ICER = incremental cost-effectiveness ratio; Incr. =
incremental; LYGs = life years gained; pola = polatuzumab; QALYs = quality-adjusted life years.
Table 7.2: Company base-case probabilistic cost effectiveness results after clarification
(discounted)
Technologies
Total
costs (£)
Total
LYGs
Total
QALYs
Incr.
costs (£)
Incr.
LYGs
Incr.
QALYs
ICER versus
baseline
(£/QALY)
Pola+BR ******* **** **** ******* **** **** £37,749
BR £17,762 0.98 0.67 - - - -
Source: Table 4 of the response to the clarification letter (economic appendix).2
Abbreviations: BR = bendamustine + rituximab; ICER = incremental cost-effectiveness ratio; Incr. =
incremental; LYGs = life years gained; pola = polatuzumab; QALYs = quality-adjusted life years.
Copyright 2019 Queen's Printer and Controller of HMSO. All rights reserved

CONFIDENTIAL UNTIL PUBLISHED
115
ERG comment: The company, in its updated model in response to the clarification letter, did not
provide the details of its re-conducted survival analysis based on the later cut-off point. The distribution
types that were chosen in the original economic model for the OS and PFS extrapolation were not
changed in the updated model. The ERG did not detect a major difference in terms of the goodness of
fit and visual fit results of the updated survival distributions. However the AIC/BIC results and the
visual fit assessments of the newly provided data, conducted by the ERG, is presented in Appendix 4.
The ERG noticed, however, that the updated company model did not integrate the necessary PSA
parameters of the PFS and OS extrapolations to the calculations. Especially for the covariance matrices
of the “non-proportional” standard parametric distributions, which were needed in the PSA, the model
was referring to wrong cells. The ERG corrected these errors in its preferred analyses.
7.1.2 Explanation of the ERG adjustments
The changes made by the ERG (to the model received with the response to the clarification letter) were
subdivided into the following three categories (according to Kaltenthaler et al. 2016)64:
• Fixing errors (correcting the model where the company’s electronic model was unequivocally
wrong).
• Fixing violations (correcting the model where the ERG considered that the NICE reference
case, scope or best practice has not been adhered to).
• Matters of judgement (amending the model where the ERG considered that reasonable
alternative assumptions are preferred).
After these changes were implemented in the company’s model, additional scenario analyses were
explored by the ERG in order to assess the impact of alternative assumptions on the cost effectiveness
results.
7.1.2.1 Fixing errors
The following errors were fixed in the economic model used in the ERG preferred analyses.
The correction of these errors has an impact on the probabilistic results but did not change the
deterministic results of the updated company base case.
1. Errors in the implementation of alternative survival curves in the PSA (explained in section
7.1.1 in this report)
2. Errors in the reporting of the probabilistic ICER in the model results sheets (explained in section
6.2.1 in this report)
3. AE incidence varied using beta distribution in the PSA (explained in section 6.2.1 in this report)
7.1.2.2 Fixing violations
4. General population mortality is now calculated based on the “average patient”, in line with the
cohort approach and not based on individual patient level approach (explained in section 5.2.6.4
in this report)
5. A logical constraint is added to OS, such that the OS from the general population with excess
mortality is always larger or equal to the OS from the extrapolations from the GO29365 survival
data.
Copyright 2019 Queen's Printer and Controller of HMSO. All rights reserved

CONFIDENTIAL UNTIL PUBLISHED
116
7.1.2.3 Matters of judgement
6. Survival modelling – The ERG did not feel that the data could confidently support the use of
cure-mixture models. PFS extrapolation to IRC data is selected from standard lognormal
distribution independently fitted to both arms (lowest AIC/BIC scores and plausible visual fit
and long-term extrapolation) and OS extrapolation is selected from standard generalised
gamma distribution independently (plausible AIC/BIC scores, visual fit and long-term
extrapolation) fitted to both arms (see ERG comment in section 5.2.6 and Appendix 4 for
detailed explanations for the choice of these distributions).
7. Excess mortality SMR = 1.41 compared to age- and gender-matched general population
mortality is applied (see ERG comment in section 5.2.6).
8. HRQOL and cost assumptions for long-term survivors – The time point at which equivalence
in HRQoL and cost with general population is assumed has been changed from two to three
years, given evidence from the literature that HRQoL may be equivalent after three years (see
ERG comment in section 5.2.8).8 Given the uncertainty in the assumption that patients who
have remained event-free for two years will not incur any further costs related to treatment
follow-up and monitoring, the ERG base-case extends the time period during which such costs
are incurred to three years. This assumption is aligned with those regarding the utilities of the
same patients in the ERG base-case (also see ERG comment in section 5.2.9.2).
9. As explained in the ERG comment in section 5.2.9.1, the ERG considers a base-case that
reflects the current availability of vial sizes for polatuzumab as the most appropriate. Therefore,
the ERG base-case is based on the acquisition costs of polatuzumab that follow from the use of
140 mg vials only, with no vial sharing. (See ERG comment in section 5.2.9)
10. The treatment costs for the Pola+BR and BR regimens are applied for as long as patients in the
trial receive treatment (i.e. based on TTOT KM data). In contrast to the company’s base-case,
it is thus not assumed that the Pola+BR and BR regimens are only provided up to a maximum
of six treatment cycles (see ERG comment in section 5.2.9.1).
11. The ERG base-case includes the costs for post-progression treatment with SCT and CAR-T,
based on the incidence that follows from the trial data. This deviates from the company’s base-
case, in which these costs were not included (also see ERG comment in section 5.2.9.2).
12. AE incidences from Table 4.16 in this ERG report were utilised in the model.
Copyright 2019 Queen's Printer and Controller of HMSO. All rights reserved

CONFIDENTIAL UNTIL PUBLISHED
117
Table 7.3: Company and ERG base-case preferred assumptions
Base-case preferred
assumptions
Company Justification ERG Justification for change
Survival model PFS Cure-mixture
generalised gamma
distribution
1. Literature from the natural
history of newly diagnosed
DLBCL patients. 4.
2. The clinical experts’
expectation
3. The company considered
that a very low risk of relapse
or death can be observed in
the KM plots for PFS and OS
for Pola+BR towards the end
of follow-up.
4. The precedent of cure-
mixture modelling in
previous NICE appraisals for
R/R DLBCL patients
receiving CAR-T therapies
Independent log-
normal
Lack of robust long-term
evidence for the cure
assumption, the ERG chose
among the parametric curves
in terms of model fit and
plausibility of extrapolations.
Survival model OS Cure-mixture
generalised gamma
distribution
Independent
generalised gamma
Lack of robust long-term
evidence for the cure
assumption, the ERG chose
among the parametric curves
in terms of model fit and
plausibility of extrapolations.
Treatment effect Maintained over the
duration of patient’s
remaining life
Exploratory time-to-event
analyses demonstrated a
consistent treatment effect
for DOR, PFS, EFS and OS
Maintained over the
duration of patient’s
remaining life
No change
HRQoL and cost
assumptions for long-term
survivors
HRQoL and costs of
patients in PFS after 2
years equivalent to age-
and sex-matched general
population
Evidence from literature
suggesting no statistically
significant difference in
mortality for those DLBCL
patients event free at 2 years 4 and limited evidence of no
difference in HRQoL
HRQoL and costs of
patients in PFS after 3
years equivalent to
age- and sex-matched
general population
Evidence presented in
clarification response
suggested that HRQoL may be
equivalent after 3 years. 8
Given uncertainty surrounding
costs of long-term survivors,
this was also extended to 3
Copyright 2019 Queen's Printer and Controller of HMSO. All rights reserved
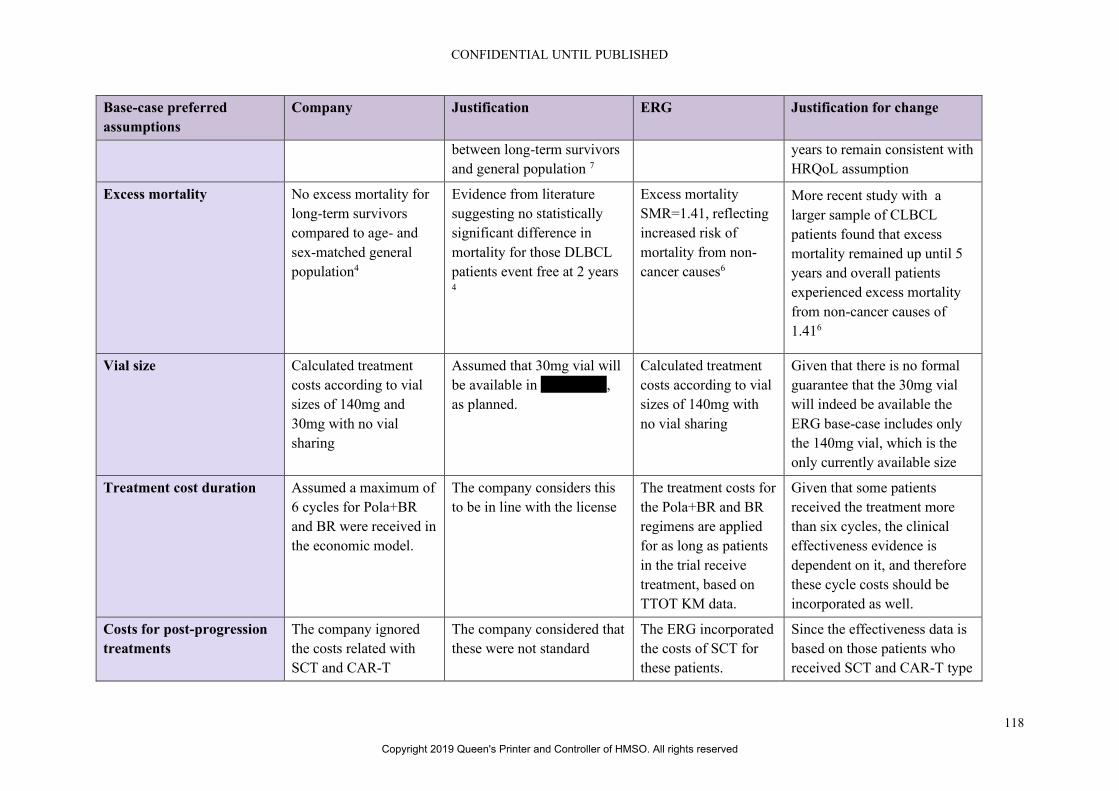
CONFIDENTIAL UNTIL PUBLISHED
118
Base-case preferred
assumptions
Company Justification ERG Justification for change
between long-term survivors
and general population 7
years to remain consistent with
HRQoL assumption
Excess mortality No excess mortality for
long-term survivors
compared to age- and
sex-matched general
population4
Evidence from literature
suggesting no statistically
significant difference in
mortality for those DLBCL
patients event free at 2 years 4
Excess mortality
SMR=1.41, reflecting
increased risk of
mortality from non-
cancer causes6
More recent study with a
larger sample of CLBCL
patients found that excess
mortality remained up until 5
years and overall patients
experienced excess mortality
from non-cancer causes of
1.416
Vial size Calculated treatment
costs according to vial
sizes of 140mg and
30mg with no vial
sharing
Assumed that 30mg vial will
be available in *********,
as planned.
Calculated treatment
costs according to vial
sizes of 140mg with
no vial sharing
Given that there is no formal
guarantee that the 30mg vial
will indeed be available the
ERG base-case includes only
the 140mg vial, which is the
only currently available size
Treatment cost duration Assumed a maximum of
6 cycles for Pola+BR
and BR were received in
the economic model.
The company considers this
to be in line with the license
The treatment costs for
the Pola+BR and BR
regimens are applied
for as long as patients
in the trial receive
treatment, based on
TTOT KM data.
Given that some patients
received the treatment more
than six cycles, the clinical
effectiveness evidence is
dependent on it, and therefore
these cycle costs should be
incorporated as well.
Costs for post-progression
treatments
The company ignored
the costs related with
SCT and CAR-T
The company considered that
these were not standard
The ERG incorporated
the costs of SCT for
these patients.
Since the effectiveness data is
based on those patients who
received SCT and CAR-T type
Copyright 2019 Queen's Printer and Controller of HMSO. All rights reserved

CONFIDENTIAL UNTIL PUBLISHED
119
Base-case preferred
assumptions
Company Justification ERG Justification for change
therapies received after
the progression.
therapies that are applied
post-progression
therapies after progression,
ignoring these would cause an
inconsistency.
AE incidences The company uses
“serious” grade 3 and
above adverse events in
the GO29365 trial.
“Serious” adverse events are
the adverse events that would
lead to costs in NHS
The ERG considered
all grade 3 and above
adverse events
reported in the clinical
effectiveness section,
wherever possible.
The criteria to consider an
adverse event as “serious” by
the company was not that
clear.
Copyright 2019 Queen's Printer and Controller of HMSO. All rights reserved

CONFIDENTIAL UNTIL PUBLISHED
120
7.1.3 Additional scenarios conducted by the ERG
The ERG conducted a series of additional scenario analyses in order to explore important areas of
uncertainty in the model. These key uncertainties were related to the survival modelling (in terms of
choice of parametric distributions and modelling of cure assumptions), excess mortality, assumptions
surrounding the HRQoL and costs of long-term survivors, sources of utility data and cost and resource
use assumptions. Other sources of uncertainty were deemed less important and were not explored in
this section. A list of scenario analyses conducted by the ERG is provided below.
7.1.3.1 Scenario set 1: changing PFS parametric distributions
The company base-case assumed a cure mixture generalised gamma model. Given the uncertainty
surrounding the cure assumption, discussed in section 5.2.6, the ERG examined alternative plausible
independent standard parametric models, including the log-normal (ERG BC), generalised gamma and
log logistic models as well as the additional cure-mixture extrapolation of the company in ERG base
case settings.
7.1.3.2 Scenario set 2: changing OS parametric distributions
The company base-case assumed a cure mixture generalised gamma model. Again, given the
uncertainty surrounding the cure assumption, discussed in section 5.2.6, the ERG examined alternative
plausible independent standard parametric models, including the log-normal, generalised gamma and
log logistic models as well as the additional cure-mixture extrapolation of the company in ERG base
case settings.
7.1.3.3 Scenario set 3: alternative approach to modelling long-term mortality (explicit vs. no
explicit cure point)
The company and ERG base-cases assume that the future treatment effect could be extrapolated by
independently fitted parametric models over the patient’s remaining life. This extrapolation led to an
increasing treatment effect in the long-term, as can be seen in Figure 5.14 in this report. Given a lack
of robust long-term evidence for this assumption, alternative scenarios were tested. Scenarios were run
to assume that the treatment effect for PFS, OS and both curves together steadily declines between the
end of current follow up (median follow up 30 months) and 10 years (120 months).
7.1.3.4 Scenario set 4: changing HRQoL and costs assumptions for long-term survivors
The company base-case assumed that those patients who remained in PFS for two years would have
HRQoL and costs equivalent to the general population, based on a finding of no statistically significant
difference in mortality between DLBCL patients who were event free at two years and the general
population. 4 However a more recent study suggested that excess mortality remained until five years.6
In their clarification response, the company found limited evidence from the literature on a lack of
statistically significant difference in HRQoL.7 However, additional literature evidence provided by the
company in their clarification response suggested that a longer period was required, suggesting that
after three years HRQoL could be suggested to be equivalent to that of the age- and gender-matched
general population. Therefore, in the ERG base-case three years in PFS was assumed for the assumption
of equivalence in both costs and HRQoL. In scenarios alterative time points of 2, 5 and 10 years were
tested.
7.1.3.5 Scenario set 5: alternative SMRs to model HSCT mortality
The company assumed no excess mortality for long-term DLBCL survivors compared to the age- and
sex-matched general population in their base-case. This assumption was based on a finding of no
Copyright 2019 Queen's Printer and Controller of HMSO. All rights reserved

CONFIDENTIAL UNTIL PUBLISHED
121
statistically significant difference in mortality between DLBCL patients who were event free at two
years and the general population (SMR=1.09 (95% CI (0.69, 1.74)). 4 However a more recent study
suggested that excess mortality remained until five years (SMR=1.41 95% CI (1.35, 1.48)), with
DLBCL survivors having a higher risk of non-cancer death that the general population.6, 7 The company
included the SMR of 1.09 in a scenario analysis. The ERG selected the SMR of 1.41 for their base-case
and tested SMRs of 1, 1.09 and 1.18 (cited in the Maurer paper4) in scenario analyses.
7.1.3.6 Scenario set 6: utilities
In this set of scenarios, the ERG tested the impact of utilising different sources of utility values
identified by the company, including those values from TA567 and TA306. 5, 13
7.1.3.7 Scenario set 7: costs and resource use
A set of scenarios analyses is performed to test, first, the impact of the future availability of a 30 mg
vial for Pola alongside the 140 mg vial with no vial sharing, and, second, the impact of arrangements
with NHS compounding services for correct patient-specific dosing (which are planned for the time
period during which only the 140 mg vials are available) to minimize wastage. The latter scenario is
tested by assuming a 100 % vial sharing scenario for Pola.
7.2 Impact on the ICER of additional clinical and economic analyses undertaken by the ERG
7.2.1 Results of the ERG preferred base-case scenario
The results of the ERG preferred base-case are provided in Table 7.4. The ERG base-case resulted in a
deterministic ICER of £67,499, approximately 2.5 times larger than the company’s original base-case
ICER of £26,877.
Table 7.4: ERG base-case deterministic results (discounted)
Technologies Total costs
(£)
Total
LYGs
Total
QALYs
Incr.
costs (£)
Incr.
LYGs
Incr.
QALYs
ICER versus
baseline
(£/QALY)
Pola+BR ********* **** **** ******* **** **** £67,499
BR £19,904 1.00 0.68
BR = bendamustine + rituximab; ERG = Evidence Review Group; ICER = incremental cost-effectiveness ratio,
Incr. = incremental, LYGs = life years gained, pola = polatuzumab, QALY = quality-adjusted life year
As shown in Table 7.5, for both treatments, approximately 2/3 of the QALYs were generated in the
progression free survival state. QALYs gained in each state and in total were substantially higher for
Pola+BR compared to BR, resulting in incremental QALYs of *****.
Table 7.5: ERG base-case disaggregated discounted QALYs
QALYs gained Pola+BR BR Incremental
PFS ***** 0.422 *****
PD ***** 0.267 *****
Total QALYs ***** 0.676 *****
Source: electronic model, updated from the response to the clarification letter.2
BR = bendamustine + rituximab; ERG = Evidence Review Group; PD = progressed disaease; PFS =
progression free survival; pola = polatuzumab; QALY = quality-adjusted life year
Copyright 2019 Queen's Printer and Controller of HMSO. All rights reserved

CONFIDENTIAL UNTIL PUBLISHED
122
Polatuzumab was the largest cost element in the model and is responsible for ******* of the *******
incremental total cost, as displayed in Table 7.6. The next largest source of differences between the
costs of the two treatments arms is supportive care costs in progressive disease, which are *******
higher in the polatuzumab arm.
Table 7.6: ERG base-case disaggregated costs
Costs per health state Pola+BR BR Incremental
PFS State
Polatuzumab ******* £0 *******
Bendamustine £455 £321 £134
Rituximab £2,796 £1,946 £850
Drug administration £3,516 £2,250 £1,266
AE management £855 £718 £137
Supportive care £10,223 £4,523 £5,700
Productivity loss £0 £0 £0
Travel £0 £0 £0
Informal care £0 £0 £0
Total PFS cost ******* £9,757 *******
PD State
Supportive care ******* £10,146 ******
Productivity loss £0 ££0 £0
Travel £0 £0 £0
Informal care £0 £0 £0
Total PD cost ****** £10,146 *******
End of life cost £0 £0 £0
Total cost ******** £19,904 *******
Based on electronic model, updated from the response to the clarification letter.2
AE = adverse event; BR = bendamustine + rituximab; ERG = Evidence Review Group; PD = progressed
disaease; PFS = progression free state; pola = polatuzumab
The ERG also conducted a PSA using their preferred base-case assumptions. Results displayed in Table
7.7 show that the probabilistic ICER is £68,619, slightly higher than the base-case ICER of £67,499.
Table 7.7: ERG base-case probabilistic results (discounted)
Technologies Total costs
(£)
Total
LYGs
Total
QALYs
Incr.
costs (£)
Incr.
LYGs
Incr.
QALYs
ICER
versus
baseline
(£/QALY)
Pola+BR ******** ***** ***** ******* ***** ***** £68,619
BR £23,628 1.165 0.782
BR = bendamustine + rituximab; ERG = Evidence Review Group; ICER = incremental cost-effectiveness ratio;
Incr. = incremental; LYGs = life years gained; pola = polatuzumab; QALY = quality-adjusted life year
The incremental costs and QALYs resulting from each of the 1,000 simulations of the ERG PSA are
plotted on the cost effectiveness plane displayed in Figure 7.1. The vast majority of the simulations fell
Copyright 2019 Queen's Printer and Controller of HMSO. All rights reserved

CONFIDENTIAL UNTIL PUBLISHED
123
into the north-east quadrant of the CE-plane. The CEAC in Figure 7.2 shows that at WTP thresholds of
£20,000 and £30,000, the probability that polatuzumab is cost effective is 0%.
Copyright 2019 Queen's Printer and Controller of HMSO. All rights reserved

CONFIDENTIAL UNTIL PUBLISHED
124
Figure 7.1: ERG preferred cost effectiveness plane
Based on electronic model
BR = bendamustine + rituximab; ERG = Evidence Review Group; Inc. = incremental; pola = polatuzumab;
QALY = quality-adjusted life year
Figure 7.2: ERG preferred cost effectiveness acceptability curve
Based on electronic model
BR = bendamustine + rituximab; ERG = Evidence Review Group; pola = polatuzumab; WTP = willingness-to-
pay
Copyright 2019 Queen's Printer and Controller of HMSO. All rights reserved

CONFIDENTIAL UNTIL PUBLISHED
125
7.2.2 Results of the ERG additional exploratory scenario analyses
7.2.2.1 Additional scenario 1: changing PFS parametric distributions
Alternative scenarios surrounding the extrapolation of PFS were explored by the ERG, with results
displayed in Table 7.8. In the CS the company utilised a cure mixture generalised gamma model for
PFS, which led to the lowest ICER of those tested by the ERG (£53,088). Given the uncertainty
surrounding the cure assumption, discussed in section 5.2.6, the ERG preferred the use of independent
parametric distributions, with the independent log-normal being chosen for the base case. The two most
plausible alternative independent parametric model extrapolations for PFS (the log-logistic and log-
normal) gave similar ICERs of £65,920 and £67,499 respectively.
Table 7.8: ERG PFS scenario analyses
PFS distribution Pola+BR BR Incr.
Costs
(£)
Incr.
QALYs
ICER
(£) Costs
(£)
QALYs Costs
(£)
QALY
s
Cure-mixture
generalised
gamma (CS)
********
*
**** £19,291 0.68 ******* **** £53,088
Independent log-
logistic model
******** **** £19,344 0.68 ******* **** £65,920
Independent
generalised
gamma model
********
*
**** £19,247 0.68 ******* **** £53,925
Independent log-
normal model
(ERG)
******** ***** £19,904 0.676 ******* ***** £67,499
BR = bendamustine + rituximab; CS = company submission; ERG = Evidence Review Group; ICER =
incremental cost-effectiveness ratio; Incr. = incremental; PFS = progression free survival; pola = polatuzumab;
QALY = quality-adjusted life year
7.2.2.2 Additional scenario 2: changing OS parametric distributions
The company also utilised the generalised gamma cure mixture model in their base-case for OS
extrapolation. As shown in Table 7.9, this gave the lowest ICER of the alternatives tested by the ERG
(£63,867). Again, given the ERG’s uncertainty surrounding the cure assumption, they tested alternative
non-cure models. The two most plausible independent extrapolations for OS were the log-normal and
the generalised gamma, with the generalised gamma chosen for the ERG base-case. The generalised
gamma gave an ICER slightly higher than the company base-case choice, resulting in an ICER of
£67,499, while the log-normal gave a substantially higher ICER of £82,399.
Copyright 2019 Queen's Printer and Controller of HMSO. All rights reserved

CONFIDENTIAL UNTIL PUBLISHED
126
Table 7.9: ERG OS scenario analyses
OS scenario Pola+BR BR Incr.
Costs
(£)
Incr.
QALY
s
ICER
(£) Costs
(£)
QALY
s
Costs
(£)
QALY
s
Cure mixture
generalised gamma
(CS)
*******
*
***** £19,462 0.660 *******
*
***** £63,867
Independent log-
normal model
*******
*
***** £19,185 0.651 ******* ***** £82,399
Independent log-
logistic model
*******
**
**** £19,846 0.67 ******* **** £81,843
Independent
generalised gamma
model (ERG)
*******
*
***** £19,904 0.676 ******* ***** £67,499
Source: electronic model, updated from the response to the clarification letter.2
BR = bendamustine + rituximab; CS = company submission; ERG = Evidence Review Group; ICER =
incremental cost-effectiveness ratio; Incr. = incremental; OS = overall survival; pola = polatuzumab; QALY =
quality-adjusted life year
7.2.2.3 Additional scenario 3: treatment effect assumptions
Given the ERGs uncertainty surrounding the maintenance of the long-term treatment effect, assumed
in both the company and ERG base-cases, scenarios were tested, examining the impact of steadily
declining treatments effects from 30 months to zero at 120 months for OS, PSF and both curves together.
As shown in Table 7.10, reducing the treatment effect for PFS had little impact on the ICER, however
reducing the treatment effect for OS substantially increased the ICER from £67,499 to £78,312, and
reducing the treatment effect on both curves simultaneously increased the ICER further to £81,245,
with most impact coming from OS. Therefore assumptions surrounding the long-term treatment effect
on survival is an important element in the cost-effectiveness of polatuzumab.
Table 7.10: ERG treatment effect scenario analyses
Treatment
effect
Pola+BR BR Incr.
Costs
(£)
Incr.
QALYs
ICER
(£) Costs
(£)
QALYs Costs
(£)
QAL
Ys
Treatment effect
maintained (CS
and ERG BC)
******** **** £19,904 0.68 ******* **** £67,499
Declining OS
treatment effect
duration
******** **** £19,904 0.68 ******* **** £78,312
Declining PFS
treatment effect
duration
******** **** £19,904 0.68 *******
*
**** £69,711
Copyright 2019 Queen's Printer and Controller of HMSO. All rights reserved

CONFIDENTIAL UNTIL PUBLISHED
127
Treatment
effect
Pola+BR BR Incr.
Costs
(£)
Incr.
QALYs
ICER
(£) Costs
(£)
QALYs Costs
(£)
QAL
Ys
Declining OS
and PFS
treatment effect
duration
******** **** £19,904 0.68 ******* **** £81,245
Source: electronic model, updated from the response to the clarification letter.2
BC = base case; BR = bendamustine + rituximab; CS = company submission; ERG = Evidence Review Group;
ICER = incremental cost effectiveness ratio; Incr. = incremental; OS = overall survival; PFS = progression free
survival; pola = polatuzumab; QALY = quality-adjusted life year
7.2.2.4 Additional scenario 4: changing long-term survivor assumptions
The company base-case assumed that the costs and HRQoL of long-term survivors were equivalent to
those of the general population after two years. However the ERG were concerned that evidence from
the literature suggested that, while costs and HRQoL did converge over time, this two-year time point
was overly optimistic. Therefore, in the ERG base-case three years was chosen given evidence 8 cited
by the company in their clarification response. The ERG also tested scenarios of five years (based on
Howlader et al (2017) 6 and 10 years. As seen in Table 7.11, longer time periods gradually increased
the ICER, however the impact was fairly small, with the change from two to three years being less than
£1,500 and the change from two to 10 years being less than £4,500.
Table 7.11: ERG long-term survivor scenario analyses
Time HRQoL
and costs =
gen pop
Pola+BR BR Incr.
Costs
(£)
Incr.
QALYs
ICER
(£) Costs
(£)
QALYs Costs
(£)
QAL
Ys
2 (Company
BC)
******** **** £19,625 0.68 ******* **** £66,151
3 (ERG BC) ******** **** £19,904 0.68 ******* **** £67,499
5 (Howlader) ******** **** £20,115 0.67 ******* **** £69,068
10 ******** **** £20,231 0.67 *******
*
**** £70,523
Based on electronic model, updated from the response to the clarification letter.2
BC = base case; BR = bendamustine + rituximab; CS = company submission; ERG = Evidence Review Group;
HRQoL = health related quality of life; ICER = incremental cost effectiveness ratio; Incr. = incremental; pola
= polatuzumab; QALY = quality-adjusted life year
7.2.2.5 Additional scenario 5: changing excess mortality compared to general population
In the company base-case it was assumed that long-term survivors experienced no excess mortality as
compared to the general population. This assumption was based on a lack of significant difference found
in Maurer et al (2014).4 In this paper the mean estimate was an SMR=1.09, with an alternative mean
estimate of SMR=1.18 in a sample of French patients also cited. The ERG identified an alternative
estimate of 1.41 from Howlader et al (2017) 6. Therefore assumptions of SMRs of 1, 1.09, 1.18 and
1.41 were tested, with results displayed in Table 7.12. Again the ICER steadily increased with the larger
Copyright 2019 Queen's Printer and Controller of HMSO. All rights reserved
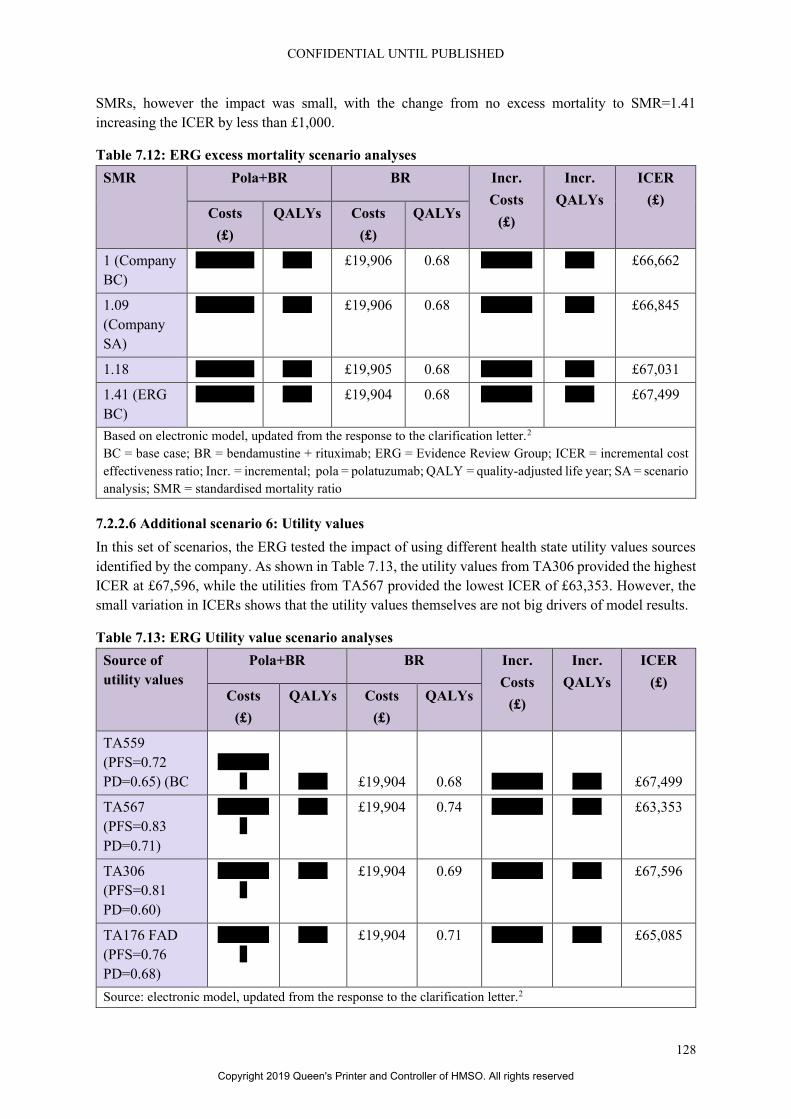
CONFIDENTIAL UNTIL PUBLISHED
128
SMRs, however the impact was small, with the change from no excess mortality to SMR=1.41
increasing the ICER by less than £1,000.
Table 7.12: ERG excess mortality scenario analyses
SMR Pola+BR BR Incr.
Costs
(£)
Incr.
QALYs
ICER
(£) Costs
(£)
QALYs Costs
(£)
QALYs
1 (Company
BC)
******** **** £19,906 0.68 ******* **** £66,662
1.09
(Company
SA)
******** **** £19,906 0.68 ******* **** £66,845
1.18 ******** **** £19,905 0.68 ******* **** £67,031
1.41 (ERG
BC)
******** **** £19,904 0.68 ******* **** £67,499
Based on electronic model, updated from the response to the clarification letter.2
BC = base case; BR = bendamustine + rituximab; ERG = Evidence Review Group; ICER = incremental cost
effectiveness ratio; Incr. = incremental; pola = polatuzumab; QALY = quality-adjusted life year; SA = scenario
analysis; SMR = standardised mortality ratio
7.2.2.6 Additional scenario 6: Utility values
In this set of scenarios, the ERG tested the impact of using different health state utility values sources
identified by the company. As shown in Table 7.13, the utility values from TA306 provided the highest
ICER at £67,596, while the utilities from TA567 provided the lowest ICER of £63,353. However, the
small variation in ICERs shows that the utility values themselves are not big drivers of model results.
Table 7.13: ERG Utility value scenario analyses
Source of
utility values
Pola+BR BR Incr.
Costs
(£)
Incr.
QALYs
ICER
(£) Costs
(£)
QALYs Costs
(£)
QALYs
TA559
(PFS=0.72
PD=0.65) (BC
*******
* **** £19,904 0.68 ******* **** £67,499
TA567
(PFS=0.83
PD=0.71)
*******
*
**** £19,904 0.74 ******* **** £63,353
TA306
(PFS=0.81
PD=0.60)
*******
*
**** £19,904 0.69 ******* **** £67,596
TA176 FAD
(PFS=0.76
PD=0.68)
*******
*
**** £19,904 0.71 ******* **** £65,085
Source: electronic model, updated from the response to the clarification letter.2
Copyright 2019 Queen's Printer and Controller of HMSO. All rights reserved

CONFIDENTIAL UNTIL PUBLISHED
129
Source of
utility values
Pola+BR BR Incr.
Costs
(£)
Incr.
QALYs
ICER
(£) Costs
(£)
QALYs Costs
(£)
QALYs
BC = base case; BR = bendamustine + rituximab; ERG = Evidence Review Group; FAD = final appraisal
determination; ICER = incremental cost effectiveness ratio; Incr. = incremental; PD = progressed disease; PFS
= progression free survival; pola = polatuzumab; QALY = quality-adjusted life year
7.2.2.7 Additional scenario 7: Cost and resource use
Table 7.14 shows the results of a scenario to assess the impact of the future availability of a 30 mg vial
for polatuzumab vedotin alongside the 140 mg vial with no vial sharing, and a scenario to assess the
impact of arrangements with NHS compounding services for correct patient-specific dosing to minimize
wastage. Assuming the availability of 30mg vials decreased the ICER to £53,910, a substantial decrease
of £13,500. Assuming individual dosing arrangements to minimise waste also substantially lowered the
ICER by approximately £15,000 to £51,574. These scenarios reflect the importance of wastage for the
cost-effectiveness of polatuzumab.
Table 7.14: ERG Cost scenario analyses
Cost scenario Pola + BR BR Incr.
Costs
(£)
Incr.
QALYs
ICER
(£)
Costs
(£)
QALYs Costs
(£)
QALYs
140mg vial only and
no vial sharing (ERG
BC)
******** **** £19,904 0.68 ******* **** £67,499
140 mg and 30 mg
vial sizes for
polatuzumab vedotin
available (CS BC)
******* **** £19,904 0.68 ******* **** £53,910
No wastage / 100%
vial sharing for
polatuzumab vedotin
******* **** £19,904 0.68 ******* **** £51,574
Based on electronic model, updated from the response to the clarification letter.2
BC = base case; BR = bendamustine + rituximab; CS = company submission; ERG = Evidence Review Group;
ICER = incremental cost effectiveness ratio; Incr. = incremental; pola = polatuzumab; QALY = quality-adjusted
life year; SA = scenario analysis; SMR = standardised mortality ratio
7.3 ERG’s preferred assumptions
The ERG preferred changes to the updated company base-case were described in Section 7.1.2 of this
report. The cost effectiveness results of the ERG preferred base-case are presented in Table 7.15 in
thirteen steps. In each step, the cumulative impact on the model results is shown. The following steps
had the largest impact on the ICER: step 4 (following a cohort approach in modelling background
mortality), step 6 (changing the OS and PFS extrapolation from cure mixture to the more plausible
standard, independent parametric distributions) and step 9 (changing the available vial size to 140 mg
only, as it is the only available vial option currently). Steps 6 and 9 have substantial impacts on costs
Copyright 2019 Queen's Printer and Controller of HMSO. All rights reserved

CONFIDENTIAL UNTIL PUBLISHED
130
whereas step 3 has an impact on both costs and QALYs, as it led to shorter life expectancy in both
Pola+BR and BR arms.
Copyright 2019 Queen's Printer and Controller of HMSO. All rights reserved

131
Table 7.15: ERG’s preferred model assumptions
Preferred assumption Section in
ERG report
Pola + BR BR Inc.
Costs (£)
Inc.
QAL
Ys
Cumulative
ICER (£/QALY) Total
Costs (£)
Total
QALYs
Total
Costs (£)
Total
QALY
s
Company base-case 6.1 ******* **** £18,019 0.68 ******* **** £26,877
Company updated base-case (after clarification) 7.1.1 ******* **** £17,440 0.67 ******* **** £25,307
ERG changes (1 –3): Fixing the errors 7.1.2.1 ******* **** £17,440 0.67 ******* **** £25,307
ERG changes (1-3)+4: Following a cohort
approach in background mortality
7.1.2.2 ******** **** £17,249 0.64 ******* **** £35,787
ERG changes (1-4)+5: Logical constraint on OS
(OS from the extrapolation can be at maximum
equal to the OS estimated from the age/sex
adjusted general population with excess
mortality)
7.1.2.2 ******* **** £17,249 0.64 ******* **** £35,787
ERG changes (1-5) +6: Changing the OS and
PFS extrapolation from cure-mixture models to
standard independently fitted parametric models
(using IRC PFS data)
7.1.2.3 ******* **** £17,386 0.68 ******* **** £50,451
ERG changes (1-6) +7: Changing the excess
mortality for non-cancer related deaths from 1.0
to the literature-based value of 1.41
7.1.2.3 ******* **** £17,379 0.68 ******* **** £50,447
ERG changes (1-7) +8: HRQoL and cost
assumption for long-term survivors in PFS (time
threshold from 2 years to 3 years)
7.1.2.3 ******* **** £17,658 0.68 ******* **** £51,698
Copyright 2019 Queen's Printer and Controller of HMSO. All rights reserved
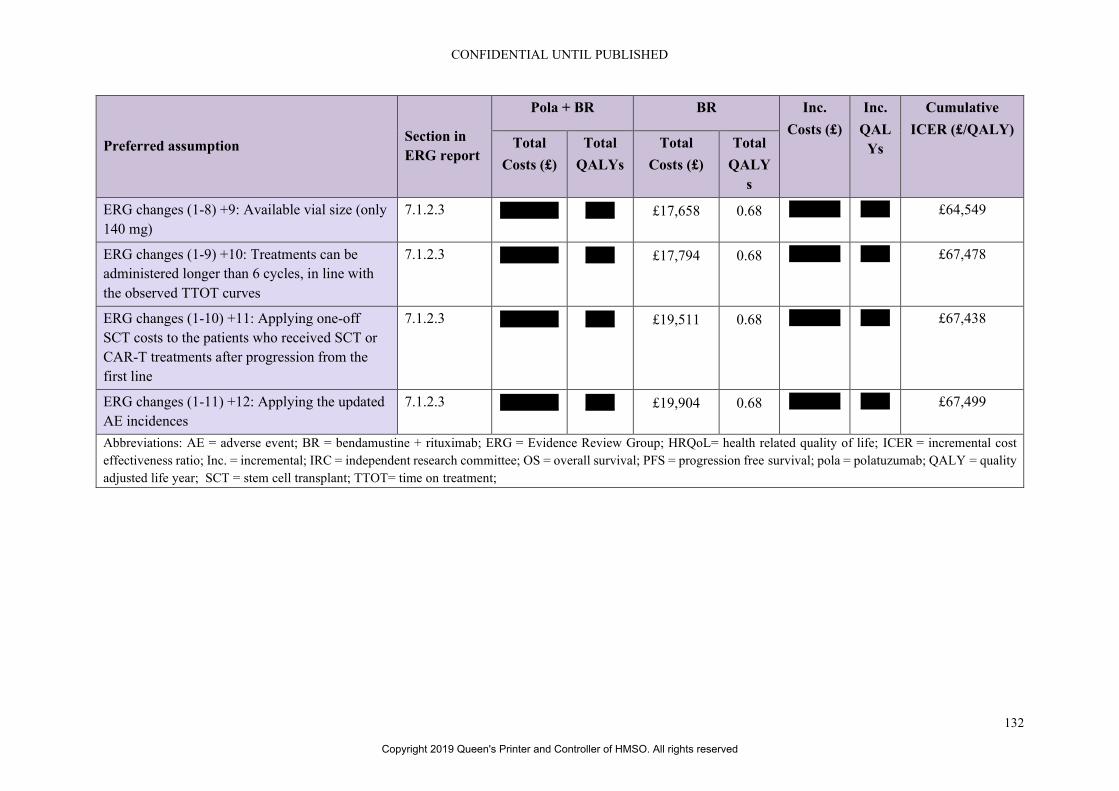
CONFIDENTIAL UNTIL PUBLISHED
132
Preferred assumption Section in
ERG report
Pola + BR BR Inc.
Costs (£)
Inc.
QAL
Ys
Cumulative
ICER (£/QALY) Total
Costs (£)
Total
QALYs
Total
Costs (£)
Total
QALY
s
ERG changes (1-8) +9: Available vial size (only
140 mg)
7.1.2.3 ******** **** £17,658 0.68 ******* **** £64,549
ERG changes (1-9) +10: Treatments can be
administered longer than 6 cycles, in line with
the observed TTOT curves
7.1.2.3 ******** **** £17,794 0.68 ******* **** £67,478
ERG changes (1-10) +11: Applying one-off
SCT costs to the patients who received SCT or
CAR-T treatments after progression from the
first line
7.1.2.3 ******** **** £19,511 0.68 ******* **** £67,438
ERG changes (1-11) +12: Applying the updated
AE incidences
7.1.2.3 ******** **** £19,904 0.68 ******* **** £67,499
Abbreviations: AE = adverse event; BR = bendamustine + rituximab; ERG = Evidence Review Group; HRQoL= health related quality of life; ICER = incremental cost
effectiveness ratio; Inc. = incremental; IRC = independent research committee; OS = overall survival; PFS = progression free survival; pola = polatuzumab; QALY = quality
adjusted life year; SCT = stem cell transplant; TTOT= time on treatment;
Copyright 2019 Queen's Printer and Controller of HMSO. All rights reserved

133
7.4 Conclusions of the cost effectiveness section
To assess the cost-effectiveness of polatuzumab vedotin (Pola), in combination with bendamustine and
rituximab (BR), compared to BR alone, the company developed a three state partitioned survival model
that includes the following health states: progression-free, progressed disease and death. Transitions
between health states were informed by extrapolated survival curves for PFS and OS from the GO29365
trial. Patients started in the progression-free state, where they remained until progression or death. Upon
progression, patients either remained in the progressed disease state, or they died. After 2 years in the
progression-free state, patients were considered to have characteristics similar to those of the general
population. Therefore, age/sex adjusted general population utility values and zero healthcare resource
use cost values were assigned to those patients who did not progress in their first two years. Cost and
health outcomes were discounted at 3.5%.
In the progression-free state, patients received treatment according to TTOT data from GO29365.
However, also a maximum number of six treatment cycles of three weeks was applied for Pola+BR, as
well as for BR. An additional scenario was performed to assess cost-effectiveness against a different
comparator: a combination of rituximab, gemcitabine, and oxaliplatin (R-GemOx). For R-GemOx,
effectiveness was assumed to be equivalent to BR, and a maximum number of three treatment cycles of
three weeks was assumed. It is unclear to what extent these assumptions, particularly that of equivalent
effectiveness, reflect the actual comparative effectiveness in clinical practice. Therefore, the ERG are
cautious about the use of the R-GemOx comparator in this model.
The company base-case assumed cure mixture models for both OS and PFS extrapolation. Instead of
using standard cure mixture modelling codes available in statistical programs, the company developed
its own code, which was not transparent and clear enough for the ERG to assess the correctness of the
implementation of the methods in the provided code. The “cure” assumption of the company was based
on: literature from the natural history of newly diagnosed DLBCL patients, which suggested no
significant difference between the mortality of those patients event free at 2 years and the age- and sex-
matched general population; clinical expert opinion; the company’s observation of low risk of relapse
or death in the KM plots for Pola+BR towards the end of follow-up and the precedent for cure mixture
modelling accepted in previous NICE appraisals in R/R DLBCL patients.3-5 However, the ERG felt that
there was a lack of robust long-term evidence to be confident in a cure assumption, especially given the
small number of patients remaining alive and event free at the end of a relatively short follow-up period.
The ERG also note that the previous technology appraisals were for CAR-T therapies which represent
a distinct form of therapy and alternative literature suggests that excess mortality in DLBCL remains
for at least five years. 6 Additionally, the company’s base-case assumptions of cure-mixture models led
to OS and PFS hazard ratios, which were not in line with the empirical hazard plots for OS and PFS
from the GO29365 trial and which conferred an overly optimistic treatment benefit, even decades after
the treatment is received. Therefore, the ERG explored alternative independent standard parametric
survival extrapolation models in their base-case and scenario analyses, and also a logical constraint is
enforced, which ensures that the OS extrapolation from the trial provides a lower survival estimate from
the age/sex adjusted general population at any given point time.
The ERG considered the company’s assumption of no excess mortality in DLBCL long-term survivors
compared to the general population to be overly optimistic. This assumption was based on a US study
by Maurer et al (2014) which found no statistically significant difference between the mortality of newly
diagnosed DLBCL who survived event free to two years and the age- and gender-matched general
population.4 However a more recent study based on a substantially larger sample of DLBCL patients
suggests that excess mortality remains up to five years and that overall, DLBCL survivors are at excess
Copyright 2019 Queen's Printer and Controller of HMSO. All rights reserved

CONFIDENTIAL UNTIL PUBLISHED
134
risk of mortality due to non-cancer causes as well as the risk of late relapse. 6 Therefore this excess
mortality due to non-cancer causes was incorporated into the ERG base-case.
Another important issue was the way the non-cancer background mortality was included in the model.
In contrast to the cohort-based approach followed for modelling the cancer-related progression and
death events, the company followed an individual patient-level approach while modelling the non-
cancer, background mortality risks. The economic model calculates the weighted mortality risk from
the individual age- and sex-matched specific mortality risks from a cohort of 160 patients (50%-50%
male-female, characterizing the age distribution of the GO29365 trial). This created an inconsistency,
as the relatively younger patients’ lifetable based survival estimates are taken into the weighted average,
hence leading to instances where a significant proportion is still alive after 40 or 50 years, which is not
realistic from a cohort modelling perspective, as the average age of the cohort was 69. Therefore, the
ERG switched to cohort based modelling for non-cancer background mortality risks, as well.
Additional important sources of uncertainty in the model are the assumptions made regarding the
HRQoL and costs of long-term survivors. In the company submission, the argument of a lack of
statistically significant excess mortality at two years, was extended to argue that the HRQoL of DLBCL
patients would be equivalent to that of the age- and sex-matched general population after two years in
the PFS state. When the ERG requested evidence specific to HRQoL, the company provided two
literature reviews which provided some support for equivalence in HRQoL in long term survivors.7
However, one of these explicitly specified that HRQoL between these two groups was more comparable
after three years. 8 Given the parallel uncertainty regarding the assumption of equivalent healthcare
costs after two years, which have been previously noted in TA559, in the ERG base-case the assumption
of two years was extended to three years for both HRQoL and costs to provide a more conservative
estimate.
AEs were incorporated for Pola+BR and BR based on incidences from GO29365, and for R-GemOx
based on findings from the study by Mournier et al., 2013. 9 The ERG identified several inconsistencies
between the AE incidences used in the model and the incidences presented in clinical effectiveness
section of this ERG report for the GO29365 trial, in terms of the number of serious AEs reported in
each treatment arm. Therefore the ERG updated the model incidences to reflect the incidences for the
most frequently reported Grade 3-5 adverse events (>5%).
In response to a lack of HRQoL data collection in the GO29365 trial, the company conducted a thorough
literature search for relevant health state utility values. The base-case utility values, estimated from the
safety management population of the ZUMA-1 trial using the EQ-5D-5L were based on a small sample
(34 patients provided 87 observations) of mixed histology lymphoma patients. The progressed disease
value in particular was based on a very small sample as it was estimated from only five observations.
The patient characteristics of the members of the ZUMA-1 trial who provided HRQoL data were not
available and therefore it is unclear how similar this group were to the GO29365 population or the R/R
DLBCL patients who would be expected to receive polatuzumab in clinical practice. However, despite
these limitations the ERG agree that none of the alternative utility sources identified provided a better
alternative when considering the alignment with the NICE reference case and therefore this source of
utility values were retained in the ERG base-case. Disutilities for those AEs included in the model were
appropriately sourced from previous appraisals in R/R DLBCL.
The economic analysis was performed from the NHS and PSS perspective and included state-specific
costs for drug acquisition and administration, treatment-related AEs, routine supportive care
(professional and social services, health care professionals and hospital resource use, treatment follow-
up; for a maximum of two years), and subsequent treatment costs. Healthcare unit costs were obtained
Copyright 2019 Queen's Printer and Controller of HMSO. All rights reserved

CONFIDENTIAL UNTIL PUBLISHED
135
from the National Audit Office 200810, Personal Social Services Research Unit (PSSRU) 201811, and
NHS reference costs.12 The frequencies of healthcare resource use were primarily sourced from
TA306.13 Drug costs were taken from the British National Formulary (BNF) and electronic Market
Information Tool (eMIT) databases. The dose information was derived from the GO29365 trial,
whereas for the R-GemOx, it was obtained from Mounier et al.9 Administration and adverse event costs
were mostly obtained from NHS reference costs and percentage of the treatments used in the subsequent
treatments were from the GO29365 trial and clinical expert opinion.
The ERG was also concerned with several assumptions made in the company base-case regarding costs
and resource use. Polatuzumab is currently only available in 140 mg vials. However, in the company
base-case the company also included 30 mg vials, stating that they plan to provide these from
*********. However, given that this statement is subject to uncertainty and no formal agreement is in
place, the ERG feel that the base-case should conservatively assume that the current situation will
remain. The ERG also felt that the costing of a maximum of six cycles of Pola+BR and BR, contrary to
the included TTOT data from the trial was incorrect. Since the treatment effectiveness from the trial is
based on the application of the treatment longer than six cycles, not including the costs of these
treatments beyond cycle six would create a bias. In the ERG base-case these treatments were costed
according to the TTOT data provided. The company also excluded the costs of SCT and CAR-T, despite
these having been received by trial participants. The ERG feels that this was inappropriate and therefore
attempted to include these costs in the ERG base-case. CAR-Ts are currently available of the NHS only
under confidential PAS and therefore the cost of SCT was utilised for both treatments.
Alongside their clarification response the company submitted an updated model using data from the
latest data cut-off point of the clinical trial, corrected utility values for the proximity to death scenario,
corrected administration costs for R-GemOx and corrected AE incidences for R-GemOx. This resulted
in an updated company base-case ICER of £25,307.
Following this, the ERG fixed several errors identified in the models PSA and corrected the calculation
of general population mortality to follow the standard cohort approach. The ERG also replaced the
mixture-cure model survival curves with appropriate parametric distributions, updated the estimate of
excess mortality from an SMR of 1 to 1.41 to reflect the increased risk of death from non-cancer causes
in DLBCL survivors, updated the time point at which the costs and HRQoL of long term survivors were
assumed to be equivalent to the general population from two to three years, allowed only 140 mg vials
and utilised the provided TTOT data in the calculation of treatment costs for polatuzumab and included
the costs of subsequent SCT and CAR-T therapies (both costed using the price of SCT). This resulted
in an ERG base-case of £67,499, approximately 2.5 times the size of the company base-case ICER. The
ERG PSA results provided an ICER of £68,619, with the vast majority of simulations falling in the
north-east quadrant of the CE plane. The CEAC showed that the probability that polatuzumab is cost
effective at WTP thresholds of £20,000 and £30,000 is 0%.
The ERG scenario analyses which had the biggest impact on the ICER were those assumptions
surrounding survival extrapolation, treatment effect duration, vial sharing and available vial sizes. The
remaining scenarios did not have a substantial impact on the ICER.
Copyright 2019 Queen's Printer and Controller of HMSO. All rights reserved
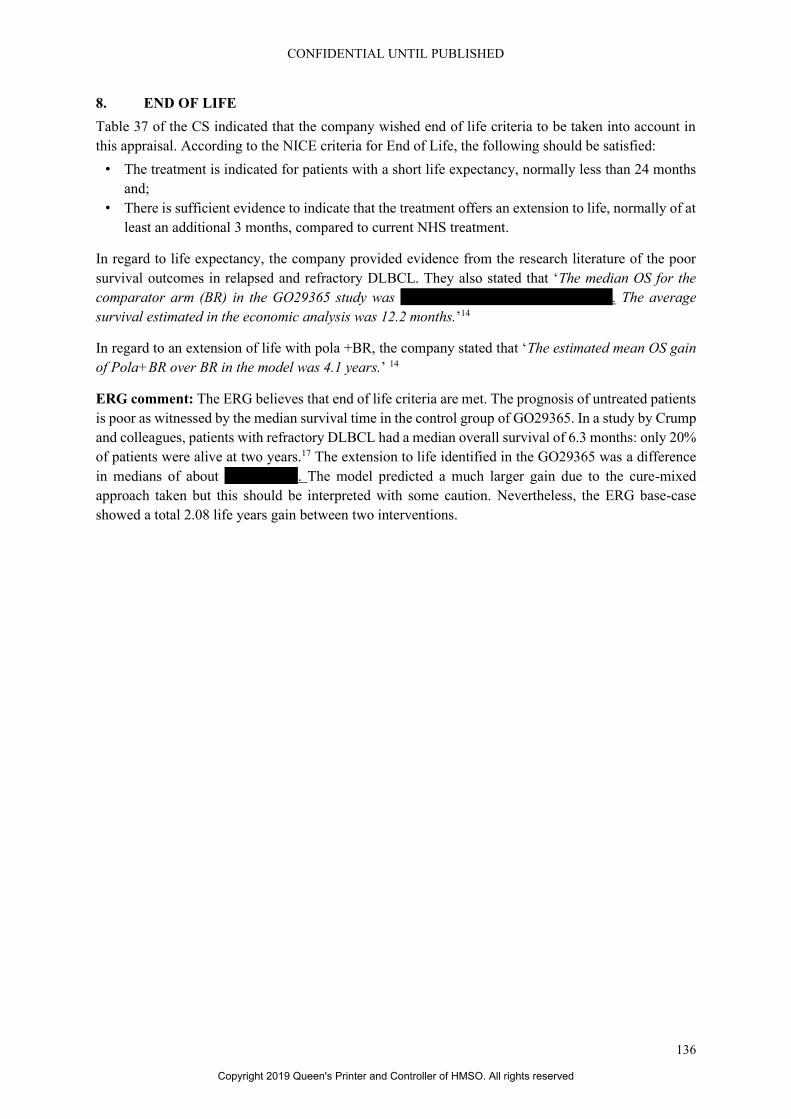
CONFIDENTIAL UNTIL PUBLISHED
136
8. END OF LIFE
Table 37 of the CS indicated that the company wished end of life criteria to be taken into account in
this appraisal. According to the NICE criteria for End of Life, the following should be satisfied:
• The treatment is indicated for patients with a short life expectancy, normally less than 24 months
and;
• There is sufficient evidence to indicate that the treatment offers an extension to life, normally of at
least an additional 3 months, compared to current NHS treatment.
In regard to life expectancy, the company provided evidence from the research literature of the poor
survival outcomes in relapsed and refractory DLBCL. They also stated that ‘The median OS for the
comparator arm (BR) in the GO29365 study was *****************************. The average
survival estimated in the economic analysis was 12.2 months.’14
In regard to an extension of life with pola +BR, the company stated that ‘The estimated mean OS gain
of Pola+BR over BR in the model was 4.1 years.’ 14
ERG comment: The ERG believes that end of life criteria are met. The prognosis of untreated patients
is poor as witnessed by the median survival time in the control group of GO29365. In a study by Crump
and colleagues, patients with refractory DLBCL had a median overall survival of 6.3 months: only 20%
of patients were alive at two years.17 The extension to life identified in the GO29365 was a difference
in medians of about **********. The model predicted a much larger gain due to the cure-mixed
approach taken but this should be interpreted with some caution. Nevertheless, the ERG base-case
showed a total 2.08 life years gain between two interventions.
Copyright 2019 Queen's Printer and Controller of HMSO. All rights reserved

CONFIDENTIAL UNTIL PUBLISHED
137
9. REFERENCES
[1] Eyre TA, Linton KM, Rohman P, Kothari J, Cwynarski K, Ardeshna K, et al. Results of a multicentre
UK-wide retrospective study evaluating the efficacy of pixantrone in relapsed, refractory diffuse large
B cell lymphoma. Br J Haematol 2016;173(6):896-904.
[2] Roche Products Ltd. Polatuzumab vedotin with rituximab and bendamustine for treating relapsed
or refractory diffuse large B-cell lymphoma [ID1576]: Response to request for clarification from the
ERG: Roche, 2019
[3] National Institute for Health and Care Excellence. Tisagenlecleucel for treating relapsed or
refractory diffuse large B-cell lymphoma after 2 or more systemic therapies [TA567]: NICE, 2019. 25p.
Available from: https://www.nice.org.uk/guidance/ta567
[4] Maurer MJ, Ghesquieres H, Jais JP, Witzig TE, Haioun C, Thompson CA, et al. Event-free survival
at 24 months is a robust end point for disease-related outcome in diffuse large B-cell lymphoma treated
with immunochemotherapy. J Clin Oncol 2014;32(10):1066-73.
[5] National Institute for Health and Care Excellence. Axicabtagene ciloleucel for treating diffuse large
B-cell lymphoma and primary mediastinal large B-cell lymphoma after 2 or more systemic therapies
[TA559]: NICE, 2019. 31p. Available from: https://www.nice.org.uk/guidance/ta559
[6] Howlader N, Mariotto AB, Besson C, Suneja G, Robien K, Younes N, et al. Cancer-specific
mortality, cure fraction, and noncancer causes of death among diffuse large B-cell lymphoma patients
in the immunochemotherapy era. Cancer 2017;123(17):3326-3334.
[7] Cubi-Molla P, Mott D, Shah K, Herdman M, Summers Y, Devlin N. Quality of life in long-term
cancer survivors: Implications for future health technology assessments in oncology. Consulting
Report. London: Office of Health Economics, 2018 Available from:
https://www.ohe.org/publications/quality-life-long-term-cancer-survivorsimplications-future-health-
technology
[8] Lin VW, Blaylock B, Epstein J, Purdum A. Systematic literature review of health-related quality of
life among aggressive non-Hodgkin lymphoma survivors. Curr Med Res Opin 2018;34(8):1529-1535.
[9] Mounier N, El Gnaoui T, Tilly H, Canioni D, Sebban C, Casasnovas RO, et al. Rituximab plus
gemcitabine and oxaliplatin in patients with refractory/relapsed diffuse large B-cell lymphoma who are
not candidates for high-dose therapy. A phase II Lymphoma Study Association trial. Haematologica
2013;98(11):1726-31.
[10] National Audit Office. End of life care. London, 2008. 64p.
[11] Curtis L, Burns A. Unit Costs of Health and Social Care 2018. Canterbury: Personal Social
Services Research Unit, University of Kent, 2018 Available from:
https://doi.org/10.22024/UniKent/01.02.70995
Copyright 2019 Queen's Printer and Controller of HMSO. All rights reserved

CONFIDENTIAL UNTIL PUBLISHED
138
[12] NHS Improvement. Reference costs 2017/18 highlights, analysis and introduction to the data.
London: NHS Improvement, 2018. 16p. Available from: ????
[13] National Institute for Health and Care Excellence. Pixantrone monotherapy for treating muliply
relapsed or refractory aggressive non-Hodgkin's B-cell lymphoma [TA306]: NICE, 2014. 57p.
Available from: https://www.nice.org.uk/guidance/ta306
[14] Roche Products Ltd. Polatuzumab vedotin with rituximab and bendamustine for treating relapsed
or refractory diffuse large B-cell lymphoma [ID1576]: Document B: submission to National Institute
of Health and Care Excellence. Single technology appraisal (STA): Roche Products Ltd, 2019. 144p.
[15] Cancer Research UK. High Grade NHL [Internet]. 2019. Available from:
https://www.cancerresearchuk.org/about-cancer/non-hodgkin-lymphoma/types/high-grade
[16] Smith A, Crouch S, Howell D, Burton C, Patmore R, Roman E. Impact of age and socioeconomic
status on treatment and survival from aggressive lymphoma: a UK population-based study of diffuse
large B-cell lymphoma. Cancer Epidemiol 2015;39(6):1103-12.
[17] Crump M, Neelapu SS, Farooq U, Van Den Neste E, Kuruvilla J, Westin J, et al. Outcomes in
refractory diffuse large B-cell lymphoma: results from the international SCHOLAR-1 study. Blood
2017;130(16):1800-1808.
[18] Alawi EM, Mathiak KA, Panse J, Mathiak K, Duregger C. Health-related quality of life in patients
with indolent and aggressive non-Hodgkin lymphoma. Cogent Psychology 2016;3(1).
[19] Lobb EA, Joske D, Butow P, Kristjanson LJ, Cannell P, Cull G, et al. When the safety net of
treatment has been removed: patients' unmet needs at the completion of treatment for haematological
malignancies. Patient Educ Couns 2009;77(1):103-8.
[20] Huntington SF, Keshishian A, Xie L, Baser O, McGuire M. Evaluating the economic burden and
health care utilization following first-line therapy for diffuse large B-cell lymphoma patients in the US
medicare population. Blood 2016;128(22):3574-3574.
[21] National Institute for Health and Care Excellence. Non-Hodgkin’s lymphoma: diagnosis and
management (NG52): NICE, 2016. 25p. Available from: https://www.nice.org.uk/guidance/ng52
[22] Chaganti S, Illidge T, Barrington S, McKay P, Linton K, Cwynarski K, et al. Guidelines for the
management of diffuse large B-cell lymphoma. Br J Haematol 2016;174(1):43-56.
[23] Tilly H, Gomes da Silva M, Vitolo U, Jack A, Meignan M, Lopez-Guillermo A, et al. Diffuse large
B-cell lymphoma (DLBCL): ESMO Clinical Practice Guidelines for diagnosis, treatment and follow-
up. Ann Oncol 2015;26 Suppl 5:v116-25.
Copyright 2019 Queen's Printer and Controller of HMSO. All rights reserved

CONFIDENTIAL UNTIL PUBLISHED
139
[24] National Comprehensive Cancer Network. NCCN Clinical Practice Guidelines in Oncology - B-
Cell Lymphomas, Version I5.2018, 2018. 297p.
[25] Coiffier B, Sarkozy C. Diffuse large B-cell lymphoma: R-CHOP failure-what to do? Hematology
Am Soc Hematol Educ Program 2016;2016(1):366-378.
[26] National Institute for Health and Care Excellence. Polatuzumab vedotin with rituximab and
bendamustine for treating relapsed or refractory diffuse large B-cell lymphoma. Final scope, 2019. 4p.
[27] Roche Products Ltd. Polatuzumab vedotin with rituximab and bendamustine for treating relapsed
or refractory diffuse large B-cell lymphoma [ID1576]: Appendices: submission to National Institute of
Health and Care Excellence. Single technology appraisal (STA): Roche Products Ltd, 2019. 105p.
[28] Hoffmann La Roche Ltd. Clinical Advisory Board [data on file], 2018
[29] National Institute for Health and Care Excellence. Single Technology Appraisal: user guide for
company evidence submission template [Internet][updated April 2017]. London: NICE, 2015 [accessed
11.6.15]. 52p. Available from: nice.org.uk/process/pmg24
[30] Effective Public Healthcare Panacea Project. Quality assessment tool for quantitative studies
[Internet]. EPHPP, 2004. Available from: http://www.ephpp.ca/tools.html
[31] Thomas SK, Mendoza TR, Vichaya EG, Wang XS, Sailors MH, Williams LA, et al. Validation of
the chemotherapy-induced neuropathy assessment scale. J Clin Oncol 2012;30(15_suppl):9140-9140.
[32] Kymes SM, Pusic I, Lambert DL, Gregory M, Carson KR, DiPersio JF. Economic evaluation of
plerixafor for stem cell mobilization. Am J Manag Care 2012;18(1):33-41.
[33] Wang HI, Smith A, Aas E, Roman E, Crouch S, Burton C, et al. Treatment cost and life expectancy
of diffuse large B-cell lymphoma (DLBCL): a discrete event simulation model on a UK population-
based observational cohort. Eur J Health Econ 2017;18(2):255-267.
[34] Drummond MF, Jefferson TO. Guidelines for authors and peer reviewers of economic submissions
to the BMJ. The BMJ Economic Evaluation Working Party. BMJ 1996;313(7052):275-83.
[35] Woods B, Sideris E, Palmer S, Latimer N, Soares M. NICE DSU Technical Support Document 19.
Partitioned survival analysis for decision modelling in health care: a critical review, 2017 Available
from: http://www.nicedsu.org.uk
[36] van Hout B, Janssen MF, Feng YS, Kohlmann T, Busschbach J, Golicki D, et al. Interim scoring
for the EQ-5D-5L: mapping the EQ-5D-5L to EQ-5D-3L value sets. Value Health 2012;15(5):708-15.
Copyright 2019 Queen's Printer and Controller of HMSO. All rights reserved

CONFIDENTIAL UNTIL PUBLISHED
140
[37] Ionescu-Ittu R, Shang A, Vander Velde N, Guérin A, Lin Y, Shi L, et al. Comparable overall
survival with rituximab-bendamustine (R-Benda) and rituximab-gemcitabine-oxaliplatin (R-GemOx)
when used as second-line (2l) treatment for diffuse large B-cell lymphoma (DLBCL): a real-world study
using US veterans health administration data. Blood 2018;132(Suppl 1):1711.
[38] Latimer N. NICE DSU Technical Support Document 14: undertaking survival analysis for
economic evaluations alongside clinical trials - extrapolation with patient-level data, 2011 Available
from: http://www.nicedsu.org.uk
[39] Morschhauser F, Flinn I, Advani RH, Sehn LH, Kolibaba KS, Press OW, et al. Preliminary results
of a phase II randomized study (ROMULUS) of polatuzumab vedotin (PoV) or pinatuzumab vedotin
(PiV) plus rituximab (RTX) in patients (Pts) with relapsed/refractory (R/R) non-Hodgkin lymphoma
(NHL). J Clin Oncol 2014;32(15_suppl):8519-8519.
[40] Wang H, Manca A, Crouch S, Bagguley T, Yu G, Aas E, et al. Pcn351 - health-state utility values
in diffuse large B-cell lymphoma. Value Health 2018;21.
[41] Larouche JF, Berger F, Chassagne-Clement C, Ffrench M, Callet-Bauchu E, Sebban C, et al.
Lymphoma recurrence 5 years or later following diffuse large B-cell lymphoma: clinical characteristics
and outcome. J Clin Oncol 2010;28(12):2094-100.
[42] Hitz F, Connors JM, Gascoyne RD, Hoskins P, Moccia A, Savage KJ, et al. Outcome of patients
with primary refractory diffuse large B cell lymphoma after R-CHOP treatment. Ann Hematol
2015;94(11):1839-43.
[43] Best JH, Hornberger J, Proctor SJ, Omnes LF, Jost F. Cost-effectiveness analysis of rituximab
combined with chop for treatment of diffuse large B-cell lymphoma. Value Health 2005;8(4):462-70.
[44] Knight C, Hind D, Brewer N, Abbott V. Rituximab (MabThera) for aggressive non-Hodgkin's
lymphoma: systematic review and economic evaluation. Health Technol Assess 2004;8(37):iii, ix-xi, 1-
82.
[45] Guadagnolo BA, Punglia RS, Kuntz KM, Mauch PM, Ng AK. Cost-effectiveness analysis of
computerized tomography in the routine follow-up of patients after primary treatment for Hodgkin's
disease. J Clin Oncol 2006;24(25):4116-22.
[46] Ng AK, Weeks JC, Mauch PM, Kuntz KM. Decision analysis on alternative treatment strategies
for favorable-prognosis, early-stage Hodgkin's disease. J Clin Oncol 1999;17(11):3577-85.
[47] Neelapu SS, Locke FL, Bartlett NL, Lekakis LJ, Miklos DB, Jacobson CA, et al. Axicabtagene
ciloleucel CAR T-cell therapy in refractory large B-cell lymphoma. N Engl J Med 2017;377(26):2531-
2544.
Copyright 2019 Queen's Printer and Controller of HMSO. All rights reserved

CONFIDENTIAL UNTIL PUBLISHED
141
[48] Ara R, Brazier JE. Populating an economic model with health state utility values: moving toward
better practice. Value Health 2010;13(5):509-18.
[49] Farkkila N, Torvinen S, Roine RP, Sintonen H, Hanninen J, Taari K, et al. Health-related quality
of life among breast, prostate, and colorectal cancer patients with end-stage disease. Qual Life Res
2014;23(4):1387-94.
[50] van der Poel MW, Oerlemans S, Schouten HC, Mols F, Pruijt JF, Maas H, et al. Quality of life
more impaired in younger than in older diffuse large B cell lymphoma survivors compared to a
normative population: a study from the population-based PROFILES registry. Ann Hematol
2014;93(5):811-9.
[51] National Institute for Health and Care Excellence. Brentuximab vedotin for treating relapsed or
refractory systemic anaplastic large cell lymphoma [TA478]: NICE, 2017. 28p. Available from:
https://www.nice.org.uk/guidance/ta478
[52] Lloyd A, Nafees B, Narewska J, Dewilde S, Watkins J. Health state utilities for metastatic breast
cancer. Br J Cancer 2006;95(6):683-90.
[53] Nafees B, Stafford M, Gavriel S, Bhalla S, Watkins J. Health state utilities for non small cell lung
cancer. Health Qual Life Outcomes 2008;6:84.
[54] Beusterien KM, Davies J, Leach M, Meiklejohn D, Grinspan JL, O'Toole A, et al. Population
preference values for treatment outcomes in chronic lymphocytic leukaemia: a cross-sectional utility
study. Health Qual Life Outcomes 2010;8:50.
[55] Tolley K, Goad C, Yi Y, Maroudas P, Haiderali A, Thompson G. Utility elicitation study in the
UK general public for late-stage chronic lymphocytic leukaemia. Eur J Health Econ 2013;14(5):749-
59.
[56] Joint Formulary Committee. British National Formulary. Date updated January 2019. London:
BMJ Group and Pharmaceutical Press, 2019. Available from:
https://www.medicinescomplete.com/mc/bnf/current/
[57] Commercial Medicines Unit (CMU). eMIT national database. 2018 [accessed January 2019].
Available from: https://www.gov.uk/government/publications/drugs-and-pharmaceutical-electronic-
market-information-emit#history
[58] NHS. National Tariff Chemotherapy Regimens List 2017-18 Version 1.0 [as referenced in CS].
[59] Rule S, Collins GP, Samanta K. Subcutaneous vs intravenous rituximab in patients with non-
Hodgkin lymphoma: a time and motion study in the United Kingdom. J Med Econ 2014;17(7):459-68.
Copyright 2019 Queen's Printer and Controller of HMSO. All rights reserved

CONFIDENTIAL UNTIL PUBLISHED
142
[60] National Audit Office. End of Life Care, 2008 Available from: https://www.nao.org.uk/wp-
content/uploads/2008/11/07081043.pdf
[61] Curtis L, Burns A. PSSRU Unit Costs of Health and Social Care 2018. Avalabe at:
https://www.pssru.ac.uk/project-pages/unit-costs/unit-costs-2018/; accesed January 2019.: University
of Kent, Canterbury, 2018
[62] CTI BioPharma. Press release: Results of Phase III (PIX306) Trial Evaluating Progression-Free
Survival of PIXUVRI® (pixantrone) Combined with Rituximab in Patients with Aggressive B-cell
Non-Hodgkin Lymphoma 2018 [Internet]. 2018. Available from:
http://investors.ctibiopharma.com/phoenix.zhtml?c=92775&p=irol-newsArticle&ID=2357334
[63] Sehn LH, Flowers C, McMillan A, Morschhauser F, Salles G, Felizzi F, et al. Estimation of long-
term survival with polatuzumab vedotin plus bendamustine and rituximab for patients with
relapsed/refractory diffuse large B-cell lymphoma (R/R Dlbcl). Hematol Oncol 2019;37(S2):257-258.
[64] Kaltenthaler E, Carroll C, Hill-McManus D, Scope A, Holmes M, Rice S, et al. The use of
exploratory analyses within the National Institute for Health and Care Excellence single technology
appraisal process: an evaluation and qualitative analysis. Health Technol Assess 2016;20(26):1-48.
[65] Hoffmann La Roche Ltd. Interim Clinical Study Report GO29365 - Report No. 1078954 2018
Copyright 2019 Queen's Printer and Controller of HMSO. All rights reserved

CONFIDENTIAL UNTIL PUBLISHED
143
Appendix 1: Eligibility criteria for the systematic review
Inclusion Criteria Exclusion
Criteria
Population Adult patients (≥18years) with R/R DLBCL who are receiving
second or third-line (or beyond) therapy
Subgroups of interest include:
• SCT ineligible
• Failed transplant patients
• Duration of response to prior therapy: ≤12 months vs. >12
months
• Disease burden: high vs. low
• Age (≤60 vs. >60)
• Stage of Disease (I–II vs. III–IV)
• Prior systemic therapy
• Refractory vs. relapse
• Extranodal-site involvement (0–1 vs. 2–4)
• Eastern Cooperative Oncology Group (ECOG) Score
Animal/in vitro
studies
Interventions Polatuzumab vedotin in combination with bendamustine plus
rituximab
Comparators Licensed or investigational pharmaceutical treatment available for
R/R DLBCL patients:
Bendamustine+/–rituximab
Brentuximab vedotin
CEPP (Cyclophosphamide, Etoposide, Procarbazine) +/– rituximab
CEOP (Cyclophosphamide, Etoposide, Vincristine) +/– rituximab
DA-EPOCH (Cyclophosphamide, Doxorubicin, Etoposide,
Vincristine) +/– rituximab
GDP (Cisplatin, Dexamethasone, Gemcitabine) +/–rituximab
Carboplatin, Dexamethasone, Gemcitabine +/– rituximab
Gemox (Gemcitabine, Oxaliplatin) +/– rituximab
Gemcitabine + vinorelbine +/– rituximab
Lenalidomide +/– rituximab
Rituximab
Ibrutinib
Pixantrone
CAR-T (Axicabtagene ciloleucel or Tisagenlecleucel)
MOR208
Venetoclax
Apatinib
DHAP (dexamethasone, cytarabine, cisplatin) +/– rituximab
ICE (ifosfamide, etoposide, carboplatin) +/– rituximab
MINE (mesna, ifosfamide, mitoxantrone, etoposide) +/– rituximab
ESHAP (etoposide, methylprednisolone, cytarabine, cisplatin) +/–
rituximab
IME (ifosfamide, mitoxantrone, etoposide) +/– rituximab
IVE (ifosfamide, epirubicin and etoposide) +/– rituximab
CEPP
R+/–PECC (Rituximab-Prednisone, Etoposide, Chlorambucil,
Lomustine)
BSC/placebo
.
First-line
treatments
Non-
pharmacological
therapies
Copyright 2019 Queen's Printer and Controller of HMSO. All rights reserved

CONFIDENTIAL UNTIL PUBLISHED
144
Inclusion Criteria Exclusion
Criteria
Outcomes Efficacy:
• OS
• PFS
• TTP
• EFS
• Duration of response
• Response rates (CR, PR, SD)
• Any response rates reported as PET-CR (i.e. metabolic
CR) or using older criteria (e.g. CRu), or a mixture of
various different criteria (Lugano, modified Lugano)
• ORR
• DCR
• Duration of treatment and duration of treatment beyond
progression
Safety
• All-grade treatment related AE
• Treatment related Grade 3 or 4 AEs
• Treatment related SAEs
• Tolerability: dose reductions and interruptions,
discontinuation (any reason), discontinuation (due to AEs)
• HRQoL and PRO measures (e.g. EORTC QLQ-C30)
Outcome(s) not
listed
Study design /
setting
RCTs, any duration (irrespective of blinding)
Prospective single arm studies
Comparative observation studies
Reviews/editorials,
case reports/case
series
Retrospective
single arm studies
Language of
publication
English language publications Non-English
language
publications
without an English
abstract.
Date of
publication
No restriction
Countries No restriction
Source: Appendix D of the CS14
AE = adverse event; BSC = best supportive care; CR = complete response; DCR = disease control rate; ECOG
= Eastern Cooperative Oncology Group; EFS = event free survival; EORTC QLQ-C30 = The European
Organization for Research and Treatment of Cancer quality of life questionnaire; HRQoL = Health-related
quality of life; ORR = objective response rate; OS = overall survival; PFS = progression free survival; PR =
partial response; RCT = randomised controlled trial; R/R DLBCL = relapse/refractory diffuse large B-cell
lymphoma; SAE = serious adverse events; SCT = stem cell transplantation; SD = stable disease; SLR =
systematic literature review; TTP, time to progression
Copyright 2019 Queen's Printer and Controller of HMSO. All rights reserved

CONFIDENTIAL UNTIL PUBLISHED
145
Appendix 2: Supplementary Information - Searching
Table A2.1: Data sources for the clinical effectiveness systematic review
Search
strategy
element
Resource Host/source Reported
date range
Date searched
Electronic
databases
Medline OVID 1946-June 07
2019
6 September 2018
Update searches on 10
June 2019
Medline Epub Ahead
of Print, In-Process &
Other Non-Indexed
Citations, Medline
Daily
Embase 1974- 2018
Week 36
1980-2019
Week 23
Cochrane CENTRAL EBM
Reviews via
OVID
October 2017
No date in
update
CDSR 2005 – 29
November
2016
No date in
update
DARE Up to 1st
Quarter 2016
NHS EED Up to 1st
Quarter 2016
Conference
Proceedings
EHA Not reported 2015-2018 4-5 October 2018
ICML
ASH
ASCO
ESMO
ISPOR
HTAi
HTA
Agencies
NICE Not reported 4-5 October 2018
SMC
AWMSG
INESSS
PBAC
HAS
CADTH (including
pCODR)
Trials
Registries
WHO ICTRP Not Reported 7 November 2018
Copyright 2019 Queen's Printer and Controller of HMSO. All rights reserved

CONFIDENTIAL UNTIL PUBLISHED
146
Search
strategy
element
Resource Host/source Reported
date range
Date searched
Clinicaltrials.gov
Other
Resources
Latin American and
Caribbean Health
Sciences Literature
Not Reported 4-5 October 2018
Reference lists of included publications were and relevant SLRs were screened.
CDSR = Cochrane Database Systematic Reviews; DARE = Database of Abstracts of Reviews of Effects;
NHS EED = NHS Economic Evaluation Database; EHA = European Hematology Association; ICML =
International Conference on Malignany Lymphoma; ASH = American Society of Hematology; ASCO =
American Society of Clinical Oncology; ESMO = European Society for Medical Oncology; ISPOR=
International Society for Pharmacoeconomics and Outcomes Research; HTAi = Health Technology
Assessment International; NICE = National Institute for Health and Care Excellence; SMC = Scottish
Medicine Consortium; AWMSG = All Wales Medicines Strategy Group; INESSS = Institut National
D’excellence en Services Sociaux; PBAC = Pharmaceutical Benefits Advisory Committee; HAS = Haute
Autorite de Sante; CADTH = Canadian Agency for Drugs and Technologies in Health
Table A2.2: Data sources for the cost-effectiveness and HRQoL systematic reviews
Search strategy
element
Resource Host/source Date range Date searched
Electronic
databases
Medline OVID 1946-Present 4 Sept 2018
Medline Epub
Ahead of Print,
In-Process &
Other Non-
Indexed Citations
Not provided
Medline Daily
Embase 1974- Present 4 Sept 2018
HTA Database OVID Not provided 4 Sept 2018
NHS EED Not provided
Econlit OVID 1961-present 4 Sept 2018
Conference
proceedings
EHA Not reported 2015-2018 8/9 October 2018
ICML
ASH
ASCO
ESMO
ISPOR
HTAi
SMDM
HTA Agencies NICE, SMC,
AWMSG, PBAC,
CADTH,
INESSS, HAS
Not reported 2015-2018 8/9 October 2018
Updated search
conducted list
sent with
clarification
response
Copyright 2019 Queen's Printer and Controller of HMSO. All rights reserved

CONFIDENTIAL UNTIL PUBLISHED
147
Additional
resources
CEA Registry,
RePEc,
INAHTA, NIHR
HTA database,
CRD databases,
ScHARRHUD,
Latin American
and Caribbean
Health Sciences
Literature
Websites links
provided
8/9 October 2018
Bibliographies of all included studies and relevant SLRs were manually searched to identify additional
primary studies.
HTA Database = Health Technology Assessment Database; NHS EED = NHS Economic Evaluation
Database; EHA = European Hematology Association; ICML = International Conference on Malignancy
Lymphoma; ASH = American Society of Hematology; ASCO = American Society of Clinical Oncology;
ESMO = European Society for Medical Oncology; ISPOR= International Society for Pharmacoeconomics
and Outcomes Research; HTAi = Health Technology Assessment International; SMDM = Society for
Medical Decision Making; NICE = National Institute for Health and Care Excellence; SMC = Scottish
Medicine Consortium; PBAC = Pharmaceutical Benefits Advisory Committee; CADTH = Canadian Agency
for Drugs and Technologies in Health; INESSS = Institut National D’excellence en services sociaux; HAS =
Haute Autorite de Sante; RePEc = Research Papers in Economics; INAHTA = International Network of
Agencies for Health Technology Assessment;
Table A2.3: Data sources for the cost and healthcare resource identification, measurement and
valuation
Search strategy
element
Resource Host/source Date range Date searched
Electronic
databases
Medline OVID 1946-Nov 16
2018
19 November
2018
Medline Epub
Ahead of Print,
In-Process &
Other Non-
Indexed Citations
Up to Nov 16
2018
Medline Daily
Embase 1974- 16 Nov
2018
19 November
2018
HTA Database OVID CRD York 19 November
2018 NHS EED CRD York
Econlit EBSCO 1866-Nov 2018 19 November
2018
Conference
proceedings
ESMO Website links
provided
2016-2018 Searched
between 21
Nov/4 Dec 2018 ASCO
EHA
ASH
ICML
ISPOR
HTAi
Copyright 2019 Queen's Printer and Controller of HMSO. All rights reserved
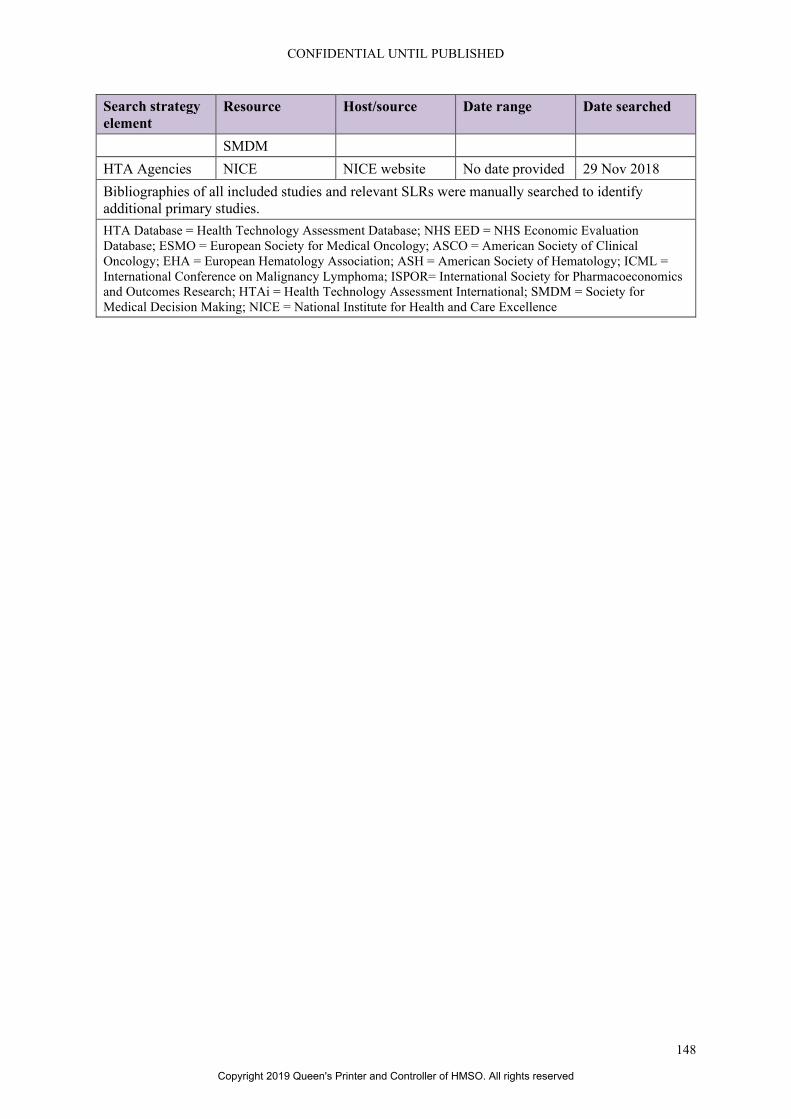
CONFIDENTIAL UNTIL PUBLISHED
148
Search strategy
element
Resource Host/source Date range Date searched
SMDM
HTA Agencies NICE NICE website No date provided 29 Nov 2018
Bibliographies of all included studies and relevant SLRs were manually searched to identify
additional primary studies.
HTA Database = Health Technology Assessment Database; NHS EED = NHS Economic Evaluation
Database; ESMO = European Society for Medical Oncology; ASCO = American Society of Clinical
Oncology; EHA = European Hematology Association; ASH = American Society of Hematology; ICML =
International Conference on Malignancy Lymphoma; ISPOR= International Society for Pharmacoeconomics
and Outcomes Research; HTAi = Health Technology Assessment International; SMDM = Society for
Medical Decision Making; NICE = National Institute for Health and Care Excellence
Copyright 2019 Queen's Printer and Controller of HMSO. All rights reserved
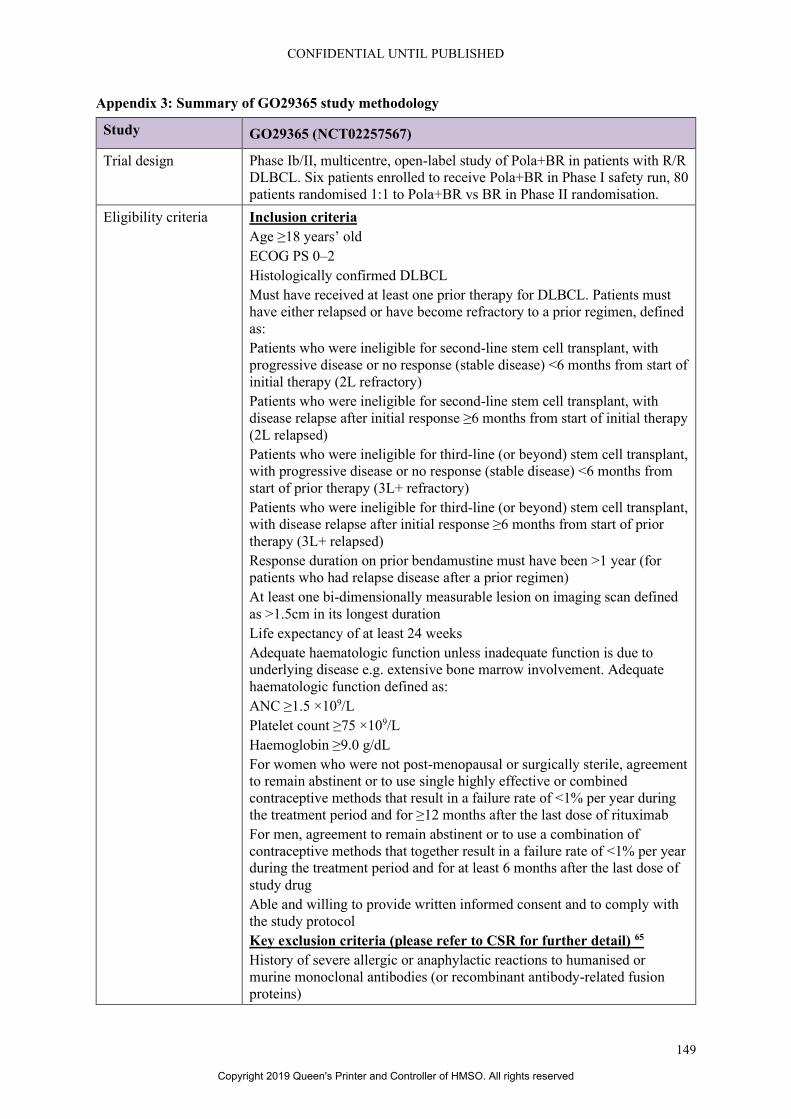
CONFIDENTIAL UNTIL PUBLISHED
149
Appendix 3: Summary of GO29365 study methodology
Study GO29365 (NCT02257567)
Trial design Phase Ib/II, multicentre, open-label study of Pola+BR in patients with R/R
DLBCL. Six patients enrolled to receive Pola+BR in Phase I safety run, 80
patients randomised 1:1 to Pola+BR vs BR in Phase II randomisation.
Eligibility criteria Inclusion criteria
Age ≥18 years’ old
ECOG PS 0–2
Histologically confirmed DLBCL
Must have received at least one prior therapy for DLBCL. Patients must
have either relapsed or have become refractory to a prior regimen, defined
as:
Patients who were ineligible for second-line stem cell transplant, with
progressive disease or no response (stable disease) <6 months from start of
initial therapy (2L refractory)
Patients who were ineligible for second-line stem cell transplant, with
disease relapse after initial response ≥6 months from start of initial therapy
(2L relapsed)
Patients who were ineligible for third-line (or beyond) stem cell transplant,
with progressive disease or no response (stable disease) <6 months from
start of prior therapy (3L+ refractory)
Patients who were ineligible for third-line (or beyond) stem cell transplant,
with disease relapse after initial response ≥6 months from start of prior
therapy (3L+ relapsed)
Response duration on prior bendamustine must have been >1 year (for
patients who had relapse disease after a prior regimen)
At least one bi-dimensionally measurable lesion on imaging scan defined
as >1.5cm in its longest duration
Life expectancy of at least 24 weeks
Adequate haematologic function unless inadequate function is due to
underlying disease e.g. extensive bone marrow involvement. Adequate
haematologic function defined as:
ANC ≥1.5 ×10⁹/L
Platelet count ≥75 ×109/L
Haemoglobin ≥9.0 g/dL
For women who were not post-menopausal or surgically sterile, agreement
to remain abstinent or to use single highly effective or combined
contraceptive methods that result in a failure rate of <1% per year during
the treatment period and for ≥12 months after the last dose of rituximab
For men, agreement to remain abstinent or to use a combination of
contraceptive methods that together result in a failure rate of <1% per year
during the treatment period and for at least 6 months after the last dose of
study drug
Able and willing to provide written informed consent and to comply with
the study protocol
Key exclusion criteria (please refer to CSR for further detail) 65
History of severe allergic or anaphylactic reactions to humanised or
murine monoclonal antibodies (or recombinant antibody-related fusion
proteins)
Copyright 2019 Queen's Printer and Controller of HMSO. All rights reserved
CONFIDENTIAL UNTIL PUBLISHED
150
Study GO29365 (NCT02257567)
Contraindication to bendamustine or rituximab
Prior use of any monoclonal antibody, radioimmunoconjugate, or ADC
within five half-lives or four weeks, whichever was longer, before Cycle 1
Day 1
Ongoing corticosteroid use >30mg/day prednisone or equivalent, for
purposes other than lymphoma symptom control
Completion of autologous stem cell transplant within 100 days prior to
Cycle 1 Day 1
Prior allogenic stem cell transplant
Eligibility for autologous stem cell transplant
History of transformation of indolent disease to DLBCL
Primary or secondary central nervous system lymphoma
Current grade >1 peripheral neuropathy
History of other malignancy that could affect compliance with the protocol
or interpretation of results
Evidence of significant, uncontrolled concomitant diseases that could
affect compliance with the protocol or interpretation of results, including
significant cardiovascular disease (such as New York Heart Association
Class III or IV cardiac disease, myocardial infarction within the last 6
months, unstable arrhythmias, or unstable angina) or significant
pulmonary disease (including obstructive pulmonary disease and history
of bronchospasm)
Known active bacterial, viral, fungal, mycobacterial, parasitic, or other
infection (excluding fungal infections of nail beds) at study enrolment or
any major episode of infection requiring treatment with intravenous
antibiotics or hospitalisation (relating to the completion of the course of
antibiotics) within 4 weeks prior to Cycle 1 Day 1
Positive test results for chronic hepatitis B virus or hepatitis C virus
Known history of human immunodeficiency virus
Any of the following abnormal laboratory values, unless abnormal
laboratory values were due to underlying lymphoma per the investigator:
Creatinine >1.5 X ULN or a measured creatinine clearance < 40 mL/min
AST or ALT >2.5 X ULN
Total bilirubin ≥1.5 X ULN
INR or prothrombin time >1.5 X ULN in the absence of therapeutic
anticoagulation
PTT or aPTT >1.5 X ULN in the absence of a lupus anticoagulant
Trial drugs and
concomitant
medications
Trial drugs
Polatuzumab vedotin: IV, 1.8 mg/kg on Day 2 of Cycle 1 and then Day 1
of subsequent Cycles 2-6;
Bendamustine: IV, 90 mg/m2 q3w on two consecutive days, Days 2 and 3
of Cycle 1, then Days 1 and 2 of subsequent Cycles 2–6;
Rituximab: IV, 375 mg/m2, on Day 1 of Cycles 1–6
Dose modifications
Permanent dose reduction of pola (from 1.8 mg/kg to 1.4 mg/kg) was
mandated for Grade 2 or 3 PN (including its signs and symptoms) which
had recovered following dose delay to Grade ≤1 within ≤14 days of the
Copyright 2019 Queen's Printer and Controller of HMSO. All rights reserved

CONFIDENTIAL UNTIL PUBLISHED
151
Study GO29365 (NCT02257567)
scheduled date of the next cycle. Dose reductions below 1.8 mg/kg of pola
for neutropenia or thrombocytopenia were not allowed
No dose modifications (reductions) of rituximab were allowed
The bendamustine dose (90 mg/m2) could be reduced to
70 mg/m2 in the event of Grade 3 or 4 neutropenia or thrombocytopenia
(first episode or recurrent), if ANC recovered to >1 X 10⁹/L (for
neutropenia) or platelet count recovered to >75 X 109/L (for
thrombocytopenia) on or after Day 8 of the scheduled date for the next
cycle. If prior bendamustine dose reduction had occurred, bendamustine
dose could be further reduced to
50 mg/m2 for recurrent Grade 3 or 4 neutropenia or thrombocytopenia. No
more than two dose reductions of bendamustine were allowed.
Pre-medications
All rituximab infusions were to be preceded by premedication with oral
acetaminophen/paracetamol and an antihistamine 30–60 minutes before
the start of each infusion (unless contraindicated) to minimise the risk of
IRRs.
Concomitant medications
Permitted concomitant medications included:
Continued use of oral contraceptives, hormone-replacement therapy, or
other maintenance therapies
Use of G-CSF for the treatment of neutropenia
Mandatory premedication with acetaminophen/paracetamol and
antihistamine prior to administration of each rituximab infusion
Mandatory premedication with oral allopurinol or a suitable alternative
treatment (with adequate hydration) prior to Cycle 1, Day 1 and
subsequent cycles of treatment if deemed appropriate by the investigator
for all patients with high tumour burden and considered to be at high risk
for TLS
Anti-infective prophylaxis for viral, fungal, bacterial, or Pneumocystis
infections
Necessary supportive measures for optimal medical care throughout study
according to institutional standards, including growth factors (e.g.,
erythropoietin) and anti-emetic therapy, if clinically indicated
Prohibited concomitant medications:
Cytotoxic chemotherapy, other than bendamustine and intrathecal
chemotherapy for CNS prophylaxis
Immunotherapy or immunosuppressive therapy, other than study
treatments
Radioimmunotherapy or radiotherapy
Hormone therapy, other than contraceptives, stable hormone-replacement
therapy, or megestrol acetate
Biologic agents other than haematopoietic growth factors, which are
allowed if clinically indicated and used in accordance with instructions
provided in the package inserts
Any therapy (other than intrathecal CNS prophylaxis) intended for the
treatment of lymphoma
Primary outcome Primary endpoint:
Copyright 2019 Queen's Printer and Controller of HMSO. All rights reserved

CONFIDENTIAL UNTIL PUBLISHED
152
Study GO29365 (NCT02257567)
PET-defined CR rate at the time of primary response assessment (6–8
weeks after Cycle 6 Day 1 or last dose of study medication) as defined by
the IRC
Other outcomes used
in the economic
model/specified in the
scope
Secondary endpoints:
CR at the time of primary response assessment based on PET-CT, as
determined by investigator
OR (CR or PR) at the time of primary response assessment, based on PET-
CT, as determined by investigator and IRC
CR at the time of primary response assessment based on CT only, as
determined by investigator and IRC
OR at the time of primary response assessment based on CT only, as
determined by investigator and IRC
BOR (CR or PR) while on study either by PET-CT or CT only, as
determined by investigator and IRC
DOR, based on PET-CT or CT, as determined by IRC
PFS, based on PET-CT or CT, as determined by IRC
Exploratory objectives:
DOR based on PET-CT or CT only as determined by the investigator
PFS based on PET-CT or CT only as determined by the investigator
EFS based on PET-CT or CT only as determined by the investigator
OS
Safety endpoints:
Safety and tolerability of Pola+BR
Immunogenicity of Pola+BR, as measured by the formation of ADAs
Patient-reported outcomes:
Peripheral neuropathy symptom severity and interference on daily
functioning and to better understand treatment impact, tolerability, and
reversibility, as measured by the Therapy-Induced Neuropathy
Assessment Scale (TINAS) v1.0
Pre-planned
subgroups
OS and PFS efficacy of Pola+BR in pre-specified demographic and
baseline characteristics
Source: CS, pages 27-31
ADA = anti-drug antibodies; ALT = alanine aminotransferase; ANC = absolute neutrophil count; AST =
aspartate aminotransferase; BOR = best overall response; BR = bendamustine + rituximab; CNS = central
nervous system; CR = complete response; DLBCL = diffuse large B-cell lymphoma; DOR = duration of
response; ECOG PS = Eastern Cooperative Oncology Group performance status; EFS = event-free survival;
G-CSF = granulocyte-colony stimulating factor; IRC = Independent Review Committee; IRR = infusion-
related reaction; OR = overall response; OS = overall survival; PET-CT = positron emission tomography-
computed tomography; PFS = progression-free survival; PN = peripheral neuropathy; Pola = polatuzumab
vedotin; PR = partial response; (a)PTT = (activated) partial thromboplastin time; R/R = relapsed/refractory;
TINAS = Therapy-Induced Neuropathy Assessment Scale; TLS = tumour lysis syndrome; ULN = upper limit
of normal
Copyright 2019 Queen's Printer and Controller of HMSO. All rights reserved

CONFIDENTIAL UNTIL PUBLISHED
153
Appendix 4: Goodness of fit assessment of parametric survival models received with the
response to the clarification letter (*******************)
This appendix presents a summary of the goodness of fit assessment based on AIC/BIC values and
visual fit of the parametric curves vs. KM data as presented in the electronic model after clarification
(*******************).
As discussed previously, the ERG considered that the cure mixture models do not provide realistic long-
term extrapolations and the evidence substantiating the need for cure mixture models is lacking.
Furthermore, the ERG considers the visual fit of independent models to be better in comparison to the
dependent models. On the other hand, the ERG is unsure about the level of credibility for the visual fits,
as some errors are suspected in the Kaplan Meier curves, as explained in the clinical effectiveness part
of this report.
From the goodness of fit results presented below, independently fitted generalised gamma and
lognormal provided the lowest AIC/BIC values for pola+BR and BR arms for PFS and lognormal and
log-logistic distribution provided the lowest AIC/BIC values for the OS.
Based on the visual fit, the ERG considered independently fitted lognormal to be more plausible for
PFS, as the independently fitted generalised gamma extrapolation has a quite heavy tail for pola+BR
For the OS, the ERG considered generalised gamma extrapolation to be more plausible, considering the
visual fit of the distribution in comparison to others. The model outcomes and the corresponding KM
curves for OS and PFS are provided in Figure A4.9 and Figure A4.10 below.
Table A4.1. Ranking of PFS distributions for Pola+BR and BR based on AIC and BIC
Parametric distribution Pola+BR
AIC (rank)
Pola+BR
BIC (rank)
BR AIC
(rank)
BR
BIC (rank)
Sta
nd
ard
(dep
end
ent
fit)
a
Exponential 408.9 (6) 413.6 (6) NA NA
Weibull 404.4 (5) 411.5 (5) NA NA
Gompertz 396.2 (4) 403.3 (4) NA NA
Log-Normal 391.5 (2) 398.6 (1) NA NA
Generalised
Gamma 391.0 (1) 400.5 (3)
NA NA
Log-Logistic 393.3 (3) 400.4 (2) NA NA
Sta
nd
ard
(in
dep
end
ent
fit)
Exponential 225.8 (5) 227.5 (5) 183.1 (6) 184.8 (6)
Weibull 225.9 (6) 229.2 (6) 180.4 (5) 183.8 (5)
Gompertz 221.8 (4) 225.2 (4) 175.0 (3) 178.4 (3)
Log-Normal 219.7 (2) 223.0 (2) 173.8 (1) 177.1 (1)
Generalised
Gamma 216.9 (1) 222.0 (1) 175.4 (4) 180.5 (4)
Log-Logistic 221.3 (3) 224.6 (3) 173.8 (2) 177.2 (2)
Cu
re-m
ixtu
re
Exponential 49.3 (3) 131.2 (1) 86.2 (5) 168.1 (1)
Weibull 51.9 (6) 154.8 (5) 87.4 (6) 190.3 (5)
Gompertz 49.4 (4) 152.3 (4) 84.9 (4) 187.8 (4)
Copyright 2019 Queen's Printer and Controller of HMSO. All rights reserved

CONFIDENTIAL UNTIL PUBLISHED
154
Table A4.2. Ranking of OS models for Pola+BR and BR based on AIC and BIC
Log-Normal 47.8 (2) 150.7 (3) 81.7 (1) 184.7 (2)
Generalised
Gamma
49.8 (5) 168.5 (6) 83.7 (3) 202.5 (6)
Log-Logistic 47.6 (1) 150.5 (2) 82.3 (2) 185.2 (3)
aThe presented statistics represent the overall fit of the dependent model to both arms of the trial.
AIC, Akaike Information Criterion; BIC, Bayesian Information Criterion; BR, bendamustine + rituximab;
KM, Kaplan-Meier; NA, not available; Pola+BR, polatuzumab + bendamustine + rituximab
Model Pola+BR
AIC (rank)
Pola+BR
BIC (rank)
BR AIC
(rank)
BR
BIC (rank)
Sta
nd
ard
(dep
end
entl
y f
it)a
Exponential 403.5 (5) 408.3 (5) NA NA
Weibull 404.6 (6) 411.8 (6) NA NA
Gompertz 400.7 (4) 409.7 (4) NAc NAc
Log-Normal 396.3 (1) 403.4 (1) NA NA
Generalised
gamma 397.9 (3) 407.4 (3) NA NA
Log-logistic 397.0 (2) 404.1 (2) NA NA
Sta
nd
ard
(in
dep
end
entl
y f
it)
Exponential 210.8 (4) 212.5 (2) 192.7 (5) 194.4 (4)
Weibull 212.8 (6) 216.2 (6) 193.5 (6) 196.9 (6)
Gompertz 211.5 (5) 214.9 (4) 190.9 (3) 194.3 (3)
Log-Normal 209.0 (1) 212.4 (1) 189.3 (2) 192.6 (2)
Generalised
gamma 210.3 (3) 215.3 (5) 191.2 (4) 196.3 (5)
Log-logistic 210.0 (2) 213.3 (3) 189.0 (1) 192.4 (1)
Cu
re-m
ixtu
re (
dep
end
ent,
no
t
info
rmed
by P
FS
)b
Exponential 131.9 (3) 188.5 (1) NA NA
Weibull 133.6 (5) 236.5 (5) NA NA
Gompertz 133.5 (4) 236.4 (4) NA NA
Log-Normal 130.9 (2) 233.8 (3) NA NA
Generalised
Gamma 138.6 (6) 257.3 (6)
NA NA
Log-Logistic 130.5 (1) 233.4 (2) NA NA
Cu
re-m
ixtu
re
(in
dep
end
ent,
OS
info
rmed
by P
FS
) Exponential 88.0 (5) 169.8 (1) 86.7 (2) 168.5 (1)
Weibull 87.3 (3) 190.2 (4) 88.1 (5) 191.0 (4)
Gompertz 88.8 (6) 191.7 (5) 89.5 (6) 192.4 (5)
Log-Normal 86.6 (2) 189.5 (3) 87.1 (3) 190.0 (3)
Copyright 2019 Queen's Printer and Controller of HMSO. All rights reserved

CONFIDENTIAL UNTIL PUBLISHED
155
Generalised
Gamma 87.5 (4)
206.3 (6) 87.8 (4) 206.5 (6)
Log-Logistic 85.6 (1) 188.5 (2) 85.8 (1) 188.7 (2)
aThe presented statistics represent the overall fit of the dependent model to both arms of the trial. AIC/BIC
statistics are therefore not presented.
AIC, Akaike Information Criterion; BIC, Bayesian Information Criterion; BR, bendamustine + rituximab;
KM, Kaplan-Meier; NA, not available; Pola+BR, polatuzumab + bendamustine + rituximab
Copyright 2019 Queen's Printer and Controller of HMSO. All rights reserved
CONFIDENTIAL UNTIL PUBLISHED
156
Figure A4.1: OS standard extrapolation functions (dependent fit, GO29365,
******************)
Obtained from economic model after clarification. The Gompertz extrapolation was not considered for either arm
for OS due failure of parameterisation for this function for OS; this extrapolation is therefore not presented.
BR, bendamustine + rituximab; KM, Kaplan-Meier; Pola+BR, polatuzumab + bendamustine + rituximab
Copyright 2019 Queen's Printer and Controller of HMSO. All rights reserved

CONFIDENTIAL UNTIL PUBLISHED
157
Figure A4.2: OS standard extrapolation functions (independent fit GO29365,
******************)
Obtained from economic model after clarification. The Gompertz extrapolation was not considered due failure of
parameterisation for this function for OS; BR, bendamustine + rituximab; KM, Kaplan-Meier; Pola+BR,
polatuzumab + bendamustine + rituximab
Copyright 2019 Queen's Printer and Controller of HMSO. All rights reserved

CONFIDENTIAL UNTIL PUBLISHED
158
Figure A4.3: OS cure mixture model extrapolation functions (OS informed by PFS, from
GO29365, ******************)
Obtained from economic model after clarification. The Gompertz extrapolation was not considered due failure of
parameterisation for this function for OS; BR, bendamustine + rituximab; KM, Kaplan-Meier; Pola+BR,
polatuzumab + bendamustine + rituximab
Figure A4.4: OS cure mixture model extrapolation functions (OS not informed by PFS, same
OS for not-long-term survivors, data from GO29365, ******************)
Obtained from economic model after clarification. The Gompertz extrapolation was not considered due failure of
parameterisation for this function for OS; BR, bendamustine + rituximab; KM, Kaplan-Meier; Pola+BR,
polatuzumab + bendamustine + rituximab
Copyright 2019 Queen's Printer and Controller of HMSO. All rights reserved

CONFIDENTIAL UNTIL PUBLISHED
159
Figure A4.5: PFS standard extrapolation functions (dependent fit, GO29365,
******************)
Obtained from economic model after clarification. BR, bendamustine + rituximab; IRC, independent review
committee; KM, Kaplan-Meier; PFS, progression-free survival; OS, overall survival; Pola+BR, polatuzumab +
bendamustine + rituximab
Copyright 2019 Queen's Printer and Controller of HMSO. All rights reserved
CONFIDENTIAL UNTIL PUBLISHED
160
Figure A4.6: PFS standard extrapolation functions (independent fit, GO29365,
******************)
Obtained from economic model after clarification. BR, bendamustine + rituximab; IRC, independent review
committee; KM, Kaplan-Meier; PFS, progression-free survival; OS, overall survival; Pola+BR, polatuzumab +
bendamustine + rituximab
Copyright 2019 Queen's Printer and Controller of HMSO. All rights reserved

CONFIDENTIAL UNTIL PUBLISHED
161
Figure A4.7: PFS cure-mixture modelling based extrapolation functions (independent fit,
GO29365, ******************)
Obtained from economic model after clarification. BR, bendamustine + rituximab; IRC, independent review
committee; KM, Kaplan-Meier; PFS, progression-free survival; OS, overall survival; Pola+BR, polatuzumab +
bendamustine + rituximab
Figure A4.8: ERG base case PFS and OS extrapolations (GO29365, IRC, ******************)
Obtained from economic model after clarification. BR, bendamustine + rituximab; IRC, independent review
committee; KM, Kaplan-Meier; PFS, progression-free survival; OS, overall survival; Pola+BR, polatuzumab +
bendamustine + rituximab
Copyright 2019 Queen's Printer and Controller of HMSO. All rights reserved
CONFIDENTIAL UNTIL PUBLISHED
162
Figure A4.9: ERG base case PFS model outcomes
Obtained from economic model after clarification. BR, bendamustine + rituximab; IRC, independent review
committee; KM, Kaplan-Meier; PFS, progression-free survival; OS, overall survival; Pola+BR, polatuzumab +
bendamustine + rituximab
Figure A4.10: ERG base case OS model outcomes
Obtained from economic model after clarification. BR, bendamustine + rituximab; IRC, independent
review committee; KM, Kaplan-Meier; PFS, progression-free survival; OS, overall survival; Pola+BR,
polatuzumab + bendamustine + rituximab
Copyright 2019 Queen's Printer and Controller of HMSO. All rights reserved