polarization and depolarization current of linear...
TRANSCRIPT

POLARIZATION AND DEPOLARIZATION CURRENT OF LINEAR LOW
DENSITY POLYETHYLENE-NATURAL RUBBER NANOCOMPOSITE
SUBJECTED TO ELECTRICAL TRACKING AND MOISTURE
NOR AKMAL BINTI MOHD JAMAIL
A thesis submitted in fulfilment of the
requirements for the award of the degree of
Doctor of Philosophy (Electrical Engineering)
Faculty of Electrical Engineering
Universiti Teknologi Malaysia
FEBRUARY 2015

v
ABSTRACT
Polymeric nanocomposites are widely used for high voltage outdoor
insulating application due to their efficient electrical performance. Recently, SiO2,
TiO2 and MMT nanofillers are used as fillers because there are listed as the main
nanofiller commonly used in electrical engineering due to the increases of effective
activation energy. Natural rubber (NR) is used because the nature of the interphase is
found to affect viscoelasticity and it develops several interphases with the Linear
Low-Density Polyethylene (LLDPE) matrix. This thesis presents the outcome of an
experimental study which has been carried out to determine the conductivity level
and dielectric response function of the LLDPE-NR compound, filled with different
amount of SiO2, TiO2 and MMT nanofillers using Polarization and Depolarization
Current (PDC) measurement technique. LLDPE and NR with the ratio composition
of 80:20 were selected as a base polymer. The PDC testing was done on samples at
various conditions: without any defect (normal condition), wet condition (moisture
absorption) and after electrical tracking effect condition based on BS EN
60587:2007 standards. One of the problems associated with outdoor polymeric
insulators is the tracking of the surface which can directly influence the reliability of
the insulator. The amount of water content can be used to monitor the dielectric
quality of insulation and as an indicator of possible deterioration for outdoor
degradation. Besides PDC, surface morphology analysis using FESEM was also
conducted to study the changes in physical structure which can explain the
conductivity and response function. This research found that an addition of certain
weight percentage of nanofiller and NR into the LLDPE improved conductivity level
of the insulator. LLDPE-NR/TiO2 at 5 wt% has become the best sample in terms of
the lowest conductivity in normal and under electrical tracking effect. Besides, this
sample has the fastest time response under electrical tracking and moisture
condition. This investigation has successfully identified the PDC pattern,
conductivity and dielectric response function of LLDPE-NR nanocomposite. Results
show that different compositions as well as the surface physical conditions affect the
PDC measurement results.
vi
ABSTRAK
Nanokomposit polimer telah digunakan secara meluas dalam aplikasi
penebatan luar voltan tinggi disebabkan prestasi elektrik yang bagus. Pada masa kini,
pengisi nano SiO2, TiO2 dan MMT digunakan sebagai pengisi kerana telah
disenaraikan sebagai pengisi nano utama yang digunakan dalam kejuruteraan
elektrik disebabkan oleh peningkatan tenaga pengaktifan yang berkesan. Getah asli
telah digunakan kerana sifat semulajadi interfasanya memberi kesan likat-kenyal dan
membentuk beberapa interfasa dengan matrik Linear Low-Density Polyethylene
(LLDPE). Tesis ini membentangkan hasil kajian eksperimen yang telah dijalankan
untuk menentukan tahap kekonduksian dan fungsi tindak balas dielektrik terhadap
komposit LLDPE-NR, diisi dengan pengisi SiO2, TiO2 dan MMT yang berlainan
jumlah menggunakan teknik Pengukuran Arus Polarisasi dan Depolarisasi (PDC).
LLDPE dan getah asli dengan komposisi nisbah 80:20 telah dipilih sebagai polimer
asas. Ujian PDC telah dilakukan ke atas sampel dalam pelbagai keadaan: tanpa
sebarang kecacatan (keadaan biasa), keadaan basah (penyerapan lembapan) dan
selepas keadaan kesan treking elektrik berdasarkan piawaian BS EN 60587:2007.
Salah satu masalah berkaitan dengan penebat polimer luar adalah treking permukaan
yang secara langsung boleh mempengaruhi kebolehpercayaan penebat. Jumlah
kandungan air boleh digunakan untuk memantau kualiti dielektrik penebat dan
sebagai petunjuk kemungkinan kemerosotan untuk degradasi luar. Selain PDC,
analisis morfologi permukaan menggunakan FESEM juga telah dijalankan untuk
mengkaji perubahan struktur fizikal yang berkaitan dengan fungsi kekonduksian dan
fungsi tindak balas. Kajian ini mendapati bahawa tambahan peratusan berat tertentu
pengisi nano dan getah asli ke atas LLDPE telah menambahbaik tahap kekonduksian
penebat. LLDPE-NR/TiO2 pada 5 % berat telah menjadi sampel yang terbaik dari
segi kekonduksian paling rendah dalam keadaan normal dan treking elektrik. Selain
itu, sampel ini mempunyai masa tindak balas yang paling pantas dalam keadaan
treking elektrik dan kelembapan. Kajian ini berjaya mengenal pasti corak PDC,
kekonduksian dan fungsi tindak balas dielektrik nanokomposit LLDPE-NR.
Keputusan menunjukkan bahawa komposisi yang berbeza serta keadaan fizikal
permukaan memberi kesan kepada keputusan pengukuran PDC.

vii
TABLE OF CONTENTS
CHAPTER TITLE PAGE
DECLARATION
DEDICATION
ACKNOWLEDGEMENT
ABSTRACT
ABSTRAK
TABLE OF CONTENT
LIST OF TABLES
LIST OF FIGURES
LIST OF ABBREVIATIONS
LIST OF SYMBOLS
LIST OF APPENDICES
ii
iii
iv
v
vi
vii
xi
xii
xix
xxi
xxii
1 INTRODUCTION 1
1.1 Background of the Research
1.2 Problem Statement
1.3 Aim and Objectives of the Research
1.4 Scope of the Research
1.5 Significance of the Study
1.6 Thesis Organisation
1
3
5
6
6
8
2 LITERATURE REVIEW 9
2.1 Introduction
2.2 Polymer Nanocomposite
2.3 DC Conductivity of Polymer Nanocomposite
9
9
13

viii
2.3.1 Conduction Current Measurement System
2.3.2 Current and Conduction Analysis
2.4 Moisture Absorption in Polymer Nanocomposite
2.5 Polarization and Depolarization Current (PDC)
2.5.1 Basic Principle of PDC
2.5.2 PDC Measurement for Solid Insulation
2.6 Conductivity Variation using PDC Measurement
2.7 Conductivity and Moisture Content Analysis
using PDC Measurement
2.7.1 Effect of Moisture Content and
Temperature on Transformer Insulations
2.7.2 Conductivity of Transformer Insulation
2.7.3 Machine Insulation Results
2.7.4 Effect of Moisture Content and
Temperature on Cable Insulation
2.7.5 Conductivity of Cable Insulation
2.8 Dielectric Response of Polymer
2.9 Electrical Tracking
2.9.1 Analysis of Carbon Track
2.9.2 Leakage Current and Dry-band Arcing
2.10 Summary
14
16
19
21
24
28
29
30
31
33
35
37
38
40
41
41
43
45
3 RESEARCH METHODOLOGY 46
3.1 Introduction
3.2 Development of the New Polymer
Nanocomposite Sample for HV Insulating
Material
3.2.1 Material Preparation
3.2.2 Compounding and Mixing of Polymer
Nanocomposite
3.2.2.1 Compounding setup and
equipment
3.2.3 Cutting of Mixed Material
46
47
48
51
51
53

ix
3.2.4 Drying Process
3.2.5 Compression Moulding
3.2.5.1 Estimation of Mass
3.2.5.2 Compression Moulding Setup and
3.3 Morphological Studies
3.3.1 Platinum Coating Procedure
3.3.2 FESEM Setup and Procedure
3.4 Energy Dispersion X-Ray (EDX)
3.5 Capacitance Measurement
3.5.1 Test cell
3.5.2 Capacitance Test Procedure
3.6 Polarization and Depolarization Current (PDC)
Measurement
3.6.1 PDC Test Setup and Equipment
3.6.2 PDC Test Procedure
3.7 Electrical Tracking Test
3.7.1 Electrical Tracking Test Setup and
Equipment
3.7.2 Electrical Tracking Test Procedure
3.8 Adding Moisture to Solid Insulation
3.8.1 Adding Moisture Procedure
3.9 Summary
55
55
57
58
59
60
61
67
67
68
69
70
70
73
74
74
77
79
80
4 RESULTS AND DISCUSSIONS 81
4.1 Identification of Material Composition Using
Energy Dispersive X-ray (EDX)
4.2 Physical Characteristic
4.2.1 Characteristic of New Sample
4.2.1.1 Colour
4.2.1.2 Morphology
4.2.2 Sample with Electrical Tracking Effects
4.2.2.1 Erosion
81
88
88
88
90
94
94
x
4.2.2.2 Morphology
4.3 Moisture Absorption Characteristic
4.4 Polarization and Depolarization Current
Measurement Test Result
4.4.1 Normal Condition Result
4.4.2 Sample with Electrical Tracking Effects
4.4.3 After Immersed in Water Condition
4.5 Conductivity Variation
4.5.1 Normal Condition Result
4.5.2 Sample with Electrical Tracking Effects
4.5.3 After Immersed in Water Condition
4.6 Dielectric Response Function
4.6.1 Normal Condition Result
4.6.2 Sample with Electrical Tracking Effects
4.6.3 After Immersion in Water Condition
4.7 Maximum Conductivity Analysis
4.8 Response Function Analysis
4.9 Summary
98
102
108
109
114
119
126
128
131
134
139
139
142
145
149
156
161
5 CONCLUSION AND RECOMMENDATION 164
5.1 Conclusions
5.2 Summary of the Original Contributions
5.3 Recommendations
164
166
166
REFERENCES
168
Appendices A-B 180-188

xi
LIST OF TABLES
TABLE NO. TITLE PAGE
2.1 Machine Insulation Current for Different Condition 37
2.2 Cable Conductivity for Different Condition [56, 57] 39
3.1 Details properties of materials 50
3.2 Technical data for mixer 52
3.3 Compound formulations and designations 57
4.1 Colour characteristic for all samples 89
4.2 Water absorption percentage of saturation 108
4.3 Minimum and maximum value of polarization current(Ipol) 125
4.4 Minimum and maximum value of depolarization current
(Idepol) 126
4.5 Minimum and maximum conductivity value 138
4.6 The initial time of response function to reach steady state
condition 148
4.7 Lowest conductivity for samples A, B and C 155
4.8 Initial time response for samples A, B and C 161

xii
LIST OF FIGURES
FIGURE NO. TITLE PAGE
2.1 Conduction current measurement system [9, 43, 46] 15
2.2 Current for TiO2 based polyimide nanocomposite at
different % amount added [44] 17
2.3 The influence of the MgO nano-filler content on the
volume resistivity [9, 43] 18
2.4 I - V characteristics in alumina nanoparticles filled LLDPE
samples at 20°C [42] 19
2.5 Moisture absorption of three materials as aging time [50] 20
2.6 Characteristic of Polarization and Depolarization Currents
[13, 73, 74, 85, 88]
26
2.7 PDC curve in dB plot [89] 27
2.8 Principle of test arrangement for PDC measurement with
isolated shield [54, 60]
28
2.9 Principle of test arrangement for PDC measurement with
grounded shield [54, 60]
29
2.10 Effect of paper moisture content on polarization current
measured at 15C and 10C [65]
32
2.11 Effect of paper moisture content on depolarization current
measured at 15C and 10C [65]
33
2.12 Variation of polarization currents with paper conductivity.
(a) σpaper = 1.5pS/m; σpaper = 0.15 pS/m; σpaper =
0.015pS/m, (b) σpaper = 4.2fS/m; σpaper = 42fS/m;
σpaper = 420fS/m [13, 86]
34
2.13 Variation of polarization currents with different oil
conductivity [12, 92]
35
2.14 Polarization currents for epoxy-mica bars and a polyester-
mica coil before (dry) and after (humid) one week under

xiii
humid atmosphere [52] 36
2.15 Depolarization currents for epoxy-mica bars and a
polyester-mica coil before (dry) and after (humid) one
week under humid atmosphere [52]
36
2.16 Polarization and depolarization current of 2 km XLPE
cable after 4 years in service (T=21C) and 5 years later
after supplying fault current (T=30C )[54]
38
2.17 Polarization and depolarization current of aged XLPE
cable before and after repair due to free water [54]
38
2.18 Schematic Diagram of IPT setup [106] 43
2.19 Surface tracking development process [113] 44
3.1 Flow chart of research methodology 47
3.2 Linear Low Density Polyethylene (LLDPE) 49
3.3 Natural Rubber grade SMR CV 60 49
3.4 Nanofiller (a) Silicon Oxide (SiO2), (b) Titanium Oxide
(TiO2) and (c) Monmorillonite clay (MMT-organoclay) 50
3.5 Compound mixer setup (a) temperature controller, (b)
mixer bowl, (c) two- hand control device, (d) drive unit (e)
blades and (f) loading weight
52
3.6 Compounding sample (a) LLDPE-NR/SiO2, (b) LLDPE-
NR/TiO2 and (c) LLDPE-NR/MMT 53
3.7 Plastic granulation (a) feeding hopper, (b) lock and (c)
START and STOP button 54
3.8 LLDPE/NR nanocomposite in small particle 54
3.9 Oven for drying process 55
3.10 Genesis compression moulding equipment (a) heat power
ON, (b) heat power OFF, (c) clamp CLOSE, (d) master
power ON, (e) master power OFF , (f) clamp OPEN, (g)
water cooling switch and (h) MANUAL or AUTO cycle
59
3.11 Platinum coating equipment and setup (a) coating
chamber, (b) auto fine coater and (c) START button 60
3.12 FESEM test arrangement (a) FESEM JEOL, (b) personal
computer and (c) exchange rod 61
3.13 FESEM main switch (a) VAC switch and (b) Main switch 62
3.14 Microscope OS switch 62

xiv
3.15 Liquid Nitrogen Cold-trap 63
3.16 Exchange chamber switch (a) EVAC switch, (b) HLDR
switch, (c) VENT switch and (d) EXCH POSN switch 64
3.17 Sample holder 64
3.18 Exchange rod 65
3.19 FESEM Trackball 66
3.20 FESEM control panel 66
3.21 Capacitance test setup (a) test cell and (b) LCR meter 68
3.22 PDC test cell (a) positive electrode (unguarded electrode),
(b) negative electrode (guarded electrode), (c) positive
terminal and (d) negative terminal 69
3.23 Principal of test arrangement for PDC measurement 70
3.24 PDC test workstation 71
3.25 User panel for PDC measurement 72
3.26 Switching panel 72
3.27 Schematic Diagram of IPT setup [10, 106] 75
3.28 Schematic Diagram of IPT setup [10, 106] 76
3.29 High voltage transformer 76
3.30 Online analysis system 77
3.31 Test specimen arrangement 78
3.32 Weight scale 78
3.33 Sample immersed in distilled water 79
4.1 EDX spectrum of LLDPE-NR (Sample R) 82
4.2 EDX spectrum of LLDPE-NR/SiO2 (Sample A1) 82
4.3 EDX spectrum of LLDPE-NR/SiO2 (Sample A3) 83
4.4 EDX spectrum of LLDPE-NR/SiO2 (Sample A5) 83
4.5 EDX spectrum of LLDPE-NR/SiO2 (Sample A7) 84
4.6 EDX spectrum of LLDPE-NR/TiO2 (Sample B1) 84
4.7 EDX spectrum of LLDPE-NR/TiO2 (Sample B3) 85
4.8 EDX spectrum of LLDPE-NR/TiO2 (Sample B5) 85

xv
4.9 EDX spectrum of LLDPE-NR/TiO2 (Sample B7) 86
4.10 EDX spectrum of LLDPE-NR/MMT (Sample C3) 86
4.11 EDX spectrum of LLDPE-NR/MMT (Sample C5) 87
4.12 EDX spectrum of LLDPE-NR/MMT (Sample C7) 87
4.13 FESEM images of sample R in normal condition 90
4.14 FESEM images of samples for group A in normal
condition. (a) Sample A1, (b) Sample A3, (c) Sample A5,
(d) Sample A7 91
4.15 FESEM images of samples for group B in normal
condition. (a) Sample B1, (b) Sample B3, (c) Sample B5,
(d) Sample B7 92
4.16 FESEM images of samples for group C in normal
condition. (a) Sample C3, (b) Sample C5 (c) Sample C7 93
4.17 Test samples R effect of electrical tracking test 95
4.18 Test samples for group A effect of electrical tracking test.
(a) Sample A1, (b) Sample A3, (c) Sample A5, (d) Sample
A7 95
4.19 Test samples for group B effect of electrical tracking test.
(a) Sample B1, (b) Sample B3, (c) Sample B5, (d) Sample
B7 96
4.20 Test samples for group C effect of electrical tracking test.
(a) Sample C3, (b) Sample C5, (c) Sample C7
97
4.21 FESEM images of sample R effect of electrical tracking
test
99
4.22 FESEM images of sample for group A effect of electrical
tracking test. (a) Sample A1, (b) Sample A3, (c) Sample
A5, (d) Sample A7
100
4.23 FESEM images of sample for group B effect of electrical
tracking test. (a) Sample B1, (b) Sample B3, (c) Sample
B5, (d) Sample B7
101
4.24 FESEM images of sample for group C effect of electrical
tracking test. (a) Sample C3, (b) Sample C5, (c) Sample C7
102
4.25 Weight of water absorption for sample R and samples in
Group A
104
4.26 Percentage of water absorption for sample R and samples
in Group A
104

xvi
4.27 Weight of water absorption for sample R and samples in
Group B
105
4.28 Percentage of water absorption for sample R and samples
in Group B
105
4.29 Weight of water absorption for sample R and samples in
Group C
107
4.30 Percentage of water absorption for sample R and samples
in Group C
107
4.31 Polarization current pattern for samples R, A1, A3, A5 and
A7 at normal condition
110
4.32 Depolarization current pattern for samples R, A1, A3, A5
and A7 at normal condition
111
4.33 Polarization current pattern for samples R, B1, B3, B5 and
B7 at normal condition
112
4.34 Depolarization current pattern for samples R, B1, B3, B5
and B7 at normal condition
112
4.35 Polarization current pattern for samples R, C3, C5 and C7
at normal condition
113
4.36 Depolarization current pattern for samples R, C3, C5 and
C7 at normal condition
114
4.37 Polarization current pattern for samples R, A1, A3, A5 and
A7 after electrical tracking test
115
4.38 Depolarization current pattern for samples R, A1, A3, A5
and A7 after electrical tracking test
115
4.39 Polarization current pattern for samples R, B1, B3, B5 and
B7 after electrical tracking test
116
4.40 Depolarization current pattern for samples R, B1, B3, B5
and B7 after electrical tracking test
117
4.41 Polarization current pattern for sample R, C3, C5 and C7
after electrical tracking test
118
4.42 Depolarization current pattern for sample R, C3, C5 and
C7 after electrical tracking test
118
4.43 Polarization current pattern for samples R, A1, A3, A5 and
A7 after water absorption
119
4.44 Depolarization current pattern for samples R, A1, A3, A5
and A7 after water absorption
120
xvii
4.45 Polarization current pattern for samples R, B1, B3, B5 and
B7 after water absorption
121
4.46 Depolarization current pattern for samples R, B1, B3, B5
and B7 after water absorption
121
4.47 Polarization current pattern for samples R, C3, C5 and C7
after water absorption
122
4.48 Depolarization current pattern for samples R, C3, C5 and
C7 after water absorption
123
4.49 Conductivity variations for sample LLDPE-NR and sample
LLDPE-NR/SiO2 at different amount of nanofiller at
normal condition
129
4.50 Conductivity variations for sample LLDPE-NR and sample
LLDPE-NR/TiO2 at different amount of nanofiller at
normal condition
130
4.51 Conductivity variations for sample LLDPE-NR and sample
LLDPE-NR/MMT at different amount of nanofiller at
normal condition
131
4.52 Conductivity variations for sample LLDPE-NR and sample
LLDPE-NR/SiO2 at different amount of nanofiller after
electrical tracking test
132
4.53 Conductivity variations for sample LLDPE-NR and sample
LLDPE-NR/TiO2 at different amount of nanofiller after
electrical tracking test
133
4.54 Conductivity variations for sample LLDPE-NR and sample
LLDPE-NR/MMT at different amount of nanofiller after
electrical tracking test
133
4.55 Conductivity variations for sample LLDPE-NR and sample
LLDPE-NR/SiO2 at different amount of nanofiller after
water absorption
134
4.56 Conductivity variations for sample LLDPE-NR and sample
LLDPE-NR/TiO2 at different amount of nanofiller after
water absorption
135
4.57 Conductivity variations for sample LLDPE-NR and sample
LLDPE-NR/MMT at different amount of nanofiller after
water absorption
136
4.58 Response functions for sample LLDPE-NR and sample
LLDPE-NR/SiO2 at different amount of nanofiller at
normal condition
140
4.59 Response functions for sample LLDPE-NR and sample
LLDPE-NR/TiO2 at different amount of nanofiller at
xviii
normal condition 141
4.60 Response functions for sample LLDPE-NR and sample
LLDPE-NR/MMT at different amount of nanofiller at
normal condition 142
4.61 Response functions for sample LLDPE-NR/SiO2 at
different amount of nanofiller after electrical tracking test 143
4.62 Response functions for sample LLDPE-NR/TiO2 at
different amount of nanofiller after electrical tracking test 144
4.63 Response functions for sample LLDPE-NR/MMT at
different amount of nanofiller after electrical tracking test 145
4.64 Response functions for sample LLDPE-NR and sample
LLDPE-NR/SiO2 at different amount of nanofiller after
water absorption 146
4.65 Response functions for sample LLDPE-NR and sample
LLDPE-NR/TiO2 at different amount of nanofiller after
water absorption 147
4.66 Response functions for sample LLDPE-NR and sample
LLDPE-NR/MMT at different amount of nanofiller after
water absorption
148
4.67 Actual conductivity to weight percentage of nanofiller (wt
%) for all samples in normal condition
150
4.68 Actual conductivity to weight percentage of nanofiller (wt
%) for all samples in with effect of electrical tracking. 150
4.69 Actual conductivity to weight percentage of nanofiller (wt
%) for all samples in with effect of moisture absorption 151
4.70 Conductivity to weight percentage of nanofiller (wt %) for
all samples in normal condition after fitting 153
4.71 Conductivity to weight percentage of nanofiller (wt %) for
all samples with effect of electrical tracking 153
4.72 Conductivity to weight percentage of nanofiller (wt %) for
all samples with effect of moisture absorption 154
4.73 Actual response function to weight percentage of nanofiller
(wt %) for all samples in normal condition 156
4.74 Actual response function to weight percentage of nanofiller
(wt %) for all samples with effect of electrical tracking 157
4.75 Actual response function to weight percentage of nanofiller
(wt %) for all samples with effect of moisture absorption 157

xix
4.76 Response function to weight percentage of nanofiller (wt
%) for all samples in normal condition 159
4.77 Response Function to weight percentage of nanofiller (wt
%) for all samples with effect of electrical tracking 159
4.78 Response function to weight percentage of nanofiller (wt
%) for all samples with effect of moisture absorption 160
xx
LIST OF ABBREVIATION
Al - Aluminium
ATH - Alumina trihydrate
ASTM - American Society for Testing and Materials
BS EN - British Standard European Norm
C - Carbon
DONL - Degree of Nonlinearity
DC - Direct Current
EMAA - Ethylene/Methacrylic Acid copolymer
EDX - Energy Dispersion X-Ray
FESEM - Field Emission Scanning Electron Microscopy
HDPE - High Density Polyethylene
HV - High Voltage
IEEE - Institute of Electrical and Electronics Engineers
IPT - Inclined Plane Tracking
LabVIEW - Laboratory Virtual Instrumentation Engineering
Workbench
LC - Leakage Current
LDH - Layered Double Hydroxide
LLDPE - Linear Low- Density Polyethylene
LS - Layer Silicates
MV - Medium Voltage
MDH - Magnesium Dihydroxide
MgO - Magnesium Oxide
MMT - Montmorillonite
NR - Natural Rubber
O - Oxygen

xxi
OLTC - On-Load Tap Changer
OMMT - Organically Modified Montmorillonite
PI - Polyimide
PDC - Polarization and Depolarization Current
Si - Silicone
SEM - Scanning Electron Microscope
SMR - Standard Malaysian Rubber
Ti - Titanium
TEM - Transmission Electron Microscope
XLPE - Extruded Cross-Linked Polyethylene
XRD - X-Ray Diffraction
ZnO - Zinc Oxide
xxii
LIST OF SYMBOLS
Ip(t) - Polarization current
Id (t) - Depolarization current
U0 - Potential difference
C0 - Geometric capacitance
Cm - Measured capacitance
f(t) - Dielectric response function
σ - DC conductivity
Ɛ0 - Dielectric constant
Ɛr - Relative static permittivity
ρ - Density
wt - Weightage
xxiii
LIST OF APPENDICES
APPENDIX TITLE PAGE
A List of Publications 180
B Dielectric Response Function 184

CHAPTER 1
INTRODUCTION
1.1 Background of the Research
Nanocomposite material application in the field of dielectric and electrical
insulation has attracted many researchers’ attention recently. Polymer
nanocomposite materials were applied as insulation material since the 21st century
and were given more attention because of the material properties that can be
drastically improved by adding a few percent of nano-sized filler. This
nanocomposite can be used as nanodielectric. This material had widely been used as
power apparatuses insulator and cables insulator. Polymers nanocomposites are
made by adding nanometer sized fillers and homogenously dispersed into the matrix
of polymers composite. The filler is dispersed homogenously in the composite
matrix by a certain weight percentages (wt%). The fillers that are added to the matrix
are done in just a small quantity, typically less than about 10 wt%. Polyethylene or
epoxy resin are widely used as insulators in industrial applications as the base
material of many recent studies, while SiO2, Al2O3, MgO, TiO2 or layer silicates
(LS) and nano clay(MMT) function as typical nanofillers [1-4].
Lately, significant attention has been given into the monitoring of the
condition of electrical apparatus such as transformer, cable and rotating machine
insulation system. These equipments are important units in power system. Hence,
these equipment insulation systems should be monitored frequently to prolong the

2
equipment’s life time. For this reason, several new techniques for monitoring high
voltage (HV) equipment through its insulation have been developed in recent years.
One of these techniques is Polarization and Depolarization Current (PDC)
measurement. PDC is the time domain based techniques that are widely accepted by
many utilities due to the advancement in hardware and software interpretation
schemes [5]. Results from these techniques are severely influenced by several
environmental factors, predominantly the temperature and aging process of the
electrical insulation. Polarization and conduction phenomena occur in every
electrical insulating material. Each problem in the dielectric is produced by the
mechanism of polarization and conduction. Polarization takes place in all molecules
of a dielectric and causes chemical change or deterioration in the material.
This dielectric technique has been considered by many researchers for power
system insulations condition assessment due to its ability to provide information on
the conductivity and moisture contents. Conductivity can be estimated within the
initial periods (seconds) and the moisture content for long periods after a DC step
voltage application.
Polymer nanocomposites are the 21st century engineering materials with wide
range of markets such as transportation, electrical and electronics, food packaging
and building industries. They are particularly attractive as advanced dielectrics and
electrical insulation in the viewpoint of their inherent excellent properties.
Polymeric nanocomposites have gained importance due to their material properties
in providing enhanced performances, namely through their electrical and mechanical
properties. But until now, there are no investigations done on the conductivity and
response function in time domain of linear low-density polyethylene when it blends
with natural rubber (LLDPE-NR) nanocomposite as a new insulation.
One of the objectives of this research in the field of LLDPE-NR
nanocomposite dielectrics is to obtain new materials using improved dielectric
properties of HV insulation by adding SiO2, MMT and TiO2 nanofiller. This research

3
presents results of an experimental activity which is aimed to find the conductivity
variation and dielectric response functions of LLDPE-NR nanocomposite that was
focused on normal condition, the effect of electrical tracking and the effect of
moisture absorption. This research is focused on formulations of natural rubber
blends nanocomposites obtained from polyethylene filled with nanoparticles of SiO2,
MMT and TiO2. The conductivity and dielectric response function was done by
using Polarization and Depolarization Current (PDC) measurement technique. Study
on these parameters is required as an increasing number of power utilities nowadays
choose polymer nanocomposite as a new insulation due to its unique properties. The
study on conductivity is important in discovering how well the material can conduct
the movement of charges when there was voltage supplied to the electrode. The
lower the resistance, the greater is its conductivity because conductivity is the
inverse of electrical resistance. Response function in time domain is important to
determine how fast or slow the dipole would take to relax and return to the original
state when there was no voltage supply.
1.2 Problem Statement
Polyethylene such as linear low-density polyethylene (LLDPE) is obtained
via the copolymerization of ethylene with various alpha olefins. They have grown in
importance because of the specific properties that can be obtained by varying co-
monomer content and polymerization condition [6]. Several studies have been
conducted on the LLDPE-NR and found that the composition of 80:20 ratio has
shown to be the best composition due to the lowest carbon track development as
compared with virgin LLDPE (Piah et al., 2003). Natural rubber was used because
the nature of the interphase is found to affect viscoelasticity. It develops several
interphases with the LLDPE matrix. The current project used LLDPE-NR as base
material because it has shown significant improvement in terms of degradation due
surface tracking and moisture effect. SiO2, TiO2 and MMT nanofillers are being used
as filler because they are listed as the main nanofiller commonly used in electrical
engineering due to the increase in effective activation energy.

4
Most of the high voltage apparatus’ polymer insulation such as transformer
insulation and cable insulation face degradation due to surface tracking and water
trees aging. Faults usually occur in the bodies of oil-paper cables, high voltage
circuit breakers, surge arresters, power capacitors and transformers. One of the
factors that affect the life cycle of a electrical equipment is the operating state of its
insulation system.There are many insulation defects in power system equipment such
as the presence of partial discharging (corona) in insulator, external flashover of
bushings due to salt pollution and degradation of insulation due to ingress of
moisture and surface tracking. This project was focused on degradation condition
subjected to electrical tracking and moisture of LLDPE-NR nanocomposite because
these conditions leave the most effect on insulation properties and they can represent
outdoor aging. Carbon track is a process that takes place in the surface of insulator
due to the surface tracking phenomena. The presence of carbon in most of polymers
causes possible carbon track to occur.
Most of previous researches performed morphology studies, breakdown
strength test, space charge formation and dielectric loss test to determine the
electrical properties of polymer nanocomposite [7-9]. These studies showed physical
structure in static condition, breakdown strength and electrical strength. However,
these dielectric measurements are not adequate because they do not reveal
information on the polarization current, depolarization current and the variation
conductivity of nanocomposite under the defect of electrical tracking and under
moisture condition. Nonetheless, without the accurate information of these
parameters, it is difficult to determine the cause for the degradation of the insulator.
Condition monitoring techniques such as PDC measurement technique can be
used to predict the remaining life of the electrical apparatus and also reduce
unscheduled outages, improve maintenance planning and increase system reliability.
Analysis of the fundamental dielectric processes has shown that the polarization
phenomena are strongly influenced by the morphology and degradation of the
polymeric insulation. Therefore, research into the dielectric properties of polymer
nanocomposites based on PDC measurement would provide invaluable information
to further understand the electrical insulating performance of polymer

5
nanocomposites used in high voltage applications. PDC value is very sensitive to
moisture and electrical tracking which happen under wet contamination.
Conductivity and dielectric response of the insulating material can be determined by
using the relevant PDC technique. Response function in time domain is important to
determine the response for the dipole when it is relaxed and returned to the original
state when there is no voltage supply.
1.3 Aim and Objectives of the Research
The aim of this research is to identify the best LLDPE-NR nanocomposite
uses for HV insulation by determining the conductivity and dielectric response
function in normal condition and after degradation factors: electrical tracking and
moisture effect. In order to achieve this aim, the study was divided into three
objectives. The objectives of this research are:
i. To study the characteristics of electrical tracking test and moisture
absorption effect of the newly developed LLDPE-NR nanocomposite
materials. The effect of different weight percentages of nanofillers on
material was also investigated.
ii. To analyse the Polarization and Depolarization Current (PDC) and
conductivity trend of the newly developed LLDPE-NR nanocomposite
materials, LLDPE-NR nanocomposite effect of moisture absorption and
LLDPE-NR nanocomposite effect of electrical tracking condition.
iii. To determine the dielectric responsive function of the newly developed
LLDPE-NR nanocomposite materials, LLDPE-NR nanocomposite
effect of moisture absorption and LLDPE-NR nanocomposite effect of
electrical tracking condition.
6
1.4 Scope of the Research
This research focused on the improvement of LLDPE-NR nanocomposite
material. The scopes and limitation of this research are listed as below:
i. Insulating material that is used focused on polymer nanocomposite
material. Linear Low Density Polyethylene (LLDPE) is selected as a
base polymer and Natural Rubber (NR) grade SMR CV 60 with the
ratio composition of 80:20. LLDPE-NR is filled with a small weight
percentage of TiO2, SiO2 and MMT nanofillers.
ii. The wt % of nanofiller used are 1 wt %, 3 wt %, 5 wt % and 7 wt %.
iii. PDC testing is done on sample of the new material at the condition of:
without any defect (normal condition), wet condition (moisture
absorption) and after applied an electrical tracking condition based on
BS EN 60587:2007 standard [10].
1.5 Significance of the Study
Polymer nanocomposites possess promising high performance characteristic
as engineering materials if they are prepared and fabricated properly. Some work has
been recently done on such polymer nanocomposites as dielectrics and electrical
insulation [11]. One of the targets in this field is to obtain new materials with
improved dielectric properties for high voltage (HV) insulation application. In
general, a good insulator must have extremely low conductivity level. All the
samples have undergone degradation process of surface tracking and moisture
absorption. These conditions can represent major outdoor degradation. By
considering this condition, the conductivity performance in normal and degraded
conditions of all the samples studied can be determined.
PDC patterns of mineral oil and paper as transformers’ insulation have been
studied by many researchers [12, 13]. PDC analysis is a non-destructive dielectric

7
testing method for determining the conductivity and dielectric response function.
PDC analysis is normally used to determine the water content in the oil-paper
insulation barrier and also its oil conductivity. However, there are no investigations
on PDC done for LLDPE-NR nanocomposite. Study on the PDC pattern of LLDPE-
NR nanocomposite is required as it is a newly introduced insulation material for
electrical equipment. Others dielectric measurements are not focused on important
parameters such as information on the polarization current, depolarization current,
variation conductivity and dielectric response function of nanocomposite.
Nonetheless, without the accurate information of these parameters, it is difficult to
determine the cause for the degradation of the insulator. PDC is also very sensitive to
moisture condition. For this reason, PDC was selected as an accurate testing method
to determine the conductivity and response function in time domain.
Therefore in this work, PDC tests were performed on insulation of LLDPE-
NR nanocomposite samples at various conditions, namely the normal condition, the
moisture absorption condition and the electrical tracking effect condition. These
conditions are chosen because electrical tracking is one of the major problems in
outdoor insulation systems and it similarly occurs due to degradation of aging factor.
Effect of moisture absorption is considered as one of the major insulation
degradation cause. The amount of water content can be used to monitor the dielectric
quality of insulation and as an indicator of possible deterioration. Deterioration will
adversely affect its electrical properties and this will eventually cause dielectric
breakdown. The higher the moisture contents in the insulation, the higher the
conductivity will be.
The test data are used to find the dielectric responsive function and maximum
conductivities of LLDPE-NR nanocomposite. PDC is carried out to find the
dielectric responsive function and trend of this material conductivities level based on
the test conditions. In order to estimate the dielectric response function f(t) from a
depolarization current measurement, it is assumed that the dielectric response
function is a continuously decreasing function in time, then if the polarization period
is sufficiently long, as in ( )cf t t ≅0, the dielectric response function f(t) is
proportional to the depolarization current.

8
1.6 Thesis Organisation
The present thesis consists of six chapters. Chapter One provides an
introduction to the problem statement, objectives, scope of the research and
significance of the research. Chapter Two outlines the literature review which covers
topic of polymer nanocomposite, DC conductivity and moisture content of polymer
nanocomposite, dielectric response, Polarization and Depolarization Current (PDC)
and electrical tracking. Chapter Three outlines some of the test methods used to
investigate the performance of insulation materials. Detailed explanation of
experimental setup, procedure and technique employed in this research include
material preparation, morphological test, capacitance test, polarization and
depolarization current test and electrical tracking test. In Chapter Four, all
experimental results are presented and discussed. Chapter Five consists of
maximum conductivity and response function analysis. Finally, Chapter Six draws
conclusions and makes recommendations for future research.

CHAPTER 2
LITERATURE REVIEW
2.1 Introduction
In this chapter, key subjects that are related to this research are summarised,
firstly by providing an outline of the history of polymer nanocomposite, then
focusing on the electrical properties and literature on polymer nanocomposite for
high voltage insulation. This chapter also reviews the Polarization and
Depolarization Current (PDC) measurement technique and electrical tracking effect
on insulation, moisture effect on insulation and polymer nanocomposite, theories,
technologies and research done which are briefly explained and discussed thereafter.
This part presents comprehensive review and analysis on conductivity value based
on the experimental results from previous researchers to find patterns and trends of
the test material. The review and analysis from previous researches and studies on
current and conductivity using different methods and samples are also compared.
2.2 Polymer Nanocomposite
In the 1990s, the commercialisation of Polyamide 6/clay nanocomposite that
was manufactured as engineering plastics by applying polymer nanocomposite for
engineering level has encouraged researchers to study the possibility of combining
different polymers with different nano inorganic fillers. Since then, much effort has
been made to develop and apply polymer nanocomposites in electrical and
10
electronics engineering, transportation, food package and industries. Polymer
nanocomposites which are newly developed advanced materials have wide
application potential [11].
Nanodielectrics for the electrical insulation field have commenced in year
1994 when John Lewis published a paper entitled “Nanometric Dielectrics” in a
publication titled IEEE Transactions on Dielectrics and Electrical Insulation [14].
The role of nanometric interfacial processes in initiating electrical breakdown in
insulating materials has gained much attention since. Studies showed that the
attainment of equilibrium or a steady state in the interface of dielectric and
conductive is a requirement. In general that charge is transported towards or away
from it through the bulk phases on either side that depend on their electrical
conductivities. If one or both possess a highly insulating characteristic, the time to
achieve this attainment can be exceedingly long [14].
In 2002, first experimental data were produced on nanometric dielectrics by a
researcher [15]. It was proved that nanometric fillers mitigate the interfacial
polarization characteristic of conventional materials and hence, the internal field
accumulation was reduced. Large interaction zone in reduced mobility (free volume)
nanofilled polymers should lead to a significant change in electrical properties.
Studies of electrical behaviour thus have provided an opportunity for both a
fundamental study of this interaction zone, as well as an opportunity for optimising
performance for specific and critical applications. Nanotechnology was overviewed
with a focus on material potentialities, implications and development which
concluded that a new class of materials, nanodielectrics, is emerging [16].
Since 2002, some works that have been done in IEEE focusing particularly
on nanocomposite. Several reviews were made on polymer nanocomposites for
electrical insulation and high voltage dielectric application. A multi-core model
which has a far-distance effect and is closely related to an “interaction zones” was
proposed by considering electrical and chemical structures mesoscopic analysis of an
existing interface with finite thickness [11]. To have a deeper understanding of

11
nanodielectrics in general, further studies were done toward future research and
development of the material [17].
The second generation resins that are used in insulation engineering are
called polymer nanocomposites. These materials consist of polymers that are filled
with many micron-sized inorganic fillers in the order of 50 wt%. The recently
produced polymer composites can be defined as a small amount of nanofillers that
fill in a substance of polymers. The size of the nanofillers varies from 1 to 100 nm,
while the content varies from 1 to 10 wt%. Nanofillers should be dispersed in the
polymer matrix homogeneously. Although nanofillers have a small content
percentage (low wt %), they possess very large surface areas if compared to those of
microfillers [11]. These newly developed polymer nanocomposite advanced
materials have a wide application in food packaging, building, electrical and
electronics engineering, transportation and other fields of industries. The materials
are used in application of coating materials, foamed materials, barrier-functional
materials, and flame-retardant materials. The most used product in the market is
polyolefin.
When polymer nanocomposite can change one or several of its dielectric
properties, it can be used as nanodielectric [18]. Nanodielectric is widely used in
rotating machine insulations, HV cables, solid insulation in switchgear, and outdoor
insulation for power electronic devices packaging. Besides that, it is also used in
rotating machine insulations [19]. It has been proved that nano-sized filler improved
the material dielectric properties for power system insulation application [20].
A lot of research was conducted to study the polymer nanocomposite
dielectric properties [21-27]. Most of these studies focused on epoxy nanocomposite
which has different nanofiller influencing the dielectric properties. Most of these
researchers measured electrical properties of the material such as resistivity of dc
volume, strength of ac dielectric, permittivity of dielectric and tan delta (400 Hz - 1
MHz). Results from these studies showed the dielectric behaviours of
nanocomposites. It was also found that some electrical properties of these materials
are unique and very useful to be used in existing and potential electrical systems at
12
certain loadings of nanoparticle. Ar [28] has performed dielectric strength, volume
resistivity and surface resistivity testing on HDPE clay nanocomposite based on
ASTM D149 and ASTM D257 standards. Observation showed that there was
significant improvement in nanoclay when organoclay was treated with titanate and
silane compounds. Nanofiller mixture composite can greatly improve the discharge
surface resistance and breakdown strength of insulation [29, 30]. According to [31],
from various nanoparticulates, clay minerals and carbon nanotubes are more
preferable and often used to enhance physical, mechanical and thermal properties of
polymers. In terms of material, the four main groups that were significantly used in
nanocomposite for electrical engineering are silicone oxides (silica), metallic oxides
and hydroxides (Al2O3, TiO2, MgO, ZnO etc), nanoclays (Montmorillonite, hectorite
etc) and carbon nanotubes [4, 32]. Pettarin et al. [33] in their testing prepared their
base material with high-density polyethylene (PE), an organically modified
montmorillonite (OMMT), while ethylene/methacrylic acid copolymer (EMAA) was
used to melt compounding. The composites morphology was examined by XRD,
SEM and TEM and the mechanical properties were evaluated under static
conditions.
Another research [34] used morphology and thermal stabilisation mechanism
to study LLDPE/MMT and LLDPE/LDH nanocomposites. The research found that
all nanocomposites show significantly enhanced thermal stability compared to virgin
LLDPE due to the increase of effective activation energy during the degradation
process. According to [35], the dynamic mechanical properties of LLDPE/nano-SiO2
composites were improved compared with the corresponding value for
LLDPE/untreated SiO2 composites. Some researchers conducted studies on silica
nanopartices as insulators [3, 30, 35-38]. Researcher [39] performed morphology,
water treeing and electrical behaviour test on a linear low density polyethylene
(LLDPE) with silica nanoparticles surface treatment. This research found that
samples with silane-treated nanoparticles have improved the dielectric properties
compared to the unsurface-treated sample. Researchers [40] developed
nanocomposites formed from isotactic polypropylene (iPP) filled with MMT. Thus,
this material is regarded as a candidate for power cable insulation material with

13
enhanced properties. The research found that, the material has increased loss factor
and permittivity compared to unfilled iPP.
2.3 DC Conductivity of Polymer Nanocomposite
Extensive studies on polymer nanocomposites for HV insulation were
conducted in these recent years because it has unique properties and able to enhance
electrical performance. Polymer nanocomposites electrical conduction is used as one
of the components to monitor its dielectric behaviour. Many studies were done to
investigate the electrical properties of this material, such as strength of electric
breakdown, resistance of partial discharge, space charge and conduction current
measurement [9, 41-43].
The result shows that DC conductivity exhibits significant reduction with the
addition of any type of nanofiller in a certain amount. However exact percentage of
the nanofiller addition is not the same for different types of base materials. This was
due to the decreasing of initiation probability of short circuit treeing in each material.
The conductivity analysis done found that the addition of nanofiller into the polymer
at certain percentage has improved its insulation properties.
Ciuprina and Plesa conducted a research on DC conductivity and the
variation of the real part of complex conductivity with the frequency for three
formulations of nanocomposites obtained from polyethylene filled with
nanoparticles of Al2O3, SiO2 and TiO2 [41]. Three types of polyethylene
nanocomposites were prepared by researchers [41] with nanofillers of SiO2, TiO2
and Al2O3. Nanoparticles content of the tested formulations were recorded at 2, 5
and 10 wt%. The average diameter of the nanoparticle for Al2O3 was 40 nm while for
SiO2 and TiO2, the average diameter was 15 nm.
Similar research were also conducted by [42] on electrical conduction at
various applied electric fields. It was found that the conduction current shows a

14
minimum reading at a 1% b.w. concentration nano alumina particle. Researchers [9,
43] studied DC conduction of MgO/LDPE nanocomposite. Through the DC
conduction pattern, they found that the addition of MgO nanofiller leads to the
improvement of DC electrical insulating properties of LDPE.
Researchers [42] have studied the electrical conduction processes in linear
low density polyethylene (LLDPE) filled with nano alumina particles. LLDPE used
in this study is a commercial linear low density polyethylene from Atofina. It has a
density of 0.934 g/cm3 at a melt index of 0.87 g/10 min. Nanoparticles of aluminium
oxide from Degussa with a particle size of about 13 nm was used as filler.
Researchers [9, 43] studied DC conduction of MgO/LDPE nanocomposite.
The employed polymer was LDPE mixed with MgO nanofiller. MgO nanofiller has
an average diameter of tens of nm. MgO nanofiller went through surface treatment
with a silane coupling agent, and then treated with the jet grinding treatment before
kneading is done. High concentration of MgO nanofiller master batch was prepared
first by the twin-screw extruder.
Researchers [44] studied surface potential decay and dc conductivity of TiO2-
based Polyimide Nanocomposite Films. In-situ dispersion polymerization process
with a thickness of 70 μm was used to prepare Polyimide/TiO2 (PI/TiO2)
nanocomposite films containing surface modified nano-TiO2 particles by employing
silane coupling agent. Researcher [38] found that, the conduction via electron
tunnelling will occur between polymer-covered particles under the influence of an
electric field only within the range of 1 - 4 nm. Due to the large surface area of the
nanofiller, conductive pathways throughout the composite can be lead [45].
2.3.1 Conduction Current Measurement System
Figure 2.1 shows the electrode configuration and the experimental setup for
the conduction current measurement used by [9, 43]. A gold electrode of 40 mm in

15
diameter was formed by vacuum evaporation on one side of the film. On the other
side, a gold electrode of 26 mm in diameter was formed as the main electrode and a
gold electrode consisting of 32 mm in inner diameter and 40 mm in outer diameter
was formed as the guard electrode. The conduction current measurement was
performed at 303 Kelvin at room temperature. The conduction current at 10 min
after the DC voltage application was employed to determine the volume resistivity.
Figure 2.1: Conduction current measurement system [9, 43, 46]
Researchers [44] have done the DC conductivity test in the oven, with 20 mm
diameter gold electrodes on both sides at 6.5 kV for 1 hour. The testing temperature
was fixed at 30 °C to avoid the influence of small temperature fluctuation in the
room on measured current [44].
Both conduction current measurements set up by researchers [9, 43] and
researcher [44] showed different DC measurement setup with different electrode
configuration. The injected voltage and measurement period also differed from both
experiments. Even though there are some differences, results from both experiments
can be used to determine the DC conductivity of the samples.

16
2.3.2 Current and Conduction Analysis
Current and conductivity had been applied by many researchers to study the
best concentration percentage of nanofiller. Researcher [44] measured current for the
TiO2 based polyimide nanocomposite at different added % amounts and these values
are shown in Figure 2.2. From the results, 3% is seen to possess the best insulation
property, 1% is slightly better than 5%, while 7% is noted to be the worst. It can be
concluded that adding nanoparticles into dielectrics can improve their electrical
properties. However, different amount of nanofillers will yield different results.
Larger amount of nanofiller can create agglomeration inside a material which can
contribute to larger overlapping interaction zone. This will cause the charge moving
increase when the content of nanofiller is increased. As 1% and 3% samples reduce
the conductivity to the lowest point, it can be known that a small amount of
nanofillers is separated inside the dielectric with a certain wide distance, which can
be known as extra traps for the dielectric, and therefore improve the insulation
property [44]. These nanofillers will fill the empty zones inside the material which
can contribute to function as the extra trapping mechanism for the dielectric.
Nanofillers may align together and help charge moving inside the material.
However, if more nanoparticles are added into the dielectrics, for example, a
5% sample has better insulation property than a pure sample, but its conductivity is
higher than 1% and 3% samples. This is because some of the nanofillers are too
close to each other, and each nanoparticle has an interaction zone around it, which
results to some overlap within the interaction zones. For the 7% sample or higher
amount nano dielectrics, the probability of interaction zones overlap is higher, and
therefore, the nanoparticles may align with each other, which help the charges to
move across the dielectric [44].

17
Figure 2.2: Current for TiO2 based polyimide nanocomposite at different % amount added
[44]
Figure 2.3 shows the influence of the MgO nanofiller content on the volume
resistivity under the field application of 40 or 80 kV/mm. The volume resistivity was
calculated by multiplying the applied field and the main electrode area to the
reciprocal of conduction current. The open sign is each value of three measurements
is in each condition. The volume resistivity of the film with MgO nanofiller under
each applied field was higher than that without MgO nanofiller. Above the MgO
nanofiller content of 1 or 2 phr, the volume resistivity of the film with MgO
nanofiller showed a saturated value [9, 43].

18
Figure 2.3: The influence of the MgO nano-filler content on the volume resistivity [9, 43]
Figure 2.4 shows I-V characteristic in alumina nanoparticles filled LLDPE
samples. The conduction current in PE-1 sample is lower than the sample without
any alumina nanoparticles. This means that the addition of a small amount of
alumina hinters the movement of charge in the bulk of the material. As the amount
of alumina increases the conduction current in PE-5 increases significantly compared
to PE-0. The conduction current in PE-10 sample shows significant reduction at
lower voltages but becomes very high once the applied voltage exceeds 5 kV [42].

19
Figure 2.4: I - V characteristics in alumina nanoparticles filled LLDPE samples at 20°C
[42]
Based on the research output highlighted earlier, it can be concluded that DC
conductivity measurement can be used to compare nano dielectrics properties.
Different types of nanofiller and the percentage of concentration will result to
different values of current and conductivity. The conduction current increases when
the filler content increase up to certain wt%. The presence of nanofillers influences
the conduction, especially for high electric fields [46]. Besides, the volume
resistivity of LDPE can be increased by addition of MgO nanofiller.
2.4 Moisture Absorption in Polymer Nanocomposite
Some research was done to study the moisture absorption of nanocomposite
polymer at different level of water content [38, 47-49]. They discussed how water
absorption by nanofillers can significantly affect the material’s electrical properties.
Researchers [50, 51] conducted tests for thermal properties, moisture absorption and
dielectric properties of pure epoxy and epoxy composites with micron-sized and
nano-sized filler. The test results found that nanocomposite studied has a higher
moisture absorption compared with microcomposite. These results were based on the
20
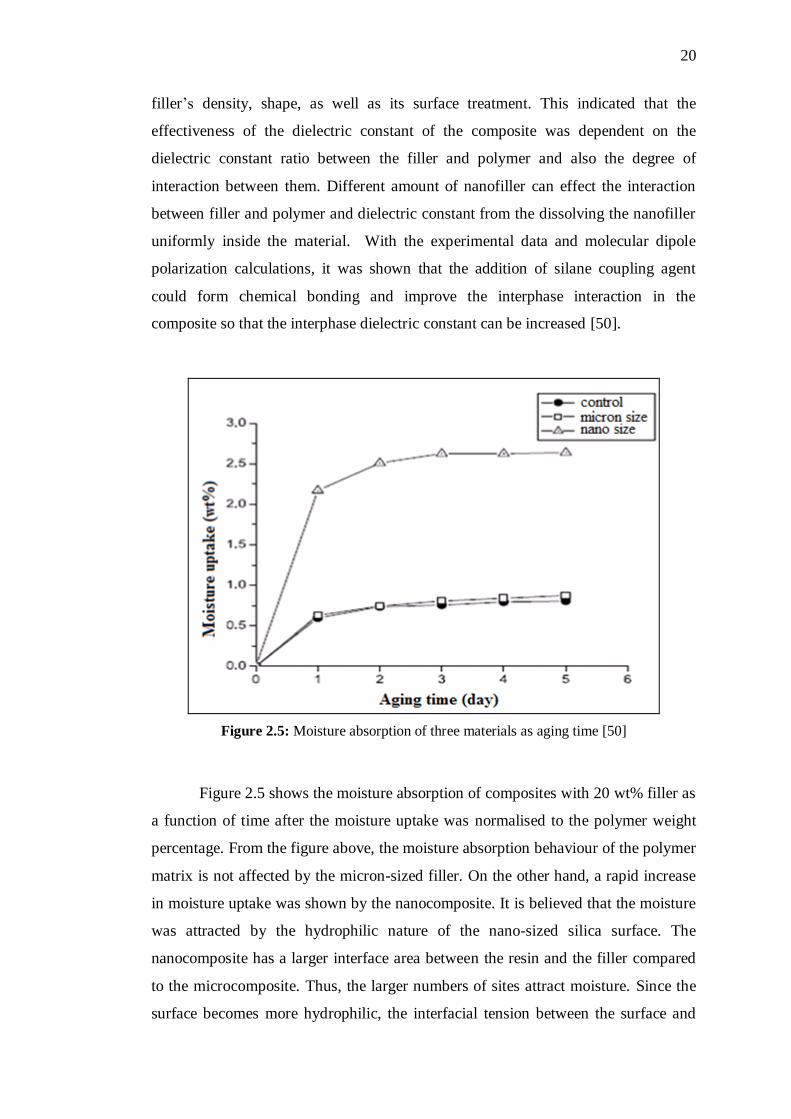
filler’s density, shape, as well as its surface treatment. This indicated that the
effectiveness of the dielectric constant of the composite was dependent on the
dielectric constant ratio between the filler and polymer and also the degree of
interaction between them. Different amount of nanofiller can effect the interaction
between filler and polymer and dielectric constant from the dissolving the nanofiller
uniformly inside the material. With the experimental data and molecular dipole
polarization calculations, it was shown that the addition of silane coupling agent
could form chemical bonding and improve the interphase interaction in the
composite so that the interphase dielectric constant can be increased [50].
Figure 2.5: Moisture absorption of three materials as aging time [50]
Figure 2.5 shows the moisture absorption of composites with 20 wt% filler as
a function of time after the moisture uptake was normalised to the polymer weight
percentage. From the figure above, the moisture absorption behaviour of the polymer
matrix is not affected by the micron-sized filler. On the other hand, a rapid increase
in moisture uptake was shown by the nanocomposite. It is believed that the moisture
was attracted by the hydrophilic nature of the nano-sized silica surface. The
nanocomposite has a larger interface area between the resin and the filler compared
to the microcomposite. Thus, the larger numbers of sites attract moisture. Since the
surface becomes more hydrophilic, the interfacial tension between the surface and

21
water is reduced [4]. And finally, the increased polymer dynamics in the
nanocomposite also helps the moisture diffusion. The particles with spherical shape
have a surface constituted of hydroxyl [32]. This can contribute to higher moisture
absorption.
2.5 Polarization and Depolarization Current (PDC)
Polarization and Depolarization Current (PDC) test were used to monitor
condition of many electrical apparatus such as machine stator, transformer and
power cables. PDC measurement with time domain polarization based technique is
widely accepted by many utilities due to the advancement in hardware and software
interpretation schemes [5]. Also this technique is very useful for estimating the
conductivity and moisture contents of the insulations. PDC test was used for the
maintenance and diagnostic tests periodically conducted on machine stator insulation
systems to continuously monitor both charge and discharge current during a step
voltage test [52, 53].
Researcher [54] has applied the PDC analyser for the insulation assessment
of power cables since 2002. He found that the most advantageous aspect of this
technique is its easy identification between “conduction” and “polarization”
phenomena in a dielectric. Researches [55-57] applied PDC technique for XLPE
insulation that was subjected to wet aging. These testing were done using AVO
Megger S1-5010 at the medium voltage (MV) underground power cables with
extruded cross-linked polyethylene (XLPE) insulation. Furthermore, there was a
research done to describe the polarization and depolarization current responses from
XLPE cable insulation with and without water trees [55]. This researcher used
apparent conductivity which was based on difference between polarization and
depolarization currents and degree of nonlinearity factor which is the ratio of
apparent conductivity at different voltage as the parameter to determine the condition
of the cables. From the results obtained, it showed that the difference of polarization
and depolarization current is proportional to the conductivity of the insulation and

22
can therefore be as a first indicator of insulation aging. Conductivity is the ability of
the material to conduct an electric current. Equation (2.4) shows that PDC value is
proportional to conductivity. The higher is the difference between these currents or
the higher the conductivity, the greater is the degradation of the cable insulation [56].
Researchers [58, 59] too assessed the insulation condition of an underground cable
by measuring its polarization and depolarization currents. PDC measurements can be
used to determine the severity of insulation degradation. The level of the
conductivity can represent the severity of degradation in term of moisture
absorption. A higher content of moisture absorption can yield to a higher level of
conductivity. This is because PDC is very sensitive to moisture content and outdoor
degradation. Polarization and conduction phenomena occur in every electrical
insulating material.
Research also has been conducted by [60] on PDC analysis for power
transformer. The scope of the analysis was not only limited to insulation between
windings, but also on insulation systems of winding-to-ground. Sometimes this can
reveal trouble in the transformer accessories, such as on-load tap changer (OLTC)
which focuses on water and contaminant in a new OLTC, moisture and surface
humidity and free water in a refurbished transformer. This technique had also been
already applied as a quality assurance tool for the assessment of refurbishment
efficiency of power transformers by researcher [61] and moisture assessment of
transformer bushings by researchers [62]. Estimation of water content and
conductivity in a power transformer that is focused on paper insulation also were
done using PDC measurement by researcher [12, 63-72]. Moisture and aging
strongly influence the dielectric properties of oil-paper insulation system of power
transformer. Moisture accelerates the aging process in the oil-paper insulation of the
transformer. PDC analysis was also done by researcher [73 and 74] on the influence
of thermal transients and thermal runaway of oil-paper insulation. These researches
were done to identify and locate overheating/thermal fault in the transformer solid
insulation using PDC analysis [75]. There was also research done on paper oil
insulation under conditions of copper corrosion using PDC technique [76].
23
The PDC patterns of mineral oil, biodegradable oil and paper as transformer
insulations were studied by many researchers such as [12, 13, 63]. Researches [13,
68, 73, 74, 77, 78] were done to investigate the moisture content and conductivity of
the oil insulation that is focused on transformer oil. There was also research carried
out to find the dielectric responsive function and maximum conductivities of
biodegradable and mineral transformer oils with different moisture levels (dry,
normal, or wet) for comparative analysis by researcher [12]. This research examined
the condition of the insulation oils at different moisture levels. Comparison on oils
conductivity level (σ) and measured capacitance value (Cm) in each condition with
the PDC fingerprint of the oils during the initial installation was done. The trends of
the PDC response were found to be different for those two insulation oils. They
extended the research for faults identification of biodegradable oil-filled
transformers by comparing them with the PDC pattern [79]. The PDC technique
provides significant information that can be used in the evaluation of the transformer
condition. Each fresh insulation oil has its own unique PDC fingerprint response
[12].
Polarization and depolarization currents analysis were done in biodegradable
polymers that can be used in electrical apparatus and cable [80]. For instance, one
research presented and discussed the data on polarization and depolarization
characteristics of thermally degraded epoxy mica composites [81]. Besides,
researchers [82] obtained conduction currents results using PDC for epoxy resin
nanocomposites. A DER 332 epoxy resin was chosen as matrix and nanosilica and/or
Boron Nitride were chosen as fillers. They obtained the dielectric response in the
frequency domain.
Other researches were done to monitor insulation condition on transformer
oil, XLPE cable insulation, rotating machines insulation and biodegradable polymers
using PDC test. Similarly, a lot of research were done on application of PDC
technique in assessing the conductivity and moisture content of the insulation of the
electrical equipment. These studies examined the effects of moisture level, aging and
water trees of the insulation.
24
In conclusion, the PDC method is a simple and reliable technique based on
time domain analysis to monitor HV insulation systems. From the PDC results,
dielectric responsive function of each sample was determined to examine the
dielectric response based on time domain. This is a natural response of the material
itself due to the depolarization current that was measured from the sample.
In this research, PDC measurement was performed on polymer
nanocomposite as an insulating material at various conditions. The viability and
reliability of the PDC method in providing information on the conductivity and
moisture content of polymer nanocomposite has not been explored and done before,
and thus it was investigated in this research.
2.5.1 Basic Principle of PDC
The measurement principle of polarization and depolarization current is
based on applications of DC voltage across the test object for a long time. According
to [41], the test voltage at 500 V has led to satisfactory results on measurement
performed on LDPE nanocomposite for DC conductivity. Most of the researchers in
PDC testing used 1000 V in the same test with duration of 10,000 seconds. During
the test time, the current arising from the activation of the polarization process with
different time constant that corresponded to different insulation materials due to the
conductivity of the object was measured. Then the voltage was removed and the test
object was short circuited. The activated polarization process then gave rise to the
discharging current in the opposite direction, where no contribution of the
conductivity was present. The charging and discharging currents were influenced by
the properties of the insulating materials as well as by the geometric structure of the
insulating system.
According to [12, 13, 52, 83, 84], polarization and depolarization currents
measurement can be used to investigate the polarization process of a dielectric
material in the time domain analysis. The test object can be a single dielectric
REFERENCES
1. Daran-Daneau, C., David, E., Frechette, M. F. and Savoie, S.: Influence of
the surrounding medium on the dielectric strength measurement of
LLDPE/clay nanocomposites. In: Electrical Insulation (ISEI), Conference
Record of the 2012 IEEE International Symposium on. 2012.
2. David, E., Daran-Daneau, C., Frechette, M. F., Zazoum, B., Ngo, A. D. and
Savoie, S.: Dielectric response of LLDPE/Clay nanocomposite melt
compounded from a masterbatch. In: Electrical Insulation (ISEI), Conference
Record of the 2012 IEEE International Symposium on. 2012.
3. Tanaka, T., Bulinski, A., Castellon, J., Frechette, M., Gubanski, S.,
Kindersberger, J., Montanari, G. C., Nagao, M., Morshuis, P., Tanaka, Y.,
Pelissou, S., Vaughan, A., Ohki, Y., Reed, C. W., Sutton, S. and Han, S. J.:
Dielectric properties of XLPE/SiO2 nanocomposites based on CIGRE WG
D1.24 cooperative test results. Dielectrics and Electrical Insulation, IEEE
Transactions on, 2011. 18(5): p. 1482-1517.
4. Andritsch, T., Fabiani, D.and Ramirez Vazquez, I.: Nanodielectrics-examples
of preparation and microstructure. Electrical Insulation Magazine, IEEE,
2013. 29(6): p. 21-28.
5. Ekanayake, C., Saha, T. K., Ma, H. and Allan, D.:Application of polarization
based measurement techniques for diagnosis of field transformers. In: Power
and Energy Society General Meeting, 2010 IEEE.
6. Owpradit, W., and Jongsomjit, B.: A comparative study on synthesis of
LLDPE/TiO2 nanocomposites using different TiO2 by in situ polymerization
with zirconocene/dMMAO catalyst. In: Materials Chemistry and Physics,
2008. 112(3): p. 954-961.
7. Andritsch, T., Kochetov, R., Lennon, B., Morshuis, P. H. F. and Smit, J. J. :
Space charge behavior of magnesium oxide filled epoxy nanocomposites at
different temperatures and electric field strengths. In: Electrical Insulation
Conference (EIC), 2011. 2011.
8. Fabiani, D., Montanari, G.C, and Testa, L.: Effect of aspect ratio and water
contamination on the electric properties of nanostructured insulating
materials. In: Dielectrics and Electrical Insulation, IEEE Transactions on.
17(1): p. 221-230.
169
9. Masuda, S., Okuzumi, S., Kurniant, R., Murakami, Y., Nagao, M., Murata,
Y. and Sekiguchi, Y.: DC conduction and electrical breakdown of
MgO/LDPE nanocomposite. in Electrical Insulation and Dielectric
Phenomena, 2007. In: CEIDP 2007. Annual Report - Conference on. 2007.
10. British Standard. Electrical insulating materials used under severe ambient
conditions — Test methods for evaluating resistance to tracking and erosion.
B.EN 60587:2007.
11. Tanaka, T: Dielectric nanocomposites with insulating properties. In:
Dielectrics and Electrical Insulation, IEEE Transactions on, 2005. 12(5): p.
914-928.
12. Muhamad, N. A., Phung, B. T., Blackburn, T. R. and Lai, K. X.: Polarization
and Depolarization Current (PDC) tests on biodegradable and mineral
transformer oils at different moisture levels. In: Power Engineering
Conference, 2009. AUPEC 2009. Australasian Universities. 2009.
13. Saha, T.K , and Purkait, P.: Investigation of polarization and depolarization
current measurements for the assessment of oil-paper insulation of aged
transformers. Dielectrics and Electrical Insulation, IEEE Transactions on
2004. 11(1): p. 144-154.
14. Lewis, T.J: Nanometric dielectrics. Dielectrics and Electrical Insulation,
IEEE Transactions on 1994. 1(5): p. 812-825.
15. Nelson, J. K., Fothergill, J. C., Dissado, L. A. and Peasgood, W.: Towards an
understanding of nanometric dielectrics. in Electrical Insulation and
Dielectric Phenomena. 2002 Annual Report Conference on. 2002.
16. Frechette, M. F., Trudeau, M., Alamdari, H. D. and Boily, S.: Introductory
remarks on nanodielectrics. In: Electrical Insulation and Dielectric
Phenomena, 2001 Annual Report. Conference on. 2001.
17. Frechette, M. F., Trudeau, M., Alamdari, H. D. and Boily, S.: Introductory
remarks on nanodielectrics. Dielectrics and Electrical Insulation, IEEE
Transactions on, 2004. 11(5): p. 808-818.
18. Fre, X and Chette, M. F.: What Are Nanodielectrics? Electrical Insulation
Magazine, IEEE, 2013. 29(6): p. 8-11.
19. Cherney, E.A: Nanodielectrics applications-today and tomorrow. Electrical
Insulation Magazine, IEEE, 2013. 29(6): p. 59-65.
20. Krivda, A., Tanaka, T., Frechette, M., Castellon, J., Fabiani, D., Montanari,
G. C., Gorur, R., Morshuis, P., Gubanski, S., Kindersberger, J., Vaughn, A.,
Pelissou, S., Tanaka, Y., Schmidt, L. E., Iyer, G., Andritsch, T., Seiler, J. and
Anglhuber, M.: Characterization of epoxy microcomposite and
nanocomposite materials for power engineering applications. Electrical
Insulation Magazine, IEEE, 2012. 28(2): p. 38-51.

170
21. Singha, S. and Thomas, M. J.: Dielectric properties of epoxy
nanocomposites. Dielectrics and Electrical Insulation, IEEE Transactions
on, 2008. 15(1): p. 12-23.
22. Zhang, C., Mason, R. and Stevens, G. C.: Dielectric properties of epoxy and
polyethylene nanocomposites. In: Electrical Insulating Materials, 2005.
(ISEIM 2005). Proceedings of 2005 International Symposium on. 2005.
23. Roy, M., Nelson, J. K., Maccrone, R. K., Schadler, L. S., Reed, C. W. and
Keefe, R.: Polymer nanocomposite dielectrics-the role of the interface.
Dielectrics and Electrical Insulation, IEEE Transactions on, 2005. 12(4): p.
629-643.
24. Iyer, G., Gorur, R. S., Richert, R., Krivda, A. and Schmidt, L. E.: Dielectric
properties of epoxy based nanocomposites for high voltage insulation.
Dielectrics and Electrical Insulation, IEEE Transactions on, 2011. 18(3): p.
659-666.
25. Katayama, J., Ohki, Y., Fuse, N., Kozako, M. and Tanaka, T: Effects of
nanofiller materials on the dielectric properties of epoxy nanocomposites.
Dielectrics and Electrical Insulation, IEEE Transactions on, 2013. 20(1): p.
157-165.
26. Ning, G., Jing, Z., Liwei, L., Taiming, Z. and Xiaohong, Z.: Effect of
interface polarization on dielectric properties in nanocomposite compounded
with epoxy and montmorillonite. In: Solid Dielectrics (ICSD), 2013 IEEE
International Conference on. 2013.
27. Rashmi, Renukappa, N. M., Swaminathan, G. and Siddaramaiah.:
Experimental investigation of the influence of clay on dielectric properties of
epoxy nanocomposites. In: Properties and Applications of Dielectric
Materials, 2009. ICPADM 2009. IEEE 9th International Conference on the.
2009.
28. Shah, K. S., Jain, R. C., Shrinet, V., Singh, A. K. and Bharambe, D. P.: High
Density Polyethylene (HDPE) Clay Nanocomposite for Dielectric
Applications. Dielectrics and Electrical Insulation, IEEE Transactions on,
2009. 16(3): p. 853-861.
29. Imai, T., Sawa, F., Nakano, T., Ozaki, T., Shimizu, T., Kozako, M. and
Tanaka, T.: Effects of nano- and micro-filler mixture on electrical insulation
properties of epoxy based composites. Dielectrics and Electrical Insulation,
IEEE Transactions on, 2006. 13(2): p. 319-326.
30. Li, Z., Yi, Y., Yaqun, W. and Pingkai, J.: The effect of filler concentration on
slow polarization in LDPE/SiO2 mocro- and nanocomposites. In: Electrical
Insulating Materials, 2008. (ISEIM 2008). International Symposium on.
2008.
171
31. Kumar, A. P., Depan, D., Singh Tomer, N. and Singh, R. P.: Nanoscale
particles for polymer degradation and stabilization--Trends and future
perspectives. Progress in Polymer Science, 2009. 34(6): p. 479-515.
32. Reed, C.W: Polymer Nanodielectrics-Basic Concepts. Electrical Insulation
Magazine, IEEE, 2013. 29(6): p. 12-15.
33. Pettarin, V., Frontini, P. M., Pita, V. J. R. R., Dias, M. L. and Diaz, F. V.:
Polyethylene/(organo-montmorillonite) composites modified with
ethylene/methacrylic acid copolymer: Morphology and mechanical
properties. Composites Part A: Applied Science and Manufacturing, 2008.
39(12): p. 1822-1828.
34. Qiu, L., Chen, W. and Qu, B.: Morphology and thermal stabilization
mechanism of LLDPE/MMT and LLDPE/LDH nanocomposites. Polymer,
2006. 47(3): p. 922-930.
35. Huang, Y., Jiang, S., Wu, L. and Hua, Y.: Characterization of LLDPE/nano-
SiO2 composites by solid-state dynamic mechanical spectroscopy. Polymer
Testing, 2004. 23(1): p. 9-15.
36. Yi, Y., Jiandong, W., Li, L., Xuguang, L. and Qiaohua, W.: Effect of
nanosilica grain size on the trap density distribution in LDPE/silica
nanocomposite. In: Solid Dielectrics (ICSD), 2013 IEEE International
Conference on. 2013.
37. Chaichana, E., Jongsomjit, B. and Praserthdam, P.: Effect of nano-SiO2
particle size on the formation of LLDPE/SiO2 nanocomposite synthesized via
the in situ polymerization with metallocene catalyst. Chemical Engineering
Science, 2007. 62(3): p. 899-905.
38. Chen, Z, Fothergill, J.C, and Rowe, S.W: The effect of water absorption on
the dielectric properties of epoxy nanocomposites. Dielectrics and Electrical
Insulation, IEEE Transactions on, 2008. 15(1): p. 106-117.
39. Xingyi H, Fei, L., and Pingkai, J.: Effect of nanoparticle surface treatment on
morphology, electrical and water treeing behavior of LLDPE composites.
Dielectrics and Electrical Insulation, IEEE Transactions on. 17(6): p. 1697-
1704.
40. Izci E, and Bowler, N.: Dielectric properties of isotactic polypropylene and
montmorillonite nanocomposites. In: Solid Dielectrics (ICSD), 2010 10th
IEEE International Conference on. 2010.
41. Ciuprina F, and Plesa, I.: DC and AC conductivity of LDPE nanocomposites.
In: Advanced Topics in Electrical Engineering (ATEE), 2011 7th
International Symposium on. 2011.
42. Chen, G., Sadipe, J. T., Zhuang, Y., Zhang, C. and Stevens, G. C.:
Conduction in linear low density polyethylene nanodielectric materials. In:
172
Properties and Applications of Dielectric Materials, 2009. ICPADM 2009.
IEEE 9th International Conference on the. 2009.
43. Murakami, Y., Nemoto, M., Okuzumi, S., Masuda, S., Nagao, M., Hozumi,
N. & Sekiguchi, Y.: DC conduction and electrical breakdown of MgO/LDPE
nanocomposite. Dielectrics and Electrical Insulation, IEEE Transactions on,
2008. 15(1): p. 33-39.
44. Zhuang Y, J Zha, and Chen, G.: Surface potential decay and dc conductivity
of TiO2-based polyimide nanocomposite films. In: Electrets (ISE), 2011 14th
International Symposium on. 2011.
45. Fabiani D, Montanari, G.C, and Testa, L.: Effect of aspect ratio and water
contamination on the electric properties of nanostructured insulating
materials. Dielectrics and Electrical Insulation, IEEE Transactions on, 2010.
17(1): p. 221-230.
46. Castellon, J., Ramirez Vazquez, I., Fre, X, Chette, M. and Fabiani, D.:
Nanocomposite characterization and diagnostics tools. Electrical Insulation
Magazine, IEEE, 2013. 29(6): p. 37-48.
47. Lau, K. Y., Vaughan, A. S., Chen, G. and Hosier, I. L.: Dielectric response of
polyethylene nanocomposites: The effect of surface treatment and water
absorption. In: Electrical Insulation and Dielectric Phenomena (CEIDP),
2012 Annual Report Conference on. 2012.
48. Bernier, S., Drapeau, J. F., Jean, D. and David, E.: The effect of water ingress
on dielectric properties of polyethylene cable insulation. In: Electrical
Insulation (ISEI), Conference Record of the 2012 IEEE International
Symposium on. 2012.
49. Fabiani, D., Montanari, G. C., Testa, L., Schifani, R., Guastavino, F.,
Bellucci, F. and Deorsola, F.: Effect of water adsorption on the dielectric
properties of polymer nanocomposites. In: Electrical Insulating Materials,
2008. (ISEIM 2008). International Symposium on. 2008.
50. Sun Y, Zhang, Z., and Wong, C.P: Influence of interphase and moisture on
the dielectric spectroscopy of epoxy/silica composites. Polymer, 2005. 46(7):
p. 2297-2305.
51. Sami, A., Frechette, M. F., David, E. and Savoie, S.: Water as a Digression
Relative to the Dielectric Response in the Frequency Domain for Polymer
Composites. In: Electrical Insulation and Dielectric Phenomena, 2008.
CEIDP 2008. Annual Report Conference on. 2008.
52. David, E, Soltani, R., and Lamarre, L.: PDC measurements to assess machine
insulation. Dielectrics and Electrical Insulation, IEEE Transactions on.
17(5): p. 1461-1469.
173
53. Sumereder C, Woschitz, R., and Muhr, M.: Polarization-depolarization
measurements at insulation systems for rotating machines. In: Electrical
Insulating Materials, 2005. (ISEIM 2005). Proceedings of 2005 International
Symposium on. 2005.
54. Bhumiwat, S.A: On-site non-destructive diagnosis of in-service power cables
by Polarization / Depolarization Current analysis. In: Electrical Insulation
(ISEI), Conference Record of the 2010 IEEE International Symposium
on.2010.
55. Abou Dakka, M., Bamji, S.S., and Bulinsk,i A.T.: Polarization and
depolarization current response of XLPE insulation subjected to wet-aging.
In: Electrical Insulation and Dielectric Phenomena, 2001 Annual Report.
Conference on. 2001.
56. Oyegoke, B., Birtwhistle, D., and Lyall, J.: New Techniques for Determining
Condition of XLPE Cable Insulation from Polarization and Depolarization
Current Measurements. In: Solid Dielectrics, 2007. ICSD '07. IEEE
International Conference on. 2007.
57. Oyegoke, B., Birtwhistle, D., and Lyall, J.: Condition assessment of XLPE
cable insulation using short-time polarisation and depolarisation current
measurements. Science, Measurement & Technology, IET, 2008. 2(1): p. 25-
31.
58. Sulaiman S., Ariffin, A.M., and Kien, D.T.: Comparing simulation modelling
and measurement results of polarization/depolarization current analysis on
various underground cable insulation systems. In Solid Dielectrics (ICSD),
2013 IEEE International Conference on. 2013.
59. Sulaiman, S., Ariffin, A.M., and Kien, D.T.: Simulation modeling of
polarization and depolarization current analysis for underground cable
insulation. In: Power Engineering and Optimization Conference (PEOCO),
2013 IEEE 7th International. 2013.
60. Bhumiwat S.A: Advanced Applications of Polarisation / Depolarisation
Current Analysis on Power Transformers. In: Electrical Insulation, 2008.
ISEI 2008. Conference Record of the 2008 IEEE International Symposium
on. 2008.
61. Bhumiwat, S.A, and Stattmann, P.: Quality assurance after transformer
refurbishment by means of polarisation depolarisation currents analysis. In:
Power Tech Conference Proceedings, 2003 IEEE Bologna. 2003.
62. Bhumiwat, S.A: Insulation condition assessment of transformer bushings by
means of polarisation/depolarisation current analysis. In: Electrical
Insulation, 2004. Conference Record of the 2004 IEEE International
Symposium on. 2004.

174
63. Gradnik, T., Babuder, M., and Koncan-Gradnik, M.: Estimation of water
content in power transformers in service by polarization and depolarization
current measurements. In: Dielectric Liquids, 2008. ICDL 2008. IEEE
International Conference on. 2008.
64. Bouaicha, A., Fofana, I., Farzaneh, M., Setayeshmehr, A., Borsi, H.,
Gockenbach, E., Beroual, A. and Aka, N. T.: Dielectric spectroscopy
techniques as quality control tool: a feasibility study. Electrical Insulation
Magazine, IEEE, 2009. 25(1): p. 6-14.
65. Fofana, I.,. Hemmatjou, H, and Farzaneh, M.: Low temperature and moisture
effects on polarization and depolarization currents of oil-paper insulation.
Electric Power Systems Research. 80(1): p. 91-97.
66. Gavrila, D.E. ,and Ilies, C.: Degradation analysis of insulation used in high
power transformers by means of polarization/depolarization currents. In:
Properties and Applications of Dielectric Materials (ICPADM), 2012 IEEE
10th International Conference on the. 2012.
67. Jadav, R.B., Ekanayake, C., and Saha, T.K.: Impact of moisture and ageing
on the dielectric response of transformer insulation. In: Universities Power
Engineering Conference (AUPEC), 2012 22nd Australasian. 2012.
68. Jian-Lin, W., Guan-Jun, Z., Hao, X., Hua-Dong, P., Shi-Qiang, W. and Ming,
D.: Novel characteristic parameters for oil-paper insulation assessment from
differential time-domain spectroscopy based on polarization and
depolarization current measurement. Dielectrics and Electrical Insulation,
IEEE Transactions on, 2011. 18(6): p. 1918-1928.
69. Jiquan, X., Lijun, Y., Bin, L., Ruijin, L., Yunhua, H. and Pei, G.: Study on
assessing the ageing condition of oilpaper insulation by
Polarization/Depolarization current. In: Electrical Insulation and Dielectric
Phenomena (CEIDP), 2013 IEEE Conference on. 2013.
70. Jurcik, J: Analysis of insulating state on transformer model using PDC
method. In ELEKTRO, 2012. 2012.
71. Sarkar, S., Sharma, T., Baral, A., Chatterjee, B., Dey, D. and Chakravorti, S.:
A new approach for determination of moisture in paper insulation of in-situ
power transformers by combining polarization-depolarization current and
return voltage measurement results. Dielectrics and Electrical Insulation,
IEEE Transactions on, 2013. 20(6): p. 2325-2334.
72. Xiao, L., Ruijin, L., Maochang, L., Lijun, Y., Junkun, Y. and Chaoliang, Q.:
Influence of aging degree on polarization and depolarization currents of oil-
paper insulation. In: Electrical Insulation and Dielectric Phenomena
(CEIDP), 2013 IEEE Conference on. 2013.
73. Fofana, I., Hemmatjou, H., Farzaneh, M., Gockenbach, E. and Borsi, H.:
Polarization and Depolarization Current measurements of oil impregnated

175
paper insulation system under thermal runaway. In: Solid Dielectrics (ICSD),
2010 10th IEEE International Conference on.
74. Fofana, I., Hemmatjou, H., and Meghnefi, F.: Effect of thermal transient on
the polarization and depolarization current measurements. Dielectrics and
Electrical Insulation, IEEE Transactions on. 18(2): p. 513-520.
75. Bhumiwat, S.A: Identification of overheating in transformer solid insulation
by polarization depolarization current analysis. In: Electrical Insulation
Conference (EIC), 2013 IEEE. 2013.
76. Kumar, A.R., Kumar, C.S., and Rajan, J.S.: Frequency domain Spectroscopy
and Polarization/Depolarization characteristics of paper oil insulation under
conditions of copper corrosion. In: Electrical Insulation and Dielectric
Phenomena (CEIDP), 2012 Annual Report Conference on. 2012.
77. Jadav, R.B., Saha, T.K., and Ekanayake, C.: Diagnostics of transformer
insulation based on dielectric response measurements. In: Condition
Assessment Techniques in Electrical Systems (CATCON), 2013 IEEE 1st
International Conference on. 2013.
78. Jian, H., Ruijin, L., Chen, G., Zhiqin, M. and Lijun, Y.: Quantitative analysis
ageing status of natural ester-paper insulation and mineral oil-paper
insulation by polarization/depolarization current. Dielectrics and Electrical
Insulation, IEEE Transactions on, 2012. 19(1): p. 188-199.
79. Muhamad, N. A., Suleiman, A. A., Phung, B. T. and Blackburn, T. R.: Faults
identification of biodegradable oil-filled transformers based on polarization
and depolarization current measurement (PDC) method. Dielectrics and
Electrical Insulation, IEEE Transactions on, 2013. 20(6): p. 2299-2306.
80. Maeno, Y., Kino, H., Omori, S., Hirai, N., Tanaka, T., Ohki, Y., Tajitsu, Y.,
Kohtoh, M. and Okabe, S.: Dipolar polarization and depolarization currents
in biodegradable polymers. In: Electrical Insulating Materials, 2005. (ISEIM
2005). Proceedings of 2005 International Symposium on. 2005.
81. Rao, B.N., Sundara Rajan, J., and Ramachandra, B.: Application of RVM
technique to study the polarisation and depolarisation characteristics
associated with thermal ageing of epoxy mica composite. In: Properties and
Applications of Dielectric Materials (ICPADM), 2012 IEEE 10th
International Conference on the. 2012.
82. Preda, I., Castellon, J., Agnel, S., Notingher, P., Frechette, M., Heid, T.,
Couderc, H., Freebody, N. and Vaughan, A. S.: Conduction currents and time
to frequency domain transformation for epoxy resin nanocomposites. In:
Solid Dielectrics (ICSD), 2013 IEEE International Conference on. 2013.
83. Shi-Qiang, W., Guan-Jun, Z., Jian-Lin, W., Shuang-Suo, Y., Ming, D. and
Xin-Bo, H.: Investigation on dielectric response characteristics of thermally
aged insulating pressboard in vacuum and oil-impregnated ambient.

176
Dielectrics and Electrical Insulation, IEEE Transactions on, 2010. 17(6): p.
1853-1862.
84. Saha, T.K: Review of modern diagnostic techniques for assessing insulation
condition in aged transformers. Dielectrics and Electrical Insulation, IEEE
Transactions on, 2003. 10(5): p. 903-917.
85. Saha, T.K., Pradhan, M.K., and Yew, J.H.: Optimal Time Selection for the
Polarisation and Depolarisation Current Measurement for Power Transformer
Insulation Diagnosis. In: Power Engineering Society General Meeting, 2007.
IEEE. 2007.
86. Saha, T.K., and Purkait, P.: Investigation of an expert system for the
condition assessment of transformer insulation based on dielectric response
measurements. Power Delivery, IEEE Transactions on, 2004. 19(3): p. 1127-
1134.
87. Saha, T.K., Yew, J.H. and Thomas, A.: How Confident are we with
POlarization Based Diagnostics for Transformer Conditon Assesment? In
Australasia Universities Power Engineering Conference (AUPEC05). 2005.
88. Roongroj, C., Pattanadech, N., Praisuwanna, P., Yutthagowith, P. and
Thongkaemkaew, K.: Equivalent circuit approximation of transformer
insulation by using PDC measurement. In: Electrical
Engineering/Electronics, Computer, Telecommunications and Information
Technology, 2008. ECTI-CON 2008. 5th International Conference on. 2008.
89. Silva, H.A.P., Bassi, W. and Diogo, A.C.T.: Noninvasive ageing assessment
by means of polarization and depolarization currents analysis and its
correlation with moisture content for power transformer life management. In:
Transmission and Distribution Conference and Exposition: Latin America,
2004 IEEE/PES. 2004.
90. Stancu, C., Notingher, P.V. and Badicu, L.V.: Dielectric response function
for nonhomogeneous insulations. In: Electrical Insulation and Dielectric
Phenomena (CEIDP), 2011 Annual Report Conference on. 2011.
91. Shkolnik, A: Estimation of the Water Content in High Voltage Oil-
impregnated Transformer Insulation. In: Electrical and Electronics
Engineers in Israel, 2006 IEEE 24th Convention of. 2006.
92. Alff, J. J., Der Houhanessian, V., Zaengl, W. S. and Kachler, A. J.: A novel,
compact instrument for the measurement and evaluation of relaxation
currents conceived for on-site diagnosis of electric power apparatus. In:
Electrical Insulation, 2000. Conference Record of the 2000 IEEE
International Symposium on. 2000.
93. Buchholz, V., Colwell, M., Cherukupalli, S., Crine, J. P. and Keefe, R.:
Comparison of moisture contents in PILC cables measured by chemical
titration and determined from electrical and dielectric measurements. In:

177
Solid Dielectrics, 2004. ICSD 2004. Proceedings of the 2004 IEEE
International Conference on. 2004.
94. Preda, I., Castellon, J., Agnel, S., Couderc, H., Frechette, M., Gao, F.,
Nigmatullin, R., Thompson, S. and Vaessen, A. F.: Dielectric response of
various partially cured epoxy nanocomposites. Dielectrics and Electrical
Insulation, IEEE Transactions on, 2013. 20(2): p. 580-591.
95. Zhang, C. and Stevens, G.C.: The Dielectric Response of Polar and Non-
Polar Nanodielectrics. Dielectrics and Electrical Insulation, IEEE
Transactions on, 2008. 15(2): p. 606-617.
96. Imai, T., Sawa, F., Ozaki, T., Inoue, Y., Shimizu, T. and Tanaka, T.: Roles of
Fillers on Properties of Nano-TiO2 and Micro-SiO2 Filler Mixed Composites.
In: Solid Dielectrics, 2007. ICSD '07. IEEE International Conference on.
2007.
97. Farahani, M., Borsi, H.and Gockenbach, E.: Calculation and measurement of
dielectric response function in insulation systems of high voltage rotating
machines. In: Properties and Applications of Dielectric Materials, 2003.
Proceedings of the 7th International Conference on. 2003.
98. Raetzke, S. J and Kindersberger: Role of interphase on the resistance to
high-voltage arcing, on tracking and erosion of silicone/SiO2
nanocomposites. Dielectrics and Electrical Insulation, IEEE Transactions
on. 17(2): p. 607-614.
99. Vas, J.V., Venkatesulu, B.and Thomas, M.J.: Tracking and erosion resistance
of silicone rubber nanocomposites under positive and negative dc voltages.
In: Electrical Insulation and Dielectric Phenomena (CEIDP), 2010 Annual
Report Conference on.
100. Meyer, L., Jayaram, S.and Cherney, E.A.: Thermal conductivity of filled
silicone rubber and its relationship to erosion resistance in the inclined plane
test. Dielectrics and Electrical Insulation, IEEE Transactions on, 2004.
11(4): p. 620-630.
101. El-Hag, A. H., Simon, L. C., Jayaram, S. H. and Cherney, E. A.: Erosion
resistance of nano-filled silicone rubber. Dielectrics and Electrical
Insulation, IEEE Transactions on, 2006. 13(1): p. 122-128.
102. Ramirez, I., Cherney, E. A., Jayaram, S. and Gauthier, M.: Nanofilled
silicone dielectrics prepared with surfactant for outdoor insulation
applications. Dielectrics and Electrical Insulation, IEEE Transactions on,
2008. 15(1): p. 228-235.
103. Ghunem, R.A., Jayaram, S.H. and Cherney, E.A.: Erosion of ATH and silica
filled silicone rubber in the DC inclined plane test. In: Properties and
Applications of Dielectric Materials (ICPADM), 2012 IEEE 10th
International Conference on the. 2012.

178
104. Omranipour, R., Meyer, L. H., Jayaram, S. H. and Cherney, A.: Tracking and
erosion resistance of RTV silicone rubber: effect of filler particle size and
loading. In: Electrical Insulation and Dielectric Phenomena, 2002 Annual
Report Conference on. 2002.
105. Piah, M.A.M., Darus, A.and Hassan, A.: Leakage current and surface
discharge phenomena: effect on tracking and morphological properties of
LLDPE-natural rubber compounds. In: Properties and Applications of
Dielectric Materials, 2003. Proceedings of the 7th International Conference
on. 2003.
106. Piah, M.A.M., Darus, A.and Hassan, A.: Electrical tracking performance of
LLDPE-natural rubber blends by employing combination of leakage current
level and rate of carbon track propagation. Dielectrics and Electrical
Insulation, IEEE Transactions on, 2005. 12(6): p. 1259-1265.
107. Venkatesulu, B. and Thomas, M.J.: Studies on the Tracking and Erosion
Resistance of RTV Silicone Rubber Nanocomposite. In: Electrical Insulation
and Dielectric Phenomena, 2008. CEIDP 2008. Annual Report Conference
on. 2008.
108. Vazquez, I.R: Nano particle reinforcement of HTV silicone rubber for high
voltage insulators. In: Electrical Insulation and Dielectric Phenomena
(CEIDP), 2012 Annual Report Conference on. 2012.
109. Cai, D., Yu Jian, H., Wen, X. and Lan, L.: Research on characterization of
RTV silicone rubber/LS (layered silicate) electrical insulation
nanocomposites. In: Solid Dielectrics, 2004. ICSD 2004. Proceedings of the
2004 IEEE International Conference on. 2004.
110. Venkatesulu, B. and Thomas, M.J.: Erosion resistance of alumina-filled
silicone rubber nanocomposites. Dielectrics and Electrical Insulation, IEEE
Transactions on. 17(2): p. 615-624.
111. Vasudev, N., Ganga, S., Shivakumara Aradhya, R. S. and Pai, B. L.: Effect of
ATH filler content on the performance of silicone rubber by inclined plane
tracking and erosion test method. In: Properties and Applications of
Dielectric Materials (ICPADM), 2012 IEEE 10th International Conference
on the. 2012.
112. Guastavino, F., Thelakkadan, A. S., Coletti, G. and Ratto, A.: Electrical
tracking in cycloaliphatic epoxy based nano structured composites. In:
Electrical Insulation and Dielectric Phenomena, 2009. CEIDP '09. IEEE
Conference on. 2009.
113. Piah, M.A.M: Leakage current and surface tracking characterization of new
natural rubber-based material for high voltage insulation. 2004, PhD Tesis,
Universiti Teknologi Malaysia.

179
114. Gasser, H.P., Krause, C., and Prevost, T.: Water Absorption of Cellulosic
Insulating Materials used in Power Transformers. In: Solid Dielectrics, 2007.
ICSD '07. IEEE International Conference on. 2007.
115. David, E., Fre, X and Chette, M.: Polymer nanocomposites-major
conclusions and achievements reached so far. Electrical Insulation
Magazine, IEEE, 2013. 29(6): p. 29-36.