polar vortex review - nerc.com 2014 polar vortex review/polar...florida reliability ... include in...
TRANSCRIPT

Polar Vortex Review
September 2014

NERC | Polar Vortex Review | September 2014 i
Table of Contents
Preface ........................................................................................................................................................................ ii
Executive Summary ................................................................................................................................................... iii
Introduction ................................................................................................................................................................ v
Review of Polar Vortex Weather ............................................................................................................................ v
Chapter 1 – Method of Analysis .................................................................................................................................1
GADS Data Review and Validation ..........................................................................................................................1
Chapter 2 – Effects .....................................................................................................................................................2
System Operations ..................................................................................................................................................2
Florida Reliability Coordinating Council ..............................................................................................................6
Midwest Reliability Organization ........................................................................................................................7
Northeast Power Coordinating Council ..............................................................................................................8
ReliabilityFirst ......................................................................................................................................................9
SERC Reliability Corporation ............................................................................................................................ 10
Southwest Power Pool Regional Entity ............................................................................................................ 11
Texas Reliability Entity ..................................................................................................................................... 12
Generator Issues by Fuel Type ......................................................................................................................... 13
Chapter 3 – Discussion ............................................................................................................................................ 17
Chapter 4 – Conclusion ............................................................................................................................................ 19
Observations and Recommendations .................................................................................................................. 19
Appendix A .............................................................................................................................................................. 21
Overview of GADS ............................................................................................................................................ 21
Appendix B ............................................................................................................................................................... 36
Historical GADS Analysis .................................................................................................................................. 37

NERC | Polar Vortex Review | September 2014 ii
Preface
The North American Electric Reliability Corporation (NERC) is a not-for-profit international regulatory authority whose mission is to ensure the reliability of the bulk power system (BPS) in North America. NERC develops and enforces Reliability Standards; annually assesses seasonal and long‐term reliability; monitors the BPS through system awareness; and educates, trains, and certifies industry personnel. NERC’s area of responsibility spans the continental United States, Canada, and the northern portion of Baja California, Mexico. NERC is the electric reliability organization (ERO) for North America, subject to oversight by the Federal Energy Regulatory Commission (FERC) and governmental authorities in Canada. NERC’s jurisdiction includes users, owners, and operators of the BPS, which serves more than 334 million people. The North American BPS is divided into several assessment areas within the eight Regional Entity (RE) boundaries, as shown in the map and corresponding table below.
FRCC Florida Reliability Coordinating Council
MRO Midwest Reliability Organization
NPCC Northeast Power Coordinating Council
RF ReliabilityFirst
SERC SERC Reliability Corporation
SPP-RE Southwest Power Pool Regional Entity
TRE Texas Reliability Entity
WECC Western Electricity Coordinating Council

NERC | Polar Vortex Review | September 2014 iii
Executive Summary
This report describes what happened during the polar vortex and why some of the conditions occurred, and it presents lessons learned and recommendations for future actions. In early January of 2014, the Midwest, South Central, and East Coast regions of North America experienced a weather condition known as a polar vortex, where extreme cold weather conditions occurred in lower latitudes than normal, resulting in temperatures 20 to 30° F below average. Some areas faced days that were 35° F or more below their average temperatures. These temperatures resulted in record high electrical demand for these areas on January 6 and again on January 7, 2014. During the polar vortex, the cold weather also increased demand for natural gas, which resulted in a significant amount of gas-fired generation being unavailable due to curtailments of gas. Balancing Authorities (BAs) and Load-Serving Entities in both the Electric Reliability Council of Texas (ERCOT) and the Eastern Interconnection were mostly able to maintain their operating reserve margins and serve firm load. By properly and appropriately communicating through the NERC Energy Emergency Alert (EEA) process using interruptible load, demand-side management1 tools, and voltage reduction, only one BA was required to shed firm load. The amount shed was less than 300 MW, representing less than 0.1 percent of the total load for the Eastern and ERCOT Interconnections. Many outages, including a number of those in the southeastern United States, were the result of temperatures that fell below a plant’s design basis. Generation facilities have made improvements in their winter preparation activities since February 2011; however, every extreme event provides insight for future improvements. Generation facilities across all Regions have indicated that they have reviewed or implemented recommendations from the February 2011 Southwest Cold Weather Event Lessons Learned, as well as the Generating Unit Winter Weather Readiness reliability guideline. System Operators had many challenging decisions to make as a result of lost capacity from both weather conditions exceeding the design basis of generating units, and from the lack of availability of natural gas. They successfully maintained reliability through extensive training and preparation. For example, during the polar vortex, several System Operators used load reduction techniques such as voltage reduction or interruptible loads. They also made effective use of emergency procedures to manage loads and generation. While the NERC Event Analysis process has clearly defined categories for electric disturbances in small defined geographic areas, based on the combined unintended loss of generation during the three-day period (January 6–8), this event reached the equivalent of an ERO Event Analysis Process level of Category 5 (unintended loss of more than 10,000 MW of generation). WECC and the majority of the Canadian entities are not included in this analysis as the report is based on the geographic areas that observed effects of this extreme event. The report also contains more than a dozen observations and recommendations to improve performance ahead of and during cold weather events. The recommendations include:
Review natural gas supply and transportation issues and work with gas suppliers, markets, and regulators to develop appropriate actions.
Review and update power plant weatherization programs, including procedures and staff training.
Continue or consider implementing a program for winter preparation site reviews at generation facilities.
Review internal processes to ensure they account for the ability to secure necessary waivers of environmental and/or fuel restrictions.
1 The term for all activities or programs undertaken by Load-Serving Entity or its customers to influence the amount or timing of electricity
they use.

Executive Summary
NERC | Polar Vortex Review | September 2014 iv
Continue to improve operational awareness of the fuel status and pipeline system conditions for all generators.
Include in winter assessments reasonable losses of gas-fired generation and considerations of oil burn rates relative to oil replenishment rates to determine fuel needs for continuous operation.
Ensure that on-site fuel and fuel ordered for winter is adequately protected from the effects of cold weather.
Consider (where appropriate) the temperature design basis for generation plants to determine if improvements are needed for the plants to withstand lower winter temperatures without compromising their ability to withstand summer temperatures.
Review the basis for reporting forced and planned outages to ensure appropriate data for unit outages and de-ratings.

NERC | Polar Vortex Review | September 2014 v
Introduction
Review of Polar Vortex Weather The effects of the polar vortex in the United States were initially felt in the far northwestern portion of the MRO footprint, but these low temperatures quickly spread to nearly all portions of the Eastern and Texas Interconnections. In many areas in the United States, temperatures were far colder than those normally experienced in winter, resulting in record winter peak electric demands associated with increased electric heating requirements. The average daily temperature for the United States on January 6 was calculated to be 17.9° F (-7.8° C). The last time the average for the country was below 18° F was January 13, 1997. This 17-year period without the national average for the United States dropping below 18° F is the longest gap on record and, since then, a significant portion of the generating fleet is now fueled by natural gas.2 On January 7, at least 49 record low temperatures were set across North America. As shown in Table 1 and Figures 1 and 2, the polar vortex started in the northern Great Plains and moved south and east. The selected cities are representative of the Regional Entities affected by the extreme cold and are also large load centers.3.
2 Borenstein, Seth, January 10, 2014. "Weather wimps?” Salisbury Post. Associated Press. p. 1A. 3 These high and low temperatures were gathered from www.accuweather.com and represent the both the average and actual high and
low temperatures experienced during this timeframe

Introduction
NERC | Polar Vortex Review | September 2014 vi
Figure 1: Departure from Normal High Temperatures
Figure 2: Departure from Normal Low Temperatures

Introduction
NERC | Polar Vortex Review | September 2014 vii
The most significant impacts to the BPS in the MRO Region began on January 5, 2014, and persisted through January 7, 2014. The extremely cold temperature was the primary impacting factor, but heavy precipitation also affected large portions of the Region. Temperatures in many areas were the lowest experienced in 20 years. Minneapolis, where the average high for early January is 23° F, experienced 62 consecutive hours below 0° F from January 5 to January 7. As the polar vortex extended south and east, it also began to impact the SPP, TRE, RF, SERC, and NPCC Regional Entities. As a result, the majority of the Eastern and ERCOT Interconnections experienced similar variances from normal. For example, St. Louis experienced temperatures up to 38° F below normal, and Chicago up to 34° F below normal; other parts of the country experienced temperatures between 23 and 30° F below normal. In Indianapolis, where they normally experience average highs of 35° F during this period, temperatures remained below 0° F for 33 consecutive hours. Temperatures in the Canadian regions of MRO were even colder and started earlier. Saskatchewan, for instance, started to experience the polar vortex beginning the evening of January 3, with the greatest impact on the nights of January 5 and 6. Additionally, the city of Regina, Saskatchewan fell to below 0° F temperatures the night of Friday, January 3, and did not climb above 0° F until January 8. Winnipeg, Manitoba experienced a similar plunge in temperature with the mercury falling to -31° F on the night of Saturday, January 4, 2014. The night of January 5, 2014, they experienced a low of -36° F. The temperature in Winnipeg did not climb back above 0° F until Thursday, January 9, 2014. As shown in Figure 3 and Table 2, these lower temperatures had a drastic impact on load, with many of the Reliability Coordinators (RCs) (e.g., Midcontinent Independent System Operator (MISO), PJM Interconnection (PJM), the Tennessee Valley Authority (TVA), the VACAR South RC (VACS RC), and Southeastern-RC) reporting record or near-record winter peak demands. PJM exceeded its historic winter peak on both January 7 and January 8, 2014, and MISO reported that they exceeded their historic winter peak for three straight days (January 6–8, 2014).
Figure 3: Historic All-Time Winter Peaks vs. Polar Vortex Loads

Introduction
NERC | Polar Vortex Review | September 2014 viii
As seen in Table 2 and Figure 3, each of the RC areas were experiencing either new peak winter electric loads or loads that were close to the previous all-time winter peak, with eight of 10 areas setting new all-time peaks either on January 6 or 7, 2014. VACS RC experienced a new winter electric load peak that was almost 18 percent greater than the previous all-time winter peak.
Table 2: Historic Winter Peak Loads vs. Polar Vortex Loads by Percentage4
MISO PJM NYISO ISO-NE South-eastern
RC TVA
VACS RC
SPP ERCOT FRCC
Previous Winter peak (% of previous peak)
99,855 136,675 25,541 22,818 46,259 43,384 42,983 32,635 57,265 36,926
6-Jan-14 109,307 (109.5%)
131,142 (95.5%)
23,197 (90.8%)
18,500 (81.1%)
44,871 (97.0%)
43,277 (99.8%)
50,659 (117.9%)
36,602 (112.2%)
56,031 (97.8%)
30,231 (81.9%)
7-Jan-14 104,746 (104.9%)
140,510 (103.5%)
25,738 (100.8%)
21,300 (93.3%)
48,279 (104.4%)
44,285 (102.1%)
44,654 (103.9%)
36,079 (110.6%)
57,277 (100.0%)
35,638 (96.5%)
8-Jan-14 100,154 (100.3%)
133,288 (98.1%)
24,551 (96.1%)
20,800 (91.2%)
47,005 (101.6%)
39,820 (91.8%)
43,203 (100.5%)
31,944 (97.9%)
45,281 (79.1%)
29,251 (79.2%)
Figure 4: Historic All-Time Winter Peaks vs. Polar Vortex Loads by Percentage With the significant temperature deviations and the accompanying increases in electric demand over such a wide area, it was challenging for BAs to supply sufficient generation to their areas, therefore making it challenging to
4 Highlighted blue squares represent new all-time winter peak loads.

Introduction
NERC | Polar Vortex Review | September 2014 ix
supply assistance to neighboring BAs. The peak loads experienced January 6–7 exceeded the combined noncoincident peaks achieved previously. On January 7, the combined load for the impacted BAs was 559,000 MW, or just under 3 percent higher than the nonsimultaneous historical peak.
NERC | Polar Vortex Review | September 2014 1
Chapter 1 – Method of Analysis
GADS Data Review and Validation NERC introduced the Generating Availability Data System (GADS) in 1982. GADS data is used to calculate important performance statistics and supports bulk power trend analysis by providing information on forced outages, maintenance outages, planned outages, and derates. The NERC Board of Trustees (Board) approved mandatory reporting of data to GADS for conventional generating units on August 4, 2011. Renewable generation (wind and solar) are not part of the mandatory data submittal requirements. The MW size of the conventional units was phased in, with units having a nameplate rating of 50 MW and larger starting January 1, 2012, and those with a nameplate rating of 20 MW and larger starting January 1, 2013. GADS data is collected from all Generator Owners on the NERC Compliance Registry under NERC’s Rules of Procedures Section 1600, Request for Data or Information. Generating units less than 20 MW are encouraged to report unit information on a voluntary basis. NERC collects the equipment information by class of outage and calculates statistics such as Equivalent Forced Outage Rate (EFOR) using IEEE Standard 762 definitions, thereby ensuring a high level of confidence that the statistics are calculated in a uniform process using an industry-approved method. Analysis of GADS data provides trend information on forced, maintenance, and planned outages and derations. Further, NERC collects information on the fuels burned and fuel-switching activities (coal to gas, oil to gas, and bio-fuels to other fuels). Since GADS was a voluntary database prior to 2012, analysis of data prior to 2012 provides partial information. Additionally, since units less than 50 MW but greater than 20 MW were not reported to NERC until 2013, analysis of 2012 data may be biased toward larger units. With these factors in mind, NERC examined GADS data to determine an expected EFOR for the polar vortex time period. The complete summary of the data analysis is provided in Appendix A. NERC used the GADS information to analyze generator availability during the polar vortex. A list of generation outages due to planned and forced outages could be obtained, as well as analysis of forced outage cause codes. This data was used to determine the amount of generation that was forced out specifically due to the polar vortex, as opposed to generation that was forced out due to other operational parameters. GADS also collects additional generation information on a voluntary basis. Examples of this information include reasons for derates, verbal descriptions of outages, and explanatory cause codes. This information is extremely useful in analyzing individual events, but provides limited value when calculating trends of performance characteristics. Since GADS is used to examine trending information on a high level, the system had never been used to analyze performance information for generating units on as granular a scale as that required for the polar vortex. This presented a few challenges in data validation. The NERC Performance Analysis staff began by obtaining a list of all generation that had reported outages in GADS. The NERC Event Analysis staff then compared the forced outages and derations list with analysis that was performed by various NERC Regional Entities and registered entities. Discrepancies were sent to the respective Regional Entities for validation and correction. After a period of examination of generator outage data by Regional Entities, 95 percent of generation outage data during the polar vortex was validated.
NERC | Polar Vortex Review | September 2014 2
Chapter 2 – Effects
System Operations System Operators had many challenging decisions to make as a result of lost capacity from both weather conditions exceeding the design basis of generating units, and from lost fuel due to the lack of natural gas transportation. They successfully maintained reliability through previous extensive training, preparation, and use of tools. One of the largest issues impacting gas-fired generation was the curtailment or interruption of fuel supply. Unlike other fuel sources, natural gas is not typically stored on‐site. Generators rely on real‐time delivery of natural gas from their suppliers. When units are not confident that they will be dispatched, the fuel is often obtained on the spot-market on a non-firm, interruptible basis. Therefore, if firm contracts are honored before interruptible contracts, if the firm customers require more gas, and the capacity of the gas transportation is based on firm contracts, less capacity is available for interruptible supply. This can result in generating units becoming unavailable as there is no pipeline capacity to supply interruptible gas. Extreme cold weather also had a major impact on generator equipment. Of the approximately 19,500 MW of capacity lost due to cold weather conditions, over 17,700 MW was due to frozen equipment. Many outages, including a number of those in the southeastern United States, were the result of temperatures that fell below the plant’s design basis for cold weather. At the height of generation outages (January 7 at 0800) the southeastern United States accounted for approximately 9,800 MW of the outages attributed to cold weather. With the extended duration weather pattern affecting most of the Eastern Interconnection, several of the RCs used load reduction procedures such as voltage reduction, interruptible loads, and demand-side management. In only two instances were these procedures used to maintain generating reserves: PJM used voltage reduction to maintain reserves, and South Carolina Electric and Gas (SCE&G) shed less than 300 MW of firm load, while also using voltage reduction to maintain reliable operation of the BPS. While the shedding of firm load is typically used as a last resort, it is critical that a minimum level of generating reserves be maintained to ensure that the reliability of the BPS is not jeopardized for the loss of the next contingency, and that it is restored within the appropriate time frames after a contingency occurs. Many areas made effective use of emergency procedures to manage loads and generation. They provided notification to industry through tools such as the Reliability Coordinator Information System (RCIS) and conference calls. For example, MISO issued a Cold Weather Alert for portions of its footprint on January 2 that was effective January 5. On January 3, MISO also declared a Conservative Operations period for January 5. Although MISO did not direct any emergency demand reductions, some of their members used voluntary load reduction procedures at various times during this period. RCs used voltage reduction and public appeals during the event and provided emergency energy, when available, to other BAs in need. For example, New York ISO (NYISO) appealed to their customers to conserve energy, and at the request of PJM, NYISO also used demand-side management resources to create additional capacity to provide assistance to prevent the shedding of firm load in the neighboring PJM area. Also, ISO-New England (ISO-NE) provided assistance to PJM by dispatching additional units. In addition, ISO-NE issued their Master/Local Control Center Procedure No. 2, “Abnormal Conditions Alert,” to ensure that no scheduled work was performed on active equipment. Neither TVA, Southeastern RC, nor SPP RCs made use of emergency procedures such as voltage reductions or load shedding.
Chapter 2 – Effects
NERC | Polar Vortex Review | September 2014 3
In Texas, ERCOT declared an Energy Emergency Alert5 (EEA) Level 1 and then an EEA Level 2, primarily due to the loss of a number of generating units during the morning load ramp. They were able to recover within two hours and 11 minutes by deploying Non-Spin Reserve Service (NSRS), Responsive Reserve Service from generators, load resources, and Emergency Response Service (ERS).6 Two RCs that also experienced challenges were the VACS RC and PJM. In VACS RC, two BAs experienced difficulties when faced with the cold weather. The SCE&G BA experienced record electric demand the evening of January 6, 2014, and the morning of January 7, 2014. During that time, SCE&G lost more than 850 MW of generation from multiple sources. SCE&G addressed this loss of generation by following internal company procedures, which called for implementation of local and reserve-sharing group reserves, obtaining Emergency Assistance from neighbors and neighboring RCs, use of customer standby generators and curtailment of retail interruptible contract customers, appeals for conservation, distribution-level voltage reduction, and controlled firm load shed when reserves were not available for a period. All actions taken by SCE&G were intentional and in accordance with regulatory requirements. Additionally, on January 7, the Duke Energy Progress (DEP) Carolina Power and Light East (CPLE) and Carolina Power and Light West (CPLW) BAs experienced all-time peak demand during the hour ending 8:00 a.m. Demand-side management resources, including an initial 2.9 percent system‐wide voltage reduction, a large industrial load curtailment rider, general public appeal for conservation, and a water heater and strip heat control program, were deployed in the DEP TOP/BA footprint. As part of its General Load Reduction Plan, and while in a NERC Energy Emergency Alert Level 2, CPLE and CPLW BAs subsequently activated a 5 percent system‐wide voltage reduction on the distribution system for their footprints at 7:54 a.m. Through the use of generation and demand-side management resources, the CPLE and CPLW BAs were able to serve an all‐time peak demand without shedding firm load. The second RC that experienced challenges was PJM. On January 3, they issued a Cold Weather Alert at approximately 11:00 a.m. for January 6–7. In addition, they successfully used emergency procedures and the EEA process to maintain their required level of reserves. Some of the actions taken included scheduling shared reserves from NYISO and ISO-NE, issuing EERs, using demand response, and initiating a 5 percent voltage reduction across a portion of their operating area. Figure 5 illustrates the challenges experienced by System Operators with regard to generation capacity unavailability during the study period. The graph shows the cumulative amount of MW unavailable due to forced outages in the following five general categories:
Unrelated – Outages not related to cold weather or the extremes presented by the polar vortex
Unknown – Outages still under review to determine cause
Miscellaneous – Outage types potentially related to extreme cold weather (e.g., opacity issues)
Cold – Outages directly attributable to cold weather, including on-site fuel issues such as frozen coal piles, frozen equipment and/or sensors under the control of the generating plant, and gelled fuel
Fuel – Outages that are directly related to the inability of the plant to receive fuel from their provider
5 An Energy Emergency is a condition when a Load-Serving Entity has exhausted all other options and can no longer provide its customers’
expected energy requirements. 6 An emergency service consistent with P.U.C. SUBST. R. 25.507, Electric Reliability Council of Texas (ERCOT) Emergency Response Service
(ERS), used during an Energy Emergency Alert (EEA) Level 2 to assist in maintaining or restoring ERCOT system frequency. ERS is not an Ancillary Service.

Chapter 2 – Effects
NERC | Polar Vortex Review | September 2014 4
Figure 5: Total Outages in the Eastern Interconnection and ERCOT by Outage Type vs. Temperature
The North American temperature displayed in Figure 5 represents an average of seven selected cities in the approximate geographic centers of the seven studied Regions. The selected cities for each NERC Region are identified in the legends of Figures 6–12. It is important to note that Figures 5–12 are not normalized in any manner; thus, the additive number of the forced-out rate is understandably higher based on the greater number of generators being dispatched. Additionally, figures do not maintain the same scale for total forced-out MW values so that the relationships can be clearly seen between temperature and the outages. Units were called on to start or increase output as the cold air mass swept down into the United States. The extreme weather challenged the units’ preparedness and abilities to withstand ambient conditions, resulting in either forced outages or deratings. Once the cold air was established and units were running, the outages unrelated to cold weather maintained a fairly consistent rate throughout the remainder of the polar vortex time frame even though the number of generators and their individual run times were significantly increased. All areas of the Eastern and Texas Interconnections were impacted by the polar vortex. These impacts were partially the result of the severe and extended cold spell, but there was also a significant reduction of generating capacity due to curtailments and interruptions of natural gas delivery. The cold weather and issues from fuel combined for over 35,000 MW of outages during the height of the polar vortex weather conditions. One of the largest issues impacting gas-fired generation was the curtailment or interruption of fuel supply. Unlike other fuel sources, natural gas is not typically stored on site. As a result, generators rely on real‐time delivery of natural gas from their suppliers. Often, as units are not confident that they will be dispatched, the fuel is obtained on the spot market as an interruptible fuel supply.

Chapter 2 – Effects
NERC | Polar Vortex Review | September 2014 5
Extreme cold weather also had a major impact on generator equipment. Of the approximately 19,500 MW of capacity lost due to cold weather conditions, over 17,700 MW was due to frozen equipment. Many outages, including a number of those in the southeastern United States, were the result of temperatures that fell below the plant’s design basis for cold weather. At the height of generation outages (January 7 at 0800) the southeastern United States accounted for approximately 9,800 MW of the outages attributed to cold weather. In the following sections, each Region’s forced outages have been plotted by type as a stacking chart, with temperature overlaid. A large city close to the center of the Region was selected to represent the temperature for the Region over the 60-hour period. For example, Orlando was chosen for the FRCC Region, and Pittsburgh, PA was chosen for the RF Region. However, cities near large moderating bodies of water, such as New York, Cleveland, and Chicago, were avoided. While these are large cities with significant electric loads, those temperatures may not reflect the temperatures experienced by the RE as a whole.

Chapter 2 – Effects
NERC | Polar Vortex Review | September 2014 6
Florida Reliability Coordinating Council
Figure 6: FRCC Cumulative Impact of Outage Type vs. Temperature (F)
While the majority of the outages in FRCC were unrelated to the polar vortex, there was a six-hour period with 102 MW of cold-related outages. Additionally, several units (303 MW) ran into emissions-related outages and derations. Otherwise, the FRCC Region did not experience significant impacts to their system during the polar vortex. Though FRCC is typically an importing Region, it was able to export 1,500 MW to aid the SERC Region during the polar vortex.

Chapter 2 – Effects
NERC | Polar Vortex Review | September 2014 7
Midwest Reliability Organization
Figure 7: MRO (US): Cumulative Impact of Outage Type vs. Temperature (F) As shown in Figure 7, unrelated outages were the majority of the generator outages in the MRO Region. The prolonged sub-zero weather eventually resulted in 1,379 MW of cold-weather-related impacts. MRO also experienced as much as 820 MW of generation loss due to fuel issues, with nearly 620 MW due to curtailments and interruptions of natural gas delivery to the plant. As shown in Figure 7, only seven of the 60 hours of interest were above 0° F in Minneapolis, MN. MRO Generator Owners were prepared for the extreme cold because the design basis for generators in MRO accounts for operation in temperatures well below freezing (7° F is the historical average low in January). Additionally, Generator Owners recognize the reliability significance of outages and the market incentives for availability and continue to look for ways to improve capacity availability during cold weather. For example, MISO’s Electric and Natural Gas Coordination Task Force is exploring solutions regarding emerging natural gas issues. The MISO Reliability Subcommittee reviews seasonal preparations by generation owners and Transmission Owners, including cold weather readiness. Additionally, the MISO Supply Adequacy Working Group (SAWG) evaluates appropriate accounting of generation capacity in the Planning Reserve Margin (PRM) calculations and accreditation of capacity to meet the PRM requirements. Currently the SAWG is considering changing from the use of annual capacity values to the use of seasonal capacity values.

Chapter 2 – Effects
NERC | Polar Vortex Review | September 2014 8
Northeast Power Coordinating Council
Figure 8: NPCC (US): Cumulative Impact of Outage Type vs. Temperature (F)
NPCC did not experience many cold weather outages at the start of the time frame identified by this report, with a peak of 518 MW of outages in the first 30 hours. However, as the cold air mass that comprised the polar vortex made its way into the Northeast, NPCC did experience more outages from the stress of the extreme event, reaching up to 1,984 MW of lost capacity. A significant portion of the cold-related outages, especially in the final hours of the polar vortex study period, were related to fuel-gelling issues. Of the 1,984 MW of cold-weather-related outages reported at 10:00 a.m. on January 8, 2014, 770 MW were related to fuel-gelling issues. Some dual-fuel units experienced challenges ranging from a lack of natural gas required for starting the alternate fuel, to fuel freezing in the injectors. While many of these units’ preparations included testing of the dual-fuel switchover capability, none of the testing was performed under the actual extreme conditions. Excluding the fuel-gelling issues, the non-Canadian portions of NPCC experienced eight hours in the time frame of interest during which the amount of cold-weather-related generation outages exceeded 1,000 MW and never exceeded more than 1,300 MW. Excluding unrelated outages, outages related to curtailments and interruptions of natural gas delivery were the significant contributor of the NPCC generator outages. These outages totaled a maximum of 3,296 MW of generators and, as shown in Figure 8, they significantly impacted NPCC‘s generation resources starting at approximately 10:00 a.m. on January 7, 2014.

Chapter 2 – Effects
NERC | Polar Vortex Review | September 2014 9
ReliabilityFirst
Figure 9: RF: Cumulative Impact of Outage Type vs. Temperature (F) ReliabilityFirst experienced the greatest number of generator outages of all the Regions. While some of these outages were the result of cold weather, it was the number of units that were either unavailable or derated due to the lack of natural gas availability that was the major issue for RF. This situation was exacerbated by the loss of a natural gas compressor station in Delmont, PA on January 7, 2014, which reduced the delivery capacity of the Texas Eastern (TE) pipeline by 575,000 DTh/day. While the conversion of DTh/day to generating capacity can vary depending on the specific generators and type of generation (simple cycle vs. combined cycle, for instance), this represents approximately 1,700–2,300 MW of generation running 24 hours a day. The variance depends on the heat rates of the units involved, with the higher estimate obtained from the most efficient unit types. Overall, RF experienced a maximum of just over 5,300 MW of outages due to cold weather issues, and only 13 of the 60 hours had 4,000 MW or more of cold-weather-related outages. In contrast, RF experienced over 9,000 MW of fuel-related outages in 25 of the 60 hours of interest, and reached a peak outage level of approximately 10,700 MW due to fuel.
Chapter 2 – Effects
NERC | Polar Vortex Review | September 2014 10
SERC Reliability Corporation
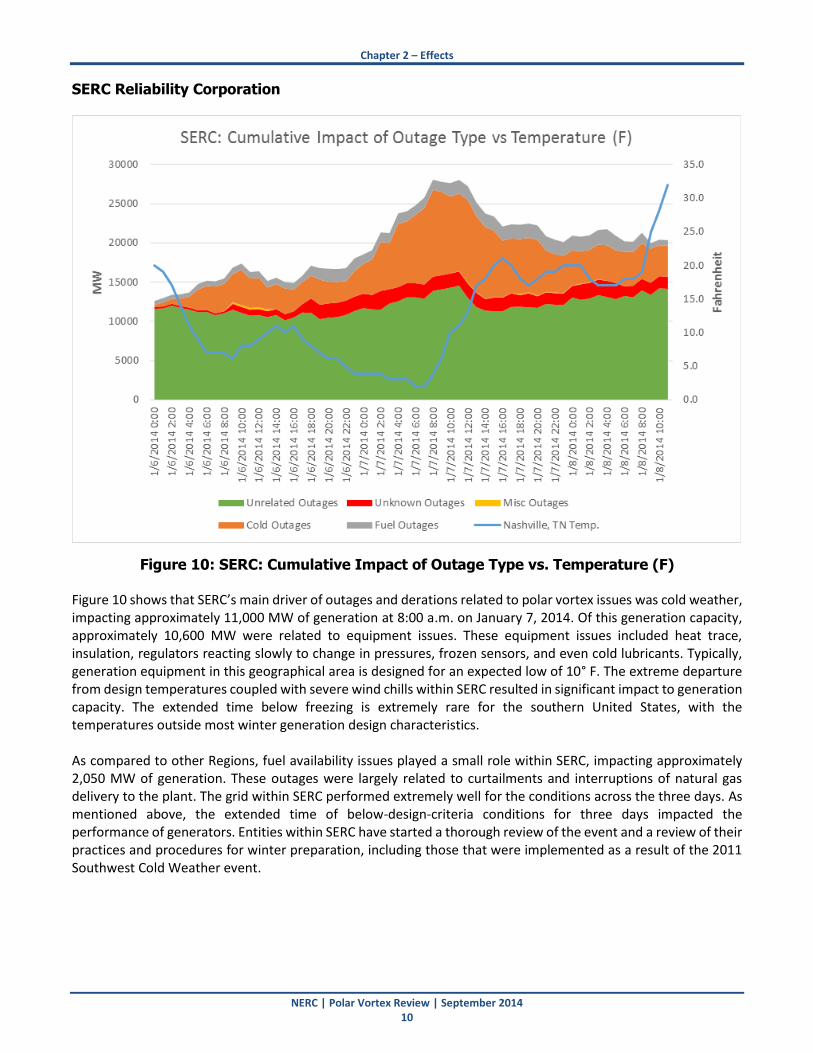
Figure 10: SERC: Cumulative Impact of Outage Type vs. Temperature (F) Figure 10 shows that SERC’s main driver of outages and derations related to polar vortex issues was cold weather, impacting approximately 11,000 MW of generation at 8:00 a.m. on January 7, 2014. Of this generation capacity, approximately 10,600 MW were related to equipment issues. These equipment issues included heat trace, insulation, regulators reacting slowly to change in pressures, frozen sensors, and even cold lubricants. Typically, generation equipment in this geographical area is designed for an expected low of 10° F. The extreme departure from design temperatures coupled with severe wind chills within SERC resulted in significant impact to generation capacity. The extended time below freezing is extremely rare for the southern United States, with the temperatures outside most winter generation design characteristics. As compared to other Regions, fuel availability issues played a small role within SERC, impacting approximately 2,050 MW of generation. These outages were largely related to curtailments and interruptions of natural gas delivery to the plant. The grid within SERC performed extremely well for the conditions across the three days. As mentioned above, the extended time of below-design-criteria conditions for three days impacted the performance of generators. Entities within SERC have started a thorough review of the event and a review of their practices and procedures for winter preparation, including those that were implemented as a result of the 2011 Southwest Cold Weather event.

Chapter 2 – Effects
NERC | Polar Vortex Review | September 2014 11
Southwest Power Pool Regional Entity
Figure 11: SPP: Cumulative Impact of Outage Type vs. Temperature (F) SPP was minimally impacted by the fuel outages, with a maximum of approximately 150 MW of fuel-related outages. Additionally, cold weather directly impacted a maximum of approximately 1,200 MW of generation, with 41 hours being under 700 MW of cold-impacted outages. Excluding Florida, SPP experienced the lowest number of cold-impacted outages, despite being one of the first areas impacted by the polar vortex.

Chapter 2 – Effects
NERC | Polar Vortex Review | September 2014 12
Texas Reliability Entity
Figure 12: TRE: Cumulative Impact of Outage Type vs. Temperature (F)
Texas Reliability Entity experienced a maximum of 3,087 MW of cold-weather-related generation outages, but by the end of the start of peak hours of January 7, 2014, the interconnection had completely recovered from the cold weather issues. The cold-impacted generation capacity does not include over 700 MW of wind generation low-temperature-related trips, which are currently not reported in GADS. These outages were due to cold temperatures outside the operating limits of the wind turbines. Based on GADS data, the maximum capacity affected by forced outages and derations was 11,385 MW. Fuel-related issues were fairly consistent, however, ranging from a high of 2,309 MW down to a low of 1,634 MW. These restrictions were the result of the natural gas transportation system experiencing extremely high demand, resulting in fuel restrictions to power plants located near a major metropolitan area.

Chapter 2 – Effects
NERC | Polar Vortex Review | September 2014 13
Generator Issues by Fuel Type Figure 13 illustrates the percentage of installed capacity sorted by the appropriate fuel types located within the Eastern and ERCOT Interconnections. Of the three major fuel types, representing 83 percent of all generation, over 40 percent is natural gas, 31 percent is coal, and 12 percent is nuclear. Figure 13 shows that of these three fuel types, the polar vortex had the least impact on nuclear plants. Coal plants accounted for 26 percent of the outages. Natural gas represented over 55 percent of the total outages during the polar vortex.
Figure 13: Percentage of Net Dependable Capacity by Fuel Type (left); Percentage of Capacity Lost During Polar Vortex by Fuel Type (right) in Eastern and ERCOT
Interconnections One of the largest issues that impacted gas-fired generation was the curtailment or interruption of fuel supply. Unlike coal and fuel oil, natural gas is not typically stored on site. As a result, generators rely on real‐time delivery of natural gas from their suppliers. As natural gas is widely used outside the power sector, the demand from other sectors—in particular residential heating demand during cold winter weather—can critically affect the ability of pipeline operators and suppliers to deliver natural gas to the power sector. Cold weather effects on equipment The extreme cold weather had a major impact on generation equipment. Of the approximately 19,500 MW of capacity lost due to cold weather, over 17,700 MW was due to frozen equipment. The following list illustrates some of the challenges faced by generator owners and operators due to the effects of cold weather on equipment. These challenges affected almost every dimension of the generation, from instrumentation, to fuel quality, to air-fuel mix, etc. Newer generation units’ cold weather preparations were tested for potentially the first time for these temperature extremes, and many older units experienced extremes beyond what they were designed to operate. The examples below are individual occurrences that are

Chapter 2 – Effects
NERC | Polar Vortex Review | September 2014 14
representative of the challenges faced during this extreme period. Not all of these instances resulted in a forced outage; many just delayed the unit’s ability to come on-line or resulted in the unit’s derating. Examples of extreme cold weather effects on generation:
The drum level transmitter sensing lines froze, indicating a false drum level and consequently tripping the boiler.
Moisture ingress caused gear boxes, valve positioners, and solenoid valves to fail due to freezing.
Heat trace electric circuits not working prior to the event tripped during the event, or were miswired.
Cold air backflow down the stack and into the boiler affected performance.
During start-up from the previous outage, the B phase stab disconnect was not fully engaged, which resulted in voltage differential between phases. The unit had to be removed from service to repair the disconnect. Upon investigation, the damage to the disconnect was caused by ice build-up from the unit’s cooling towers.
Circulating water was frozen, causing a loss of supply of needed cooling water.
Extreme cold weather and cold oil resulted in oil pressure control tripping.
A plant steam pressure transmitter froze due to extreme cold conditions, which limited the operation of the condenser air removal equipment, and the unit tripped on low vacuum. The transmitter is located inside the main building close to an exterior wall louver.
Impulse tube lines, level transmitters, or pressure sensing lines were uninsulated or underinsulated, resulting in freezing components.
A transformer had water in it and froze.
A feedwater heater pressure sensing line froze, which required the unit to be taken off-line.
Fan damper operation was sluggish during cold weather due to cold grease, and a deaerator level indication had a frozen sensing line.
Steam and water flow transmitters were uninsulated or underinsulated, resulting in freezing components.
The unit tripped due to a frozen super heat pressure transmitter.
A collector ring failure was caused by insufficient brush tension resulting from very cold temperatures.
Air entrainment in the sensing lines caused a transmitter to fail. The line did not actually freeze, but it interfered with instrument compensation.
A frozen gas valve caused a unit outage.
The diesel fuel changed consistency, rendering the fuel unusable in the cold weather.
Moisture in an air line to the inlet bleed heat valve froze.
The static frequency converter initiated a trip during preparation of Static Frequency Converter & Static Excitation System (SFC/SES) caused by not receiving exciter circuit breaker checkback signal for the closed position. Subsequent failures were caused by not receiving the checkback signals from the start disconnect switch in the generator breaker. Extreme cold temperatures caused grease on start disconnect switch stabs to become tacky and not allow it to close without binding.
Oil pressure was affected due to cold oil from the lube oil (LO) cooler entering the LO supply header too rapidly. The LO temperature control valve has no cold ambient bias to slow down movement in winter.
Chapter 2 – Effects
NERC | Polar Vortex Review | September 2014 15
Frozen NOX water header pressure sensing lines in the unit resulted in no available NOX water injection for emissions control.
Water froze in a water manifold that had not been purged of water.
Generator logic tripped the turbine due to a frozen water flush transmitter. The transmitter was frozen due to cold weather; however, the logic should not have tripped the unit.
The outage was due to a failure of the water injection heating system. Cold weather may have contributed to but was not the primary cause of the outage. Power was removed from the heating system due to a water leak that caused an electrical short circuit. It is not known if cold weather caused or contributed to the initial water leak. Once power was removed from the heat tracing on the water injection pipes, they froze. The situation was corrected by placing a tent around the problem area and using a torpedo heater to unfreeze the water lines.
A unit water injection variable frequency drive (VFD) controller tripped due to extreme weather, requiring a unit shutdown to prevent emission exceedance.
A unit heater tripped, which affected operation of VFD. During restarting the water injection VFD, unit was at upper load and flamed out from inrush of water.
A frozen water valve located outside for the oil cooling system caused the unit to trip. The ambient temperature at the time of the trip was -3° F with an 8 mph SW wind.
The unit would not transfer to “Pre-Mix Steady State” due to operating in the cold ambient temperatures; it required combustion tuning for the colder conditions.
A gas transfer purge valve froze.
The pressure dropped due to regulator not being able to react quickly enough because of the extreme cold temperature.
An output breaker would not close due to the cold.
The premix line froze due to heat tracing failure.
Fuel oil gelled the filters due to the cold temperatures.
A hydraulic starter pressure sensing line froze.
Lube oil temperature was below 50° F, causing the unit to be in a not-ready-to-start state.
The diesel fuel being provided to the starting motor gelled due the extreme cold temperatures.
The diesel starting engine failed to provide enough turbine speed to initiate firing.
A liquid fuel modulating valve frozen (located in unheated engine compartment when off-line).
A starter duct pressure switch located in unheated engine compartment froze.
A unit tripped on loss of flame due to the combination of fuel oil delivery temperature being low and ignition gas being insufficient to maintain the flame.
A unit could not start due to hydraulic temperatures too low for proper operation of fuel valves.
Frozen regulator on monitor valve at meter station caused low fuel gas pressure.
The inlet air intake was covered with snow and ice.
Moisture in a fuel oil pressure switch froze and the pressure switch diaphragm burst.

Chapter 2 – Effects
NERC | Polar Vortex Review | September 2014 16
The fogging and overspray were put in a winterized state. The systems were available but required additional time to return to service.
Cold weather caused water injection lines to become frozen, which resulted in a transmitter control issue.
The gas control and purge valves were sluggish due the extreme temperature. The control timers for the valves were adjusted to allow for the longer valve operating time.
The relay setting did not take into account the higher-than-normal output for the extreme cold weather.
The lube oil was too cold because the compartment heater malfunctioned. This caused the lube oil temp alarm to trip the unit in start-up.
A solenoid was frozen on the water injection system. This caused an emissions issue.
Compressor blade icing caused a unit outage.
Units tripped when the units were being transferred from gas to liquid fuel. These CTs were running on gas when the site was asked to transfer them to liquid fuel due to limited gas availability. Extremely cold temperatures along with the liquid fuel heaters being out of service contributed to an increase in fuel oil viscosity that led to a high filter differential pressure and subsequent fuel system fault trips while attempting to transfer to liquid fuel.
Low ambient temperature led to fuel waxing and clouding.
Frazil ice blocked the intake, causing insufficient water supply to the turbine.
Due to low temperature, the seal oil regulator froze, allowing the oil pressure to rise above the hydrogen pressure, therefore putting oil inside the steam turbine generator.
A steam turbine exhaust pressure switch for HP turbine froze, which signaled a false high pressure, thereby tripping the steam turbine.
Cold temperature caused materials on the generator hydrogen cooler cooling water loop to contract, and the flanged joint at generator shell began to leak hydrogen. The flange bolting was re-torqued to stop the leak.
A seal steam pressure transmitter sensing line froze, causing pressure to read high opening bypass to condenser, which in turned caused loss of sealing steam to turbine.
A unit tripped due to cooling tower drift freezing onto and restricting flow through the inlet bird screen; with enough build-up, this caused the implosion doors to open.
While switching from gas to oil, a process step was missed, resulting in the trip.
A unit was shut down for inspection because a noise could be heard during the hourly inspections. Ice was found on the inlet guide vanes.

NERC | Polar Vortex Review | September 2014 17
Chapter 3 – Discussion
Increased reliance on natural gas during the polar vortex exposed the industry to various challenges with fuel supply and delivery. This increased reliance, compounded by generation outages during the extreme conditions, increased the risks to the reliable operation of the BPS. As the industry relies more on natural-gas-fired capacity to meet electricity needs, it is important to examine potential risks associated with increased dependence on a single fuel type. The extent of these concerns varies from Region to Region; however, they are most acute in areas where power generators rely on interruptible natural gas pipeline transportation. Unlike coal and fuel oil, natural gas is not typically stored on site. As a result, real‐time delivery of natural gas through a network of pipelines and bulk gas storage is critical to support electric generators. Natural gas is widely used outside the power sector, and the demand from other sectors—particularly coincident end-user gas peak demand during cold winter weather—critically affects gas providers’ ability to deliver interruptible transportation service in the power sector. Additionally, demand for natural gas is expected to grow in other sectors (e.g., transportation, exports, and manufacturing). The following excerpts are from industry participant discussions about the polar vortex:
“Some gas-fired units have the capability to use an alternate fuel (dual-fuel capability), which increases flexibility when gas supply becomes tight. The predominant alternate fuel is oil. While dual-fuel units increase flexibility, there were still challenges operating the units on oil. PJM requested dual-fuel generation owners unable to secure gas to operate their units on oil during the extremely cold weather events. Even with this flexibility, generation owners encountered issues including run-time limits related to permit-defined environmental restrictions, resupply challenges and increased failure rates for unit startup. Units that switch to oil operate with increased emissions, which limits their maximum run times due to environmental constraints. In other cases, units operating on oil may have had only limited ability to make and store demineralized water for the injection systems that must be operated to reduce nitrogen oxide emissions when running on oil. PJM coordinated with generation owners that needed to decrease the maximum run time per day for their units in order to conserve emission credits. Identification and tracking of fuel limitations was done manually by PJM and the generator owners. There were approximately 1,000 MW of generation with decreased run times for emission reasons. The increase in demand for oil caused another challenge for generation owners. Many units in the Northeast switched to oil as gas became unavailable increasing demand for oil. In some cases, oil suppliers began to run low on inventory or deliveries were slow because increased demand was unexpected and available delivery trucks were limited. Generation owners found it difficult to keep oil tanks full on a daily basis and had to limit run hours for their units. There were approximately 2,000-3,000 MW of generation affected by oil supply and delivery issues. Also, generating units running on oil have an increased failure-to-start rate due to clogged fuel lines.”7
Many outages, including a number of those in the southeastern United States, were the result of extreme cold weather that was below the design basis of generating units. Industry should identify and protect against failures that occurred within the design basis of their plants. As illustrated in Figure 10 (Chapter 2), SERC experienced 25 hours during the study period where they were below their typical temperature design basis, including 17 continuous hours below that basis.
7PJM Report: http://www.pjm.com/~/media/documents/reports/20140509-analysis-of-operational-events-and-market-impacts-during-
the-jan-2014-cold-weather-events.ashx pg. 39-40

Chapter 3 – Discussion
NERC | Polar Vortex Review | September 2014 18
The analysis of the GADS data provided in Appendix A shows that most generating units performed in the expected range of EFOR during the month of January 2014, based on historical analysis. Overall, most units performed with an EFOR within or slightly better than (i.e., below) the expected range, based on the past five years. The exception is natural gas units, which in two Regions experienced a higher-than-expected EFOR. This observation validates the concerns that NERC raised in the 2013 Long-Term Reliability Assessment8 on increased dependence on natural gas for electric power.
8 http://www.nerc.com/pa/RAPA/ra/Reliability_Assessments_DL/2013_LTRA_FINAL.pdf, pg. 35

NERC | Polar Vortex Review | September 2014 19
Chapter 4 – Conclusion
Unlike the February 2011 Southwest Cold Weather Event, the 2014 polar vortex resulted in many generator outages from entities exceeding the design basis of their plants and difficulties facing the natural gas transportation sector. System Operators were faced with many difficult decisions and were able to successfully maintain reliability through extensive previous training and preparation. During the polar vortex, several System Operators used load reduction techniques such as voltage reduction, interruptible loads, and demand-side management. Many System Operators also made effective use of emergency procedures to manage loads and generation.
Observations and Recommendations Lessons Learned from the February 2011 Southwest event highlighted the importance of preparation for extreme weather events. The following observations and recommendations are based on the analysis in this report: Observations
1. Generation facilities have made improvements in their winter preparation activities since February 2011; however, every extreme event provides insight for future improvements. Generation facilities across all Regions have indicated that they have reviewed and/or implemented recommendations from the February 2011 Southwest Cold Weather Event Lessons Learned9 as well as the Generator Winter Weather Readiness guideline.
2. The value of regular training and annual drills was demonstrated during events, as the operators and other RC area entities were able to effectively and successfully implement emergency procedures.
3. Proactive communication and coordination between the RCs and within the RC areas themselves helped ensure appropriate situational awareness was maintained and facilitated rapid response as needed.
4. Planned and forced generation outages in some Regions exceeded the worst-case assumptions used in seasonal assessments. These assumptions warrant further review; in particular, the assumptions for generating unit forced and planned outage rates.
5. Some ISO/RTOs conducted detailed seasonal fuel assurance surveys to include gas transportation arrangements, starting oil inventories, and oil replacement capabilities (oil transportation capability).
6. Many outages, including a number of those in the southeastern United States, were the result of extreme ambient temperatures that were below the design basis of the generating unit.
Recommendations
1. Examine and review the natural gas supply issues encountered during the event. Industry should also work with gas suppliers, markets, and regulators to quickly identify issues with natural gas supply and transportation so that appropriate actions can be developed and implemented to allow generators to be able to secure firm supply and transportation at a reasonable rate.
2. Review and update power plant weatherization programs as a result of lessons learned from this event. This includes review of plant procedures, training programs for severe weather and winter weather events, and availability of material and equipment for response to these events. Entities should continue
9 http://www.nerc.com/pa/rrm/ea/Pages/February-2011-Southwest-Cold-Weather-Event.aspx

Chapter 4 – Conclusion
NERC | Polar Vortex Review | September 2014 20
to follow the Reliability Guideline (Generating Unit Winter Weather Readiness – Current Industry Practices).10
3. Continue or consider implementing a program of periodic site reviews of generation facilities’ winter preparation. These programs produced tangible benefits in the ERCOT Interconnection by improving generator winter preparation and sharing of good industry practices, and can be implemented within an individual company, an ISO/RTO, an appropriate Regional Entity, or any combination.
4. Review the basis for forced and planned generation outages used in seasonal assessments to ensure that appropriate outage rates for the extreme cases are correct and that unit derates are appropriately included.
5. Review generation and transmission outage scheduling processes to limit planned outages during possible peak winter periods.
6. Entity winter assessments should include base assumptions and stress cases for the loss of varying amounts of gas-fired generation, and should consider oil burn rates relative to oil replenishment rates to determine the duration of continuous operation for oil-fired generation.
7. Continue to improve operations management awareness of the fuel status of all generators, including improved awareness of pipeline system conditions. This might include a daily fuel inventory solicitation process, ability to dispatch plants early in anticipation of extreme winter weather, and increased communication channels with electric and gas industries during extreme events.
8. Ensure that the fuel on hand and/or ordered for the winter season is appropriately protected from the effects of cold weather at the expected extreme temperatures.
9. Industry should work to identify and protect against outages that occurred within the cold weather design basis of the plant. Additionally, entities should review the winter cold weather temperature design basis for their generating units to determine if improvements are needed, while ensuring that the generating unit’s ability to withstand higher temperatures in the summer is not compromised.
10. Industry should review internal processes to ensure they are ready to take proactive actions to secure the waivers (market, environmental, fuel, etc.) from the appropriate entities. For example, PJM requested waivers of certain provisions of PJM’s governing documents that would permit them to share certain non-public information with natural gas pipeline operators during the forecasted extreme weather conditions. FERC responded promptly to PJM’s filing, which enabled those communications to commence quickly.11
10 http://www.nerc.com/pa/rrm/ea/ColdWeatherTrainingMaterials/Relibility_Guideline_Generating_Unit_Winter_Weather_Readiness.
pdf 11 PJM Report: http://www.pjm.com/~/media/documents/reports/20140509-analysis-of-operational-events-and-market-impacts-during-
the-jan-2014-cold-weather-events.ashx pg. 11

NERC | Polar Vortex Review | September 2014 21
Appendix A
Overview of GADS GADS was developed by utility designers, operating engineers, and system planners to meet the information needs of the electric utility industry. For this purpose, specific objectives for the GADS program were established: compilation and maintenance of an accurate, dependable, and comprehensive database capable of monitoring the performance of electric generating units and major pieces of equipment. GADS is not a substitute for the detailed, often unique, data systems typically found at power plants, or for maintenance data programs that record detailed equipment failures and repair techniques. The objectives of the GADS program can be met through the collective effort of participating GADS members, the cooperation in reporting to GADS, and sharing information with the industry. Based on research by the IEEE 762 committee, the boundary between the GENCOs and TRANSCOs is as follows: “A generating unit includes all equipment up to (in preferred order): (1) the high-voltage terminals of the generator step-up (GSU) transformer and the station service transformers; (2) the GSU transformer (load) side of the generator-voltage circuit breakers; or (3) at such equipment boundary as may be reasonable considering the design and configuration of the generating unit.” An event occurs any time a generating unit’s operating status or capability changes. Four general classifications of events are reported to GADS: outages, deratings, reserve shutdowns, and non-curtailing events. Reporting event data, in addition to performance and design data, provides all the information needed to evaluate generating unit availability. Event data are especially useful since they are often used to do specialized unit and equipment operation and design analyses. Participation in the GADS program is mandatory for all conventional units 20 MW and larger (as of January 1, 2013). Reporting the level of detail requested in these GADS Data Reporting Instructions enables industry analysts to perform detailed, useful analyses. All units except hydro and pumped storage units without automatic data recording equipment are required to report reserve shutdown events. All other events (forced, maintenance, and planned) must be reported. Calculations used to determine equivalent forced outage rate Service hours (SH) is the sum of all unit service hours. Available hours (AH) is the sum of all service hours (SH) + reserve shutdown hours (RSH) + pumping hours + synchronous condensing hours. Period hours (PH) is the number of hours that the unit was in the active state. Forced outage hours (FOH) is the sum of forced outages + startup failures hours. Equivalent forced derated hours (EFDH) – Each individual forced derating (D1, D2, and D3) is transformed into equivalent full outage hour(s). This is calculated by multiplying the actual duration of the derating (hours) by the size of the reduction (MW) and dividing by the net maximum capacity (NMC). These equivalent hour(s) are then summed. Equivalent forced derated hours during reserve shutdown (EFDHRS) – Each individual forced derating (D1, D2, and D3) that occurred during a reserve shutdown (RS) is transformed into equivalent full outage hour(s). This is

Appendix A
NERC | Polar Vortex Review | September 2014 22
calculated by multiplying the actual duration of the derating (hours) by the size of the reduction (MW) and dividing by the NMC. These equivalent hour(s) are then summed.
Equivalent Forced Outage Rate (EFOR) is calculated by:
𝐸𝐹𝑂𝑅 =(𝐹𝑂𝐻 + 𝐸𝐹𝐷𝐻)
(𝐹𝑂𝐻 + 𝑆𝐻 + 𝑆𝑦𝑛𝑐ℎ𝑟𝑜𝑛𝑜𝑢𝑠 𝐶𝑜𝑛𝑑𝑒𝑛𝑠𝑖𝑛𝑔 𝐻𝑜𝑢𝑟𝑠 + 𝑃𝑢𝑚𝑝𝑖𝑛𝑔 𝐻𝑜𝑢𝑟𝑠 + 𝐸𝐹𝐷𝐻𝑅𝑆)
Weighted versus time-based methods for pooled statistics
Two methods are used to calculate pooled (grouping) unit statistics for generation:
1. Unweighted (time-based) methods for calculating pooled (grouping) unit statistics.
2. Weighted (capacity-based) methods for calculating pooling (grouping) unit statistics. When a single generating unit’s performance statistics are calculated, it does not matter whether unweighted or weighted-based statistics are used. The answer will generally be the same. The real difference between the unweighted and weighted statistics is in pooling (or grouping) of a set of generating units. In such cases, a group of units of similar size will show little or no difference, but for groups of units where the MW size is very different (greater than 50 MW), the statistics will be very different. With unweighted statistics, all units are considered equal in outage impact. In the unweighted equations, no MW size is introduced into the equations, and the results are based on time, not energy produced (or not produced). In such cases, a 50 MW gas turbine and a 1,000 MW nuclear unit have the same impact of the resulting statistics. With weighted statistics, the larger MW size unit in the group has more impact on the final statistics than a smaller generating unit. That is because the MW size of the unit (NMC) is part of the equation. In such cases, a 1,000 MW nuclear unit would have 20 times the impact on the final outcome of the calculation than would its 50 MW gas turbine companion. This study used the weighted method for calculating pooling (grouping) unit statistics for generation. Analysis of EFOR by Regional Entity The following is an analysis of EFOR for the months of January, February, and March for 2009–2014. Also, for the purposes of this analysis, FRCC and WECC will not be examined, since they were not directly involved in the polar vortex. In addition, all values of EFOR in this appendix are calculated monthly. Coal Figures A1, A2, and A3 provide historical EFOR for coal units for January, February, and March by year and Regional Entity. In all Regions examined, coal units experienced an EFOR in January 2014 well within the range of expected EFOR based on the prior five winter operating periods. The historical winter monthly EFOR performance of coal units in MRO ranged from 4.8 to 7.6 percent, and in January 2014 they experienced an EFOR of 5.3 percent. In NPCC, the historical winter monthly EFOR performance ranged from 6.9 to 21.2 percent, and coal units experienced an EFOR of 7.3 percent in January 2014. Likewise, coal units in RF experienced an EFOR of 9.3 in January 2014, compared with a historical range of 8.5 to 14.2 percent. In SERC, coal units experienced an EFOR of 4.9 in January 2014, which was better than any historical winter monthly EFOR for the years examined (prior monthly values ranged from 5.0 to 10.2). The EFOR performance of coal units in SPP ranged from 3.2 to 13.6 percent, and in January 2014 they experienced an EFOR of 6.4 percent. Finally, coal units in TRE experienced an EFOR of 12.8 percent in January 2014, compared with a historical range of 0 to 14.3 percent.

Appendix A
NERC | Polar Vortex Review | September 2014 23
Figure A1: Historical EFOR for Coal Units in January by Year and Regional Entity
Figure A2: Historical EFOR for Coal Units in February by Year and Regional Entity
Figure A3: Historical EFOR for Coal Units in March by Year and Regional Entity

Appendix A
NERC | Polar Vortex Review | September 2014 24
Natural Gas Figures A4, A5, and A6 provide historical EFOR for natural gas units for January, February, and March by year and Regional Entity. In all Regions examined, natural gas units experienced an EFOR in January 2014 within the range of expected EFOR based on the prior five winter operating periods. The EFORs in NPCC, SERC, and SPP were near the top end of the range for their respective Region. The historical winter monthly EFOR performance of natural gas units in MRO ranged from 8.3 to 18.3 percent, and in January 2014 they experienced an EFOR of 17.8 percent. In NPCC, the historical winter monthly EFOR performance ranged from 16.5 to 39.2 percent, and natural gas units experienced an EFOR of 35.4 percent in January 2014. Likewise, natural gas units in RF experienced an EFOR of 18.5 percent in January 2014, compared with a historical range of 4.8 to 25.5 percent. In SERC, natural gas units experienced an EFOR of 11.4 percent in January 2014, which was the same as the worst monthly EFOR calculated for the years examined (prior monthly values ranged from 6.3 to 11.4 percent). The EFOR performance of natural gas units in SPP ranged from 5.8 to 21.1 percent, and in January 2014 they experienced an EFOR of 19.5 percent. Finally, natural gas units in TRE experienced an EFOR of 5.3 percent in January 2014, compared with a historical range of 2.7 to 16.8 percent.

Appendix A
NERC | Polar Vortex Review | September 2014 25
Figure A4: Historical EFOR for Natural Gas in January by Year and Regional Entity
Figure A5: Historical EFOR for Natural Gas in February by Year and Regional Entity
Figure A6: Historical EFOR for Natural Gas in March by Year and Regional Entity

Appendix A
NERC | Polar Vortex Review | September 2014 26
Diesel Units Figures A7, A8, and A9 provide historical EFOR for diesel units for January, February, and March by year and Regional Entity. Since participation in the GADS program is mandatory for all conventional units 20 MW and larger, many diesel units do not report to GADS. The comparative analysis, therefore, is of limited value and not provided.

Appendix A
NERC | Polar Vortex Review | September 2014 27
Figure A7: Historical EFOR for Diesel Units in January by Year and Regional Entity
Figure A8: Historical EFOR for Diesel Units in February by Year and Regional Entity
Figure A9: Historical EFOR for Diesel Units in March by Year and Regional Entity

Appendix A
NERC | Polar Vortex Review | September 2014 28
Fluidized Bed Units Figures A10, A11, and A12 provide historical EFOR for fluidized bed units for January, February, and March by year and Regional Entity. NPCC and SPP have no fluidized bed units reported in their Regions. In all other Regions examined, fluidized bed units experienced an EFOR in January 2014 within the range of expected EFOR based on the prior five winter operating periods. The historical winter monthly EFOR performance of fluidized bed units in MRO ranged from 0.3 to 34.1 percent, and in January 2014 they experienced an EFOR of 3.2 percent. Fluidized bed units in RF experienced an EFOR of 0.1 percent in January 2014, compared with a historical range of zero to 22.6 percent (excluding the month of March 2013, which was an anomaly at 87.5 percent). The EFOR performance of fluidized bed units in SERC ranged from 0 to 25.4 percent, and in January 2014 they experienced an EFOR of 4.5 percent. Finally, fluidized bed units in TRE experienced an EFOR of 2.9 percent in January 2014, compared with a historical range of zero to 29.6 percent.

Appendix A
NERC | Polar Vortex Review | September 2014 29
Figure A10: Historical EFOR for Fluidized Bed Units in January by Year and Regional Entity
Figure A11: Historical EFOR for Fluidized Bed Units in February by Year and Regional Entity
Figure A12: Historical EFOR for Fluidized Bed Units in March by Year and Regional Entity

Appendix A
NERC | Polar Vortex Review | September 2014 30
Hydro/Pumped Storage Figures A13, A14, and A15 provide historical EFOR for hydro and pumped storage for January, February, and March by year and Regional Entity. In all Regions examined, hydro and pumped storage experienced an EFOR in January 2014 within the range of expected EFOR based on the prior five winter operating periods. The historical winter monthly EFOR performance of hydro and pumped storage in MRO ranged from 0.3 to 3.3 percent, and January 2014 they experienced an EFOR of 0.8 percent. In NPCC, the historical winter monthly EFOR performance ranged from 1.5 to 11 percent, and hydro and pumped storage experienced an EFOR of 0.3 percent in January 2014. Hydro and pumped storage in RF experienced an EFOR of 8.6 percent in January 2014, compared with a historical range of 0.9 to 10.4 percent. In SERC, hydro and pumped storage experienced an EFOR of 1.5 percent in January 2014, compared with a historical range of 1 to 9.7 percent. The EFOR performance of hydro and pumped storage in SPP ranged from zero to 12.7 percent, and January 2014 they experienced an EFOR of 0.4 percent. Finally, hydro and pumped storage in TRE experienced an EFOR of 0.5 percent in January 2014, compared with a historical range of zero to 21.5 percent.

Appendix A
NERC | Polar Vortex Review | September 2014 31
Figure A13: Historical EFOR for Hydro/Pumped Storage in January by Year and Regional
Entity
Figure A14: Historical EFOR for Hydro/Pumped Storage in February by Year and Regional
Entity
Figure A15: Historical EFOR for Hydro/Pumped Storage in March by Year and Regional
Entity

Appendix A
NERC | Polar Vortex Review | September 2014 32
Nuclear Figures A16, A17, and A18 provide historical EFOR for nuclear units for January, February, and March by year and Regional Entity. In all other Regions examined, nuclear units experienced an EFOR in January 2014 within the range of expected EFOR based on the prior five winter operating periods. The historical winter monthly EFOR performance of nuclear units in MRO ranged from 0 to 11.7 percent, and in January 2014 they experienced an EFOR of 10.3 percent. In NPCC, the historical winter monthly EFOR performance ranged from 0 to 7.2 percent, and nuclear units experienced an EFOR of 0.3 percent in January 2014. Nuclear units in RF experienced an EFOR of 0.03 percent in January 2014, compared with a historical range of 0.5 to 4.4 percent. In SERC, nuclear units experienced an EFOR of 1.8 percent in January 2014, compared with a historical range of 0 to 4.7 percent. The EFOR performance of nuclear units in SPP ranged from zero to 23.6 percent, and in January 2014 they experienced an EFOR of 0.0 percent. Finally, nuclear units in TRE experienced an EFOR of 3.9 percent in January 2014, compared with a historical range of zero to 26.4 percent.

Appendix A
NERC | Polar Vortex Review | September 2014 33
Figure A16: Historical EFOR for Nuclear Units in January by Year and Regional Entity
Figure A17: Historical EFOR for Nuclear Units in February by Year and Regional Entity
Figure A18: Historical EFOR for Nuclear Units in March by Year and Regional Entity

Appendix A
NERC | Polar Vortex Review | September 2014 34
Other Units Generation with other fuel types was considered for evaluation but is not included in this analysis. These units represent a small portion of power produced historically, and outage rates and MW produced vary from year to year. They also do not represent a significant portion of generation involved in the polar vortex analysis. Summary Most generation units, grouped by fuel type, performed in the expected range of EFOR, based on historical analysis. During the polar vortex, generation units could be expected to perform in the ranges provided in Table A1. Rows highlighted in yellow are for fuel types that experienced an EFOR greater than the previous high, and rows highlighted in light blue are for fuel types that experienced an EFOR less than the previous low. Overall, most units performed with an EFOR in the expected range, based on the past five years.
Table A1: EFOR Expected Range by Regional Entity and Fuel Type
EFOR range - January to March EFOR range - January only
Region Fuel Low Jan-14 High Low Jan-14 High
MRO
Coal 4.8 5.3 7.6 4.9 5.3 7.6
Natural Gas 8.3 17.8 18.3 9 17.8 14.7
Fluidized Bed 0.3 3.2 34.1 2.5 3.2 34.1
Hydro 0.3 0.8 3.3 0.8 0.8 2.5
Nuclear 0 10.3 11.7 0 10.3 11.5
NPCC
Coal 6.9 7.3 21.2 6.9 7.3 21.2
Natural Gas 16.5 35.4 39.2 18.1 35.4 39.2
Fluidized Bed N/A N/A N/A N/A N/A N/A
Hydro 1.5 0.3 11 2 0.3 11
Nuclear 0 0.3 7.2 0.3 0.3 6.7
RF
Coal 8.5 9.3 14.2 8.5 9.3 12.7
Natural Gas 4.8 18.5 25.5 9.5 18.5 25.5
Fluidized Bed 0 0.1 22.6 1.1 0.1 13.4
Hydro 0.9 8.6 10.4 1.7 8.6 10.4
Nuclear 0.5 0.03 4.4 0.5 0.03 3.6
SERC
Coal 5 4.9 10.2 6.3 4.9 10.2
Natural Gas 6.3 11.4 11.4 8.1 11.4 10.3
Fluidized Bed 0 4.5 25.4 0 4.5 25.4
Hydro 1 1.5 9.7 1 1.5 9.7
Nuclear 0 1.8 4.7 0 1.8 4.5
SPP
Coal 3.2 6.4 13.6 6.3 6.4 13.6
Natural Gas 5.8 19.5 21.1 7 19.5 20.8
Fluidized Bed N/A N/A N/A N/A N/A N/A
Hydro 0 0.4 12.7 0 0.4 10.5

Appendix A
NERC | Polar Vortex Review | September 2014 35
Table A1: EFOR Expected Range by Regional Entity and Fuel Type
EFOR range - January to March EFOR range - January only
Region Fuel Low Jan-14 High Low Jan-14 High Nuclear 0 0 23.6 0 0 0.6
TRE
Coal 0 12.8 14.3 0 12.8 14.3
Natural Gas 2.7 5.3 16.8 9.9 5.3 15.8
Fluidized Bed 0 2.9 29.6 0 2.9 29.6
Hydro 0 0.5 21.5 0 0.5 15.6
Nuclear 0 3.9 26.4 0.1 3.9 22.7

NERC | Polar Vortex Review | September 2014 36
Appendix B
Background on NERC’s Long-Term Assessment of Increasing Dependency on Natural Gas
As of 2008, natural gas is the primary fuel source for on-peak capacity in North America. This trend is expected to continue with the addition of 40 GW of planned gas-fired capacity, accounting for nearly half of all capacity additions over the next decade. An additional 100 GW of gas-fired capacity is included in the generator queue and is not considered in Figure B-1 below.12 By 2023, natural gas will contribute to well over 50 percent of the on-peak resource mix.
Figure B-1: Gas and Coal On-Peak Capacity: 10-Year Projected Outlook
This trend results from a variety of drivers that make natural-gas-fired capacity an attractive option for resource planners. First, the price of natural gas remains low, relative to other fuels, with abundant supplies due to new access to shale formations throughout North America. The emergence of natural gas combined cycle (NGCC) generating technology provides higher efficiency, and these units often require lower engineering, procurement, and construction costs. NGCC plants are oftentimes less challenging to procure because of shorter build times that might exist with other options. Perhaps the most impactful benefit is the lower carbon emissions when compared to coal-fired power plants without carbon capture and sequestration. Finally, natural-gas-fired units can provide System Operators with needed flexibility to address increased variability as additional renewable resources such as wind and photovoltaics are added to the system. As the industry relies more on natural-gas-fired capacity to meet electricity needs, it is important to also examine potential risks associated with increased dependence on a single fuel type. The extent of these concerns varies from Region to Region. These concerns are most acute in areas where generators rely on interruptible natural gas pipeline transportation, and in times when the natural gas demand for power generation grows rapidly. As highlighted in NERC’s 2013 Special Assessment, Accommodating an Increased Dependence on Natural Gas for Electric Power,13 a growing dependence on gas‐fired generation can increase the BPS’s exposure to disruptions from insufficient fuel supply, transportation, and delivery. While the likelihood is low and is largely correlated with
12 http://www.nerc.com/pa/RAPA/ra/Reliability%20Assessments%20DL/2013_LTRA_FINAL.pdf 13 http://www.nerc.com/pa/RAPA/ra/Reliability%20Assessments%20DL/NERC_PhaseII_FINAL.pdf

Appendix B
NERC | Polar Vortex Review | September 2014 37
extreme conditions, disruptions in natural gas supply and transportation to power generators have prompted industry to seek an understanding of the reliability implications associated with increasing gas‐fired generation. With fleets of gas-fired generation being more prevalent across North America, common-mode failures are a significant risk for the electric industry. Unlike coal and fuel oil, natural gas is not easily stored on site. As a result, real‐time delivery of natural gas through a network of pipelines and bulk gas storage is critical to support electric generators. Natural gas is widely used outside the power sector, and the demand from other sectors—particularly coincident end-user gas peak demand during cold winter weather—critically affects the gas providers’ ability to deliver interruptible transportation service in the power sector. Additionally, demand for natural gas is expected to grow in other sectors (e.g., transportation, exports, and manufacturing). As observed during the polar vortex, increased reliance on natural gas exposed the industry to various challenges with fuel supply and delivery. These challenges are predicted to escalate as more baseload generating plants are retired. While baseload generators are replaced with renewables, they are generally not available at full rated capacity during extreme weather events and do not significantly contribute to capacity during these periods.
Historical GADS Analysis NERC has been collecting GADS data since 1982. The NERC Board of Trustees approved mandatory GADS reporting for conventional generating units (excluding renewable generation such as wind and solar) starting January 1, 2012. GADS data was used to perform a historical analysis of natural gas generator outages. Generators report fuel unavailability related outages to GADS under two different outage (cause) codes:
9130 Lack of fuel (water from rivers or lakes, coal mines, gas lines, etc.) where the operator is not in
control of contracts, supply lines, or delivery of fuels
9131 Lack of fuel (interruptible supply of fuel part of fuel contract)
Outages related to lack of fuel are recorded regardless of a unit’s dispatch. If the unit becomes unavailable due to fuel unavailability, the event is recorded as an outage in GADS even if the unit is not dispatched. GADS records outage start and end days and hours by Region, unit type, and utility. Figure B-2 shows the trend of the total gas-fired unit outages reported within the last decade due to lack of fuel (code 9130 and 9131). There were 3,716 hours of cumulative generator outages in the first quarter of 2014, but there were over 80 GW of cumulative net dependable capacity lost. It should be noted that 2014 data only represents the first quarter.
Figure B-2: Natural Gas Historical Outage Events Due to Lack of Fuel (2004–2014Q1)

Appendix B
NERC | Polar Vortex Review | September 2014 38
Figure B-3: Natural Gas Generation Historical Q1 and Q4 Energy Outages (MWh) Due to
Lack of Fuel (2004–2014) Plotting the number of events over time measures the trends outside of the normal event-count averages. Figure B-3 shows the total events reported by category. Values from 2014 increased the average to 363 events per year; meanwhile, the average for the last decade was around 296 events per year. The code U1 (Unplanned (forced) Outage – Immediate) accounts for 73 percent of the total events reported since 2004. Code U1 was reported 924 times (90 percent) in 2014 compared to 316 (64 percent) time in 2013. Again, there is a significant increase in 2014 (Q1).
Figure B-4: Total Number of Outage Events Reported14
Event Type Codes Used
Event Type Definition
U1 Unplanned (Forced) Outage — Immediate - An outage that requires immediate removal of a unit from service, another Outage State, or a Reserve Shutdown state. This type of outage usually results from immediate mechanical/electrical/hydraulic control systems trips and operator-initiated trips in response to unit alarms.
U2 Unplanned (Forced) Outage — Delayed - An outage that does not require immediate removal of a unit from the in-service state but requires removal within six hours. This type of outage can only occur while the unit is in service.
14 More information on GADS and GADS code used are available at GADS Event Reporting

Appendix B
NERC | Polar Vortex Review | September 2014 39
Event Type Codes Used
Event Type Definition
SF Start-up Failure - An outage that results when a unit is unable to synchronize within a specified start-up time following an outage or Reserve Shutdown.
D1 Unplanned (Forced) Derating — Immediate - A derating that requires an immediate reduction in capacity.
D2 Unplanned (Forced) Derating — Delayed - A derating that does not require an immediate reduction in capacity but requires a reduction within six hours.
D3 Unplanned (Forced) Derating — Postponed - A derating that can be postponed beyond six hours but requires a reduction in capacity before the end of the next weekend.
D4 Maintenance Derating - A derating that can be deferred beyond the end of the next weekend (Sunday at 2400 or before Sunday turns into Monday) but requires a reduction in capacity before the next Planned Outage (PO). A D4 can have a flexible start date and may or may not have a predetermined duration.
PO Planned Outage - An outage that is scheduled well in advance that is of a predetermined duration, lasts for several weeks, and occurs only once or twice a year. Turbine and boiler overhauls or inspections, testing, and nuclear refueling are typical Planned Outages.
MO Maintenance Outage - An outage that can be deferred beyond the end of the next weekend (defined as Sunday at 2400 hours or as Sunday turns into Monday), but requires that the unit be removed from service, another outage state, or Reserve Shutdown state before the next Planned Outage (PO). Characteristically, an MO can occur any time during the year, has a flexible start date, may or may not have a predetermined duration, and is usually much shorter than a PO.