polar portal season report 2020
TRANSCRIPT
1
Polar Portal Season Report 2020
2020 was once again a warm year in the Arctic. While temperatures were
close to normal in the western Arctic and in Greenland in particular, it was
unusually warm in the eastern region of the Arctic and especially in North-
ern Siberia.
It was a warm year in the Arctic, but there were huge regional differences. In an otherwise
more or less normal year, the last of the ice shelves, which otherwise floats on the sea but is
connected to a glacier in Canada, collapsed. Further to the east, it was much warmer, and the
Svalbard island group saw record high temperatures. Furthermore, high temperatures in Sibe-
ria predominated throughout almost the entire year, which led to numerous forest fires. The
extent of the Arctic sea ice was very low again in 2020. And although no overall record was set,
new monthly records for low coverage of sea ice were set in both July and October.
In spite of notable temperature extremes in
large parts of the Arctic, the season in Green-
land in 2019/2020 was relatively normal in
terms of the surface mass balance of the Ice
Sheet. However, calving of icebergs from
outlet glaciers, was large in comparison with
the satellite observations that are available
since 1979.
During the first 11 months of 2020, the east-
ern Arctic stood out as a region with extreme
and sustained temperature anomalies com-
pared to the long-term average. This applies
to both the state of sea ice and permafrost as
well as temperatures and wildfires. As an
example, Figure 1 shows the temperature
anomalies from the 1981-2010 mean in the
ERA5 reanalysis for November 2020.
During the winter of 2019/2020, the state of
the weather was defined by a powerful posi-
tive phase of the so-called Arctic Oscillation,
which is an expression of the variation in the
air pressure north of the 20°N.
This means that large parts of Europe, most
of northern Asia and north-eastern Siberia
had temperatures well above average. In
Alaska, on the other hand, temperatures
were somewhat below average. These pat-
terns dominated the majority of the season.
During the course of 2020, there have been
many forest fires in the Arctic – however,
with major regional differences. The area
north of the Arctic Circle saw the highest
number of forest fires in 18 years, measured
in terms of thermal radiation and CO2 emis-
sion.
Most forest fires were concentrated in the
eastern part of Arctic Siberia, which was also
drier than normal.
Regional reports from eastern Siberia indi-
cate that the season for forest fires began
earlier than normal and that the season also
came to a close later in some regions, leading
to long-term damage to ecosystems. In con-
trast, significantly fewer forest fires than
normal were reported in Alaska, Yukon and
northwest Siberia.

2
Figure 1: Temperature anomalies in the ERA5 reanalysis for parts of the northern hemisphere. Colours:
Anomalies expressed as standard deviations from the 1981-2010 mean. Hatched: temperature anomalies
from this mean value greater than 5°C. Double hatched: anomalies greater than 10°C.
From January onwards, a large part of Arctic
Siberia exhibited temperature anomalies of
at least 3°C compared to the average 1981-
2010. Central coastal areas had temperature
anomalies of more than 5°C in relation to
average values. North of the Arctic Circle, a
new temperature record was set in
Verkhoyansk, where the temperature peaked
at 38°C on 20 June 2020 during a prolonged
heatwave. Elsewhere in the Arctic, very high
temperatures were also measured. The
warm conditions culminated in November,
when temperature anomalies of more than
10°C were observed in the section of the
Laptev Sea off the coast of the area of land
which had the greatest temperature anoma-
lies. The extent of the sea ice was especially
low along the Siberian coastline, and the
Northeast Passage was ice-free from July
through to October. The high temperatures
were not limited to dry land, however. A
“marine heatwave” affected large areas of
the Arctic Ocean north of Europe and Asia
(see Figure 1). In Greenland, the Ice Sheet
lost around 152 gigatonnes (Gt) of ice, when
both melting from the surface and calving of
icebergs from glaciers (the total mass bal-
ance) are taken into account. This means that
the Ice Sheet is continuing to lose ice – alt-
hough at a slower rate than was the case in
2019. One gigatonne is one billion tonnes,
which corresponds to one cubic kilometre of
ice.
In the following, we will look at the most important results monitored in the Arctic in 2020:
2020 – a year with an average degree of
melting of the Ice Sheet.
Limited mass loss from calving of icebergs.
Mass loss in the west; limited growth on
the eastern part of the Ice Sheet.
Ice Sheet whiter than in previous years.
Second-lowest sea ice minimum in 40
years; records set in July and October.
3
2020 – a year with an average degree of melting of the Ice Sheet
Changes to the mass of Greenland’s Ice Sheet
reflect the combined effects of the surface
mass balance (SMB), which is defined as the
difference between snowfall and run-off
from the Ice Sheet, and which is always posi-
tive over the course of a year, and the loss of
mass at the coast as a result of calving of
icebergs and melting of glacier tongues that
meet the sea.
The surface mass balance, which is an ex-
pression of the isolated growth and melting
of the surface of the Ice Sheet, is monitored
via actual measurements (PROMICE stations
from GEUS) and computer simulations. The
Danish Meteorological Institute (DMI) per-
forms daily simulations of how much ice or
water the Ice Sheet accumulates (through
snowfall) or loses (through run-off). Based on
these simulations, an overall measurement
of how the surface mass balance develops
across the entire Ice Sheet is obtained (Fig.
2). At the end of the season (31 August
2020), the surface mass balance’s net result
was 349 Gt. This is very close to the 1981-
2020 average, which is 341 Gt. As a point of
reference, the lowest calculated SMB was
just 38 Gt in 2012.
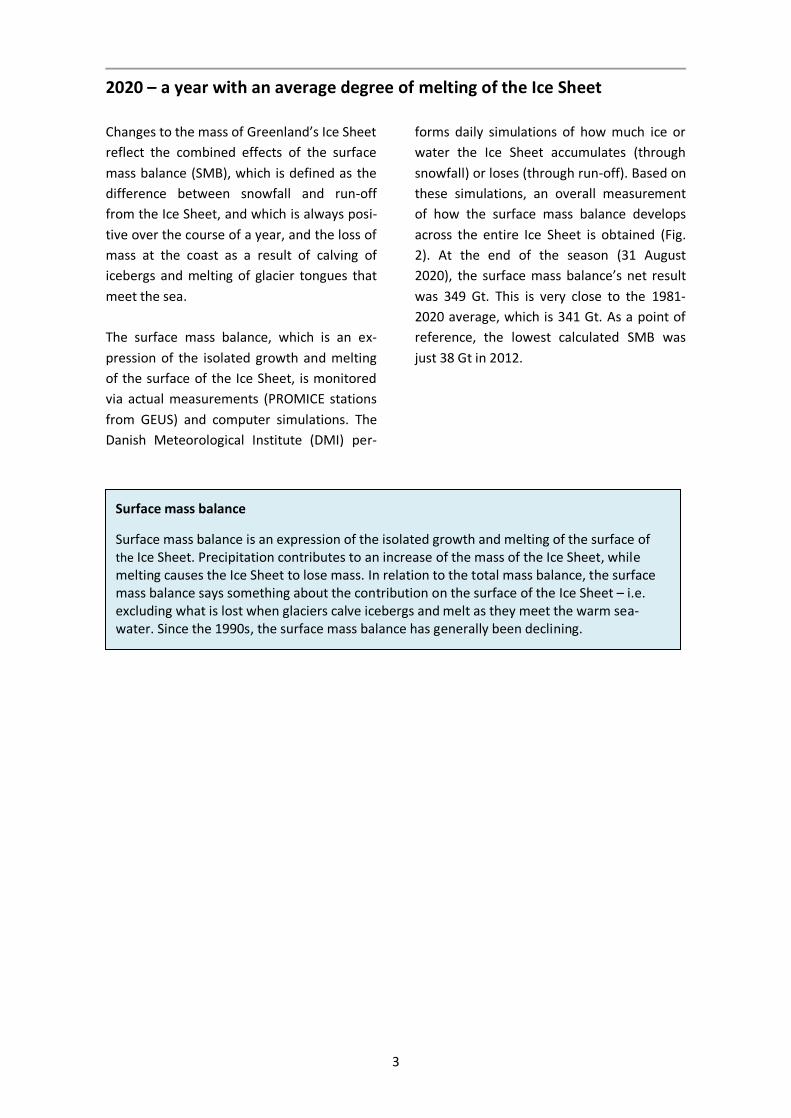
Surface mass balance
Surface mass balance is an expression of the isolated growth and melting of the surface of the Ice Sheet. Precipitation contributes to an increase of the mass of the Ice Sheet, while melting causes the Ice Sheet to lose mass. In relation to the total mass balance, the surface mass balance says something about the contribution on the surface of the Ice Sheet – i.e. excluding what is lost when glaciers calve icebergs and melt as they meet the warm sea-water. Since the 1990s, the surface mass balance has generally been declining.
4
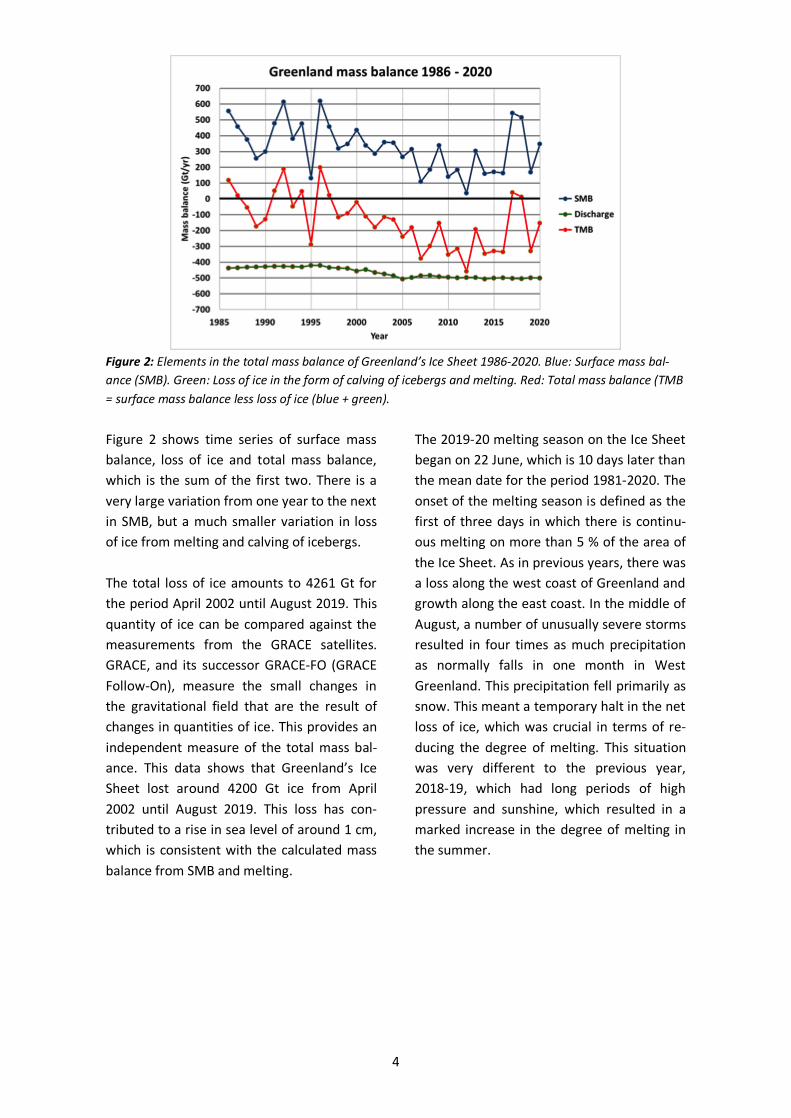
Figure 2: Elements in the total mass balance of Greenland’s Ice Sheet 1986-2020. Blue: Surface mass bal-
ance (SMB). Green: Loss of ice in the form of calving of icebergs and melting. Red: Total mass balance (TMB
= surface mass balance less loss of ice (blue + green).
Figure 2 shows time series of surface mass
balance, loss of ice and total mass balance,
which is the sum of the first two. There is a
very large variation from one year to the next
in SMB, but a much smaller variation in loss
of ice from melting and calving of icebergs.
The total loss of ice amounts to 4261 Gt for
the period April 2002 until August 2019. This
quantity of ice can be compared against the
measurements from the GRACE satellites.
GRACE, and its successor GRACE-FO (GRACE
Follow-On), measure the small changes in
the gravitational field that are the result of
changes in quantities of ice. This provides an
independent measure of the total mass bal-
ance. This data shows that Greenland’s Ice
Sheet lost around 4200 Gt ice from April
2002 until August 2019. This loss has con-
tributed to a rise in sea level of around 1 cm,
which is consistent with the calculated mass
balance from SMB and melting.
The 2019-20 melting season on the Ice Sheet
began on 22 June, which is 10 days later than
the mean date for the period 1981-2020. The
onset of the melting season is defined as the
first of three days in which there is continu-
ous melting on more than 5 % of the area of
the Ice Sheet. As in previous years, there was
a loss along the west coast of Greenland and
growth along the east coast. In the middle of
August, a number of unusually severe storms
resulted in four times as much precipitation
as normally falls in one month in West
Greenland. This precipitation fell primarily as
snow. This meant a temporary halt in the net
loss of ice, which was crucial in terms of re-
ducing the degree of melting. This situation
was very different to the previous year,
2018-19, which had long periods of high
pressure and sunshine, which resulted in a
marked increase in the degree of melting in
the summer.
5
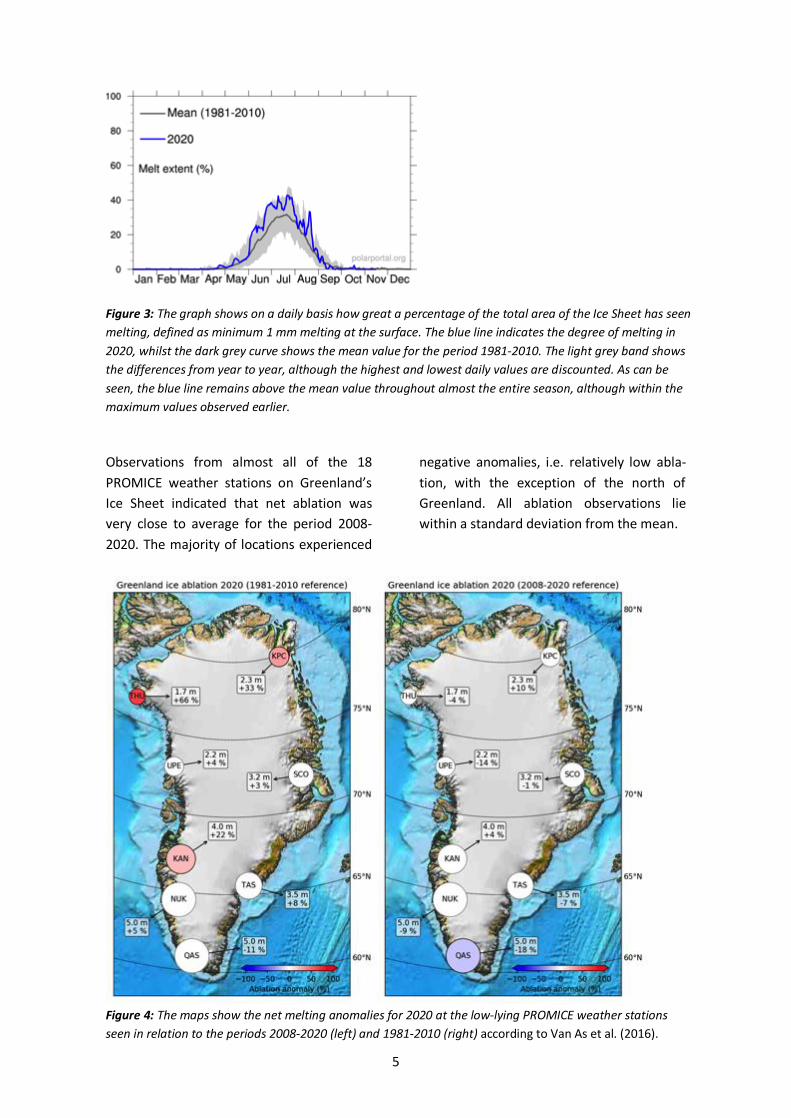
Figure 3: The graph shows on a daily basis how great a percentage of the total area of the Ice Sheet has seen
melting, defined as minimum 1 mm melting at the surface. The blue line indicates the degree of melting in
2020, whilst the dark grey curve shows the mean value for the period 1981-2010. The light grey band shows
the differences from year to year, although the highest and lowest daily values are discounted. As can be
seen, the blue line remains above the mean value throughout almost the entire season, although within the
maximum values observed earlier.
Observations from almost all of the 18
PROMICE weather stations on Greenland’s
Ice Sheet indicated that net ablation was
very close to average for the period 2008-
2020. The majority of locations experienced
negative anomalies, i.e. relatively low abla-
tion, with the exception of the north of
Greenland. All ablation observations lie
within a standard deviation from the mean.
Figure 4: The maps show the net melting anomalies for 2020 at the low-lying PROMICE weather stations
seen in relation to the periods 2008-2020 (left) and 1981-2010 (right) according to Van As et al. (2016).
6
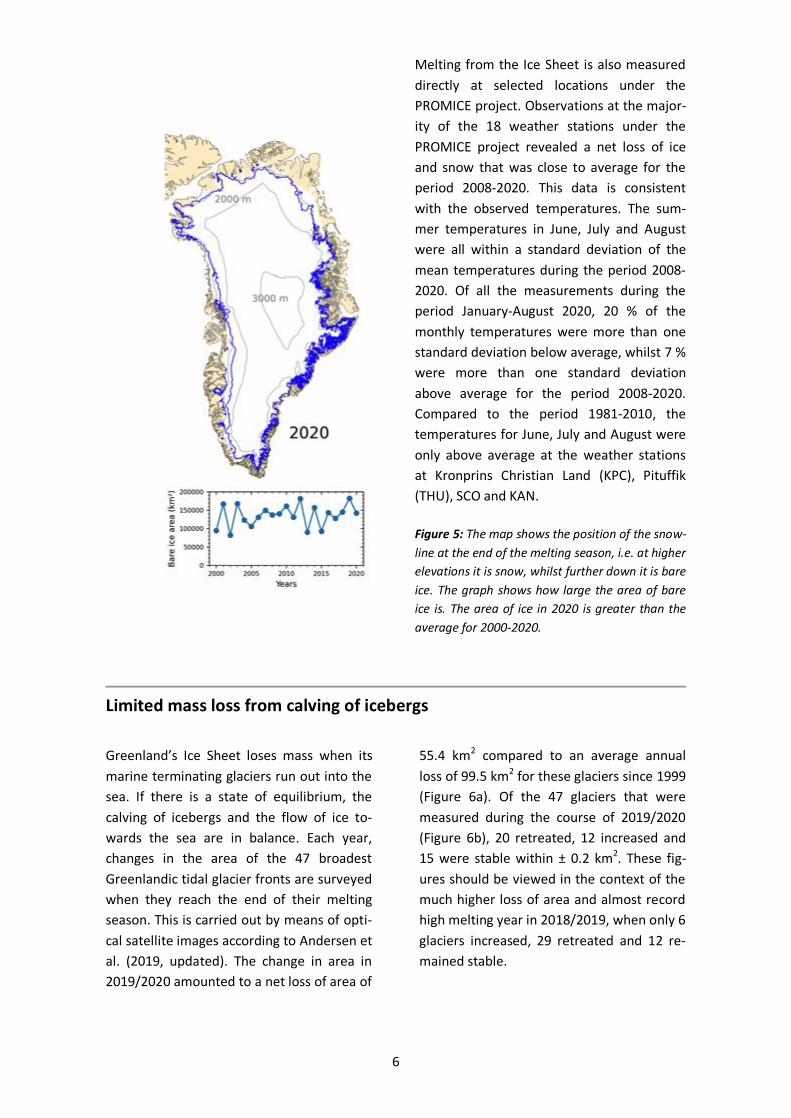
Melting from the Ice Sheet is also measured
directly at selected locations under the
PROMICE project. Observations at the major-
ity of the 18 weather stations under the
PROMICE project revealed a net loss of ice
and snow that was close to average for the
period 2008-2020. This data is consistent
with the observed temperatures. The sum-
mer temperatures in June, July and August
were all within a standard deviation of the
mean temperatures during the period 2008-
2020. Of all the measurements during the
period January-August 2020, 20 % of the
monthly temperatures were more than one
standard deviation below average, whilst 7 %
were more than one standard deviation
above average for the period 2008-2020.
Compared to the period 1981-2010, the
temperatures for June, July and August were
only above average at the weather stations
at Kronprins Christian Land (KPC), Pituffik
(THU), SCO and KAN.
Figure 5: The map shows the position of the snow-
line at the end of the melting season, i.e. at higher
elevations it is snow, whilst further down it is bare
ice. The graph shows how large the area of bare
ice is. The area of ice in 2020 is greater than the
average for 2000-2020.
Limited mass loss from calving of icebergs
Greenland’s Ice Sheet loses mass when its
marine terminating glaciers run out into the
sea. If there is a state of equilibrium, the
calving of icebergs and the flow of ice to-
wards the sea are in balance. Each year,
changes in the area of the 47 broadest
Greenlandic tidal glacier fronts are surveyed
when they reach the end of their melting
season. This is carried out by means of opti-
cal satellite images according to Andersen et
al. (2019, updated). The change in area in
2019/2020 amounted to a net loss of area of
55.4 km2 compared to an average annual
loss of 99.5 km2 for these glaciers since 1999
(Figure 6a). Of the 47 glaciers that were
measured during the course of 2019/2020
(Figure 6b), 20 retreated, 12 increased and
15 were stable within ± 0.2 km2. These fig-
ures should be viewed in the context of the
much higher loss of area and almost record
high melting year in 2018/2019, when only 6
glaciers increased, 29 retreated and 12 re-
mained stable.
7
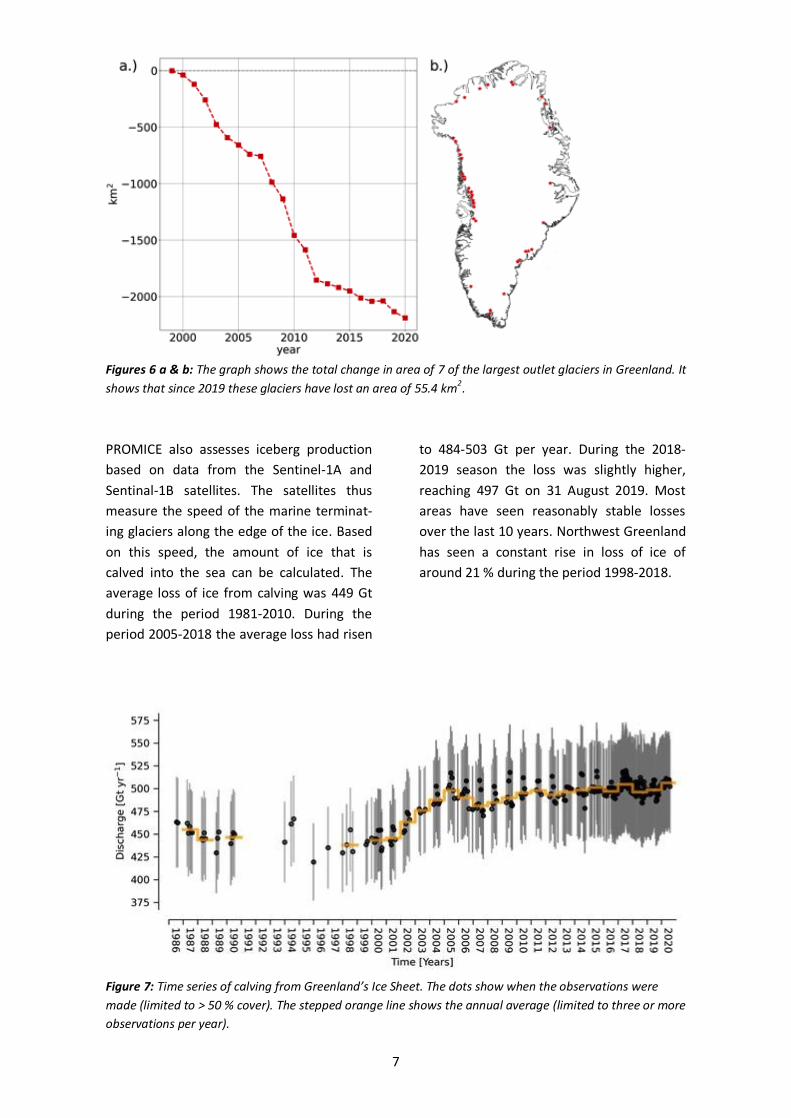
Figures 6 a & b: The graph shows the total change in area of 7 of the largest outlet glaciers in Greenland. It
shows that since 2019 these glaciers have lost an area of 55.4 km2.
PROMICE also assesses iceberg production
based on data from the Sentinel-1A and
Sentinal-1B satellites. The satellites thus
measure the speed of the marine terminat-
ing glaciers along the edge of the ice. Based
on this speed, the amount of ice that is
calved into the sea can be calculated. The
average loss of ice from calving was 449 Gt
during the period 1981-2010. During the
period 2005-2018 the average loss had risen
to 484-503 Gt per year. During the 2018-
2019 season the loss was slightly higher,
reaching 497 Gt on 31 August 2019. Most
areas have seen reasonably stable losses
over the last 10 years. Northwest Greenland
has seen a constant rise in loss of ice of
around 21 % during the period 1998-2018.
Figure 7: Time series of calving from Greenland’s Ice Sheet. The dots show when the observations were
made (limited to > 50 % cover). The stepped orange line shows the annual average (limited to three or more
observations per year).

8
Mass loss in the west; limited growth on the eastern part of the Ice Sheet
The GRACE satellites and their successors,
GRACE-FO, measure small changes in the
Earth’s gravitational field, such that changes
in the mass of the Ice Sheet can be deter-
mined. Following exhaustive scrutiny and
quality control, it has been determined that
GRACE and GRACE-FO are consistent during
the period in which there was no data (end-
2017 until mid-2018). The time series is now
available until the end of August 2019, whilst
the latest measurements are being pro-
cessed and are not yet available.
The map in Figure 8 illustrates the changes in
the thickness of the Ice Sheet as an average
value per year during the period January
2017 until December 2019 based on data
from the Sentinel-3A satellite. Sentinel and
its predecessor, Cryosat-2, are so-called ra-
dar altimeter missions. The satellite emits a
radar signal which is reflected from the sur-
face of the Earth back up to the satellite. It
can be clearly seen that close to many of the
large glaciers the Ice Sheet has become con-
siderably thinner, but large areas are also
observed in which the ice has become thicker
due to snowfall.
Figure 8: The map shows elevation
changes per year based on Senti-
nel-3A data from January 2017
until December 2019.
9
Ice Sheet whiter than in previous years
The winter at the beginning of the Green-
landic annual cycle in 2019-20 (1 September
– 31 August) was slightly drier than normal,
although not characterised by almost no
precipitation, as was the case in 2018-19.
The Ice Sheet began its melting season on 22
June, which is around 10 days later than
average. Fresh snow at the end of May and
beginning of June delayed the onset of the
melting season, in contrast to the high de-
gree of melting at the same time last year.
July was a relatively warm and sunny month
in Greenland, and the areas that experi-
enced melting had high – though not record
high – melting figures.
As mentioned earlier, several unusually se-
vere storms in the middle of August resulted
in four times as much precipitation than
normally falls in a month in West Greenland.
This precipitation fell primarily as snow,
which temporarily halted the net loss of ice.
These storms probably played a crucial role
in reducing melting. Fresh new-fallen snow
is light and white and reflects more energy-
rich sunlight than old and darker snow and
bare glacier ice that has undergone a sum-
mer with a high degree of melting.
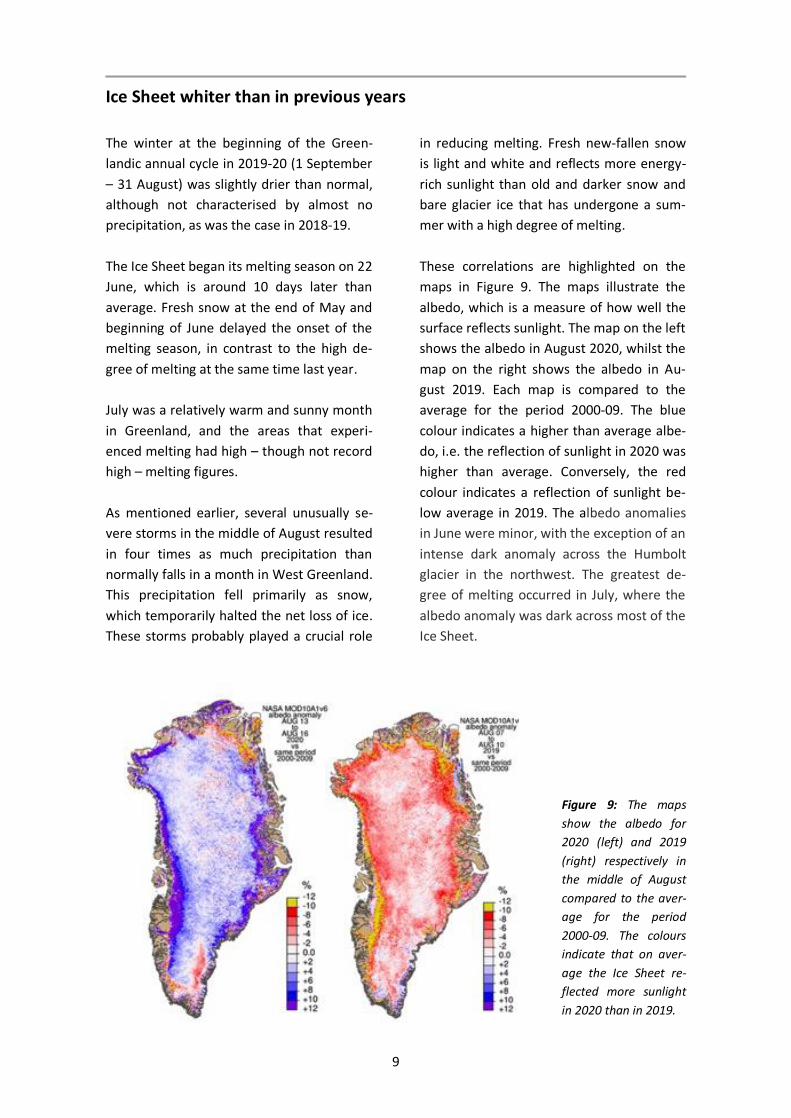
These correlations are highlighted on the
maps in Figure 9. The maps illustrate the
albedo, which is a measure of how well the
surface reflects sunlight. The map on the left
shows the albedo in August 2020, whilst the
map on the right shows the albedo in Au-
gust 2019. Each map is compared to the
average for the period 2000-09. The blue
colour indicates a higher than average albe-
do, i.e. the reflection of sunlight in 2020 was
higher than average. Conversely, the red
colour indicates a reflection of sunlight be-
low average in 2019. The albedo anomalies
in June were minor, with the exception of an
intense dark anomaly across the Humbolt
glacier in the northwest. The greatest de-
gree of melting occurred in July, where the
albedo anomaly was dark across most of the
Ice Sheet.
Figure 9: The maps
show the albedo for
2020 (left) and 2019
(right) respectively in
the middle of August
compared to the aver-
age for the period
2000-09. The colours
indicate that on aver-
age the Ice Sheet re-
flected more sunlight
in 2020 than in 2019.

10
Permafrost
Due to COVID-19 related restrictions, it was
not possible to conduct the planned visits to
the permafrost monitoring stations in 2020.
Soil temperature data for the 2019/2020
season will be made available in the Polar
Portal’s 2021 Season Report.
Second lowest sea ice minimum in 40 years – records set in July and October
When the temperature in the Central Arctic
rises above freezing point, the sea ice begins
its melting season. This occurred on 11 June
2020, which is just around the point in time
that is now referred to as “the new normal”.
This is an expression of the average onset of
the sea ice’s melting season compared to an
average for the last 13-15 years.
During the course of the year there were
large variations in the extent of sea ice. This
was due in particular to unusually early melt-
ing and late freezing at the far end of the
Arctic. The extent of the sea ice was thus
smaller than ever before in April, July and
October in relation to these months in previ-
ous years.
As outlined above, it was warm in large parts
of the Arctic in 2020. The Arctic sea ice
reached its annual minimum extent on 15
September, which is five days later than the
average date for 1981-2010 (10 September).
The sea ice thus also began to refreeze a
little later than normal, and was further hin-
dered by the fact that the water temperature
around the ice was still 2-4 degrees warmer
than normal, just like in 2019.
The ice mass fell to just below 4.3 million
km2. This is the second lowest value since
observations began in 1979. In July and Oc-
tober new record minimums were observed
for these months. The extent of the ice in
2020 is thus definitively lower than in 2007,
2016 and 2019, which to date have shared
the position for the second lowest level since
observations began at the end of the 1970s.
The low minimum extent of the sea ice in
2020 has only been exceeded in 2012, which
still has the record of the smallest extent of
sea ice measured so far. When the melting of
sea ice near the North Pole began in the
middle of July, there were no signs that rec-
ords would be set during the course of the
summer. However, the heatwave in Siberia
melted so much ice that the Northeast Pas-
sage remained open.
Normally, ice melts at the North Pole at a
rate corresponding to twice the land area of
Denmark per day in the middle of July. How-
ever, the daily melting rate in July this year
was almost three times the area of Denmark.
The sea areas north of Siberia experienced
the greatest loss of ice.
Spring 2020 saw a significantly lower extent
of ice than normal, with extremely large
quantities of ice melting during the summer.
As a result, July hit a historic minimum for
the season. Furthermore, at the beginning of
September the melting rate for the season
was also historically high. Sea ice is important
in terms of the climate because it is light and
thus has a high albedo. The smaller the ex-
tent of sea ice, the larger the dark water sur-
faces in the Arctic will be that absorb solar
energy and thereby contribute to further
melting of the ice. The late shift from thaw to
frost, combined with the smaller extent, has

11
meant once again in 2020 that the Sun has
been able to heat up the water surrounding
the ice, with the temperature of the surface
water at many places in the Arctic up to 4°C
warmer than normal for the time of year.
This has the effect of driving a vicious circle.
When the coverage of ice is lower, the sea-
water is heated up to a greater extent.
Warmer surface water leads to greater melt-
ing of the ice and delays the onset of refreez-
ing in the autumn because the warm water
has to be cooled down before it can freeze.
When the ice freezes later, it cannot acquire
the same thickness as it would have done if it
had had more time. This makes the ice less
robust.
The combination of a smaller extent and
thinner ice has also led to more than 50 % of
the volume of the Arctic sea ice disappearing
during the last 40-50 years. The trend to-
wards less and less sea ice can be seen in
tangible terms by the fact that certain re-
gions of the Barents Sea and the Davis Strait
now have open water seasons that are four
months longer than at the beginning of the
1980s.
Figure 10: DMI's graph of the extent of the sea ice from 15 September 2020, which was the date of the
season’s lowest extent of coverage. The map and graphical representation are based on EUMETSAT's OSI
SAF ice concentration calculations and illustrate the extent of sea areas that have more than 15 % ice cover.
Graphics from Polar Portal.
12
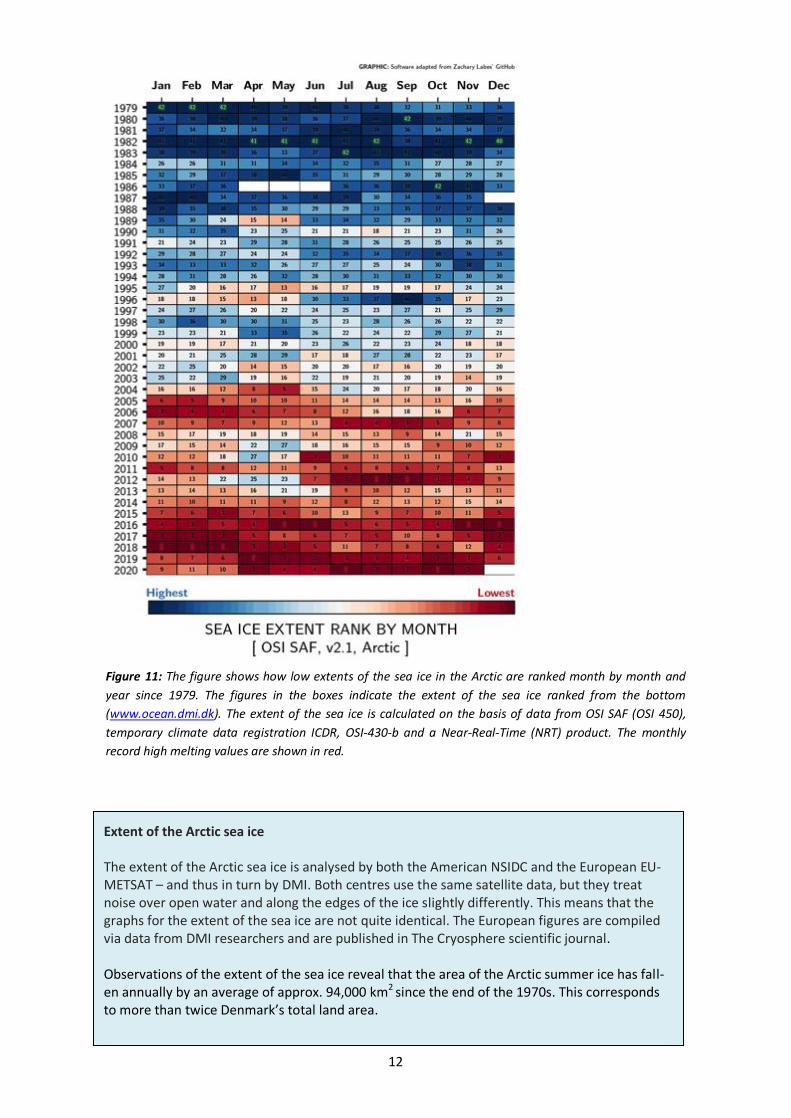
Figure 11: The figure shows how low extents of the sea ice in the Arctic are ranked month by month and
year since 1979. The figures in the boxes indicate the extent of the sea ice ranked from the bottom
(www.ocean.dmi.dk). The extent of the sea ice is calculated on the basis of data from OSI SAF (OSI 450),
temporary climate data registration ICDR, OSI-430-b and a Near-Real-Time (NRT) product. The monthly
record high melting values are shown in red.
Extent of the Arctic sea ice The extent of the Arctic sea ice is analysed by both the American NSIDC and the European EU-METSAT – and thus in turn by DMI. Both centres use the same satellite data, but they treat noise over open water and along the edges of the ice slightly differently. This means that the graphs for the extent of the sea ice are not quite identical. The European figures are compiled via data from DMI researchers and are published in The Cryosphere scientific journal. Observations of the extent of the sea ice reveal that the area of the Arctic summer ice has fall-en annually by an average of approx. 94,000 km2 since the end of the 1970s. This corresponds to more than twice Denmark’s total land area.