poker flat mst radar observations of high latitude neutral winds at the mesopause during and after...
TRANSCRIPT

Journul of Atmospheric and Terrus~iul Physics, Vol. 55, No. 9. pp. 1203-1218, 1993. 0021-9169193 $6.00+ .oO Printed in Great Britain. 6: 1993 Pergamon Press Lid
Poker Flat MST radar observations of high latitude neutral winds at the mesopause during and after solar proton events
R. M. JOHNSON* and J. G. LUHMANN~
*Space Physics Research Laboratory, University of Michigan, Ann Arbor, MI 48109, U.S.A. ; t Institute of Geophysics and Planetary Physics, UCLA Los Angeles, CA 90024, U.S.A.
(Received injnalfarm 4 September 1992 ; accepted I October 1992)
A~~act~b~~atio~s with the Poker Flat, Alaska, MST radar during and after solar proton events in 1982 and 1984 suggest that winds in the altitude range of -S&90 km were altered as a consequence of the influx of energetic charged particles and large electric fields at high latitudes. The atmospheric changes accompanying these events appear to result in a reduction of the semidiurnal tide and an enhancement in the diurnal tide. It is suggested that these changes could result from the alteration of the local tidal heating distribution produced by the particle precipitation. either through changes in the local ozone distribution or as a result of mesospheric Joule heating.
lNTHODUCTlON
The response of the high-latitude upper atmosphere to short-term changes in magnetospheric forcing is strongest at heights above about 100 km, in or above the lower thermosphere (JOHNSON and LUHMANN, 1988). Below this altitude, neutral dynamics in the aurora1 zone upper mesosphere are dominated by the influences of lower-atmospheric processes, such as the generation and upward propagation of atmospheric tides due to ozone and water vapor absorption at UV and infra-red wavelengths, the deposition of gravity- wave momentum at critical levels, and turbulent dis- sipation (HOLTON, 1975). However, several studies have indicated weak statistical relationships below 100 km between tidal amplitudes and/or gravity-wave intensities and magnetosphe~c forcing (MANSON and MEEK, 1986; PRICE and JACKA, 1991; PRICE et al., 1991). In the high-latitude lower thermosphere, diur- nal and semidiurnal tides are also produced in situ
through absorption of solar radiation at UV and EUV wavelengths. The much enhanced E-region ionization density relative to the D-region, in combination with the magnetospheric convection electric field (which maps down geomagnetic field lines to the high-latitude regions) allows ion-neutral coupling to have a much greater influence on aurora1 zone neutral dynamics in the lower thermosphere than below. Several studies have shown that accelerated zonal and meridional flows as well as reductions in semidiurnal tidal ampli- tude are observed during intervals of enhanced mag- netospheric input (WAND, 1983 ; JOHNSON, 1987 ; C~CCER et ai., 1985; JOHNSON and VIRDI, 1991; KIL-
LEEN el a/., 1992). Nevertheless, on occasion, sufficiently energetic particle precipitation can affect
even the mesosphere, although the mechanisms and nature of the effects may differ from those observed in the lower thermosphere. Solar Proton Events (SPEs) which are characterized by extremely intense particle precipitation over large spatial regions and intense magnetospheric convection, are particularly likely to generate mesospheric effects.
During these events, the ionization at upper-meso- spheric heights may reach sufficiently high levels that Joule heating competes with the contribution due to normal neutral heating from absorption of solar radi- ation (BANKS, 1979; ROBLE ez al., 1987). Additionally, another possible mechanism for altering the dynamics of the neutral gas may become effective as a result of the energy deposited in the stratosphere and meso- sphere by unusually intense precipitation of energetic .particles, including solar protons. The ionization pro- duced by these particles and their secondaries gives rise to local ionization and chemical reactions (THORNE, 1980), as well as changes in the densities of photochemically active atmospheric constituents (MAE~A and AKIN, 1968 ; CRUTZEN and SOLOMON, 1980 ; SOLOMON et al., 1981) which are important in the production of tides in the middle atmosphere (PARK and LONDON, 1974).
In this paper, observations of high-latitude upper- mesospheric neutral winds obtained by the Poker Flat MST radar during two SPEs, on 13 July 1982 and 26 April 1984, are presented and examined for evidence of a response to high-latitude forcing. The obser- vations are then discussed in relation to the possible mechanisms by which such extreme events can influ- ence neutral gas dynamics, including upper-meso- spheric Joule heating and precipitation-related photo- chemistry changes.
I203

1204 R. M. JOHNKIN and J. G. LUHMANN
Observations of ozone depletions and Joule heating
During the 13 July 1982 SPE, several instruments
were in operation which could observe not only the
ozone depletion, but also thE: precipitating particle flux and polar cap electric fields during the event. The NOAA-6 satellite measured incoming energetic proton fluxes, while Dynamics Explorer-2 measured
precipitating electron spectra, ion drift velocities and
electron, ion, and neutral temperatures along the sat- ellite track (ROBLE et al., 1987). The DE measurements showed that the energetic particle flux during the event
abruptly decreased equatorward of 56”N latitude. Observations of mesospheric ozone were made con-
tinuously during this event with both Solar Meso-
sphere Explorer (SME) and the Nimbus 7 satellites (THOMAS et al., 1983 ; MCPETERS and JACKMAN, 1985).
Both SME and Nimbus 7 detected large ozone
depletions in the mesosphere with a duration that is
consistent with the dominance of the odd-hydrogen
removal process during events characterized by soft
precipitating particle spectra (FREDEFICK, 197k). On
the descending phase of its orbit, SME detected a
maximum ozone depletion of 70% at 65” and 78 km
near 3 LT, while during the ascending phase near
15 LT, a depletion of 30% was found at 85 km and
65. (THOMAS et al., 1983). Nimbus 7, traveling in a local noon, midnight orbit, observed a 28% depletion
at 55 km and high solar zenith angle, corresponding
to a latitude of 72”N, while at local noon observations
at the same latitude showed only a 5% reduction in
ozone normal concentrations at 55 km (MCPETERS
and JACKMAN, 1985).
In Fig. 1, the observations of ozone depletion made with these two instruments at = 70”N and at high and
low solar zenith angle are shown together. The solid
curves give the average mixing ratio of ozone per unit
volume measured in July 1982 with SME. The dashed
curve indicates observations by SME during the SPE
on 13 July (THOMAS et al., 1983). The thin curve shows the Nimbus 7 measurements during the maximum
interval of proton precipitation (MCPETERS and JACK-
MAN, 1985), to be compared with the normal ozone
mixing ratios observed by Nimbus 7 (dashdotted
curves). The disagreement in the ozone depletions
obtained by the two instruments at 55 km has been
attributed to a local time effect. ROBLE et al. (1987) have calculated the spatial dis-
tributions of Joule heating for the 13 July 1982 SPE in the mesosphere and the thermosphere from obser- vations made with the DE-2 satellite on one orbit over the polar cap and coincident NOAA-6 satellite
observations. They found that Joule heating rates exceeded solar heating rates, above 73 km in the eve-
July 13, 1982 Ozone Depletion
100 70” N
1 I , , I I I ,
Low Zenith Angle _
4o0 I 1 1 I 8 2 I I 3 1 I 4 I
Ozone Mixing Ratio Cppmv3
loo! High Zenith Angle _
4o0 1 I 1 I 1 2 1 I 3 , I 4 I
Ozone Mixing Ratio (ppmvl
-SME Normal ---SME SPE
-------Nimbus 7 Normal -Nimbus 7 SPE
Fig. 1. Ozone mixing ratios in ppmv observed by SME and Nimbus 7 during the 13 July 1982 SPE at (a) low and (b) high solar zenith angles. These observations correspond to a latitude of = 70”N. The solid curves show the average mixing ratio of ozone measured by SME during July of 1982, while dashed curves are the SME observations made during the SPE. Normal ozone mixing ratios measured by Nimbus 7 are shown with a dashdotted curve, while those obtained during the SPE are indicated by the thin solid curve
with dots.
ning aurora1 oval and above 85 km in the polar cap, for this orbit during the peak of the geomagnetic storm while solar protons were still providing intense
D-region ionization. Figure 2 compares the calculated Joule heating rates in the region of most intense elec- tric fields with normal ozone heating rates in the meso-
sphere (after ROBLE et al., 1987). The most intense particle bombardment, producing greater than 3000 ion pairs cm113 s-l, lasted about 8 h, from 16 to
24 UT, although less energetic proton precipitation produced ionization enhancements from about 4 UT on the 13th through 6 UT on the 14th at 80 km (MCPETERS and JACKMAN, 1985). The perpendicular (to B) electric fields measured by DE-2 on this orbit

Solar proton events and neutral winds 1205
Heating Rate Comparison
Heating Rate (deglday)
Fig. 2. Joule heating rates calculated by ROBLE et al. (1985) for a DE-2 orbit during the most intense period of particle precipitation of the 13 July 1982 SPE. For comparison, nor- mal mesospheric ozone and molecular oxygen heating rates calculated for the summer hemisphere using the model of GARCIA and SOLOMON (1983) are also shown (after ROBLE
et al., 1985).
maximized at about 190 mV/m in the evening sector at about 65”N, but were generally elevated across the polar cap to ~50 mV/m. Time dependent Joule heating rates were not calculated for the event. How- ever, since K, equalled or exceeded 8 + for 12 h, coinci- dent with the most intense interval of particle pre- cipitation, it is reasonable to assume that the Joule heating rate during this interval significantly exceeded normal levels at mesospheric heights for an extended period of time during the SPE.
In Fig. 3, the ozone mixing ratio observed by SME
April 1984 Solar Proton Event 08 I I I I I I I I I
66 km
22 24 26 28 30
Day of Month CUTI
Fig. 3. Ozone mixing ratio in ppmv observed by SME during the interval of the April 1984 SPE at high solar zenith angle on the dayside. Time is shown in UT days. Data provided
by R. J. Thomas.
(provided by R. Thomas) during the 26 April 1984 SPE at 0.1 mb (Z 66 km) and high solar zenith angle on the dayside of the satellite’s orbit is shown. An ozone depletion of about 30% was observed at 80”N. This depletion is significantly larger than that observed at this latitude and height on the dayside during the 13 July 1982 SPE. In Fig. 4, contours of constant ozone depletion level measured by SME are indicated for both the April 1984 (provided by R. Thomas) and the July 1982 SPEs (after THOMAS et al., 1983). The ozone depletion produced by the April event was more widespread in the polar regions, and reached larger values at lower altitudes than during the July event, although the July event had the largest ozone depletions in the upper mesosphere at high solar zenith angle. This difference in the distribution of ozone depletion is due to the dependence of the ozone removal process on both the solar zenith angle and the precipitating particle energy spectrum. During
Percent Ozone Depletion
100, July 13. 1962
I I I 1
0 30 60 90 60
Latitude
April 26, 1964
Latitude
Fig. 4. Contour levels of constant ozone depletion level in percent vs altitude and latitude observed by SME during the April 1984 SPE (bottom) (provided by R. J. Thomas) and during the 13 July 1982 SPE (top) (after THOMAS ef al.,
1983).

1206 R. M. JOHNSON and J. G. LUHMANN
April, the solar zenith angle is higher at the same geographic latitude on the dayside than it is during summer months. As a result, the ozone depletion pro- duced by the particle precipitation will have a pro- portionally larger effect to lower latitudes on the day- side since odd-hydrogen production through water vapor photolysis is reduced. Additionally, ozone depletion to lower altitudes during this event indicates a harder energy spectrum, allowing particle pen- etration to lower altitudes, than during the July 1982 event. Measurements of the Joule heating rate are not available for the April 1984 SPE.
The atmospheric effects of SPEs are therefore two- fold in nature. Energetic proton precipitation pro- duces enhanced ionization in the mesosphere and the stratosphere. This enhanced ionization, in the pres- ence of large electric fields, allows Joule heating to provide an important source of neutral heating at upper-mesospheric heights and high latitudes. Fric- tion between the ions, which are driven by the electric fields, and the neutrals also provides a source of momentum for the neutrals. Additionally, through a series of chemical reactions, the ionization causes a depletion of ozone in the middle atmosphere. This depletion reduces the neutral heating rate due to UV absorption by ozone in the upper stratosphere and mesosphere, dependent on the energy spectrum of the precipitating particles. Since absorption of UV by ozone in the middle atmosphere is the dominant source of mesospheric tides, and since the thermal response time of the atmosphere is slow, ozone depletions produced during SPEs have the potential for disrupting the normal dynamical behavior of the neutral gas for several days after the event (REAGAN et al., 1981).
POKER FLAT MST RADAR OBSERVATIONS OF
NEUTRAL WINDS
The extreme variability of semidiurnal and diurnal tidal amplitudes and phases at upper-mesospheric and lower thermosphere heights has been pointed out numerous times in the literature (FELLOUS et al., 1975 ; BERNARD, 1981 ; MANSON et al., 1982). This variability has also been observed by CARTER and BALSLEY (1982), using the Poker Flat MST radar. A detailed analysis of data from this radar, showing that diurnal and semidiurnal tidal fluctuations in 3-yr of con- tinuous summertime observations were strong, but highly variable in amplitude and phase was described by JOHNSON and LUHMANN (1985). In the course of analyzing the tidal amplitudes in the data set as a whole, one 3-day interval stood out because of its
unusually consistent tidal behavior. This interval was characterized by large amplitude diurnal waves which showed little phase variation with altitude or time, and by significant semidiurnal amplitudes. The 13 July SPE and the ensuing geomagnetic storm, which continued through the UT day on the 14th, immedi- ately preceded this 3-day interval. Because the oper- ating mode of the radar was changed during the event, the time-series analyses of upper-mesospheric neutral winds presented by JOHNSON and LUHMANN (1985) did not include the observations made during the 1982 SPE. These special observations are analyzed here, in conjunction with other observations made during the first three weeks of July 1982.
Observations made during a second intense SPE, which occurred in April, 1984, are also presented and discussed, although in less detail than the 13 July 1982 event. This event has been less thoroughly investigated for several reasons. Seasonal dependence is important because the altitude from which Poker Flat MST radar echoes are obtained depends sensitively on the time of year (BALSLEY et al., 1984). Thus data obtained during a different time of year will not typically be available at the same altitudes. Additionally, less observational data are available for this event. Even so, observations are presented in order to ascertain if the unusual behaviors exhibited following the 13 July 1982 event were coincidental, or related to a preceding interval of extreme magnetospheric forcing.
13 July 1982 solar proton event
Figure 5 shows the time histories of the obser- vations made during the summer months of 1982 on one of the oblique receivers of the Poker Flat MST radar, in the 80-90 km altitude range. The receiver monitored the return signal from an azimuth of 64”E of geographic north, and so the radial velocities shown in this plot are positive in a roughly west-southwest direction. The main point this figure makes is the extreme variability of the neutral wind observations. On close inspection, one can find occasions when fluc- tuations of certain periods are apparently enhanced. This is particularly true of the semidiurnal com- ponent ; of all the wave motions seen in these curves, the semidiurnal oscillation is the most consistently intense. For example, semidiurnal fluctuations are strong during the interval of the 6-l 1 June, but are particularly so on the 8th and the 10th. Again on the 25th and 26th, semidiurnal oscillations are apparent, as they are during the interval from the 4th to the 7th of July. There are also several intervals when the higher frequency oscillations are particularly coher- ent, for example, 13-14 June, and on 3 July. There

was only one interval, however, when a strong diurnal oscillation was present, essentially to the exclusion of other low-frequency components. This interval, which lasted for several consecutive days, occurred from about 21 LT on 1417 July. It was followed by a roughly 24 h interval, mainly on the 18th, when no low-frequency motions were apparent over the 80- 90 km range at either the diurnal or the semidiurnal frequencies. No similar interval, devoid of all but high-frequency oscillations, was observed in the 1982 summer data shown in Fig. 7 ; indeed, this behavior is unique to the entire 3-yr data set. Following this 24 h interval, the radial velocities on the 19th and 20th showed the presence of a semidiurnal oscillation again.
In Fig. 6, the observations during the 12-18 July
interval are shown in greater detail. Radar obser- vations began again on the 12th after a period of roughly 48 h when the facility was not in operation. (In fact, except for an approximately 24 h interval from 9 to 10 July, the radar did not obtain measure- ments for 4 days prior to 12 July.) The most intense energetic proton precipitation occurred during the interval indicated by the dotted lines on this plot. The accompanying magnetic storm, which began also at z 1600 UT on the 13th, continued through 1800 UT on the 14th. A, values are shown at the top of the plot. The interval of the large amplitude, coherent diurnal oscillations, starting at EZ 2100 LT on the 14th, is clearly seen. From z 1200 LT on the 17th, when these diurnal fluctuations ended, essentially no low- frequency motions were evident. It is also apparent

1208 R. M. JOHNSON and J. G. LUHMANN
RADIAL VELOClTY RCVR f
Ap 48 144 153 36 50 24 24
0
30
Cn
i O
30
87.2 km
85.1 km
0 82.9 km
1 I ,,,j ;,(t ,,,,,,,,,,,,,,,,,1 ]
12 13 14 15 16 17 18
DAY OF JULY (LT) Fig. 6. Radial velocities in the 80-90 km range on the same oblique receiver for the 12-18 July 1982 interval. Dotted lines indicated the interval when the most intense energetic proton precipitation occurred. The magnetic storm continued through 1800 UT on the 14th. Local time in days is indicated along the abscissa,
and A,, is shown at the top.
that the interval of the strong diurnal oscillations was characterized by a shift in the mean wind toward the southwest. Observations on the 12th showed the presence of a semidiurnal motion prior to the onset of the solar proton influx and magnetic storm. During the interval of the event, neither diurnal nor semi- diurnal oscillations were particularly apparent; in- deed, the neutral motions seemed to be dominated by higher frequency fluctuations at this time. When the radar entered the morning sector towards the end of the magnetic storm, relatively large amplitude oscil- lations with a frequency of z 1 h were seen over the 8&90 km range. The figures that follow focus on the details of the observations described above.
In order to study the differences in the dynamical behavior of the neutrals during this interval from the ‘norm’, a 3 week period from 1 to 21 July was analyzed. The original data were averaged over 10 min intervals and then rotated into horizontal geographic coordinates, Of the original 21 days of data, 15 remained after this manipulation which were
sufficiently free of gaps to allow further analysis. Any gaps present, of a duration less than 4 h, were inter- polated over. On certain days, such as the Sth, some data from the prior day were included in the fit in order to obtain a full 24 h interval of data. These results were summarized by grouping the data into three sets. Data obtained on the 13th to the 14th, including the interval of the SPE and magnetic storm, were grouped together. The following 3 day interval of the lSth-17th, which showed the unusual diurnal period behavior discussed above, was also considered as a subset. The remaining 10 days were grouped together, and taken to characterize ‘normal’ wind behavior, without influence from the geomagnetically active interval.
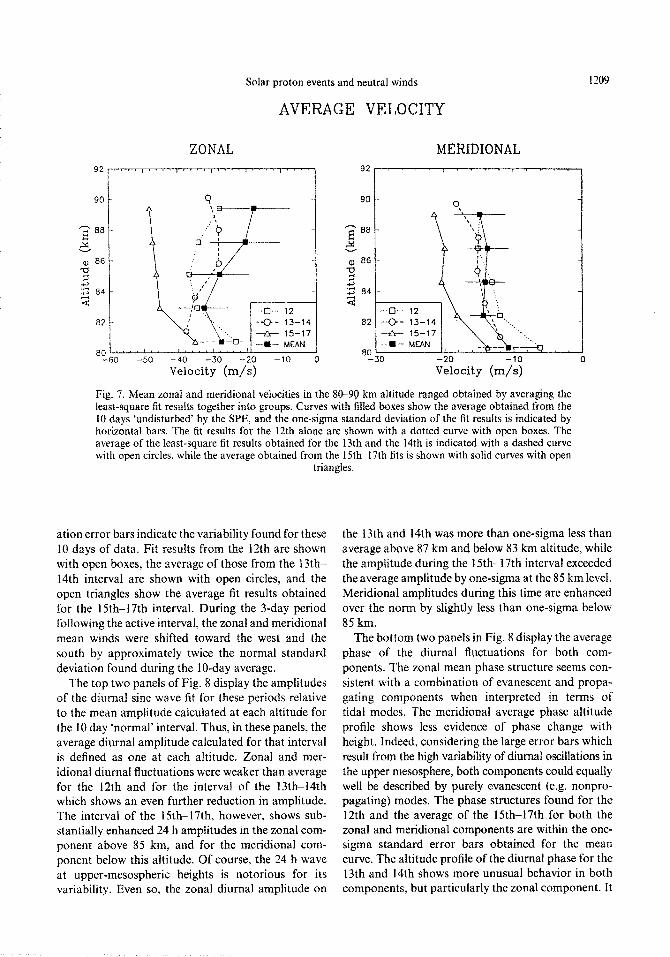
Figure 7 shows the altitude profile of the mean zonal and meridional velocities obtained by averaging the data in these various groups. The curves with filled boxes show the average obtained from the results of the least-squares fit to the 10 days of data taken to represent normal behavior. One-sigma standard devi-
Solar proton events and neutral winds 1209
AVERAGE VELOCITY
MERIDIONAL
-Q- 13-14
--a- 15-17
-i- MEAN
-60 -50 -40 -30 -20 -10 0
Velocity (m/s)
* 15-17
-30 -20 -10 0
Velocity (m/s)
Fig. 7. Mean zonal and meridional velocities in the SO-9Q km altitude ranged obtained by averaging the least-square fit results together into groups. Curves with filled boxes show the average obtained from the f 0 days ‘undisturbed’ by the SPE, and the one-sigma standard deviation of the fit results is indicated by horizontal bars. The fit results for the 12th alone are shown with a dotted curve with open boxes. The average of the least-square fit results obtained for the 13th and the 14th is indicated with a dashed curve with open circles, while the average obtained from the 15th-17th fits is shown with solid curves with open
triangles.
ation error bars indicate the variability found for these
10 days of data. Fit results from the 12th are shown with open boxes, the average of those from the 13th- 14th interval are shown with open circles, and the open triangles show the average fit results obtained for the 15th-17th interval. During the 3-day period following the active interval, the zonal and meridional mean winds were shifted toward the west and the south by approximately twice the normal standard deviation found during the IO-day average.
The top two panels of Fig. 8 display the amplitudes of the diurnal sine wave fit for these periods relative to the mean amplitude calculated at each altitude for the 10 day ‘normal’ interval. Thus, in these panels, the average diurnal amplitude calculated for that interval is defined as one at each altitude. Zonal and mer- idional diurnal ~uctuations were weaker than average for the 12th and for the intervai of the 13th-14th which shows an even further reduction in amplitude. The interval of the 15th-17th, however, shows sub- stantially enhanced 24 h ampiitudes in the zonal com- ponent above 85 km, and for the me~~onal com- ponent below this altitude. Of course, the 24 h wave at upper-mesospheric heights is notorious for its variability. Even so, the zonal diurnal amplitude on
the 13th and 14th was more than one-sigma less than average above 87 km and below 83 km altitude, while the amplitude during the 15th-17th interval exceeded the average amplitude by one-sigma at the 85 km level. Meridional amplitudes during this time are enhanced over the norm by slightly less than one-sigma below 85 km.
The bottom two paneIs in Fig. 8 display the average phase of the diurnal fluctuations for both com- ponents. The zonal mean phase structure seems con- sistent with a combination of evanescent and propa- gating components when interpreted in terms of tidal modes. The meridional average phase altitude profile shows less evidence of phase change with height. Indeed, considering the large error bars which result from the high variability of diurnal oscillations in the upper mesosphere, both components could equally well be described by purely evanescent (e.g. nonpro- pagating) modes. The phase structures found for the 12th and the average of the 15th-17th for both the zonal and meridional components are within the one- sigma standard error bars obtained for the mean curve. The altitude profile of the diurnal phase for the 13th and 14th shows more unusual behavior in both components, but particularly the zonal component. It

1210 R. M. JOHNSON and J. G. LUHMANN
92
90
- 66 E Y
aI 86
4 2 84
a 82
80
92
90
- 88 E
3.
aI 86
4
2 84
a
82
80
RELATIVE AMPLITUDE OF DIURNAL WAVE
ZONAL MERIDIONAL
, I
2 Relative Amplitude Relative Amplitude
PHASE OF DIURNAL WAVE
ZONAL
0 12 0- 13-14 +r- 15-17 -8- MEAN
6 12 18 Local time of maximum (hrs)
MERIDIONAL
g21 'I""" """"'
Local time of maximum (hrs)
Fig. 8. Top two panels : the relative amplitude of diurnal lit results obtained by averaging the results of the least-square fits together into the same groups used in Fig. 7. The average diurnal amplitude of the IO ‘undisturbed’ days is defined to equal 1 at each altitude. Bottom two panels: the average phase of the diurnal fit results for the same groups. Local time of maximum eastward or northward winds is indicated
along the abscissa in hours.
was during this interval, while the SPE and magnetic
storm were in progress, that diurnal tidal amplitudes
were the most reduced. The diurnal phase structure for the 3-day interval
was highly consistent from day-to-day. Figure 9 com- pares the standard deviation of the diurnal phase calculated for this 3-day interval with the mean varia- bility in other consecutive 3-day periods of the data set. It is apparent that the diurnal phase on the 15th- 17th was roughly a factor of four less variable than is normally observed in consecutive 3-day intervals.
The relative amplitudes and phases of the semi- diurnal wave fits are shown in Fig. 10, which has the
same format as Fig. 8. On the 12th, the semidiurnal
wave was larger than average for both components, but particularly for the meridional component. That component was nearly two-sigma greater than the
average semidiurnal amplitude between 82 and 88 km. On the 13th and 14th, the semidiurnal amplitude is reduced, particularly at the highest altitudes, by more than one-sigma from the average. For the interval of
the 15th-17th, the semidiurnal amplitude was below average for both components, with the largest reduction near 86 km, where the reduction exceeded the one-sigma level for the zonal component.
The semidiurnal phase results are displayed in the

Solar proton events and neutral winds
STANDARD DEVIATION OF DIURNAL PHASE 3-DAY INTERVALS
ZONAL
92t
a2
MERIDIONAL
1211
Standard deviation ( hrs) Standard deviation ( hrs )
Fig. 9. comparison of the standard deviation of the zonal and meridional diurnal phase during the 15-I 7 July 1982 interval with the average standard deviation calculated for other 3 day consecutive intervals of
the data set.
bottom two panels of Fig. 10 in the same format as the diurnal phase results given in Fig. 8. The altitude phase structure on the 12th is similar to the mean of the ‘undisturbed’ days, particularly for the zonal component. Some phase variation with height is indi- cated for the mean, particularly in the zonal compon- ent. However, vertical lines could still be drawn with- out exceeding the one-sigma error bars. During the 13th and 14th, a substantial change in the phase struc- ture occurs for the zonal component, while the mer- idional component shows almost no phase variation with height during this interval. From the 15th to the 17th, the phase seems to be consistently earlier by approximately 2 h than the mean for the zonal com- ponent. The meridional component also appears shifted to earlier times of local maximum, but some- what less uniformly. When these phase profiles are interpreted in terms of tidal structure, the zonal pro- files are all in general consistent with the superposition of a long wavelength mode and some higher order mode or modes. The me~d~onal component, on the other hand, shows very little phase variation with height, except on the 12th.
In the next two figures, the presence of variable amplitude higher-frequency oscillations during the SPE and magnetic storm is indicated. Figure 11 shows the result of band-pass filtering the zonal 10 min aver- aged data from the 12th to the 18th in the 83-87 km altitude range. This filter allowed waves with periods
between 3 and 8 h to pass, but suppressed other fre- quencies. Compared to the intervai from the 15th to the 18th, the preceding interval has intermediate frequency waves of larger amplitude which are seen at several different altitudes. These oscillations seem to reach their greatest amplitudes on the 13th, during the SPE. In Fig. 12. similar results are shown, but this time for a band-pass filter operating between 3 h and 50 min on the data from 85 to 89 km. Here, the coherent high-frequency fluctuations seen on the orig- inal data plot (Fig. 6) on the 14th in the local morning sector are more apparent, and a period of about 1 h can be identified. Although high-frequency oscil- lations are certainly present during normal conditions at upper-mesospheric heights (see Fig. 5), such coher- ence in altitude and time is unusual. These o~illations may correspond to gravity waves produced through Joule heating and/or Lorentz forcing (LUHMANN,
1980 ; WALTERSCHEID and BOUCHER, 1984).
In summary, observations of upper-mesospheric zonal and meridional neutral winds made during and after the 13 July 1982 SPE at Poker Flat show unusual behavior over a wide range of frequencies. The normal behavior of the winds in the 80-90 km altitude range shows a predominant semidiurnal tidal oscillation. However, higher frequency oscillations seem to be enhanced during the SPE and magnetic storm, par- ticularly when the observing site is in the morning sector on the second day of the active interval. Diurnal

1212 R. M. JOHNSON and J
RESTIVE AMPLITUDE
ZONAL
Relative Amplitude
G. LUHMANN
OF S~MID~URNAL WAVE
MERIDIONAL
927
/’ D . .
I’ 0
,’ .(’
+ 2 .plitude
PHASE OF SEMIDIURNAL WAVE
ZONAL MERIDIONAL
-A-- 15-17 -S MEAN
0 12
Local lime. of k&mu: (hrs)
-A- 1%$7 t MEAN
Local &me of kaximu: (hrs) 12
Fig. 10. Same as Fig. 8, except for the semidiumai relative amplitude (top panels) and phase (bottom panels).
oscillations, on the other hand, are particularly out- standing after the most intense magnetospheri~ input has ceased. The phase of the diurnal oscillations dur- ing this 3-day interval of almost monochromatic wave activity was extremely consistent.
26 April 1984 solar proton event
The 13 July 1982 SPE was particularly well docu- mented and well sampled. SPEs of comparable inten- sity occurred roughly once every 2 yr between 1980 and 1984. Another intense SPE occurred during April 1984, while the Poker Flat MST radar was still in operation and while the upper-mesospheric echoing structure characteristic of the summer season had already started to be re-established. SME obser-
vations during this event were discussed above. Ener- getic proton precipitation began at 1330 UT (or 0330 LT) on the 25 April and continued for seyeral days, with maximum flux on the 26th at 1430 UT. A mag- netic storm began at the same time and continued through the UT day of the 26th. The 3-h K,, values
between 2300 LT on 24 April and 2300 LT on the 26thwere2,5+,5+,4+,6,6’,7-,6,6-,6,7,8-,6,5+, 5-, 4+, showing that highest K,, values were reached between 0500 and 1100 LT on the 26th, when the precipitating energetic proton flux was most intense; however, the K, = 9 level reached during the 13 July 1982 SPE and sustained for 9 h was not attained.
Thus, although the magnetic storm which ac- companied the April SPE was apparently not quite

T,= 8 hrs T,, = 3 hrs
Solar proton events and neutral winds 1213
ZONAL VELOCITY Ap
20
0
-20
40 144 153 36 50 24 24
87.2 km
85.1 km
0 82.9 km
-20 : : I I I. I a I * I I I I I * I I
12 13 II:;
OF tT5ULY [ET) 17 18
Fig. 11. Fluctuations of the zonal velocity in the 3-8 h range, obtained by bandpass filtering the data, during the 12-18 July 1982 interval from 83 to 87 km. Local time in hours is indicated along the abscissa.
T,= 3 hrs Th =58 min
ZONAL VELOCITY Kp 4+ 4+ 8+ 9- 9 9 8- 7- 7 8 7 7- 8 5 5- 4
20
0
-20
20
? O
x -20
20
0
-20
89.4 km
87.2 km
85.1 km
13 14
DAY OF JULY (LT) Fig. 12. Fluctuations of the zonal velocity in the 50 min-3 h range, obtained by bandpass filtering the data, on the 13 and 14 July 1982. Three-hourly values of K, are indicated at the top of the plot. Local time in
hours is indicated along the abscissa.
1214 R. M. JOHNSON and J. G. LUHMANN
as intense as that of the July 1982 event, the ozone
depletion was more widespread in the polar regions
and in particular reached larger values at lower
heights. This in turn implies that the spectrum of the precipitating energetic protons was somewhat harder for this event. Measurements of the ionospheric elec- tric fields are not available for the April event. However, since the K,, values were smaller than those for the July 1982 event, the convection electric field was probably also smaller. These considerations sug- gest that the Joule heating which occurred during the April 1984 SPE took place at lower altitudes, and was
probably somewhat less intense than during the July 1982 event. In any case, it is of interest to compare the dynamical response seen by the MST radar with
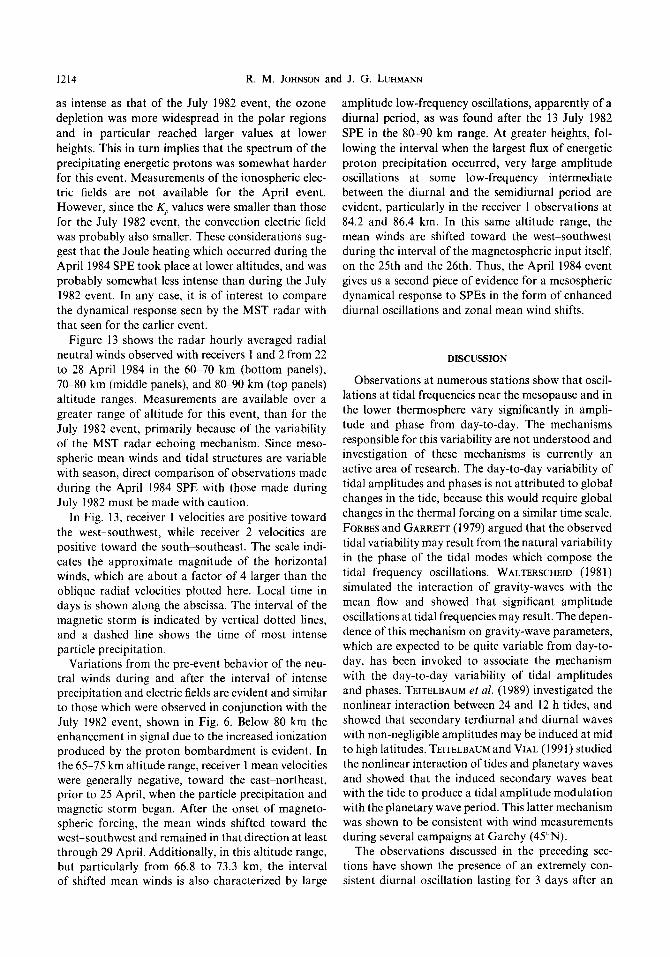
that seen for the earlier event. Figure 13 shows the radar hourly averaged radial
neutral winds observed with receivers 1 and 2 from 22
to 28 April 1984 in the 6&70 km (bottom panels), 7C80 km (middle panels), and 8@90 km (top panels)
altitude ranges. Measurements are available over a greater range of altitude for this event, than for the July 1982 event, primarily because of the variability of the MST radar echoing mechanism. Since meso- spheric mean winds and tidal structures are variable
with season, direct comparison of observations made during the April 1984 SPE with those made during July 1982 must be made with caution.
In Fig. 13, receiver 1 velocities are positive toward the west-southwest, while receiver 2 velocities are positive toward the south-southeast. The scale indi- cates the approximate magnitude of the horizontal winds, which are about a factor of 4 larger than the oblique radial velocities plotted here. Local time in days is shown along the abscissa. The interval of the magnetic storm is indicated by vertical dotted lines, and a dashed line shows the time of most intense particle precipitation.
Variations from the pre-event behavior of the neu- tral winds during and after the interval of intense precipitation and electric fields are evident and similar to those which were observed in conjunction with the July 1982 event, shown in Fig. 6. Below 80 km the enhancement in signal due to the increased ionization produced by the proton bombardment is evident. In the 65-75 km altitude range, receiver 1 mean velocities were generally negative, toward the east-northeast, prior to 25 April, when the particle precipitation and magnetic storm began. After the onset of magneto- spheric forcing, the mean winds shifted toward the west-southwest and remained in that direction at least through 29 April. Additionally, in this altitude range, but particularly from 66.8 to 73.3 km, the interval of shifted mean winds is also characterized by large
amplitude low-frequency oscillations, apparently of a
diurnal period, as was found after the 13 July 1982
SPE in the 80-90 km range. At greater heights, fol-
lowing the interval when the largest flux of energetic proton precipitation occurred, very large amplitude oscillations at some low-frequency intermediate between the diurnal and the semidiurnal period are evident, particularly in the receiver 1 observations at
84.2 and 86.4 km. In this same altitude range, the mean winds are shifted toward the west-southwest during the interval of the magnetospheric input itself,
on the 25th and the 26th. Thus, the April 1984 event gives us a second piece of evidence for a mesospheric dynamical response to SPEs in the form of enhanced
diurnal oscillations and zonal mean wind shifts.
DISCUSSION
Observations at numerous stations show that oscil- lations at tidal frequencies near the mesopause and in
the lower thermosphere vary significantly in ampli- tude and phase from day-to-day. The mechanisms responsible for this variability are not understood and investigation of these mechanisms is currently an active area of research. The day-to-day variability of tidal amplitudes and phases is not attributed to global
changes in the tide, because this would require global changes in the thermal forcing on a similar time scale.
FORBES and GARRETT (1979) argued that the observed tidal variability may result from the natural variability in the phase of the tidal modes which compose the
tidal frequency oscillations. WALTERSCHEID (198 1) simulated the interaction of gravity-waves with the mean flow and showed that significant amplitude oscillations at tidal frequencies may result. The depen-
dence of this mechanism on gravity-wave parameters, which are expected to be quite variable from day-to- day, has been invoked to associate the mechanism with the day-to-day variability of tidal amplitudes and phases. TEITELBAUM et (11. (1989) investigated the nonlinear interaction between 24 and 12 h tides, and showed that secondary terdiurnal and diurnal waves with non-negligible amplitudes may be induced at mid to high latitudes. TEITELBAUM and VIAL (1991) studied
the nonlinear interaction of tides and planetary waves and showed that the induced secondary waves beat with the tide to produce a tidal amplitude modulation with the planetary wave period. This latter mechanism was shown to be consistent with wind measurements during several campaigns at Garchy (45”N).
The observations discussed in the preceding sec- tions have shown the presence of an extremely con- sistent diurnal oscillation lasting for 3 days after an

Solar proton events and neutral winds 1215
April. 1984 SPE Neutral Winds
Aecewer 2 He:aht :km)
l”‘l”‘1”““““’ “““‘I : I:/
646
7i7
Fig, 13. Poker Flat, MST hourly averaged oblique radial velocities on receiver I (left) and 2 fright) from SO to 90 km for the interva1 of 22-28 April 1934. Intervals ofmaximum magnetospheric input are indicated. Receiver 1 velocities are positive toward the west-southwest, while receiver 2 velocities are positive toward the south-southeast. Note the progressively large vertical scales used in the three panels as altitude increases.

1216 R. M. JOHNSON and J. G. LUHMANN
interval of intense magnetospheric forcing of the lower thermosphere and the upper mesosphere on 13 July 1982. A similar oscillation was observed following the April 1984 event. The fact that this unusual behavior lasted for a period as long as 3 days suggests that it resulted not from the mechanisms which produce the normal day-to-day variability indicated in Fig. 5, but instead from some mechanism capable of generating a quasi-steady ‘tidal’ field. This mechanism must account for rapid and long lasting reductions in 12 h amplitudes and quasi-steady large amplitude diurnal oscillations, as well as for intervals when neither of these low frequency waves are apparent. These requirements seem to rule out the possibility of a gravity-wave-mean flow interaction mechanism be- cause of the expected variability of this source.
The observed mesospheric ozone depletion and Joule heating described above certainly produced sud- den changes in the neutral heating rate during the 13 July 1982 SPE. The results of REAGAN et al. (1981) suggest that even though the mesospheric ozone depletion lasts only a relatively short period of time, it produces a longer-term decrease in the neutral heating rate. This in turn causes a reduction of mesospheric temperatures that lasts for several days after the fairly short-lived event. The Joule heating, on the other hand, produces a sudden increase in the neutral heat- ing rate in the upper-mesosphere.
Calculations using a steady-state classical tidal model and rough approximations to the heating rates consistent with the observed maximum Joule heating and ozone depletion show that significant differences in tidal amplitudes may result (JOHNSON, 1987). Model results indicate enhanced diurnal tidal ampli- tudes when a heat source is added in the 8c-120 km altitude range. This agrees with the observations, where large amplitude evanescent diurnal oscillations were observed following the SPEs considered here. However, these calculations did not address the tem- poral development of the forcing and winds during and following the event and can therefore only be used as a rough indication that some upper mesospheric dynamical response may be expected.
The time required to set up an evanescent diurnal tidal oscillation corresponds approximately to the time required for the initial transient motions to propagate through the latitudinal extent of the forcing region, of the order of several hours to a day (Walterscheid, pers. commun.). The results of REAGAN et al. (198 1) have shown that a sudden change in the ozone distribution at high latitudes during an SPE can produce a relatively long-lasting change in the heating rate profile, of the order of a week. Fol- lowing a sudden reduction in the mesospheric heating
rate at high latitude due to ozone depletion and a sudden increase in the heating rate in the upper meso- sphere and lower mesosphere due to Joule dissipation, a striking change in the tidal behavior of the neutral winds was observed approximately a day later, which lasted for approximately 3 days thereafter. In particu- lar, an increase of the diurnal zonal and meridional amplitudes was observed, along with a decrease in the semidiurnal tidal fluctuations. These observations are consistent with the model predictions (JOHNSON, 1987), based on assuming a steady-state heating rate profile which approximates the maximum effects of the ozone depletion and Joule heating observed dur- ing the peak of the SPE. Alternatively, the addition of a Joule heat source alone would produce enhanced diurnal amplitudes, regardless of the ozone depletion effects.
Finally, the interaction of a planetary wave with the tidal field may be related to the observed wind variations. TEITELBAUM and VIAL (1991) showed that this mechanism could produce modulations of diurnal or semidiurnal amplitudes with the period of the plan- etary wave oscillation, resulting in intervals of slowly changing tidal amplitude and periods of very small tidal amplitudes. Such a mechanism may be involved here, but in this case modulations in both diurnal and semidiurnal amplitudes are seen. Indeed, investigation of Fig. 5 shows that following the 13 July 1982 SPE there is some regularity in the low frequency wave form through the rest of July : large amplitude, near- diurnal oscillations are observed on 15-17 July and there is considerable power near the diurnal frequency on 21-23 July, on the 18th and on the latter half of 2425 July little power is apparent at low frequency, and on 19 and 20 July, the semidiurnal dominates again. On 26-28 July, power seems to be significant in both the 12 and 24 h components. Overall, there is some indication of a 6-day periodicity in the wind variations following the SPE. This periodicity is not apparent prior to the SPE, although this statement must be qualified because of the multi-day data gap just prior to the event.
The shift in the mean wind direction following the SPEs to the southwest is consistent with some obser- vations of changes in the mean winds at greater heights during intervals of geomagnetic activity. The Coriolis acceleration acting on a net equatorward flow from the northern polar regions, produced by high- latitude heating (ROBLE et al., 1977; RICHMOND, 1979), would produce a westward component in the mean zonal wind. WAND (1983) has postulated that the enhanced south-westward winds observed with the Millstone Hill incoherent scatter radar (42”N) in the 115-135 km altitude range during intervals of

Solar proton events and neutral winds 1217
geomagnetic activity are part of this activity-produced
thermospheric meridional circulation cell. The obser-
vations presented here, at mesospheric heights, may
reflect the extension of this circulation cell to much lower altitudes than normal due to the extreme level
of magnetospheric forcing which characterizes these SPEs.
CONCLUSIONS
During and following the 13 July 1982 SPE, unusual
neutral wind oscillations occurred over a wide range of frequencies at upper-mesospheric heights in obser-
vations obtained by Poker Flat, MST radar. This
event, which was particularly well documented, was accompanied by a significant ozone depletion in the
high-latitude upper mesosphere, as well as by intense Joule heating at these heights. Analysis of the tidal oscillations during and following the event showed
particularly enhanced and long-lasting evanescent
diurnal tidal oscillations to the virtual exclusion of other low-frequency motions. During this period,
the mean wind shifted to the west-southwest by 5- 30 m/s over the 81-90 km altitude range, or by
approximately twice the normal standard deviation. In addition, high-frequency fluctuations were appar-
ently enhanced during the most intense interval of magnetospheric forcing.
A second SPE, on 26 April 1984, was also analyzed.
Mean flows were observed to increase towards the west-southwest following the SPE, and to remain
enhanced for several days afterwards. Additionally, an increase in the amplitude of apparently diurnal
oscillations was noted although the altitude at which this was most apparent differed from the case of the
13 July 1982 event. Direct comparison of the obser- vations made during the two SPEs is difficult because
the observations were made during different seasons
of the year. As a result, measurements were obtained
from a different altitude range, such that the normal mean wind and tidal behavior could be expected to
differ. In addition, the altitude of maximum ionization
also differed in the two SPEs, as was discussed above,
and therefore the altitude difference in its related
effects is not unreasonable.
Potential mechanisms responsible for the changes in
the amplitudes and phases of diurnal and semidiurnal wind oscillations following the two SPEs studied here have been discussed. Changes in the contributions of
tidal modes due to variations in the tidal heating rates arising from altered Joule heating and/or ozone de-
pletion may be involved (JOHNSON, 1987). However, it then becomes difficult to explain the temporal devel- opment of the winds relative to the variations in
thermal forcing expected to be produced by the
SPEs. Alternatively, simulations of the interaction of planetary waves with diurnal or semidiurnal waves (TEITELBAUM and VIAL, 1989) have had some success
at reproducing observations of slowly varying tidal amplitudes and periods of very low amplitude oscil- lations. These observations are somewhat similar to those analyzed in this study, although unusual behavior is noted here at both the diurnal and semi- diurnal frequencies.
Resolution of which mechanisms are responsible
for the unusual wave and mean flow variations fol- lowing the 13 July 1982 and 26 April 1984 SPEs will require further efforts at simulations of these events.
These studies should include the effects of time-vary- ing ozone depletion and enhanced mesospheric and lower thermospheric Joule heating. In addition, the effects of planetary waves on both diurnal and semi- diurnal tides should be further investigated to deter- mine if the variations in tidal amplitudes observed following these SPEs can be explained on the basis of this mechanism.
Acknowledgemenrs-This study was funded through NSF grant ATM U-15627. while the first author was a student at the University of California at Los Angeles, and was completed with funding from NSF grant ATM 90-96134. The authors thank Dr B. Balsley, who provided the radar data analyzed in this study, Dr R. Walterscheid, who provided his classical tidal model for this effort, and Dr R. Thomas, who provided unpublished SME data.
REFERENCES
BALSLEY B. B., ECKLUND W. L. and FRITTS D. C.
BANKS P. M. BERNARD R.
1984 In Dynamics of the Middle Atmosphere, J. J. HOLTON and T. MATSUNO (eds), p. 77. Terra Scientific Pub- lishing Co.
1979 J. geophys. Res. 84,6709. 1981 J. atmos. terr. Phys. 43,663.
CARTER D. A. and BALSLEY B. B. CRUTZEN P. J. and SOLOMON S.
1982 J. atmos. Sci. 39,.2905. 1980 Planet. Soace Sci. 28. 1147
FELLOUS J. L., BERNARD R., GLASS M., MASSEBEUF M. and SPIZZICHINO A.
FORBES J. M. and GARRETT H. B. FORBES J. M. and GARRETT H. B.
1975 J. atmos.*terr. Phys. j7, 151 I.
1978 Geophys. Res. Lett. 5, 1013. 1979 Rev. Geophys. Space Phys. 17, 1951.

1218 R. M. JOHNSON and J. G. LUHMANN
FREDERICK J. E 1976 HOLTON J. R. 1975
JOHNSON R. M. 1987
JOHNSON R. M. and LUHMANN J. G. JOHNSON R. M. and LUHMANN J. G. JOHNSON R. M. and VIRDI T. S. KILLEEN T. L., NARDI B., PURCELL P. N.,
ROBLE R. G., FULLER-R• WELL T. J. and REES D. LUHMANN J. G. MAEDA K. and AIKIN A. C. MANSON A. H. and MEEK C. E. MANSON A. H., MEEK C. E., GREGORY J. B.
and CHAKRABARTY D. K. MCPETERS R. D. and JACKMAN C. H. PARK J. G. and LONDON J. PRICE G. D. and JACKA F. PRICE G. D., JACKA F., VINCENT R. A.
and BURNS G. B. REAGAN J. B., MEYEROTT R. E., NIGHTINGALE R. W.
GUNTON R. C., JOHNSON R. G., EVANS J. E., IMHOF W. L., HEATH D. F. and KRUEGER A. J.
RICHMONV A. D. ROBLE R. G., DICKINSON R. E. and RIDLEY E. C. ROBLE R. G., EMERY B. A., KILLEEN T. L.,
REID G. C., SOLOMON S., GARCIA R. R., EVANS D. S., HAYS P. B., CARIGNAN G. R., HEELIS R. A., HAN%IN W. B., WINNINGHAM D. J., SPENCER N. W. and BRACE L. H.
SOLOMON S., RUSCH D. W., GERARD J.-C., REID G. C. and CRUTZEN P. J.
TEITELBAUM H. and VIAL F. TEITELBAUM H., VIAL F., MANSON A. H.,
GIRALDEZ R. and MASSEBEUF M. THOMAS R. J., BARTH C. A., ROTTMAN G. J.,
RUSCH D. W., MOUNT G. H., LAWRENCE G. M., SANDERS R. W., THOMAS G. E. and CLEMENS L. E.
THORNE R. M. WALTERSCHEID R. L. WALTERSCHEIV R. L. and BOUCHER D. J. JR WAND R. H.
1985 J. geophys. kes. 90, 1735. 1988 J. aeoghys. Res. 93, 8625. 1991 J. qeo&ys. Res. 96, 1099. 1992 Geophys. Res. Letf. 19, 1093.
1980 1968
J. geophys. Res. 85, 1149. Planet. Space Sci. 16, 371. Ann. Geophys. 4,28 1. Planet. Space Sci. 30, 1283 1982
1985 J. geophys. Res. 90,7945. 1974 J. atmos. Sci. 31, 1898. 1991 J. atmos. terr. Phys. 53, 10,909. 1991 J. atmos. terr. Phys. 53, 10,923.
1981 J. geophvs. Res. 86, 1473
1979 J. geophys. Res. 84,5259. 1977 J. geophys. Res. 82, 5493. 1987 J. geophys. Res. 92, 6083.
1981
1991 1989
Planet. Space Sci. 29, 885.
J. geophys. Res. 96, 14,169. J. atmos. terr. Phys. 51, 621.
1983 Geophys. Res. Lett. 10, 253.
1981 1984 1983
J. geophys. Res. 81, 3179. The Dynamic Meteorology of the Stratosphere and
Mesosphere. American Meteorological Society, Lancaster Press, Lancaster, Pennsylvania.
Ph.D. thesis. Department of Earth and Space Science, University of California at Los Angeles.
Pageoph 118, 128. J. geophys. Res. 86,9698. J. atmos. Sci. 41, 1062. J. geophys. Res. 88,9243.