point & figure charts for beginners. - tradesignal · point & figure charts for beginners....
TRANSCRIPT

The ultimate tools for making profitable investment decisions.
POINT & FIGURE CHARTS FOR BEGINNERS.
TRADESIGNAL HOW TO.
intalus.com
01Issue
A publication ofPowered by

WATCH VIDEO TO SEE EXAMPLES ONPOINT & FIGURE CHARTS FOR BEGINNERS.
FIND THIS AND MORE TRADESIGNAL HOW TO VIDEOS AT:
www.intalus.com/tradesignal-howto
IN ADDITION CHECK OUR TRADING TIPS VIDEOS AT:www.intalus.com/trading-tips
POINT & FIGURE CHARTS FOR BEGINNERS. TRADESIGNAL HOW TO. 01
SHARE THIS TRADESIGNAL HOW TO!
POINT & FIGURE CHARTS FOR BEGINNERS.The ultimate tools for making profitable investment decisions.
Point & Figure charts are one of the oldest chart forms and have many advantages in analysis and the derivation of profitable trading signals. Because of their unique design and presentation P&F charts, in many circles, are viewed as complicated or even con-fusing – wrongly. With the present How To-issue we would like to bring light into the darkness and show what new tools Tradesginal offers for professional analysis.
The origins of the Point & Figure charts date back to the late 19th century, when price movements were still drawn by hand and made of numbers. A.W. Cohen popularized this technique and was the one who introduced the now common representation: P&F charts are composed of individual boxes, each representing a certain amount of movement. In short: P&F charts are based on price action, not time. If there are no significant price moves, nothing changes.
POINT & FIGURE CHARTS FOR BEGINNERS. TRADESIGNAL HOW TO. 01
SHARE THIS TRADESIGNAL HOW TO!

WHAT ARE THE ADVANTAGES POINT & FIGURE CHARTS?
This special design of this chart formation does an excellent service when it comes to eliminating insignificant noise from the chart. This way support and resistance zones and price patterns can be detected much clearer and easier. Figure 1 shows the price trend of Adidas shares as a P&F chart since 2011.
As a comparison, figure 1b shows the candlestick chart for the same under-lying. Just a brief glance is enough to determine that the P&F chart looks much tidier. It filters out insignificant price movements, while a candle is drawn in the traditional candlestick chart for each trading day – regardless of how significant the price movement was.
POINT & FIGURE CHARTS FOR BEGINNERS. TRADESIGNAL HOW TO. 01
MORE TRADESIGNAL HOW TO

Figure 1a: Point & Figure chart (Adidas AG)Point & Figure charts consist of X and O columns and have a non-linear time axis. Shown here is the price development of the Adidas-share since 2011 with a box size of 1%. The filtering of insignificant price movements – price changes less than 1% are not included – creates an orderly and clear picture.
POINT & FIGURE CHARTS FOR BEGINNERS. TRADESIGNAL HOW TO. 01
SHARE THIS TRADESIGNAL HOW TO!

Figure 1b: Candlestick chart (Adidas AG)In contrast to the clear point and figure chart of the conventional candlestick chart contains much more noise, because for each trading day a candle is removed – even if the price change does not significantly precipitated.
POINT & FIGURE CHARTS FOR BEGINNERS. TRADESIGNAL HOW TO. 01
MORE TRADESIGNAL HOW TO

BOX SIZE AND REVERSAL THRESHOLD – PARAMETERS IN POINT & FIGURE CHARTS.
The most striking feature of the P&F charts is its structure. X-columns represent rising prices, while O-columns stand for falling prices. Each of these columns in turn consists of individual boxes. Their size can be adjusted individually and determines the intensity of the filtering.
An example: On a rising X-column, the box at 100 using a box size of 1 represents the price range from 100 to 100.99. The price therefore has to increase to at least 101 in order to show a new X-box in the chart. Using a box size of 5, a new X-could would only be drawn if the price rises to at least 105, etc.
There are two common methods for defining the box size *:
b constant: for example, 1 box = X or Y points or currency units b percentage: for example, 1 box = 1%
* Tradesignal also offers other modes, for example based on the average true range (ATR). As a basis for the calculation of either
closing prices, or high and low price can be used. The latter are more accurate and should be preferred.
POINT & FIGURE CHARTS FOR BEGINNERS. TRADESIGNAL HOW TO. 01
SHARE THIS TRADESIGNAL HOW TO!

Figure 2: Tradesignal parameters in P&F chartsTradesignal provides all available methods to customize the box size.
POINT & FIGURE CHARTS FOR BEGINNERS. TRADESIGNAL HOW TO. 01
MORE TRADESIGNAL HOW TO

Basically: The box size determines the sensitivity of the Point & Figure charts. So it is clear that the time horizon of traders is decisive for the choice of an appropriate box size. A very short-term oriented market participant could for example choose a box size of 5 points in the DAX, while another trader opts rather for values of 50 points, because he prefers a stronger filtration. Especially in long-term charts and securities whose prices are subject to large fluctuations over time, the use of the percentage-box setting is recommended. Values in the range of 0.5 percent to 2 percent are usual. Point & Figure charts, can be used both in the short-term intraday range – here is the origin of this chart form – and daily data. Time levels above it (weekly, monthly), however, are not recommended.
The second parameter of a P&F chart is the so-called reversal threshold. This number indicates how many boxes of a counter-movement are required to in the chart a trend change – from X to O or vice versa – to initiate. The most common three-box reversal charts are used, ie a new column in the P&F chart is only started when there is a counter-movement to the extent of at least 3 boxes. The following table illustrates the charting process with a simple example.
POINT & FIGURE CHARTS FOR BEGINNERS. TRADESIGNAL HOW TO. 01
SHARE THIS TRADESIGNAL HOW TO!

Figure 3: Charting processThe Point & Figure chart filters insignificant price moves out depending on the parameter setting and therefore has no linear timeline.
A stock is trading at 100 and then increases without significant counter-movements up to 105. Five X-boxes are located in a column. Subsequently, the stock is under pressure and drops from 105 to 103 in the Point & Figure chart but there is no activity, as yet there is no 3-box reversal
106105 X104 X103 X102 X101 X100 X
The stock now falls to 102. Thus, the reversal is activated and a new O-column is started.
106105 X104 X O103 X O102 X O101 X100 X
Each time the shares fall from by 1 unit another O-Box is drawn in the column. Even if the stock increases by 2 units in the meantime, there is no activity in the P&F chart, since no reversal is present.
106105 X104 X O103 X O102 X O101 X O100 X
The share increases from 101 to 104.Thus, the condition for a 3-box reversal is met and a new X-column is drawn.
106105 X104 X O X103 X O X102 X O X101 X O100 X
POINT & FIGURE CHARTS FOR BEGINNERS. TRADESIGNAL HOW TO. 01
MORE TRADESIGNAL HOW TO

SIMPLE DETERMINING SUPPORT AND RESISTANCE ZONES.
P&F charts are ideal for the analysis of the securities markets. By filtering insignificant price moves, support and resistance zones will be determined quickly and clearly. The more times the price bounces on a price level (multiple columns at the same level) the more significant the resistance or support.
The following figure shows the course of the currency pair EURJPY including support and resistance lines, which can be automatically identified with the Tradesignal indicator “P&F Support & Resist” and visualized.
POINT & FIGURE CHARTS FOR BEGINNERS. TRADESIGNAL HOW TO. 01
SHARE THIS TRADESIGNAL HOW TO!

Figure 4: Support and resistance lines (EURJPY)With the Tradesignal indicator “P&F Support & Resist” support and resistance zones can be detected and visualized automatically.
POINT & FIGURE CHARTS FOR BEGINNERS. TRADESIGNAL HOW TO. 01
MORE TRADESIGNAL HOW TO

A publication of
How to use point & figure trend lines in candlestick charts.
intalus.com
Powered by
RULE-BASEDTRENDLINES IMPROVEDISCIPLINE.
TR�DINGTIPS. Issue
05
OBJECTIVE TREND LINES – A SPECIALTY OF POINT & FIGURE CHARTS.
Trend lines play an important role in the technical analysis, but the technology is sha-ped by a sense of subjectivity – not so for P&F charts. In the traditional three-box reversal chart trend lines are in fact always drawn at a 45 degree angle and are thus clearly defined. If we look again at the price action of the currency pair EURJPY – this time you can see all the trend lines drawn automatically by the Tradesignal indicator “P&F Trend Lines”.
BY THE WAY: Did you know that trend lines from the Point & Figure chart can also be transferred to the normal bar chart or candlestick chart? This is a specialty of Tradesignal. Take a look at our Trading Tips Issue No. 5 at www.intalus.com/trading-tips if you want to learn more.
POINT & FIGURE CHARTS FOR BEGINNERS. TRADESIGNAL HOW TO. 01
SHARE THIS TRADESIGNAL HOW TO!

Figure 5: 45 degree trend linesTrend lines can be detected and visualized with the Tradesignal indicator “P&F Trend Lines”.
POINT & FIGURE CHARTS FOR BEGINNERS. TRADESIGNAL HOW TO. 01
MORE TRADESIGNAL HOW TO
IDENTIFYING POINT & FIGURE PATTERNS AUTOMATICALLY – WITH THE NEW TRADESIGNAL INDICATOR.
Apart from support and resistance zones and trend lines Point & Figure charts offer clear patterns that can be used as trading signals. The simpliest pattern that also forms the basis for all other more complex price patterns is called the double top breakout. Unlike the name suggests, it is not a bearish but a bullish pattern. A double top breakout is namely present when an X-column breaks through the high of the previous X-column.
The bearish variant called double top breakdown occurs when the current O-column falls below the low of the previous O-column. Triple tops or bottoms work in a similar manner – the only difference is that now there are two columns at the same level and then need to be broken.
Important here: In 3-box reversal charts, double or triple tops or bottoms can both be reversal or continuation patterns.
POINT & FIGURE CHARTS FOR BEGINNERS. TRADESIGNAL HOW TO. 01
SHARE THIS TRADESIGNAL HOW TO!

Figure 6a: double top breakout & triple top breakout
XXXXX
XXXX
OOO
OOO
XXXXX
OOO
XXXX
XXX
Figure 6b: double bottom breakdown & triple bottom breakdown Double tops and bottoms form the basis for many P&F chart patterns.
OOOOO
OOOO
XXX
XXX
OOOOO
XXX
OOOO
OOO
POINT & FIGURE CHARTS FOR BEGINNERS. TRADESIGNAL HOW TO. 01
MORE TRADESIGNAL HOW TO

Figure 8 shows the curve of the DAX index, including automatic pattern recognition by Tradesignal. For this purpose we choose the new indicator “P&F Pattern” and set in pattern initially to “MultiTop”. Furthermore, you can specify whether only reversal patterns, continuation patterns or both should be displayed.
With the new Tradesignal version 7.3. not only multi tops and bottoms, but also so called traps are automatically detected and highlighted in the chart. Such a trap for the bulls is a breakout, which then quickly leads to a reversal movement. A bull trap oc-curs whenever the breakout consisting of only one box is followed by a 3-box reversal. The opposite variant is called a bear trap. Another pattern that is detected automati-cally by the software is called the catapult. A graphical overview of these price pattern shown on the next page.
POINT & FIGURE CHARTS FOR BEGINNERS. TRADESIGNAL HOW TO. 01
SHARE THIS TRADESIGNAL HOW TO!

Figure 7a: Bullish & bearish catapultA catapult lineup describes a breakout of a multi top or bottom (at least 3 boxes), which is followed by a counter-movement and then again generates a new breakout signal.
XXXXX
XXX
OOO
XXXX
OOO
XXXXO
OO
OOO
OOO
XXX
OOOO
XXX
OOOO
XXX
Bullish Catapult Bearish Catapult
Figure 7b: Bull & bear trap A bull or bear trap is always formed when a successful breakout (consisting of one box) is followed by a 3-box-reversal.
OOO
OOO
XXXX
OOO
XXX
Bull Trap (bearish)
XXX
XXX
OOOO
XXX
OOO
Bear Trap (bullish)
POINT & FIGURE CHARTS FOR BEGINNERS. TRADESIGNAL HOW TO. 01
MORE TRADESIGNAL HOW TO

Figure 8: Multi top / bottom patterns (DAX) As you can see, the DAX in April 2014 generated a bullish triple top breakout signal.
POINT & FIGURE CHARTS FOR BEGINNERS. TRADESIGNAL HOW TO. 01
SHARE THIS TRADESIGNAL HOW TO!

NEW POLE REVERSAL INDICATOR GIVES WARNING AGAINST FALSE BREAKOUTS.
Another novelty in the indicators camp is the “P&F Long Pole”. It indicates when a cer-tain counter-movement has taken place after an outbreak and thus can be used as an early warning sign of a potential false breakout. Tradesignal provides the ability to set the percentage threshold of reversals, but also the scope of the previous breakouts on an individual basis.
Similar to Fibonacci retracements traders can define specific counter-movements and adapt or close a position when they are met. To ensure that no pole signal is ignored, the activation of the alarm function is recommended. Figure 10 shows that the S&P 500 generated several poles reversals, which proved out to be a good early warning signals.
POINT & FIGURE CHARTS FOR BEGINNERS. TRADESIGNAL HOW TO. 01
MORE TRADESIGNAL HOW TO
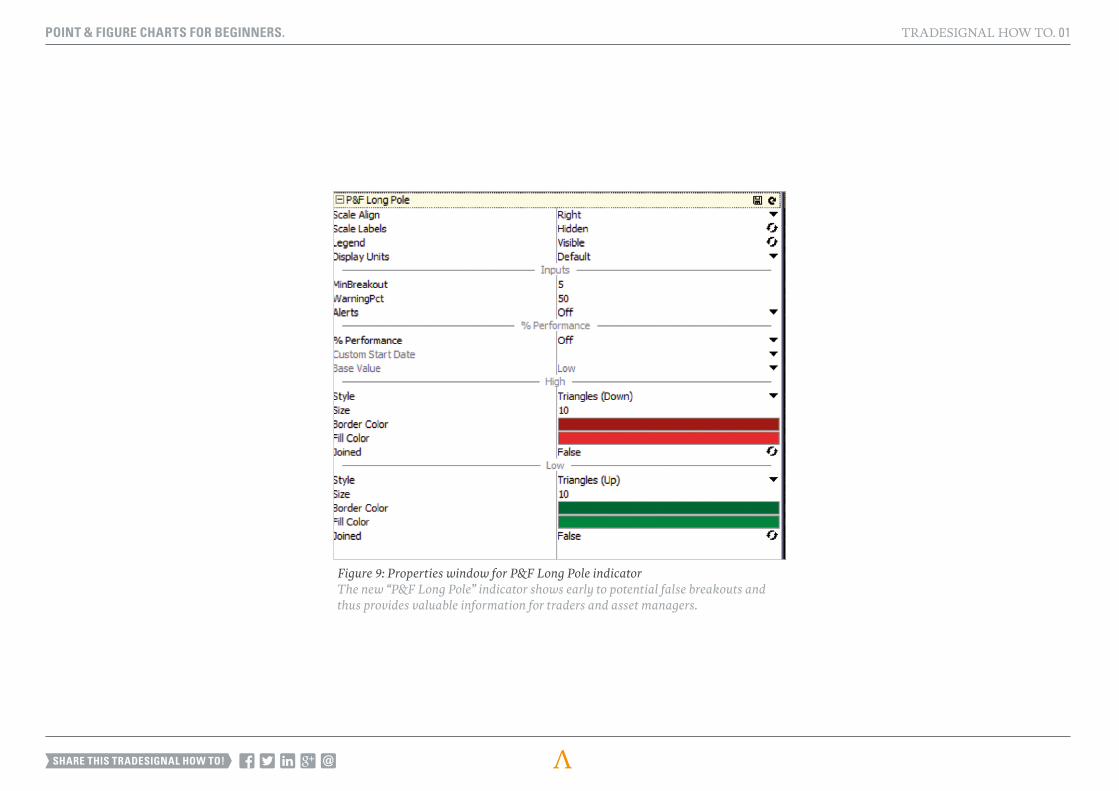
Figure 9: Properties window for P&F Long Pole indicatorThe new “P&F Long Pole” indicator shows early to potential false breakouts and thus provides valuable information for traders and asset managers.
POINT & FIGURE CHARTS FOR BEGINNERS. TRADESIGNAL HOW TO. 01
SHARE THIS TRADESIGNAL HOW TO!

Figure 10: High poles and low poles in the S&P 500 daily chart (box size 0.5%, 3-box reversal)The new “P&F Long Pole” indicator shows potential false breakouts and thus provides valuable information for traders and asset managers.
POINT & FIGURE CHARTS FOR BEGINNERS. TRADESIGNAL HOW TO. 01
MORE TRADESIGNAL HOW TO

DETERMINING PRICE OBJECTIVES USING POINT & FIGURE CHARTS.
In addition to numerous P&F patterns Tradesignal offers another highlight for traders and investors of all stripes: the determination of potential price targets. There are two counting methods for determining target price – the horizontal and the vertical. While the width of a consolidation zone defines the future price potential in the horizontal method, the vertical method is based on the length of a significant column which de-termines the upside or downside potential. Due to the better practicality we restrict ourselves at this point on the vertical method.
Let us look how to determine an upside price target. In the following example the first X-column after the bottom represents such a significant column (green label). Before this column can be used for calculation of a price target, it must be completed, which is the case when a 3-box-revesal occurs. Then the number of boxes counted in the significant column is multiplied by the respective box size and the reversal threshold. In the following graph, the significant column includes 4 boxes with the size of 1 point.
The target price can therefore be calculated as follows: 4 * reversal factor * box size or 4 * 3 * 1 = 12. These 12 boxes are then added to the low of the lowest O-column and give the price target. This target is activated, howe-ver, only when the high of the significant column is broken (see yellow highlight).
POINT & FIGURE CHARTS FOR BEGINNERS. TRADESIGNAL HOW TO. 01
SHARE THIS TRADESIGNAL HOW TO!

XXX
OOOOOO
XXXX
OOO
XXXXXXXX
OOOOOOOOOO
price target(4 * reversal * box size 1 = 12)
breakout signal
significant columnprice target projection startsat low former O-column
XXXX
X
Figure 11: Vertical count for determining an upward price targetIn the vertical method the length of a significant column determines the subsequent upside potential.
POINT & FIGURE CHARTS FOR BEGINNERS. TRADESIGNAL HOW TO. 01
MORE TRADESIGNAL HOW TO

TRADESIGNAL DETERMINES PRICE TARGETS AUTOMATICALLY.
Readers who think this procedure is too complicated and time-consuming, can look forward: With the latest version of Tradesignal traders, portfolio managers and analysts can delegate the target price calculation easily and quickly to the software. The “P&F Price Targets” indicator that can be added onto the chart via drag & drop and then immediately displays potential price targets. You can choose between two methods of counting and several patterns. A special highlight: not only the currently valid price projection is displayed, but also all price target projections from the past. Thus, each user can perform a kind of “manual backtest” and convince himself of the reliability of the P&F methodology.
The following figure shows the curve of the DAX between mid-2001 and 2010. The vertical method provided very good indication of potential target areas both at the end of the bull in 2007 and during the subsequent crash phase.
POINT & FIGURE CHARTS FOR BEGINNERS. TRADESIGNAL HOW TO. 01
SHARE THIS TRADESIGNAL HOW TO!
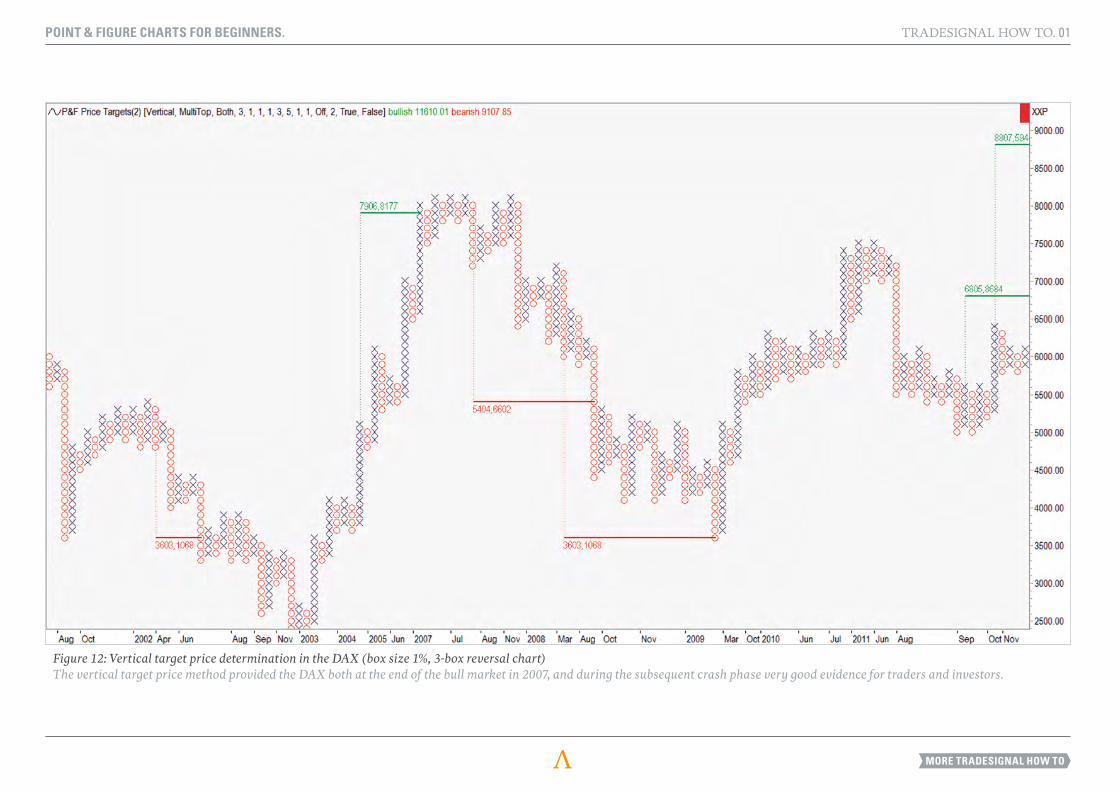
Figure 12: Vertical target price determination in the DAX (box size 1%, 3-box reversal chart)The vertical target price method provided the DAX both at the end of the bull market in 2007, and during the subsequent crash phase very good evidence for traders and investors.
POINT & FIGURE CHARTS FOR BEGINNERS. TRADESIGNAL HOW TO. 01
MORE TRADESIGNAL HOW TO

IMPORTANT TIPS FOR DEALING WITH POINT & FIGURE PRICE TARGETS.
The determination of price targets using P&F charts proves to be an useful tool for the analysis and the generation of trading signals. Despite all the advantages the following aspects should be considered:
b The target itself should never be the exclusive reason to open a position. b Before overarching price objectives become relevant, previous smaller price
targets have to be met. b Negation of price targets: if the price moves below (above) the low (high) of
the pattern, which was considered as the basis for a target price, the vertical count is negated.
b When horizontal targets match with vertical price targets, the likelihood that the target projection will be achieved increases.
b An upside target (downside target) should be achieved with a higher probability when it is generated above (below) a 45-degree trend line. Counts against the trend, however, are to be treated with caution.
POINT & FIGURE CHARTS FOR BEGINNERS. TRADESIGNAL HOW TO. 01
SHARE THIS TRADESIGNAL HOW TO!

© 2014 Intalus – www.intalus.com
Distribution allowed under a Creative Commons Attribution-Noncommercial license:
http://creativecommons.org/licenses/by-nc/3.0/
Tradesignal® is a registered trademark of Tradesignal GmbH. Unauthorized use or misuse is specifically prohibited.
All other protected brands and trademarks mentioned in this document conform, without restriction, to the provisions of applicable
trademark law and the copyrights of the respective registered owners.
BLOOMBERGTHOMSON REUTERS
TRADESIGNAL – THE PERFECT SOFTWARE FOR PROFESSIONAL POINT & FIGURE TRADING .
Point & Figure charts provide tangible benefits in the analysis of financial markets – both for short-term traders as well as for strategically oriented investors. The focus is on the filtering of insignificant price information and the clear objective of generating trading signals. With Tradesignal on side traders, asset managers and analysts are provided with all the necessary tools for the automatic recognition of attractive market situations. Of course, alarms can be set, so that no signal is being missed in the heat of the moment.
Try our workspace that we provide for Thomson Reuters and Bloomberg users:
That’s it for today – take care, take profit and “auf Wiedersehen”.
POINT & FIGURE CHARTS FOR BEGINNERS. TRADESIGNAL HOW TO. 01
MORE TRADESIGNAL HOW TO

MORE INFOS AT: www.intalus.com/workshops
YOU CAN’T REACH THEHIGHEST PEAK IN ONE DAY.
Get yourself prepared – with workshops by Intalus.