point cloud labeling using 3d convolutional neural …...point cloud labeling using 3d convolutional...
TRANSCRIPT

Point Cloud Labeling using 3D ConvolutionalNeural Network
Jing Huang and Suya YouUniversity of Southern California
Los Angeles, California 90089
Abstract—In this paper, we tackle the labeling problem for 3Dpoint clouds. We introduce a 3D point cloud labeling schemebased on 3D Convolutional Neural Network. Our approachminimizes the prior knowledge of the labeling problem and doesnot require a segmentation step or hand-crafted features as mostprevious approaches did. Particularly, we present solutions forlarge data handling during the training and testing process. Ex-periments performed on the urban point cloud dataset containing7 categories of objects show the robustness of our approach.
I. INTRODUCTION
Point cloud labeling is an important task in computer visionand object recognition. As a result, each point is assigned witha redefined label, which further serves as a cue for sceneanalysis and understanding. The classes of interest includemost common objects in the urban scenario (Figure 1): large-scale planes (including ground and roof), buildings, trees, cars,poles as well as wires.
Traditionally, hand-crafted features are widely used in exist-ing methods [1], [2], [3]. However, the recent progress of deeplearning techniques show that, the simplest feature like pixelscan be directly combined with the neural networks and trainedtogether. On the other hand, simply projecting 3D data to 2Drepresentations such as depth images and then applying the2D techniques can easily lead to loss of important structuralinformation embedded in the 3D representation. Inspired bythe success of deep learning on the 2D image problems,we present the voxel-based fully-3D Convolutional NeuralNetwork on the point cloud labeling problem.
In most existing approaches, segmentation is a necessarystep before performing tasks such as detection and classi-fication [4]. Our method does not require prior knowledge,such as the segmentation of the ground and/or buildings,the precomputed normals, etc. Everything is based on thevoxelized data, which is a straightforward representation. Fromanother point of view, our approach works as an end-to-end segmentation method. Our work shows the power ofneural networks to capture the essential features needed fordistinguishing different categories by themselves.
Despite the conceptually straightforward idea of represent-ing point clouds as voxels to solve the problem, there aremany underlying challenges. First, the dense voxel represen-tation will quickly exceed the memory limit of any computer.Secondly, it will require too much time without proper opti-mization of the algorithm. Also, the classifier could be easily
Fig. 1. Objects of interest. The buildings are colored with orange, horizontalplanes (e.g., ground and roof) are colored with yellow, trees are colored withgreen, cars are colored with red, poles are colored with blue, and wires arecolored with black. The points in the other categories are colored with lightgray.
biased towards some dominating categories (e.g., buildings)without deliberately balancing the training data.
Our contributions mainly include:(1) We introduce a framework of 3D Convolutional Neural
Network (3D-CNN) and design effective algorithms for label-ing complex 3D point could data.
(2) We present solutions for efficiently handling large dataduring the voxelization, training and testing of the 3D network.
II. RELATED WORK
A. 3D Object Detection and Labeling
Pinheiro et al. applied Recursive Neural Network for sceneparsing [5]. Habermann et al. present a 3D object recognitionapproach based on Multiple Layer Perceptron (MLP) on2D projected data [4]. However, their method requires datasegmentation. Koppula et al. take a large-margin approachto perform the 3D labeling classification based on variousfeatures [1]. PCA analysis and the dimensionality feature
based on it have been applied in point-level classification tasks[6], [3]. Still, the parameter selection for the features are highlyempirical, and we show in this work that 3D-CNN based on thesimplest occupancy voxels could achieve comparable effectswithout any task-specific features.
B. 3D CNN
3D CNN has been proposed first in the application of videodata analysis, because videos can be seen as a temporal 3Dextension of the 2D images as have well-defined grid values.Ji et al. proposed 3D-CNN for human action recognition invideo data [7]. For 3D point cloud, Maturana and Schererapplied 3D-CNN for landing zone detection from LiDAR pointclouds [8]. Prokhorov presented a 3D-CNN for categorizationof segmented point clouds [9]. 3D Shape Nets applied 3DCNN to learn the representation of 3D shapes [10]. VoxNetintegrated a volumetric Occupancy Grid representation with3D CNN [11]. All of their approaches require pre-segmentedobjects before applying the 3D-CNN method. To incorporatethe localization problem in the 3D CNN framework, Songand Xiao proposed the deep sliding shapes for 3D objectdetection in depth images [2] and RGB-D images [12], withthe 3D Region Proposal Network (RPN). However, they usethe Manhattan world assumption to define the bounding boxorientation of indoor objects, which is not feasible for outdoorobjects in our case.
III. SYSTEM OVERVIEW
Our labeling system is depicted in Figure 2. The system iscomposed of an offline training module and an online testingmodule.
The offline training takes the annotated training data asinput. The training data are parsed through a voxelizationprocess that generates occupancy voxel grids centered at aset of keypoints. The keypoints are generated randomly, andthe number of them are balanced across different categories.The labels of the voxel grids are decided by the dominatingcategory in the cell around the keypoint. Then, the occupancyvoxels and the labels are fed to a 3D Convolutional NeuralNetwork, which is composed of two 3D convolutional layers,two 3D max-pooling layers, a fully connected layer and alogistic regression layer (Section V). The best parametersduring training are saved.
The online testing takes a raw point cloud without labels asinput. The point cloud is parsed through a dense voxel gridand results in a set of occupancy voxels centered at every gridcenters, respectively. The voxels are then used as the input tothe trained 3D convolutional network, and every voxel gridwould produce exactly one label. The inferred labels are thenmapped back to the original point cloud to produce a pointwiselabeling result (Section VI).
Note that, due to different requirements of the training andtesting modules, the voxelization process are quite differentexcept the parameters such as grid size and voxel number. Wewill discuss the details of voxelization in Section IV.
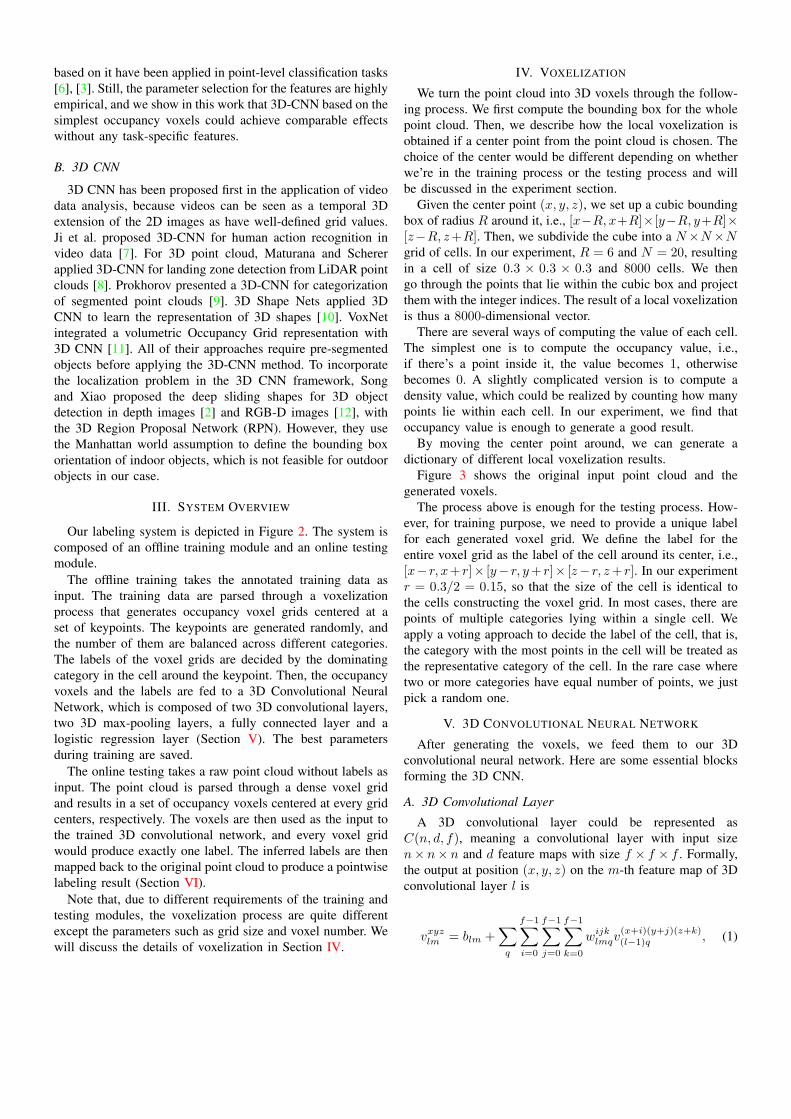
IV. VOXELIZATION
We turn the point cloud into 3D voxels through the follow-ing process. We first compute the bounding box for the wholepoint cloud. Then, we describe how the local voxelization isobtained if a center point from the point cloud is chosen. Thechoice of the center would be different depending on whetherwe’re in the training process or the testing process and willbe discussed in the experiment section.
Given the center point (x, y, z), we set up a cubic boundingbox of radius R around it, i.e., [x−R, x+R]×[y−R, y+R]×[z−R, z+R]. Then, we subdivide the cube into a N×N×Ngrid of cells. In our experiment, R = 6 and N = 20, resultingin a cell of size 0.3 × 0.3 × 0.3 and 8000 cells. We thengo through the points that lie within the cubic box and projectthem with the integer indices. The result of a local voxelizationis thus a 8000-dimensional vector.
There are several ways of computing the value of each cell.The simplest one is to compute the occupancy value, i.e.,if there’s a point inside it, the value becomes 1, otherwisebecomes 0. A slightly complicated version is to compute adensity value, which could be realized by counting how manypoints lie within each cell. In our experiment, we find thatoccupancy value is enough to generate a good result.
By moving the center point around, we can generate adictionary of different local voxelization results.
Figure 3 shows the original input point cloud and thegenerated voxels.
The process above is enough for the testing process. How-ever, for training purpose, we need to provide a unique labelfor each generated voxel grid. We define the label for theentire voxel grid as the label of the cell around its center, i.e.,[x− r, x+ r]× [y− r, y+ r]× [z− r, z+ r]. In our experimentr = 0.3/2 = 0.15, so that the size of the cell is identical tothe cells constructing the voxel grid. In most cases, there arepoints of multiple categories lying within a single cell. Weapply a voting approach to decide the label of the cell, that is,the category with the most points in the cell will be treated asthe representative category of the cell. In the rare case wheretwo or more categories have equal number of points, we justpick a random one.
V. 3D CONVOLUTIONAL NEURAL NETWORK
After generating the voxels, we feed them to our 3Dconvolutional neural network. Here are some essential blocksforming the 3D CNN.
A. 3D Convolutional Layer
A 3D convolutional layer could be represented asC(n, d, f), meaning a convolutional layer with input sizen× n× n and d feature maps with size f × f × f . Formally,the output at position (x, y, z) on the m-th feature map of 3Dconvolutional layer l is
vxyzlm = blm +∑q
f−1∑i=0
f−1∑j=0
f−1∑k=0
wijklmqv
(x+i)(y+j)(z+k)(l−1)q , (1)

Fig. 2. The labeling system pipeline, including the offline training module and the online testing module.
(a)
(b)
Fig. 3. Illustration for dense voxelization. The input point cloud (a) is parsedthrough the voxelization process, which generates a dense voxel representationdepicted in (b).
where blm is the bias for the feature map, q goes throughthe feature maps in the (l − 1)-th layer, wijk
lmq is the weightat position (i, j, k) of the kernel of the q-th feature map. Theweights and the bias will be obtained through the trainingprocess.
B. 3D Pooling Layer
A 3D pooling layer can be represented as P (n, g), meaninga pooling layer with input size n×n×n and a pooling kernelof g× g× g. In this approach, we use max pooling. Formally,the output at position (x, y, z) on the m-th feature map of 3Dmax pooling layer l is
vxyzlm = maxi,j,k∈{0,1,...,g−1}
v(gx+i)(gy+j)(gz+k)(l−1)m . (2)
To increase nonlinearity, we use the hyperbolic tangent(tanh(·)) activation function after each pooling layer.
C. Network Layout
In terms of the layout of the 2D network, our work isbased on the success of LeNet [13], which is composed of2 convolutional layers, 2 pooling layers and 1 fully-connectedlayer. We replace the 2D convolutional layers and 2D poolinglayers with the 3D convolutional layers and 3D pooling layers,respectively, and obtain our architecture (Figure 4).
The architecture could be represented as C(nc1, dc1, fc1)−P (np1, gp1) − C(nc2, dc2, fc2) − P (np2, gp2) − FC(nf1) −LR(nf2); FC(n) represents a fully-connected layer with inputsize n; LR(n) represents a logistic regression layer with inputsize n. The final output denoting the labeling result is aninteger l ∈ {0, 1, 2, ..., L} produced by softmax. In this case

Fig. 4. 3D Convolutional Neural Network. The number on the top denote the number of nodes in each layer. The input is the voxel grid of size 203, followedby a convolution layer with 20 feature maps of size 5 × 5 × 5 resulting in 20 × 163 outputs, a max pooling layer with 2 × 2 × 2-sized non-overlappingdivisions resulting in 20 × 83 outputs, a second convolutional layer with 20 feature maps of size 5 × 5 × 5 resulting in 20 × 43 outputs, a second maxpooling layer with 2×2× 2-sized non-overlapping divisions resulting in 20×23 outputs, a fully connected layer with 300 hidden nodes, and the final outputis based on a softmax over 8 labels (including 7 categories and an empty label).
L = 7, representing the 7 categories specified in Figure 1,while the label 0 denotes the degenerated case where thecentral region of the voxel grid contains no point.
VI. LABEL INFERENCE
Given the trained network, we can perform voxel-levelclassification on the cells. We densely sample the center pointof the voxel grids with a distance of 0.3. The coincidence ofthe center distance and the cell size is intended to generate aunoverlapped compact division of the whole space. Given thelabeling result of a local voxel box, we label all points in thecell near the center of the box as the corresponding category.
The compact division would label every point in the dataexactly once. However, this would restrict the precision of thelabeling to the degree of the cell size. In our experiments,we find the granularity is sufficient to produce quite a goodresult (see Section VII) with negligible boundary artifacts. Inpractice, when there’re enough computational resources, wecan shift the centers around and redo the classification process,and finally, we can employ a voting scheme to decide whichlabel is assigned to each point.
VII. EXPERIMENTS
A. Dataset and Training Setup
The labeling system is evaluated on a large Lidar pointcloud dataset of the urban area of Ottawa. The data comefrom a fusion of one airborne scanner and four car-mountedscanners. We implement the 3D convolutional network usingthe Theano library [14] and the network is trained with theStochastic Gradient Descent method. The size of mini-batchis 30 examples, and the learning rate is 0.1 with a decay rateof 0.95. We manually labeled a few trunks from the entiredata, which could generate up to 500k features and labels.However, we only selected 50k of them as training data and20k of them as validation data under a random and balancedscheme.
B. Balance of Training Samples
During training, we find that a dense sampling of thetraining data leads to undesired behavior of bias amongcommon categories such as buildings, versus the less common
dc1/dc2 10 20 4020 91.9% 93.0% 92.7%
TABLE ICOMPARISON OF DIFFERENT NUMBERS OF KERNELS IN THE TWO 3D
CONVOLUTIONAL LAYERS.
categories such as the wires. Therefore, we implement a bal-anced random sampling of different categories of the trainingdata. Specifically, we extract the same number of key pointsfrom each category, as the centers of the voxelized regions.Experiments show that despite the vastly uneven number ofpoints in category in the real data, the balance of the trainingdata among each categories contributes to a key boost of theperformance of the method.
C. Parameter Selection
We perform experiments with a few parameter settings. Wefix the kernel size to be 5× 5 and evaluate how the numbersof kernels affect the performance. From Table I we can seethat the best performance is achieved when dc1 = dc2 = 20,and generally speaking, the parameter here does not have hugeimpact on the labeling result.
D. Qualitative Result
Figure 6 shows the labeling result of a large area in thecity of Ottawa by our approach. Figure 7 shows the closeups.We can see from the result that although we don’t have asegmentation step for this task, the generated result showsclearly distinguished labeling result for different objects.
E. Quantitative Result
We evaluate our approach by comparing the results andthe ground truth labels. We implement an automatic programto evaluate the methods. The points are sorted according totheir coordinates in O(nlogn) time so that the labels can becompared in O(n) time, where n is the number of points.
Figure 5 shows the confusion matrix across the categories.The entry at the i-th row and the j-th column denotesthe percentage of points of the j-th truth category that areclassified as the i-th category, and the background of the cellsis color-coded so that 1 is mapped to black, 0 is mapped to

Fig. 5. Confusion matrix for different categories. The entry at the i-th rowand the j-th column denotes the percentage of points of the j-th truth categorythat are classified as the i-th category.
white and anything in between is mapped to the correspondinggray values. From the table we can see that the cars and planesare well-classified with an accuracy higher than 95%, whilebuildings, poles and wires have an accuracy between 80% and90%. The accuracy for trees is a little below 80%, mainly dueto the confusion with the others category containing manyscattered clusters such as humans and bushes. In some area, theparallel wires have a high density and lead to some confusionwith the horizontal planes. The overall precision for pointlabeling of all categories is 93.0%.
Despite the high dimensionality of the voxel representationand 3D CNN, our system is highly efficient in terms of bothspace and time. The training process takes around 2 hours ona PC with NVIDIA GeForce GTX 980M GPU. For one trunkof data (100m×100m) and with voxel size of 0.3m×0.3m×0.3m, the voxelization process takes less than 5 minutes, andthe classification step takes less than 3 minutes.
VIII. CONCLUSION AND FUTURE WORK
We propose a 3D point cloud labeling system based onfully 3D Convolutional Neural Network. Our approach doesnot need prior knowledge for segmentation. In the future,there are a few directions in which we can explore. First,the current labels can be used as input to the network again,which resembles the idea of recursive neural networks. Also,the multi-resolution version of the network might work evenbetter for objects of large scale variance.
REFERENCES
[1] H. S. Koppula, A. Anand, T. Joachims, and A. Saxena, “Semanticlabeling of 3d point clouds for indoor scenes,” in Advances in neuralinformation processing systems, 2011, pp. 244–252. 1
[2] S. Song and J. Xiao, “Sliding shapes for 3d object detection in depthimages,” in Computer Vision–ECCV 2014. Springer, 2014, pp. 634–651. 1, 2
[3] H. Yokoyama, H. Date, S. Kanai, and H. Takeda, “Detection andclassification of pole-like objects from mobile laser scanning data ofurban environments,” International Journal of CAD/CAM, vol. 13, no. 2,2013. 1, 2
[4] D. Habermann, A. Hata, D. Wolf, and F. S. Osorio, “Artificial neural netsobject recognition for 3d point clouds,” in Intelligent Systems (BRACIS),2013 Brazilian Conference on. IEEE, 2013, pp. 101–106. 1
[5] P. H. Pinheiro and R. Collobert, “Recurrent convolutional neural net-works for scene parsing,” arXiv preprint arXiv:1306.2795, 2013. 1
[6] J. Demantke, C. Mallet, N. David, and B. Vallet, “Dimensionality basedscale selection in 3d lidar point clouds,” The International Archives ofthe Photogrammetry, Remote Sensing and Spatial Information Sciences,vol. 38, no. Part 5, p. W12, 2011. 2
[7] S. Ji, W. Xu, M. Yang, and K. Yu, “3d convolutional neural networks forhuman action recognition,” Pattern Analysis and Machine Intelligence,IEEE Transactions on, vol. 35, no. 1, pp. 221–231, 2013. 2
[8] D. Maturana and S. Scherer, “3d convolutional neural networks forlanding zone detection from lidar,” in Robotics and Automation (ICRA),2015 IEEE International Conference on. IEEE, 2015, pp. 3471–3478.2
[9] D. Prokhorov, “A convolutional learning system for object classificationin 3-d lidar data,” Neural Networks, IEEE Transactions on, vol. 21,no. 5, pp. 858–863, 2010. 2
[10] Z. Wu, S. Song, A. Khosla, F. Yu, L. Zhang, X. Tang, and J. Xiao, “3dshapenets: A deep representation for volumetric shapes,” in Proceedingsof the IEEE Conference on Computer Vision and Pattern Recognition,2015, pp. 1912–1920. 2
[11] D. Maturana and S. Scherer, “Voxnet: A 3d convolutional neural networkfor real-time object recognition,” in Intelligent Robots and Systems(IROS), 2015 IEEE/RSJ International Conference on. IEEE, 2015,pp. 922–928. 2
[12] S. Song and J. Xiao, “Deep sliding shapes for amodal 3d object detectionin rgb-d images,” arXiv preprint arXiv:1511.02300, 2015. 2
[13] Y. LeCun, L. Bottou, Y. Bengio, and P. Haffner, “Gradient-based learningapplied to document recognition,” Proceedings of the IEEE, vol. 86,no. 11, pp. 2278–2324, 1998. 3
[14] J. Bergstra, F. Bastien, O. Breuleux, P. Lamblin, R. Pascanu, O. De-lalleau, G. Desjardins, D. Warde-Farley, I. Goodfellow, A. Bergeronet al., “Theano: Deep learning on gpus with python,” in NIPS 2011,BigLearning Workshop, Granada, Spain, 2011. 4

Fig. 6. Labeling result for a large urban area through the 3D-CNN.
(a) (b)
(c) (d)
Fig. 7. Close-ups of the labeling result. (a) The ground planes, buildings, trees and cars. (b) The street view with various poles including light poles, signpoles, utility poles and flag poles. (c) The street view with utility poles and wires. (d) The parking lot scene.