poco graphite, inc. properties and characteristics of graphite
TRANSCRIPT
Edited by R. G. Sheppard, Dwayne Morgan, D. M. Mathes, D. J. Bray
Fifth Printing – February 20021987 Poco Graphite, Inc.
POCO Graphite, Inc.300 Old Greenwood Rd.
Decatur, TX 76234www.poco.com
NoticeReproduction or recording of any part of this book is strictly prohibited without the express written consent of the copyright holder. Text, tables, diagrams,or other material may not be copied by facsimile, enlargement, or reduction; microfilmed; nor reproduced on slides, or by other means or materials.
Poco Graphite, Inc.Properties and Characteristics
of GraphiteFor the EDM Industry

PREFACE
Poco Graphite manufacturers a complete family of graphite materials for EDM applications. The physical properties and characteristics of the grades vary by particle size, microstructure consistency, flexural strength, density, and hardness. Many EDMers know these properties are important, but they may not understand the specific effect each of these properties has on the graphite’s performance as an EDM electrode. These differencesin performance account for the array of EDM graphite grades available. Each is tailored to function at the level ofperformance required by a specific application.
The purpose of the primer is to introduce the reader to graphite properties and testing techniques so that theunique attributes of POCO become more apparent. Graphite properties and testing have always been a prime con-cern of Poco Graphite. In order to maintain the quality of POCO materials and develop new grades to meet spe-cific criteria, POCO maintains an extensive testing laboratory. POCO personnel have been active in the develop-ment of ASTM standards for graphite testing. Over the years POCO has accumulated data on manufacturedgraphites, POCO materials as well as competitive materials. This data was used to produce the information in thisbook.
Machining with the right graphite electrode material for the application is important to the profitability of the job. Theappropriate material lasts longer and can be machined without breaking, keeping graphite replacement costs down.Using the right graphite/ work metal combination will allow the job to be run at the most productive speed. To selectthe best graphite for a particular job, operators must become familiar with graphite classification and understandhow the graphite’s properties influence its performance and machinability.
POCO’s is dedicated to manufacturing graphites that have unique properties that are superior to other manufactured graphites. These are the class of materials upon which POCO has built its reputation for producingthe best graphite in the world.
Reproduction or recording of any part of this book is strictly prohibited without the express written consent of the copyright holder. Text, tables, diagrams,or other material may not be copied by facsimile, enlargement, or reduction; microfilmed; nor reproduced on slides, or by other means or materials.
i
P r o p e r t i e s a n d C h a r a c t e r i s t i c s o f G r a p h i t e

TABLE OF CONTENTS
page
Preface i
Table of Contents iii
Chapter 1 Structure and Isotropy 1.1–1.5
Chapter 2 Apparent Density 2.1–2.2
Chapter 3 Porosity 3.1–3.4
Chapter 4 Hardness 4.1–4.2
Chapter 5 Compressive Strength 5.1–5.2
Chapter 6 Flexural Strength 6.1–6.3
Chapter 7 Tensile Strength 7.1–7.2
Chapter 8 Modulus of Elasticity 8.1–8.2
Chapter 9 Electrical Resistivity 9.1–9.2
Chapter 10 Thermal Expansion 10.1–10.2
Chapter 11 Thermal Conductivity 11.1–11.3
Chapter 12 Thermal Shock 12.1–12.2
Chapter 13 Specific Heat 13.1–13.3
Chapter 14 Emissivity 14.1–14.2
Chapter 15 Ash 15.1–15.2
Chapter 16 Oxidation 16.1–16.2
Appendix A Conversion Factors a.1–a.2
Appendix B POCO Laboratory Instructions b.1
Appendix C Bibliography c.1-c.2
Reproduction or recording of any part of this book is strictly prohibited without the express written consent of the copyright holder. Text, tables, diagrams,or other material may not be copied by facsimile, enlargement, or reduction; microfilmed; nor reproduced on slides, or by other means or materials.
iii
P r o p e r t i e s a n d C h a r a c t e r i s t i c s o f G r a p h i t e

Reproduction or recording of any part of this book is strictly prohibited without the express written consent of the copyright holder. Text, tables, diagrams,or other material may not be copied by facsimile, enlargement, or reduction; microfilmed; nor reproduced on slides, or by other means or materials.
1.1
P r o p e r t i e s a n d C h a r a c t e r i s t i c s o f G r a p h i t e
Definition
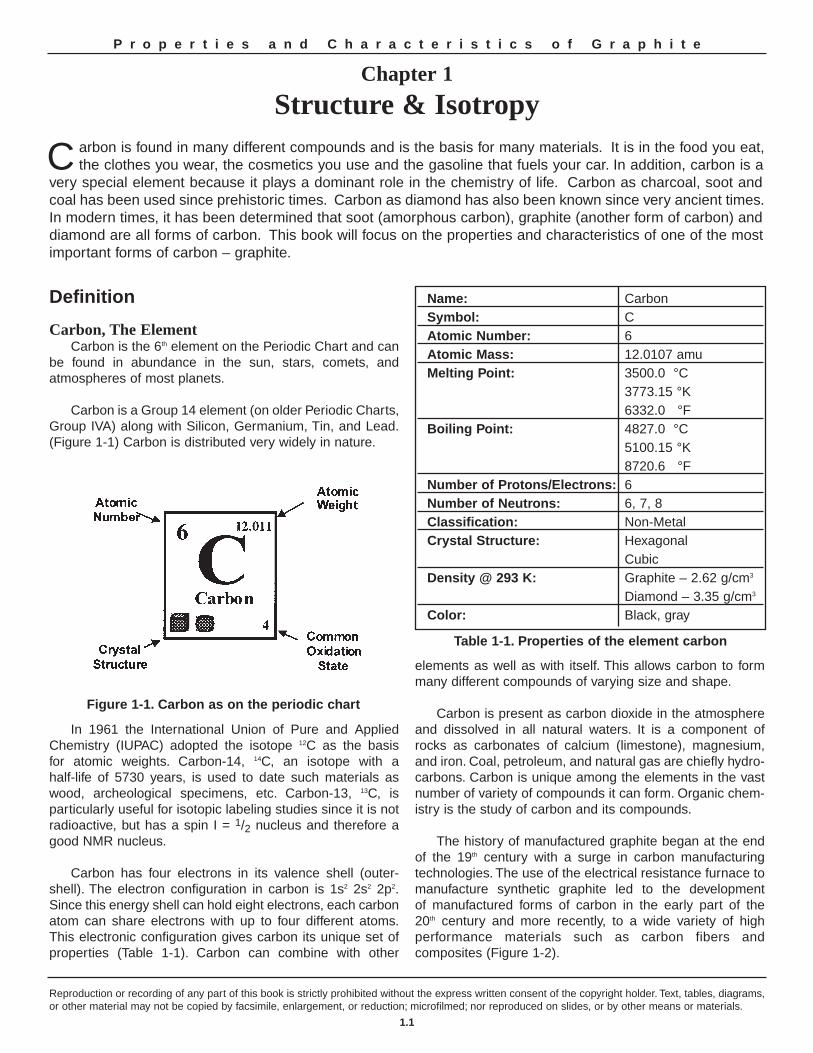
Carbon, The ElementCarbon is the 6th element on the Periodic Chart and can
be found in abundance in the sun, stars, comets, andatmospheres of most planets.
Carbon is a Group 14 element (on older Periodic Charts,Group IVA) along with Silicon, Germanium, Tin, and Lead.(Figure 1-1) Carbon is distributed very widely in nature.
In 1961 the International Union of Pure and AppliedChemistry (IUPAC) adopted the isotope 12C as the basis for atomic weights. Carbon-14, 14C, an isotope with a half-life of 5730 years, is used to date such materials aswood, archeological specimens, etc. Carbon-13, 13C, is particularly useful for isotopic labeling studies since it is notradioactive, but has a spin I = 1/2 nucleus and therefore agood NMR nucleus.
Carbon has four electrons in its valence shell (outer-shell). The electron configuration in carbon is 1s2 2s2 2p2.Since this energy shell can hold eight electrons, each carbonatom can share electrons with up to four different atoms.This electronic configuration gives carbon its unique set ofproperties (Table 1-1). Carbon can combine with other
elements as well as with itself. This allows carbon to formmany different compounds of varying size and shape.
Carbon is present as carbon dioxide in the atmosphereand dissolved in all natural waters. It is a component ofrocks as carbonates of calcium (limestone), magnesium,and iron. Coal, petroleum, and natural gas are chiefly hydro-carbons. Carbon is unique among the elements in the vastnumber of variety of compounds it can form. Organic chem-istry is the study of carbon and its compounds.
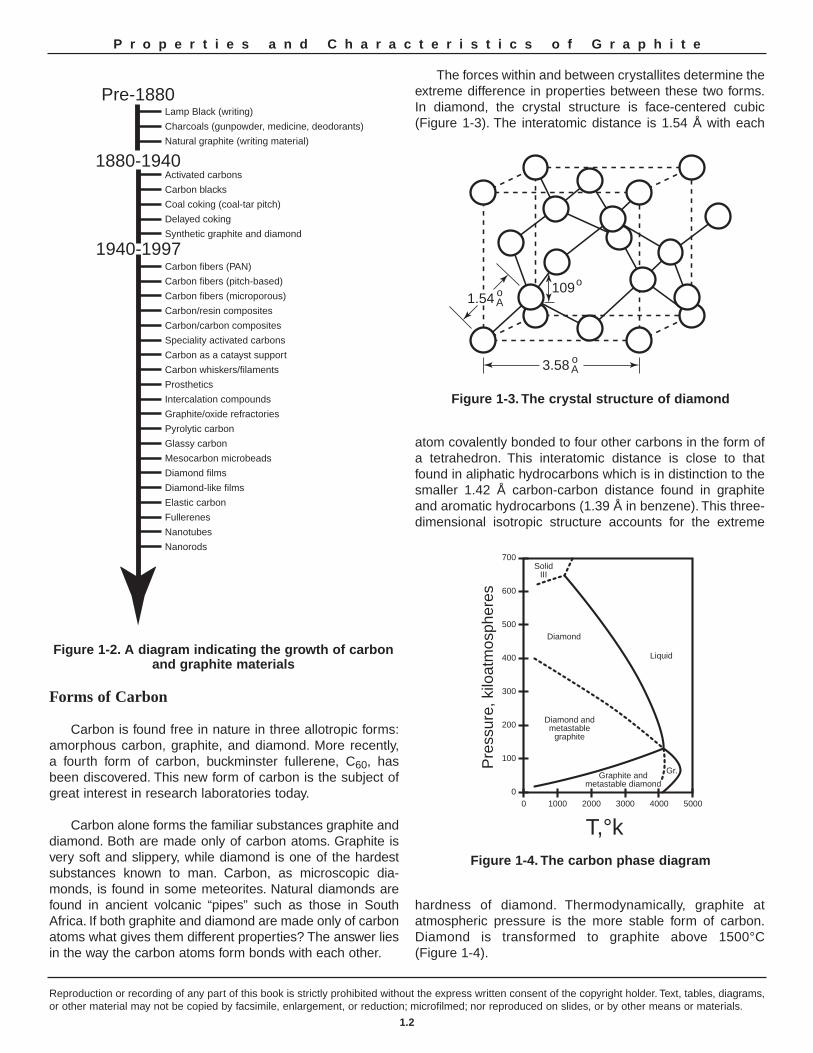
The history of manufactured graphite began at the end of the 19th century with a surge in carbon manufacturingtechnologies. The use of the electrical resistance furnace tomanufacture synthetic graphite led to the development of manufactured forms of carbon in the early part of the 20th century and more recently, to a wide variety of high performance materials such as carbon fibers and composites (Figure 1-2).
Chapter 1
Structure & Isotropy
C arbon is found in many different compounds and is the basis for many materials. It is in the food you eat, the clothes you wear, the cosmetics you use and the gasoline that fuels your car. In addition, carbon is a
very special element because it plays a dominant role in the chemistry of life. Carbon as charcoal, soot andcoal has been used since prehistoric times. Carbon as diamond has also been known since very ancient times.In modern times, it has been determined that soot (amorphous carbon), graphite (another form of carbon) anddiamond are all forms of carbon. This book will focus on the properties and characteristics of one of the mostimportant forms of carbon – graphite.
Name: Carbon Symbol: C Atomic Number: 6 Atomic Mass: 12.0107 amu Melting Point: 3500.0 °C
3773.15 °K6332.0 °F
Boiling Point: 4827.0 °C 5100.15 °K8720.6 °F
Number of Protons/Electrons: 6 Number of Neutrons: 6, 7, 8 Classification: Non-Metal Crystal Structure: Hexagonal
Cubic Density @ 293 K: Graphite – 2.62 g/cm3
Diamond – 3.35 g/cm3
Color: Black, gray
Figure 1-1. Carbon as on the periodic chart
Table 1-1. Properties of the element carbon
Reproduction or recording of any part of this book is strictly prohibited without the express written consent of the copyright holder. Text, tables, diagrams,or other material may not be copied by facsimile, enlargement, or reduction; microfilmed; nor reproduced on slides, or by other means or materials.
1.2
P r o p e r t i e s a n d C h a r a c t e r i s t i c s o f G r a p h i t e
Forms of Carbon
Carbon is found free in nature in three allotropic forms:amorphous carbon, graphite, and diamond. More recently, a fourth form of carbon, buckminster fullerene, C60, hasbeen discovered. This new form of carbon is the subject ofgreat interest in research laboratories today.
Carbon alone forms the familiar substances graphite anddiamond. Both are made only of carbon atoms. Graphite isvery soft and slippery, while diamond is one of the hardestsubstances known to man. Carbon, as microscopic dia-monds, is found in some meteorites. Natural diamonds arefound in ancient volcanic “pipes” such as those in SouthAfrica. If both graphite and diamond are made only of carbonatoms what gives them different properties? The answer liesin the way the carbon atoms form bonds with each other.
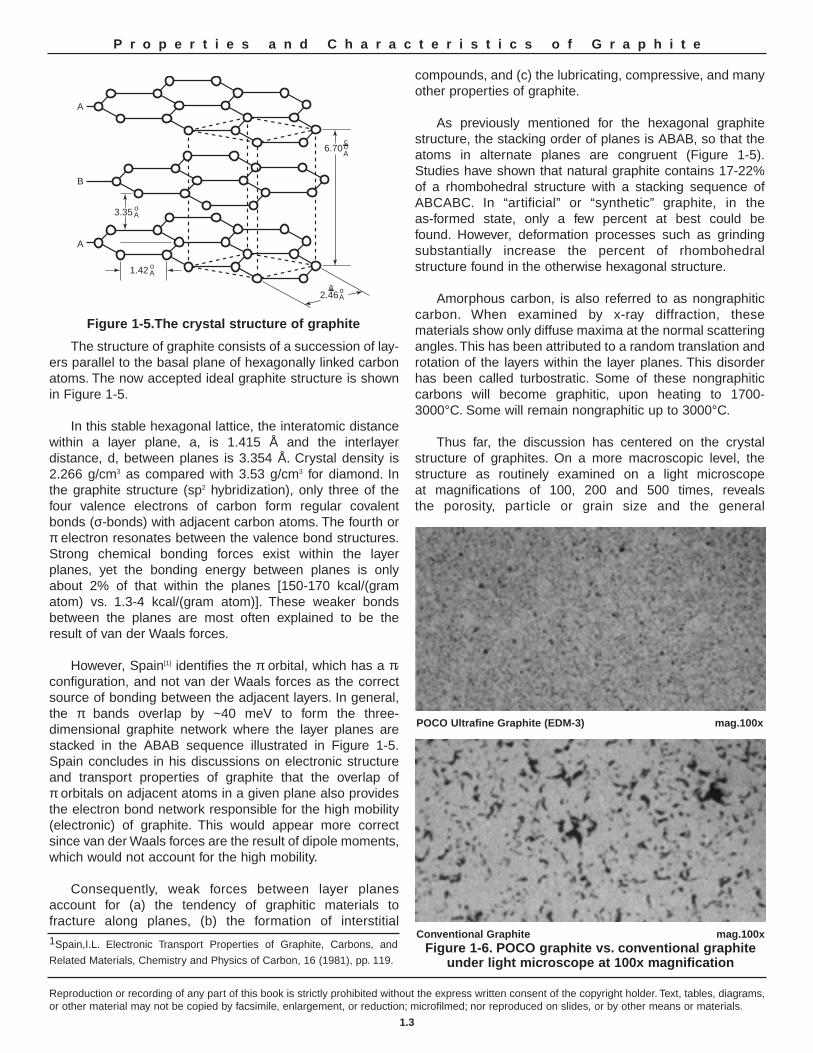
The forces within and between crystallites determine theextreme difference in properties between these two forms.In diamond, the crystal structure is face-centered cubic(Figure 1-3). The interatomic distance is 1.54 Å with each
atom covalently bonded to four other carbons in the form ofa tetrahedron. This interatomic distance is close to thatfound in aliphatic hydrocarbons which is in distinction to thesmaller 1.42 Å carbon-carbon distance found in graphiteand aromatic hydrocarbons (1.39 Å in benzene). This three-dimensional isotropic structure accounts for the extreme
hardness of diamond. Thermodynamically, graphite atatmospheric pressure is the more stable form of carbon.Diamond is transformed to graphite above 1500°C (Figure 1-4).
Carbon fibers (PAN)
Carbon fibers (pitch-based)
Carbon fibers (microporous)
Carbon/resin composites
Carbon/carbon composites
Activated carbons
Carbon blacks
Coal coking (coal-tar pitch)
Lamp Black (writing)
Charcoals (gunpowder, medicine, deodorants)
Natural graphite (writing material)
Delayed coking
Synthetic graphite and diamond
Speciality activated carbons
Carbon as a catayst support
Carbon whiskers/filaments
Prosthetics
Intercalation compounds
Graphite/oxide refractories
Pyrolytic carbon
Glassy carbon
Mesocarbon microbeads
Diamond films
Diamond-like films
Elastic carbon
Fullerenes
Nanotubes
Nanorods
1940-1997
1880-1940
Pre-1880
3.58 oA
109o
1.54 oA
Liquid
Gr.
0 1000 2000 3000 4000 5000
700
600
500
400
300
200
100
0
SolidIII
Diamond
Diamond andmetastable
graphite
Graphite andmetastable diamond
T,°k
Pre
ssur
e, k
iloat
mos
pher
es
Figure 1-3. The crystal structure of diamond
Figure 1-4. The carbon phase diagram
Figure 1-2. A diagram indicating the growth of carbonand graphite materials
Reproduction or recording of any part of this book is strictly prohibited without the express written consent of the copyright holder. Text, tables, diagrams,or other material may not be copied by facsimile, enlargement, or reduction; microfilmed; nor reproduced on slides, or by other means or materials.
1.3
P r o p e r t i e s a n d C h a r a c t e r i s t i c s o f G r a p h i t e
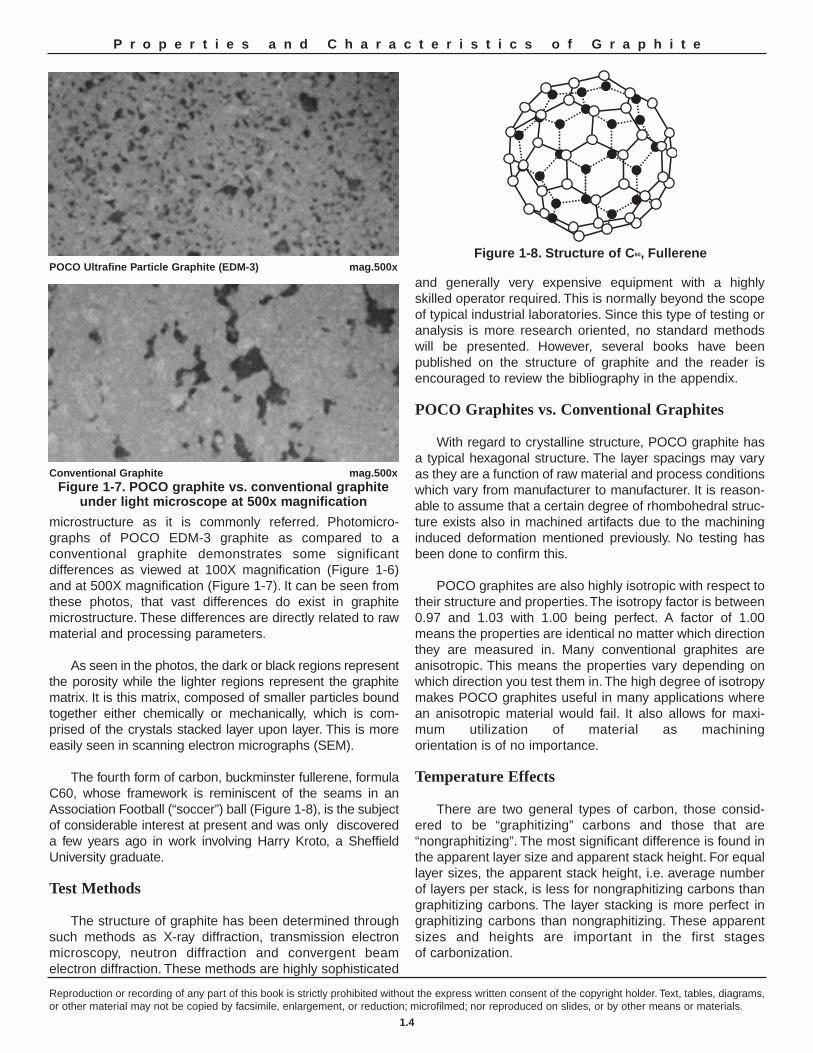
The structure of graphite consists of a succession of lay-ers parallel to the basal plane of hexagonally linked carbonatoms. The now accepted ideal graphite structure is shownin Figure 1-5.
In this stable hexagonal lattice, the interatomic distancewithin a layer plane, a, is 1.415 Å and the interlayerdistance, d, between planes is 3.354 Å. Crystal density is2.266 g/cm3 as compared with 3.53 g/cm3 for diamond. Inthe graphite structure (sp2 hybridization), only three of thefour valence electrons of carbon form regular covalentbonds (σ-bonds) with adjacent carbon atoms. The fourth orπ electron resonates between the valence bond structures.Strong chemical bonding forces exist within the layerplanes, yet the bonding energy between planes is onlyabout 2% of that within the planes [150-170 kcal/(gramatom) vs. 1.3-4 kcal/(gram atom)]. These weaker bondsbetween the planes are most often explained to be theresult of van der Waals forces.
However, Spain[1] identifies the π orbital, which has a πz
configuration, and not van der Waals forces as the correctsource of bonding between the adjacent layers. In general,the π bands overlap by ~40 meV to form the three-dimensional graphite network where the layer planes arestacked in the ABAB sequence illustrated in Figure 1-5.Spain concludes in his discussions on electronic structureand transport properties of graphite that the overlap of π orbitals on adjacent atoms in a given plane also providesthe electron bond network responsible for the high mobility(electronic) of graphite. This would appear more correctsince van der Waals forces are the result of dipole moments,which would not account for the high mobility.
Consequently, weak forces between layer planesaccount for (a) the tendency of graphitic materials to fracture along planes, (b) the formation of interstitial
compounds, and (c) the lubricating, compressive, and manyother properties of graphite.
As previously mentioned for the hexagonal graphite structure, the stacking order of planes is ABAB, so that theatoms in alternate planes are congruent (Figure 1-5).Studies have shown that natural graphite contains 17-22%of a rhombohedral structure with a stacking sequence ofABCABC. In “artificial” or “synthetic” graphite, in the as-formed state, only a few percent at best could be found. However, deformation processes such as grindingsubstantially increase the percent of rhombohedral structure found in the otherwise hexagonal structure.
Amorphous carbon, is also referred to as nongraphitic carbon. When examined by x-ray diffraction, these materials show only diffuse maxima at the normal scatteringangles. This has been attributed to a random translation androtation of the layers within the layer planes. This disorderhas been called turbostratic. Some of these nongraphiticcarbons will become graphitic, upon heating to 1700-3000°C. Some will remain nongraphitic up to 3000°C.
Thus far, the discussion has centered on the crystal structure of graphites. On a more macroscopic level, thestructure as routinely examined on a light microscope at magnifications of 100, 200 and 500 times, reveals the porosity, particle or grain size and the general
A
B
A
1.42 oA
3.35 oA
6.70coA
2.46oA
Graphite Crystal Structure
a
1Spain,I.L. Electronic Transport Properties of Graphite, Carbons, and
Related Materials, Chemistry and Physics of Carbon, 16 (1981), pp. 119.
Figure 1-5.The crystal structure of graphite
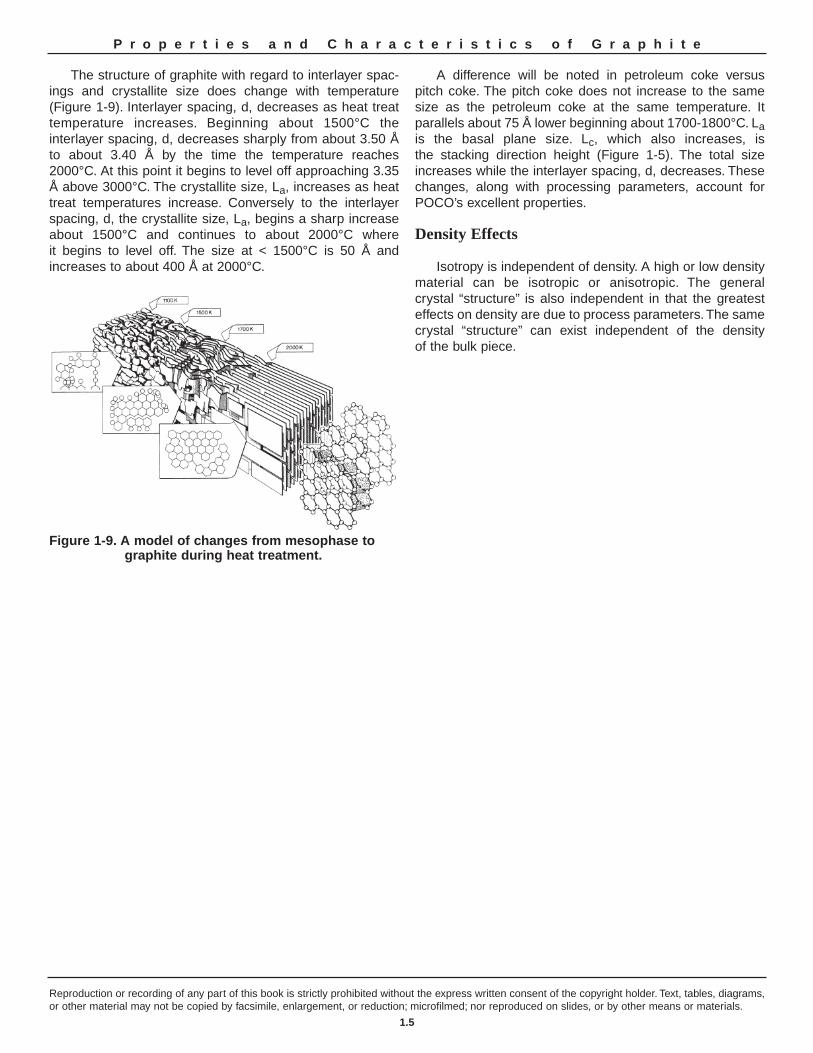
POCO Ultrafine Graphite (EDM-3) mag.100x
Conventional Graphite mag.100xFigure 1-6. POCO graphite vs. conventional graphite
under light microscope at 100x magnification
Reproduction or recording of any part of this book is strictly prohibited without the express written consent of the copyright holder. Text, tables, diagrams,or other material may not be copied by facsimile, enlargement, or reduction; microfilmed; nor reproduced on slides, or by other means or materials.
1.4
P r o p e r t i e s a n d C h a r a c t e r i s t i c s o f G r a p h i t e
microstructure as it is commonly referred. Photomicro-graphs of POCO EDM-3 graphite as compared to a conventional graphite demonstrates some significant differences as viewed at 100X magnification (Figure 1-6)and at 500X magnification (Figure 1-7). It can be seen fromthese photos, that vast differences do exist in graphitemicrostructure. These differences are directly related to rawmaterial and processing parameters.
As seen in the photos, the dark or black regions representthe porosity while the lighter regions represent the graphitematrix. It is this matrix, composed of smaller particles boundtogether either chemically or mechanically, which is com-prised of the crystals stacked layer upon layer. This is moreeasily seen in scanning electron micrographs (SEM).
The fourth form of carbon, buckminster fullerene, formulaC60, whose framework is reminiscent of the seams in anAssociation Football (“soccer”) ball (Figure 1-8), is the subjectof considerable interest at present and was only discovereda few years ago in work involving Harry Kroto, a SheffieldUniversity graduate.
Test Methods
The structure of graphite has been determined throughsuch methods as X-ray diffraction, transmission electronmicroscopy, neutron diffraction and convergent beam electron diffraction. These methods are highly sophisticated
and generally very expensive equipment with a highlyskilled operator required. This is normally beyond the scopeof typical industrial laboratories. Since this type of testing oranalysis is more research oriented, no standard methodswill be presented. However, several books have been published on the structure of graphite and the reader isencouraged to review the bibliography in the appendix.
POCO Graphites vs. Conventional Graphites
With regard to crystalline structure, POCO graphite hasa typical hexagonal structure. The layer spacings may varyas they are a function of raw material and process conditionswhich vary from manufacturer to manufacturer. It is reason-able to assume that a certain degree of rhombohedral struc-ture exists also in machined artifacts due to the machininginduced deformation mentioned previously. No testing hasbeen done to confirm this.
POCO graphites are also highly isotropic with respect totheir structure and properties. The isotropy factor is between0.97 and 1.03 with 1.00 being perfect. A factor of 1.00means the properties are identical no matter which directionthey are measured in. Many conventional graphites areanisotropic. This means the properties vary depending onwhich direction you test them in. The high degree of isotropymakes POCO graphites useful in many applications wherean anisotropic material would fail. It also allows for maxi-mum utilization of material as machining orientation is of no importance.
Temperature Effects
There are two general types of carbon, those consid-ered to be “graphitizing” carbons and those that are “nongraphitizing”. The most significant difference is found inthe apparent layer size and apparent stack height. For equallayer sizes, the apparent stack height, i.e. average numberof layers per stack, is less for nongraphitizing carbons thangraphitizing carbons. The layer stacking is more perfect ingraphitizing carbons than nongraphitizing. These apparentsizes and heights are important in the first stages of carbonization.
Figure 1-8. Structure of C60, FullerenePOCO Ultrafine Particle Graphite (EDM-3) mag.500x
Conventional Graphite mag.500xFigure 1-7. POCO graphite vs. conventional graphite
under light microscope at 500x magnification
Reproduction or recording of any part of this book is strictly prohibited without the express written consent of the copyright holder. Text, tables, diagrams,or other material may not be copied by facsimile, enlargement, or reduction; microfilmed; nor reproduced on slides, or by other means or materials.
1.5
P r o p e r t i e s a n d C h a r a c t e r i s t i c s o f G r a p h i t e
The structure of graphite with regard to interlayer spac-ings and crystallite size does change with temperature (Figure 1-9). Interlayer spacing, d, decreases as heat treattemperature increases. Beginning about 1500°C the interlayer spacing, d, decreases sharply from about 3.50 Åto about 3.40 Å by the time the temperature reaches2000°C. At this point it begins to level off approaching 3.35Å above 3000°C. The crystallite size, La, increases as heattreat temperatures increase. Conversely to the interlayerspacing, d, the crystallite size, La, begins a sharp increaseabout 1500°C and continues to about 2000°C whereit begins to level off. The size at < 1500°C is 50 Å andincreases to about 400 Å at 2000°C.
A difference will be noted in petroleum coke versus pitch coke. The pitch coke does not increase to the samesize as the petroleum coke at the same temperature. It parallels about 75 Å lower beginning about 1700-1800°C. Lais the basal plane size. Lc, which also increases, is the stacking direction height (Figure 1-5). The total sizeincreases while the interlayer spacing, d, decreases. Thesechanges, along with processing parameters, account forPOCO’s excellent properties.
Density Effects
Isotropy is independent of density. A high or low densitymaterial can be isotropic or anisotropic. The general crystal “structure” is also independent in that the greatesteffects on density are due to process parameters. The samecrystal “structure” can exist independent of the density of the bulk piece.
Figure 1-9. A model of changes from mesophase tographite during heat treatment.

Definition
The apparent density of solids is the weight, in air, of aunit volume at a specified temperature. Density is ordinarilyexpressed in grams per cubic centimeter or pounds percubic foot (1 g/cm3 = 62.4 lb/ft3). To determine the density ofa specimen, one would first calculate its volume from thephysical dimensions (for a rectangular solid, the volume isequal to the product of the length, width and thickness).Next, the mass would be determined by weighing the specimen. The density is determined by dividing the massby the calculated volume.
If the specimen were completely homogeneous, with noflaws or voids, this method of determining density wouldyield the theoretical value. Graphite materials are, however, porous; hence, the term apparent density.
In general, the differences in density of POCO graphitesreflect what some of the other physical properties will be.The higher density graphite will, generally, be stronger witha higher hardness value plus improvement in many otherproperties and characteristics.
The mathematical expression for the determination of density is:
WHERE: D = Density in g/cm3
W = Weight of specimen in gramsV = Volume of specimen in cm3
Or, if the weight is expressed in pounds and the volumeis expressed in cubic feet, then the density would be in theunits of pounds per cubic foot.
Sample Calculation:
A graphite specimen has a length (l) of 1.000 inches, a
width (w) and thickness (t) of 0.500 inches, and a weight of7.500 grams. Calculate the apparent density (D).
To convert to cm3, multiply by 16.387 (1 inch = 2.54 cm, Appendix A)
V = 4.097 cm3
Test Methods
The standard method commonly used to determine the apparent density of graphite is described in the procedure ASTM - C559 and Research & Development –Analytical Services Laboratory Instruction (TDI) 4.1.1.1 (Appendix B).
For ultrafine-particle graphites, such as the POCOgrades, an alternate method of determining apparent densi-ty is the “water method”. This is a method that can be usedon objects of irregular shape where the volume would be difficult to calculate. Even though the graphite is porous, theintrusion of water into the porosity is slow and the accuracywith this method is ± 1% if the submerged weight is taken quickly.
The general steps in the “water method” are as follows:
1. Support the piece of graphite by a thin wire/thread and weigh the piece of graphite in air.
2. Submerge the piece in a container of water in such a way that the submerged weight can be determined.
Reproduction or recording of any part of this book is strictly prohibited without the express written consent of the copyright holder. Text, tables, diagrams,or other material may not be copied by facsimile, enlargement, or reduction; microfilmed; nor reproduced on slides, or by other means or materials.
2.1
P r o p e r t i e s a n d C h a r a c t e r i s t i c s o f G r a p h i t e
Chapter 2
Apparent DensitySeveral factors influence density, such as the size and atomic weight of the elements, the atomic packing in
the crystal structure, and the amount of porosity in the microstructure. Density is an important property formany applications, but in EDM applications, density value and a photomicrograph of the material should betaken into consideration when comparing materials. Graphites with very large particles and pores can havehigher density values than some of the best small particle and pore sized materials. Material grades with highdensity along with uniformly packed small particles tend to give better wear and finer finishes than materialswith high density and large, loosely packed particles.
D = WV
V= l • w • t = 1.000in • 0.5000in • 0.5000in V= 0.25in3
D= = +1.831g/cm37.500g4.097cm3
WV
3. Calculate the density by the following formula:
WHERE: D = Density in g/cm3
W1 = Weight in air (in grams)W2 = Weight in water (in grams)DL = Density of water
POCO Graphites vs. Conventional Graphites
POCO graphites are manufactured in a variety of gradescovering the density range from 1.57 g/cm3 to 1.88 g/cm3.The density is a particularly important characteristic ofgraphite because, in addition to its inherent significance, ithas a direct influence on other properties. Generally, thephysical and mechanical properties improve as the densityis increased; details will be presented in later chapters.Commercial, polycrystalline graphites seldom exceed 80
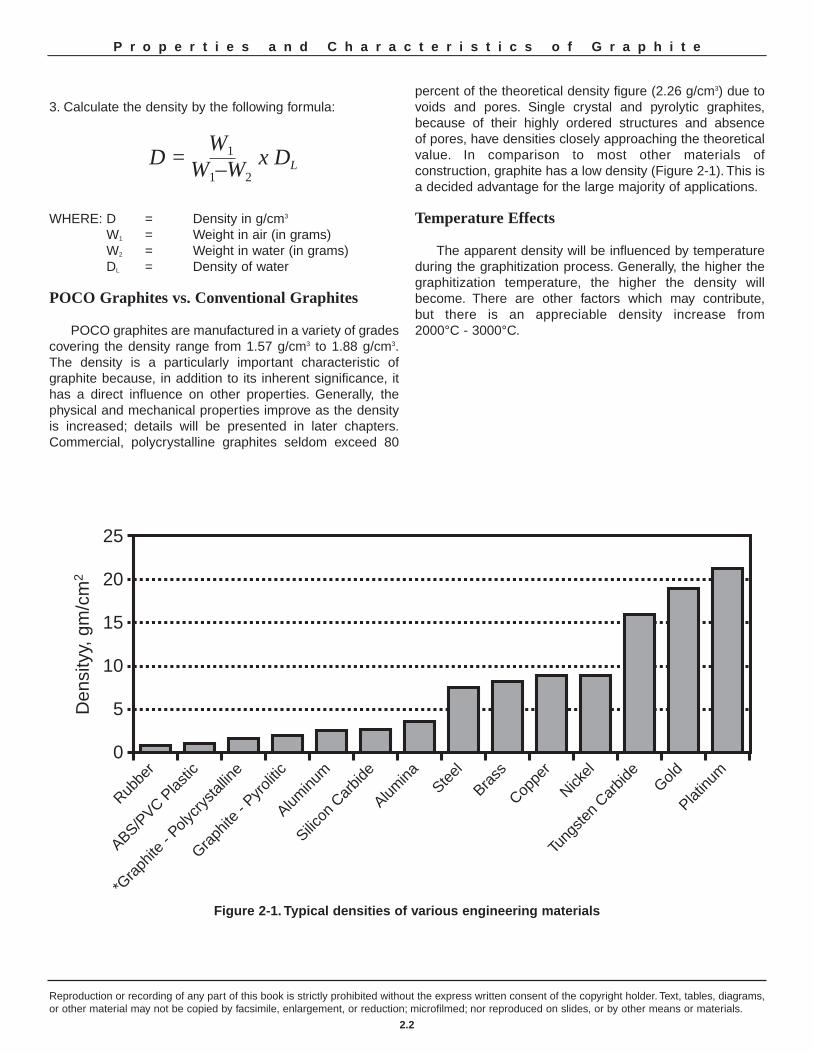
percent of the theoretical density figure (2.26 g/cm3) due tovoids and pores. Single crystal and pyrolytic graphites,because of their highly ordered structures and absence of pores, have densities closely approaching the theoreticalvalue. In comparison to most other materials of construction, graphite has a low density (Figure 2-1). This isa decided advantage for the large majority of applications.
Temperature Effects
The apparent density will be influenced by temperatureduring the graphitization process. Generally, the higher thegraphitization temperature, the higher the density willbecome. There are other factors which may contribute, but there is an appreciable density increase from 2000°C - 3000°C.
Reproduction or recording of any part of this book is strictly prohibited without the express written consent of the copyright holder. Text, tables, diagrams,or other material may not be copied by facsimile, enlargement, or reduction; microfilmed; nor reproduced on slides, or by other means or materials.
2.2
P r o p e r t i e s a n d C h a r a c t e r i s t i c s o f G r a p h i t e
0
5
10
15
20
25
Den
sity
y, g
m/c
m2
Rubbe
r
ABS/PVC P
lastic
*Gra
phite
- Poly
crys
tallin
e
Graph
ite -
Pyroli
tic
Aluminu
m
Silicon
Car
bide
Alumina
Steel
Brass
Coppe
r
Nickel
Tung
sten
Carbid
eGold
Platinu
m
Figure 2-1. Typical densities of various engineering materials
D = x DL
W1
W1–W2
Definition
The standard definition for porosity, as found in ASTMC709 which has definitions of terms relating to manufac-tured carbon and graphite, is “the percentage of the totalvolume of a material occupied by both open and closedpores”. When one calculates the apparent density of amaterial, the pore volume is included in the calculation. Thisresults in typical maximum densities for nonimpregnatedmanufactured graphites of 1.90 g/cm3. The theoretical den-sity of graphite is 2.26 g/cm3. This means that at the verybest case, about 16% of the volume of a bulk piece ofgraphite is open or closed pores. This porosity plays animportant role in many ways as will be discussed later.
The characteristics of the porosity of POCO fine-grainedgraphites have been studied extensively1.
Test Methods
There is no recognized ASTM standard for measuring the porosity of manufactured graphites at this time. A number of techniques may be employed for the purpose andare widely in use today. It is important to state the methodby which porosity data is determined because each methodimparts its own bias.
One of the more widely used methods is mercury porosimetry. Two other methods in use are gas absorptionby the BET technique and direct image analysis of themicrostructure. The latter is gaining increased acceptanceas a means of measuring more accurately the real porestructure. The advent of computer and video equipmenthave pushed this technique to the forefront of the porosimetry field. There are nonetheless, limitations to thismethod also.
The mercury porosimetry technique is the method usedfor the data reported in POCO graphite literature. It involvesbasically pushing, under increasing pressure, mercury intothe pores and as a function of pressure and volume filled,the pore size and pore volume can be determined. Thereare certain disadvantages of this method, such as:
(1) The pores are not usually circular in cross section andso the results can only be comparative.
(2) The presence of “ink-bottle” pores or some other shapewith constricted “necks” opening into large void volumes. The pore radius calculated by the Washburn equation is not truly indicative of the true pore radius and capillaries are classified at too small a radius.
(3) The effect of compressibility of mercury with increasingpressure. This should be corrected for by carrying out ablank run.
(4) The compressibility of the material under test: This is a problem of particular importance for materials which have pores that are not connected to the surface, e.g. cork. Additionally, pore walls may break under the pressures used if the material under test is relatively weak. This could cause a bias in the data.
(5) The assumption of a constant value for the surface tension of mercury.
(6) The assumption of a constant value for the angle of contact of mercury.
POCO has carried out extensive analysis via mercuryporosimetry to determine fundamental porosity parameterssuch as pore size and distribution, pore volume and surfacearea, reference Exhibit 3-1.
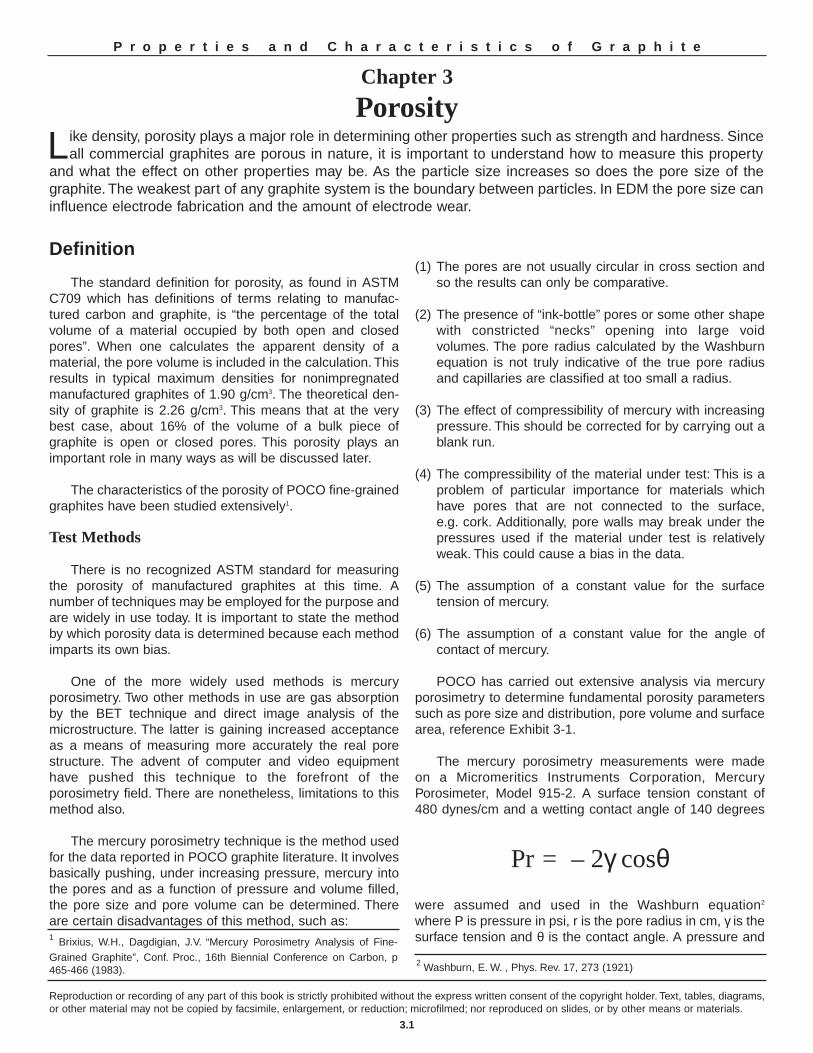
The mercury porosimetry measurements were made on a Micromeritics Instruments Corporation, MercuryPorosimeter, Model 915-2. A surface tension constant of480 dynes/cm and a wetting contact angle of 140 degrees
were assumed and used in the Washburn equation2
where P is pressure in psi, r is the pore radius in cm, γ is the surface tension and θ is the contact angle. A pressure and
Reproduction or recording of any part of this book is strictly prohibited without the express written consent of the copyright holder. Text, tables, diagrams,or other material may not be copied by facsimile, enlargement, or reduction; microfilmed; nor reproduced on slides, or by other means or materials.
3.1
P r o p e r t i e s a n d C h a r a c t e r i s t i c s o f G r a p h i t e
Chapter 3
PorosityLike density, porosity plays a major role in determining other properties such as strength and hardness. Since
all commercial graphites are porous in nature, it is important to understand how to measure this propertyand what the effect on other properties may be. As the particle size increases so does the pore size of thegraphite. The weakest part of any graphite system is the boundary between particles. In EDM the pore size caninfluence electrode fabrication and the amount of electrode wear.
Pr = – 2γ cosθ
1 Brixius, W.H., Dagdigian, J.V. “Mercury Porosimetry Analysis of Fine-Grained Graphite”, Conf. Proc., 16th Biennial Conference on Carbon, p465-466 (1983).
2 Washburn, E. W. , Phys. Rev. 17, 273 (1921)
penetration volume reading were derived from the mercuryporosimetry apparatus.
Penetration volume and pressure data were used to generate a printout of pressure, volume, pore size, and per-cent porosity relationships. Graphical plots were generatedto summarize pore size distribution information; percentporosity was plotted as a function of pore diameter.
The surface area was also determined for each sampleas described in the relationship3 where S is the surface area in square meters per gram. In addition, the total closedporosity was determined from the theoretical porosity andthe observed (open) porosity. Percent open and closedporosity were expressed as a percent of total porosity volume and a percent of the theoretical porosity.
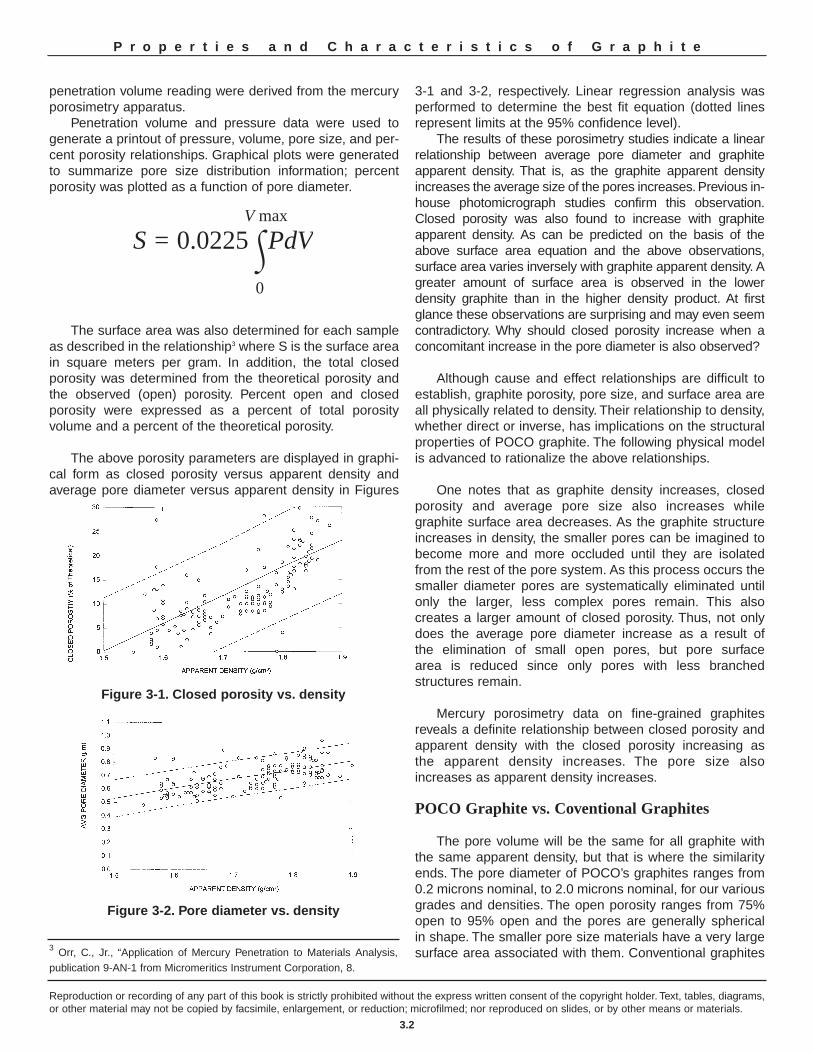
The above porosity parameters are displayed in graphi-cal form as closed porosity versus apparent density and average pore diameter versus apparent density in Figures
3-1 and 3-2, respectively. Linear regression analysis was performed to determine the best fit equation (dotted linesrepresent limits at the 95% confidence level).
The results of these porosimetry studies indicate a linearrelationship between average pore diameter and graphiteapparent density. That is, as the graphite apparent densityincreases the average size of the pores increases. Previous in-house photomicrograph studies confirm this observation.Closed porosity was also found to increase with graphiteapparent density. As can be predicted on the basis of theabove surface area equation and the above observations, surface area varies inversely with graphite apparent density. Agreater amount of surface area is observed in the lower density graphite than in the higher density product. At firstglance these observations are surprising and may even seem contradictory. Why should closed porosity increase when aconcomitant increase in the pore diameter is also observed?
Although cause and effect relationships are difficult toestablish, graphite porosity, pore size, and surface area areall physically related to density. Their relationship to density,whether direct or inverse, has implications on the structuralproperties of POCO graphite. The following physical modelis advanced to rationalize the above relationships.
One notes that as graphite density increases, closed porosity and average pore size also increases whilegraphite surface area decreases. As the graphite structureincreases in density, the smaller pores can be imagined tobecome more and more occluded until they are isolatedfrom the rest of the pore system. As this process occurs thesmaller diameter pores are systematically eliminated untilonly the larger, less complex pores remain. This also creates a larger amount of closed porosity. Thus, not onlydoes the average pore diameter increase as a result of the elimination of small open pores, but pore surface area is reduced since only pores with less branched structures remain.
Mercury porosimetry data on fine-grained graphitesreveals a definite relationship between closed porosity and apparent density with the closed porosity increasing as the apparent density increases. The pore size also increases as apparent density increases.
POCO Graphite vs. Coventional Graphites
The pore volume will be the same for all graphite withthe same apparent density, but that is where the similarityends. The pore diameter of POCO’s graphites ranges from0.2 microns nominal, to 2.0 microns nominal, for our variousgrades and densities. The open porosity ranges from 75%open to 95% open and the pores are generally spherical in shape. The smaller pore size materials have a very largesurface area associated with them. Conventional graphites
Reproduction or recording of any part of this book is strictly prohibited without the express written consent of the copyright holder. Text, tables, diagrams,or other material may not be copied by facsimile, enlargement, or reduction; microfilmed; nor reproduced on slides, or by other means or materials.
3.2
P r o p e r t i e s a n d C h a r a c t e r i s t i c s o f G r a p h i t e
3 Orr, C., Jr., “Application of Mercury Penetration to Materials Analysis,publication 9-AN-1 from Micromeritics Instrument Corporation, 8.
S = 0.0225 PdVV max
0
Figure 3-1. Closed porosity vs. density
Figure 3-2. Pore diameter vs. density
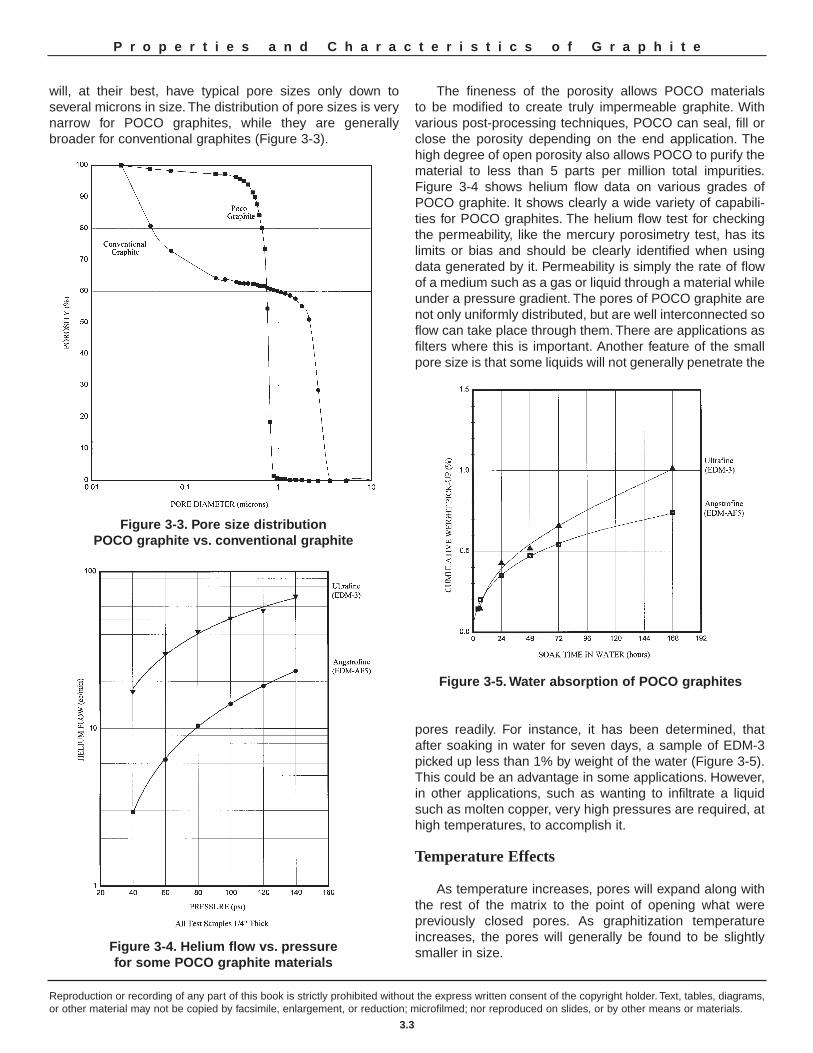
will, at their best, have typical pore sizes only down to several microns in size. The distribution of pore sizes is verynarrow for POCO graphites, while they are generally broader for conventional graphites (Figure 3-3).
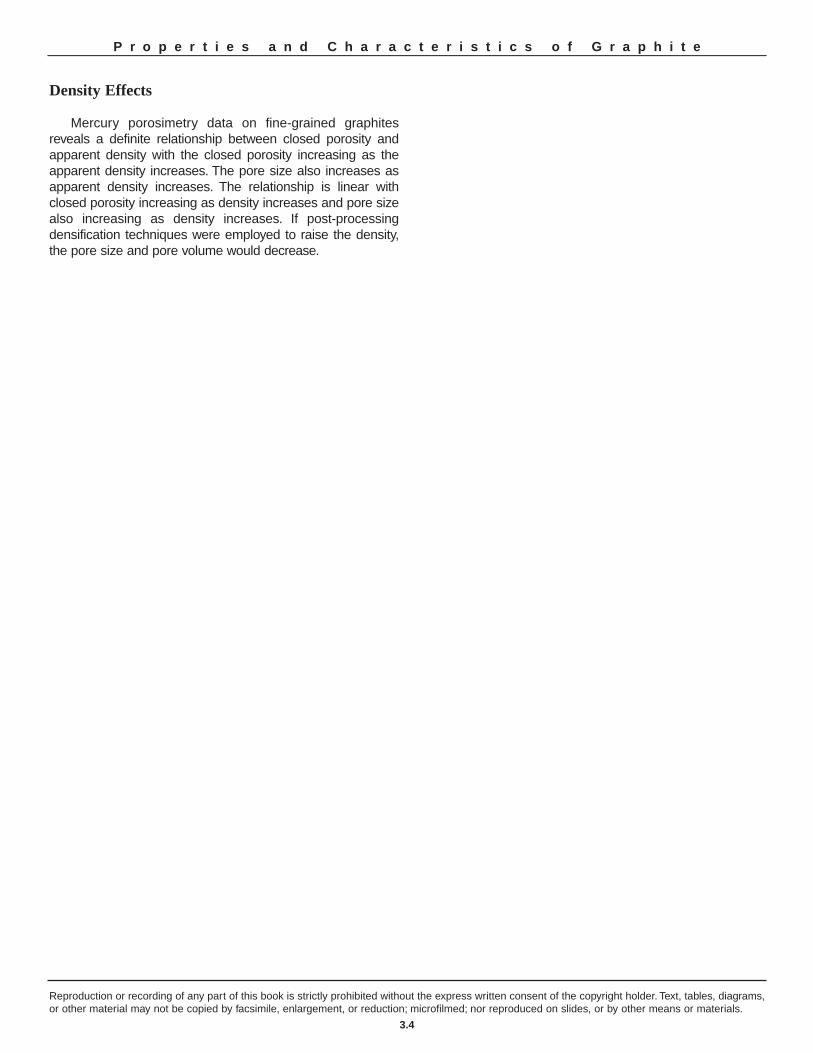
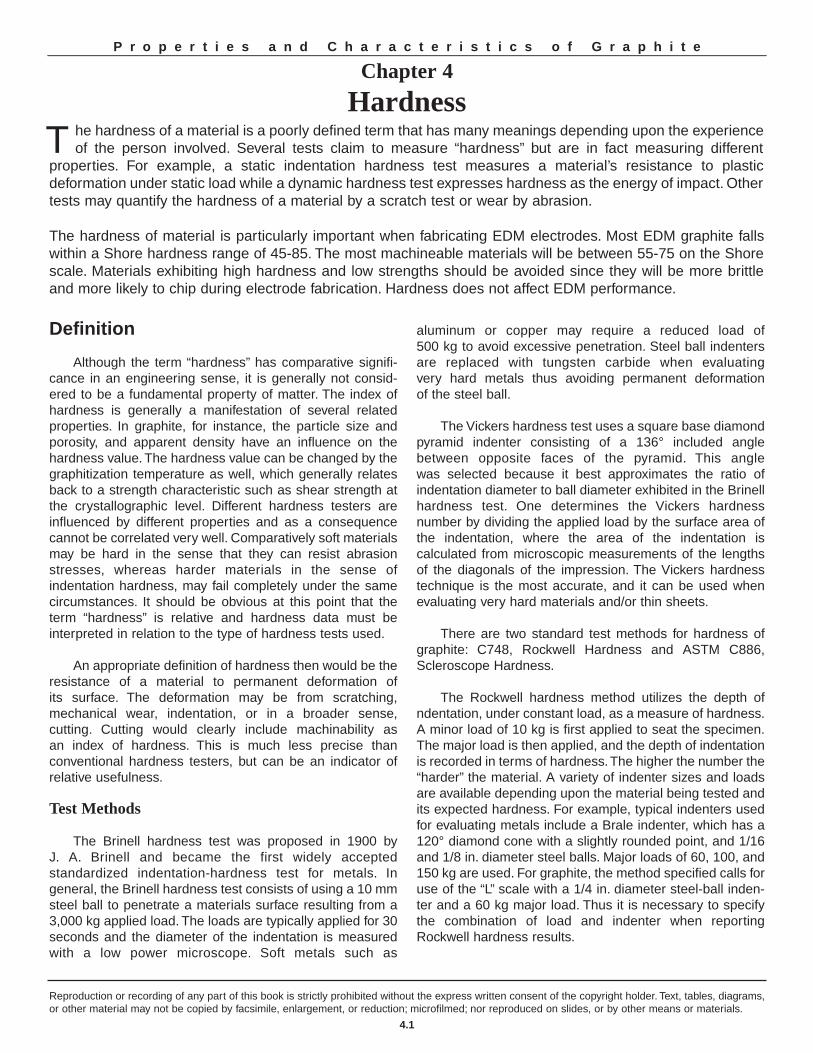
The fineness of the porosity allows POCO materials to be modified to create truly impermeable graphite. With various post-processing techniques, POCO can seal, fill orclose the porosity depending on the end application. Thehigh degree of open porosity also allows POCO to purify thematerial to less than 5 parts per million total impurities.Figure 3-4 shows helium flow data on various grades ofPOCO graphite. It shows clearly a wide variety of capabili-ties for POCO graphites. The helium flow test for checkingthe permeability, like the mercury porosimetry test, has itslimits or bias and should be clearly identified when usingdata generated by it. Permeability is simply the rate of flowof a medium such as a gas or liquid through a material whileunder a pressure gradient. The pores of POCO graphite arenot only uniformly distributed, but are well interconnected soflow can take place through them. There are applications asfilters where this is important. Another feature of the smallpore size is that some liquids will not generally penetrate the
pores readily. For instance, it has been determined, thatafter soaking in water for seven days, a sample of EDM-3picked up less than 1% by weight of the water (Figure 3-5).This could be an advantage in some applications. However,in other applications, such as wanting to infiltrate a liquidsuch as molten copper, very high pressures are required, athigh temperatures, to accomplish it.
Temperature Effects
As temperature increases, pores will expand along withthe rest of the matrix to the point of opening what were previously closed pores. As graphitization temperatureincreases, the pores will generally be found to be slightlysmaller in size.
Reproduction or recording of any part of this book is strictly prohibited without the express written consent of the copyright holder. Text, tables, diagrams,or other material may not be copied by facsimile, enlargement, or reduction; microfilmed; nor reproduced on slides, or by other means or materials.
3.3
P r o p e r t i e s a n d C h a r a c t e r i s t i c s o f G r a p h i t e
Figure 3-3. Pore size distributionPOCO graphite vs. conventional graphite
Figure 3-4. Helium flow vs. pressurefor some POCO graphite materials
Figure 3-5. Water absorption of POCO graphites
Density Effects
Mercury porosimetry data on fine-grained graphitesreveals a definite relationship between closed porosity andapparent density with the closed porosity increasing as theapparent density increases. The pore size also increases asapparent density increases. The relationship is linear withclosed porosity increasing as density increases and pore size also increasing as density increases. If post-processing densification techniques were employed to raise the density,the pore size and pore volume would decrease.
Reproduction or recording of any part of this book is strictly prohibited without the express written consent of the copyright holder. Text, tables, diagrams,or other material may not be copied by facsimile, enlargement, or reduction; microfilmed; nor reproduced on slides, or by other means or materials.
3.4
P r o p e r t i e s a n d C h a r a c t e r i s t i c s o f G r a p h i t e
Definition
Although the term “hardness” has comparative signifi-cance in an engineering sense, it is generally not consid-ered to be a fundamental property of matter. The index ofhardness is generally a manifestation of several relatedproperties. In graphite, for instance, the particle size andporosity, and apparent density have an influence on thehardness value. The hardness value can be changed by thegraphitization temperature as well, which generally relatesback to a strength characteristic such as shear strength atthe crystallographic level. Different hardness testers are influenced by different properties and as a consequencecannot be correlated very well. Comparatively soft materialsmay be hard in the sense that they can resist abrasionstresses, whereas harder materials in the sense of indentation hardness, may fail completely under the samecircumstances. It should be obvious at this point that theterm “hardness” is relative and hardness data must be interpreted in relation to the type of hardness tests used.
An appropriate definition of hardness then would be theresistance of a material to permanent deformation of its surface. The deformation may be from scratching, mechanical wear, indentation, or in a broader sense, cutting. Cutting would clearly include machinability as an index of hardness. This is much less precise than conventional hardness testers, but can be an indicator ofrelative usefulness.
Test Methods
The Brinell hardness test was proposed in 1900 by J. A. Brinell and became the first widely accepted standardized indentation-hardness test for metals. In general, the Brinell hardness test consists of using a 10 mmsteel ball to penetrate a materials surface resulting from a3,000 kg applied load. The loads are typically applied for 30seconds and the diameter of the indentation is measuredwith a low power microscope. Soft metals such as
aluminum or copper may require a reduced load of 500 kg to avoid excessive penetration. Steel ball indentersare replaced with tungsten carbide when evaluating very hard metals thus avoiding permanent deformation of the steel ball.
The Vickers hardness test uses a square base diamondpyramid indenter consisting of a 136° included anglebetween opposite faces of the pyramid. This angle was selected because it best approximates the ratio ofindentation diameter to ball diameter exhibited in the Brinellhardness test. One determines the Vickers hardness number by dividing the applied load by the surface area ofthe indentation, where the area of the indentation is calculated from microscopic measurements of the lengthsof the diagonals of the impression. The Vickers hardnesstechnique is the most accurate, and it can be used whenevaluating very hard materials and/or thin sheets.
There are two standard test methods for hardness ofgraphite: C748, Rockwell Hardness and ASTM C886,Scleroscope Hardness.
The Rockwell hardness method utilizes the depth of ndentation, under constant load, as a measure of hardness.A minor load of 10 kg is first applied to seat the specimen.The major load is then applied, and the depth of indentationis recorded in terms of hardness.The higher the number the“harder” the material. A variety of indenter sizes and loadsare available depending upon the material being tested andits expected hardness. For example, typical indenters usedfor evaluating metals include a Brale indenter, which has a120° diamond cone with a slightly rounded point, and 1/16and 1/8 in. diameter steel balls. Major loads of 60, 100, and150 kg are used. For graphite, the method specified calls foruse of the “L” scale with a 1/4 in. diameter steel-ball inden-ter and a 60 kg major load. Thus it is necessary to specifythe combination of load and indenter when reportingRockwell hardness results.
Reproduction or recording of any part of this book is strictly prohibited without the express written consent of the copyright holder. Text, tables, diagrams,or other material may not be copied by facsimile, enlargement, or reduction; microfilmed; nor reproduced on slides, or by other means or materials.
4.1
Chapter 4
HardnessT he hardness of a material is a poorly defined term that has many meanings depending upon the experience
of the person involved. Several tests claim to measure “hardness” but are in fact measuring different properties. For example, a static indentation hardness test measures a material’s resistance to plastic deformation under static load while a dynamic hardness test expresses hardness as the energy of impact. Othertests may quantify the hardness of a material by a scratch test or wear by abrasion.
The hardness of material is particularly important when fabricating EDM electrodes. Most EDM graphite fallswithin a Shore hardness range of 45-85. The most machineable materials will be between 55-75 on the Shorescale. Materials exhibiting high hardness and low strengths should be avoided since they will be more brittleand more likely to chip during electrode fabrication. Hardness does not affect EDM performance.
P r o p e r t i e s a n d C h a r a c t e r i s t i c s o f G r a p h i t e
Rockwell hardness works well for conventionalgraphites, but the ultrafine particle POCO graphites areusually off scale on the high side when tested with thismethod. Another scale and/or a smaller indenter would bemore appropriate, but a standard method has not beendeveloped for use. However, a number of our customersspecify use of the Rockwell 15T scale for hardness data,which utilizes a 1/16 in. diameter steel-ball indenter and a15 kg major load.There are a number of factors which affectthe accuracy of this method regardless of the scale used.They are listed in TDI 4.1.1.4, Section 5.3.
POCO typically uses the Shore sceleroscope hardness(SSH) test, which measures hardness in terms of the elasticity of the material. This is a dynamic hardness measurement technique in which the indenter falls througha glass tube from a known height and impacts the specimen. The degree of hardness is directly related to theheight of rebound of the indenter as determined by readinga unitless scale. The higher the rebound, the “harder” thematerial. There are many factors that affect the reproducibility and accuracy of the data, reference ASTMStandard C886-88. Studies at POCO indicate that samplesize, i.e. mass, has a significant bearing on the results aswell.The results of a large billet will generally be higher thanfor a small test sample.
Poco Graphite vs. Conventional Graphites
Since hardness is influenced by a number of other fac-tors, the comparison of POCO to conventional graphites is relative at best. If all factors were held constant, includinggraphitization temperature and no artificial densification,etc., based strictly on particle size alone, POCO would havea higher hardness number.
Temperature Effects
Generally speaking, higher graphitization temperatures,i.e. up to ~3400° C, soften the material, which results inlower room temperature (RT) hardness values. In mostcases, the RT hardness will not change if the graphite issubjected to high temperature applications. For example,repeated heating and cooling of graphite does not changethe RT hardness value unless the material is subjected to a temperature higher than its graphitization temperature. Inthis event the material will be softer.
Density Effects
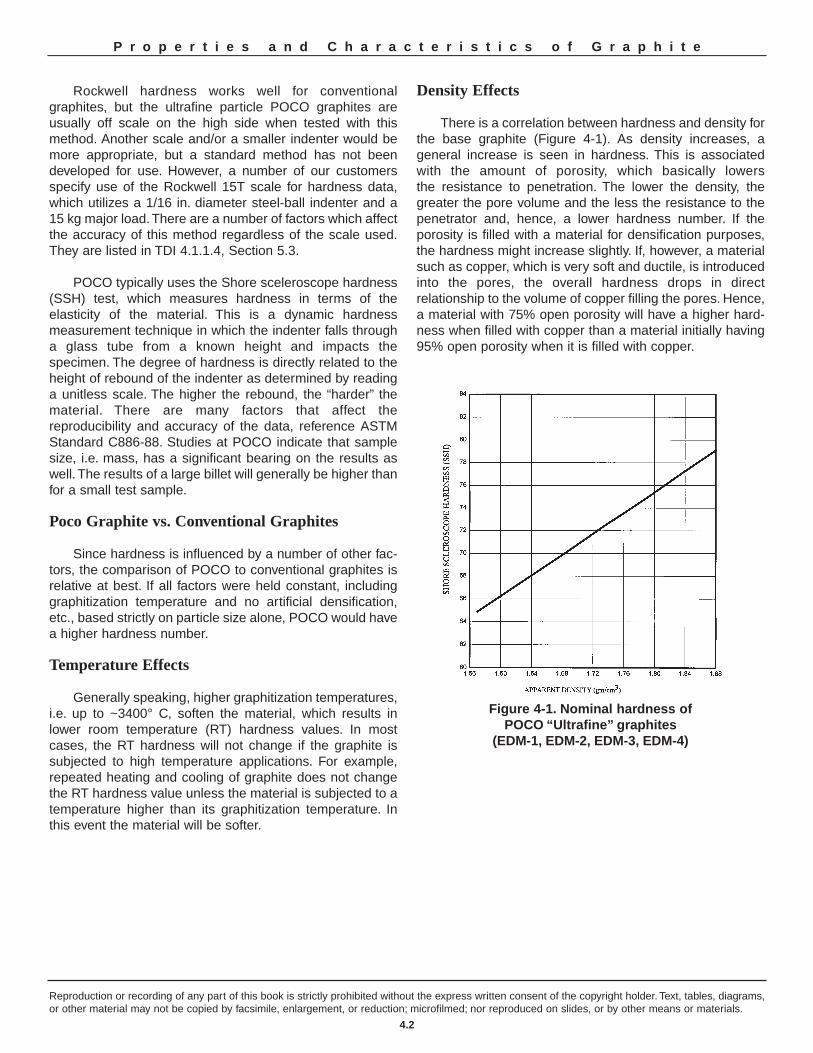
There is a correlation between hardness and density forthe base graphite (Figure 4-1). As density increases, a general increase is seen in hardness. This is associatedwith the amount of porosity, which basically lowers the resistance to penetration. The lower the density, thegreater the pore volume and the less the resistance to thepenetrator and, hence, a lower hardness number. If theporosity is filled with a material for densification purposes,the hardness might increase slightly. If, however, a materialsuch as copper, which is very soft and ductile, is introducedinto the pores, the overall hardness drops in direct relationship to the volume of copper filling the pores. Hence,a material with 75% open porosity will have a higher hard-ness when filled with copper than a material initially having95% open porosity when it is filled with copper.
Reproduction or recording of any part of this book is strictly prohibited without the express written consent of the copyright holder. Text, tables, diagrams,or other material may not be copied by facsimile, enlargement, or reduction; microfilmed; nor reproduced on slides, or by other means or materials.
4.2
P r o p e r t i e s a n d C h a r a c t e r i s t i c s o f G r a p h i t e
Figure 4-1. Nominal hardness of POCO “Ultrafine” graphites
(EDM-1, EDM-2, EDM-3, EDM-4)
Definition
The easiest strength characteristic of a material tounderstand and measure is the compressive strength. Ingeneral, the compressive strength test consists of deter-mining the maximum amount of compressive load a materi-al can bear before fracturing. However, not all materials willexhibit catastrophic failure in response to compressiveloads. Applying a continually increasing compressive forceto ductile materials such as gold, copper or iron ultimatelycauses slip across crystalline planes that result in reformingthe atomic or molecular bonds with other atoms.Consequently, it is quite possible to flatten a very ductilematerial, such as gold, into a very thin sheet (if high enoughcompressive load is applied). On the other hand, if the mate-rial is brittle, such as graphite or many ceramic materials, atomic or molecular bonds cannot be reformedeasily; therefore, when crystalline planes begin to slip, catastrophic failure occurs and the material fractures.
The compressive strength of a brittle material isexpressed as the maximum force per unit area that can bewithstood before failure occurs. It is usually expressed inpounds per square inch, or in kg/cm2 in metric units. Themathematical expression for the determination of compres-sive strength is:
WHERE: C.S. = Compressive strengthL = Load required to cause
catastrophic failureA = Cross sectional area of specimen
Sample calculation:
A graphite specimen with a cross-sectional area of 0.25square inches fails when a load of 3500 pounds is applied;calculate the compressive strength.To convert to kg/cm2, multiply by 0.0703.
Compressive Strength = 984 kg/cm2
If the load, L, is expressed in kilograms (kg) and the crosssectional area, A, is expressed in square centimeters (cm)2,then the compressive strength will be in the metric units ofkg/cm2.
NOTE: 1 psi = 0.0703 kg/cm2
Other units and the appropriate conversion factors are givenin Appendix A.
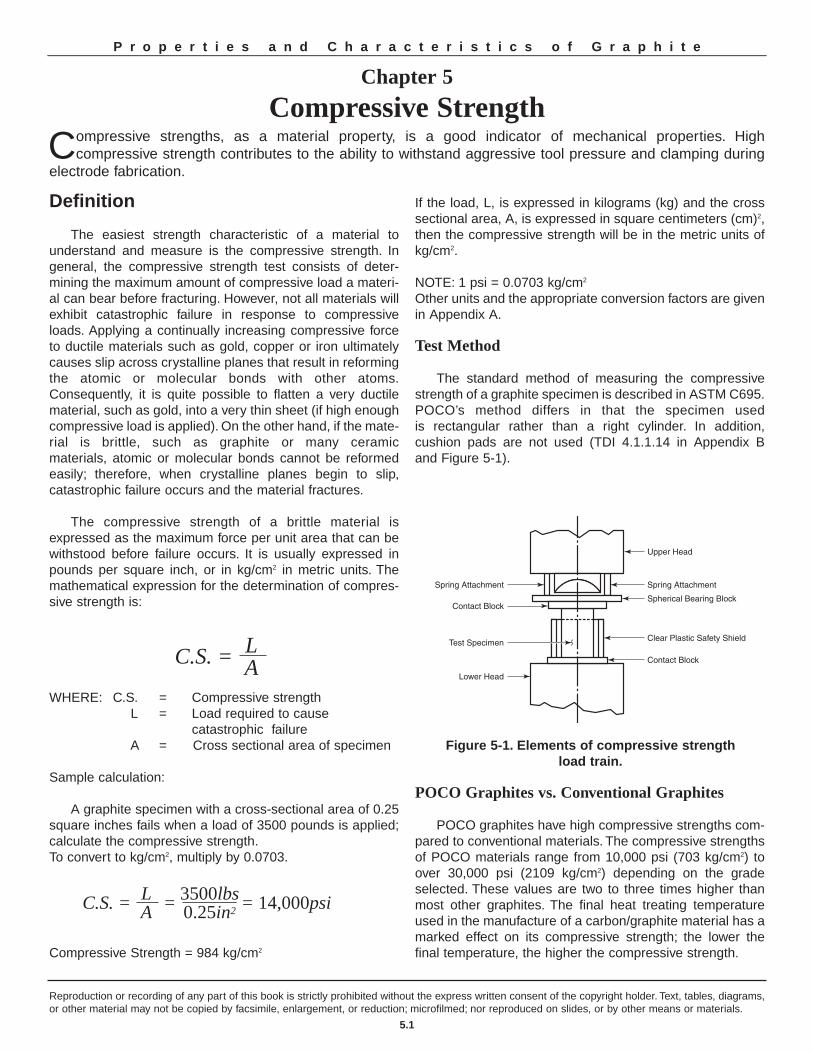
Test Method
The standard method of measuring the compressivestrength of a graphite specimen is described in ASTM C695.POCO’s method differs in that the specimen used is rectangular rather than a right cylinder. In addition, cushion pads are not used (TDI 4.1.1.14 in Appendix B and Figure 5-1).
POCO Graphites vs. Conventional Graphites
POCO graphites have high compressive strengths com-pared to conventional materials. The compressive strengthsof POCO materials range from 10,000 psi (703 kg/cm2) toover 30,000 psi (2109 kg/cm2) depending on the gradeselected. These values are two to three times higher thanmost other graphites. The final heat treating temperatureused in the manufacture of a carbon/graphite material has amarked effect on its compressive strength; the lower thefinal temperature, the higher the compressive strength.
Reproduction or recording of any part of this book is strictly prohibited without the express written consent of the copyright holder. Text, tables, diagrams,or other material may not be copied by facsimile, enlargement, or reduction; microfilmed; nor reproduced on slides, or by other means or materials.
5.1
Chapter 5
Compressive StrengthCompressive strengths, as a material property, is a good indicator of mechanical properties. High
compressive strength contributes to the ability to withstand aggressive tool pressure and clamping duringelectrode fabrication.
C.S. = LA
C.S. = = = 14,000psi LA
3500lbs0.25in2
Figure 5-1. Elements of compressive strengthload train.
P r o p e r t i e s a n d C h a r a c t e r i s t i c s o f G r a p h i t e
Reproduction or recording of any part of this book is strictly prohibited without the express written consent of the copyright holder. Text, tables, diagrams,or other material may not be copied by facsimile, enlargement, or reduction; microfilmed; nor reproduced on slides, or by other means or materials.
5.2
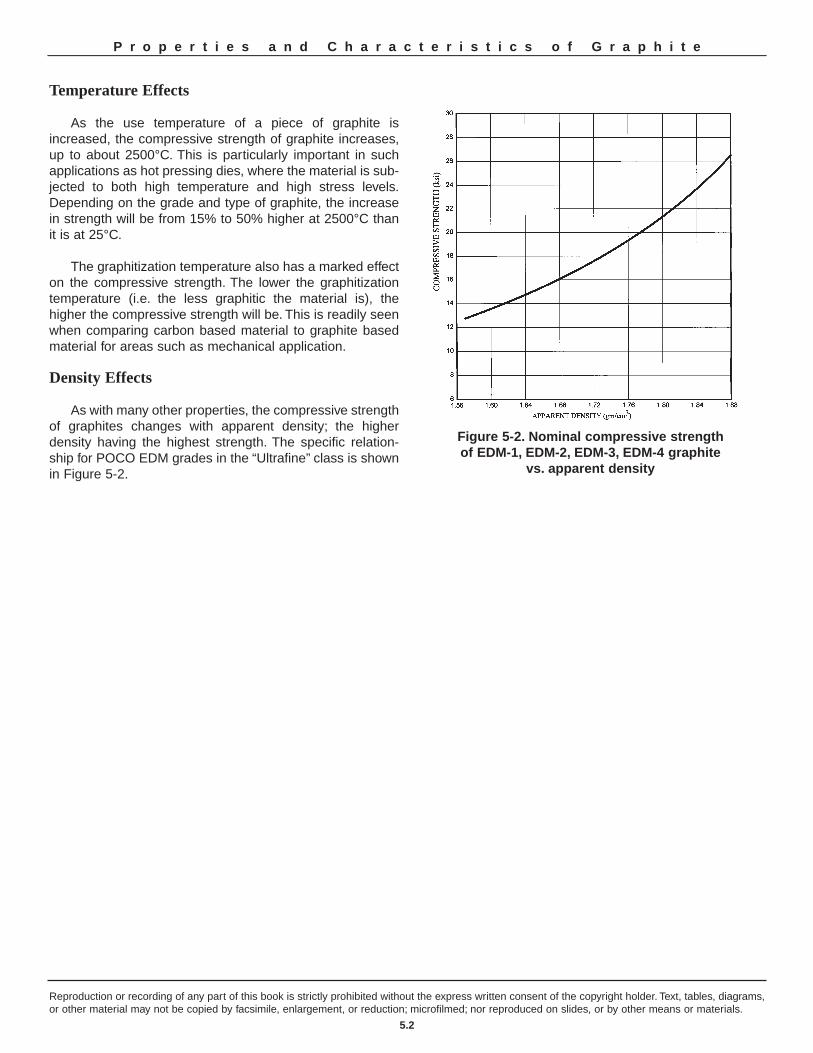
Figure 5-2. Nominal compressive strength of EDM-1, EDM-2, EDM-3, EDM-4 graphite
vs. apparent density
P r o p e r t i e s a n d C h a r a c t e r i s t i c s o f G r a p h i t e
Temperature Effects
As the use temperature of a piece of graphite isincreased, the compressive strength of graphite increases,up to about 2500°C. This is particularly important in suchapplications as hot pressing dies, where the material is sub-jected to both high temperature and high stress levels.Depending on the grade and type of graphite, the increasein strength will be from 15% to 50% higher at 2500°C thanit is at 25°C.
The graphitization temperature also has a marked effecton the compressive strength. The lower the graphitization temperature (i.e. the less graphitic the material is), the higher the compressive strength will be. This is readily seen when comparing carbon based material to graphite basedmaterial for areas such as mechanical application.
Density Effects
As with many other properties, the compressive strength of graphites changes with apparent density; the higher density having the highest strength. The specific relation-ship for POCO EDM grades in the “Ultrafine” class is shownin Figure 5-2.
Definition
Flexural strength, tensile strength and compressivestrength are the three common tests performed to measurethe strength of materials. In flexural strength testing, asteadily increasing bending movement is applied to a longbar until the material eventually ruptures. If the material isductile (like copper), it will bend prior to breaking. However,if the material is brittle (such as chalk or graphite), it willbend very little before it fails catastrophically.
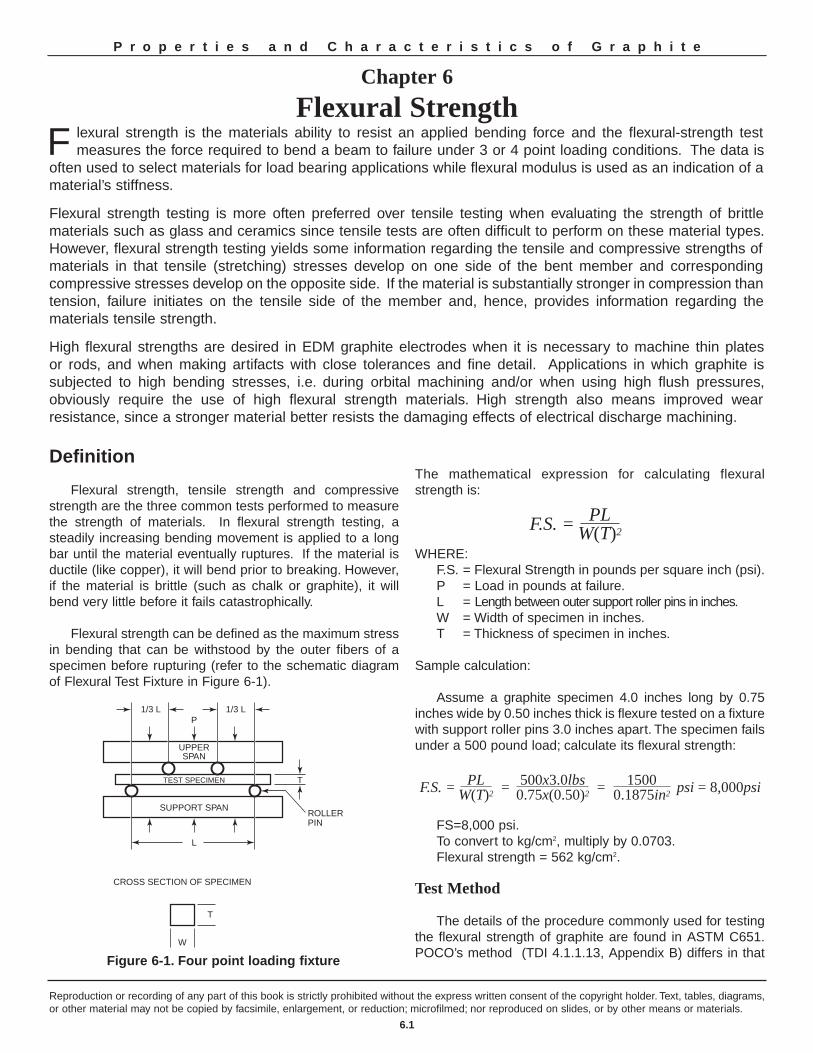
Flexural strength can be defined as the maximum stressin bending that can be withstood by the outer fibers of aspecimen before rupturing (refer to the schematic diagramof Flexural Test Fixture in Figure 6-1).
The mathematical expression for calculating flexuralstrength is:
WHERE:F.S. = Flexural Strength in pounds per square inch (psi).P = Load in pounds at failure.L = Length between outer support roller pins in inches.W = Width of specimen in inches.T = Thickness of specimen in inches.
Sample calculation:
Assume a graphite specimen 4.0 inches long by 0.75inches wide by 0.50 inches thick is flexure tested on a fixturewith support roller pins 3.0 inches apart. The specimen failsunder a 500 pound load; calculate its flexural strength:
FS=8,000 psi.To convert to kg/cm2, multiply by 0.0703.Flexural strength = 562 kg/cm2.
Test Method
The details of the procedure commonly used for testingthe flexural strength of graphite are found in ASTM C651.POCO’s method (TDI 4.1.1.13, Appendix B) differs in that
Reproduction or recording of any part of this book is strictly prohibited without the express written consent of the copyright holder. Text, tables, diagrams,or other material may not be copied by facsimile, enlargement, or reduction; microfilmed; nor reproduced on slides, or by other means or materials.
6.1
P r o p e r t i e s a n d C h a r a c t e r i s t i c s o f G r a p h i t e
Chapter 6
Flexural Strength F lexural strength is the materials ability to resist an applied bending force and the flexural-strength test
measures the force required to bend a beam to failure under 3 or 4 point loading conditions. The data isoften used to select materials for load bearing applications while flexural modulus is used as an indication of a material’s stiffness.
Flexural strength testing is more often preferred over tensile testing when evaluating the strength of brittle materials such as glass and ceramics since tensile tests are often difficult to perform on these material types.However, flexural strength testing yields some information regarding the tensile and compressive strengths ofmaterials in that tensile (stretching) stresses develop on one side of the bent member and corresponding compressive stresses develop on the opposite side. If the material is substantially stronger in compression thantension, failure initiates on the tensile side of the member and, hence, provides information regarding the materials tensile strength.
High flexural strengths are desired in EDM graphite electrodes when it is necessary to machine thin plates or rods, and when making artifacts with close tolerances and fine detail. Applications in which graphite is subjected to high bending stresses, i.e. during orbital machining and/or when using high flush pressures, obviously require the use of high flexural strength materials. High strength also means improved wear resistance, since a stronger material better resists the damaging effects of electrical discharge machining.
F.S. = PLW(T)2
15000.1875in2
500x3.0lbs0.75x(0.50)2F.S. = = = psi = 8,000psiPL
W(T)2
1/3 L1/3 L
L
P
T
ROLLERPIN
CROSS SECTION OF SPECIMEN
UPPERSPAN
SUPPORT SPAN
TEST SPECIMEN
T
W
Figure 6-1. Four point loading fixture
the specimen geometry has a 1:1 ratio in thickness andwidth rather than the 2:1 width to thickness. The fixtureused is not exactly as described either, but with a surfacefinish of less than 32 micro inches Ra on the sample, the frictional component is minimized, and results are comparable to those obtained with the fixture recommended by ASTM. Regardless of the procedure followed, steps must be taken to avoid factors that bias theresults such as improper sample alignment, rough and/ornon-parallel surfaces. It is also important to know whetherthe reported strength values were obtained from three-pointor four-point loading.
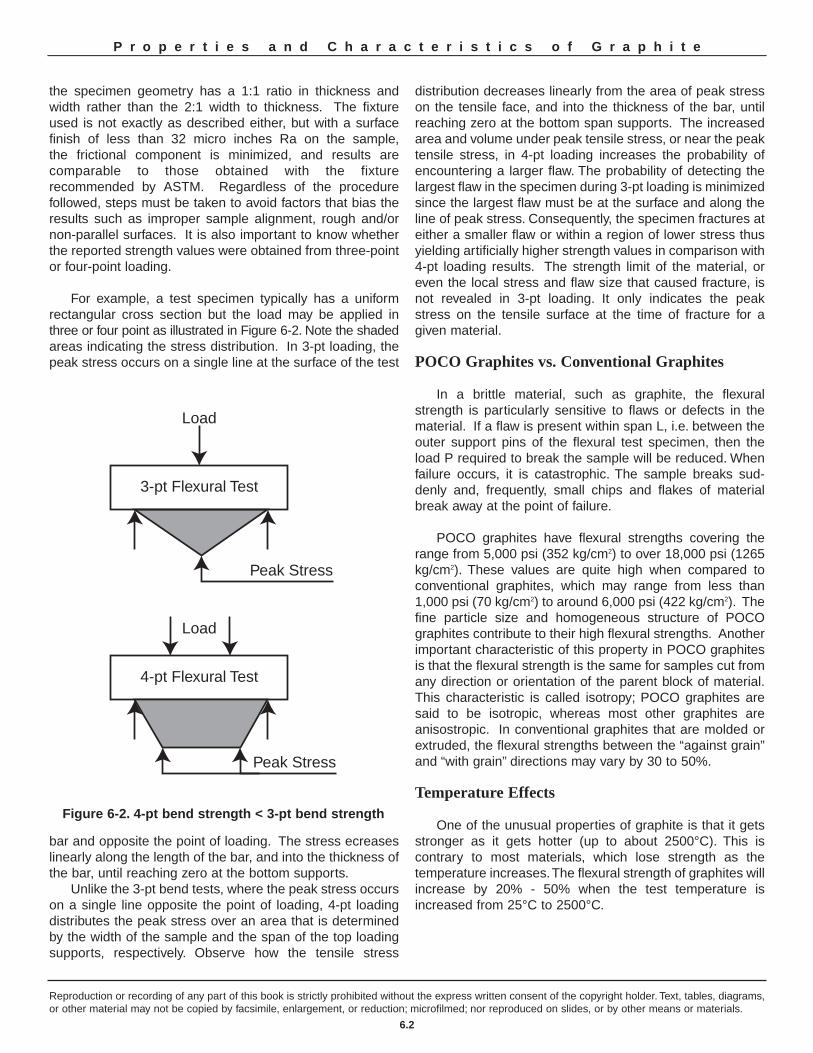
For example, a test specimen typically has a uniform rectangular cross section but the load may be applied inthree or four point as illustrated in Figure 6-2. Note the shadedareas indicating the stress distribution. In 3-pt loading, thepeak stress occurs on a single line at the surface of the test
bar and opposite the point of loading. The stress ecreaseslinearly along the length of the bar, and into the thickness ofthe bar, until reaching zero at the bottom supports.
Unlike the 3-pt bend tests, where the peak stress occurson a single line opposite the point of loading, 4-pt loading distributes the peak stress over an area that is determinedby the width of the sample and the span of the top loadingsupports, respectively. Observe how the tensile stress
distribution decreases linearly from the area of peak stresson the tensile face, and into the thickness of the bar, untilreaching zero at the bottom span supports. The increasedarea and volume under peak tensile stress, or near the peaktensile stress, in 4-pt loading increases the probability ofencountering a larger flaw. The probability of detecting thelargest flaw in the specimen during 3-pt loading is minimizedsince the largest flaw must be at the surface and along theline of peak stress. Consequently, the specimen fractures ateither a smaller flaw or within a region of lower stress thusyielding artificially higher strength values in comparison with4-pt loading results. The strength limit of the material, oreven the local stress and flaw size that caused fracture, isnot revealed in 3-pt loading. It only indicates the peak stress on the tensile surface at the time of fracture for agiven material.
POCO Graphites vs. Conventional Graphites
In a brittle material, such as graphite, the flexuralstrength is particularly sensitive to flaws or defects in thematerial. If a flaw is present within span L, i.e. between theouter support pins of the flexural test specimen, then theload P required to break the sample will be reduced. Whenfailure occurs, it is catastrophic. The sample breaks sud-denly and, frequently, small chips and flakes of materialbreak away at the point of failure.
POCO graphites have flexural strengths covering therange from 5,000 psi (352 kg/cm2) to over 18,000 psi (1265kg/cm2). These values are quite high when compared toconventional graphites, which may range from less than1,000 psi (70 kg/cm2) to around 6,000 psi (422 kg/cm2). Thefine particle size and homogeneous structure of POCOgraphites contribute to their high flexural strengths. Anotherimportant characteristic of this property in POCO graphitesis that the flexural strength is the same for samples cut fromany direction or orientation of the parent block of material.This characteristic is called isotropy; POCO graphites aresaid to be isotropic, whereas most other graphites areanisostropic. In conventional graphites that are molded orextruded, the flexural strengths between the “against grain”and “with grain” directions may vary by 30 to 50%.
Temperature Effects
One of the unusual properties of graphite is that it getsstronger as it gets hotter (up to about 2500°C). This is contrary to most materials, which lose strength as the temperature increases.The flexural strength of graphites willincrease by 20% - 50% when the test temperature isincreased from 25°C to 2500°C.
Reproduction or recording of any part of this book is strictly prohibited without the express written consent of the copyright holder. Text, tables, diagrams,or other material may not be copied by facsimile, enlargement, or reduction; microfilmed; nor reproduced on slides, or by other means or materials.
6.2
P r o p e r t i e s a n d C h a r a c t e r i s t i c s o f G r a p h i t e
Load
Peak Stress
3-pt Flexural Test
Load
Peak Stress
4-pt Flexural Test
Figure 6-2. 4-pt bend strength < 3-pt bend strength
Density Effects
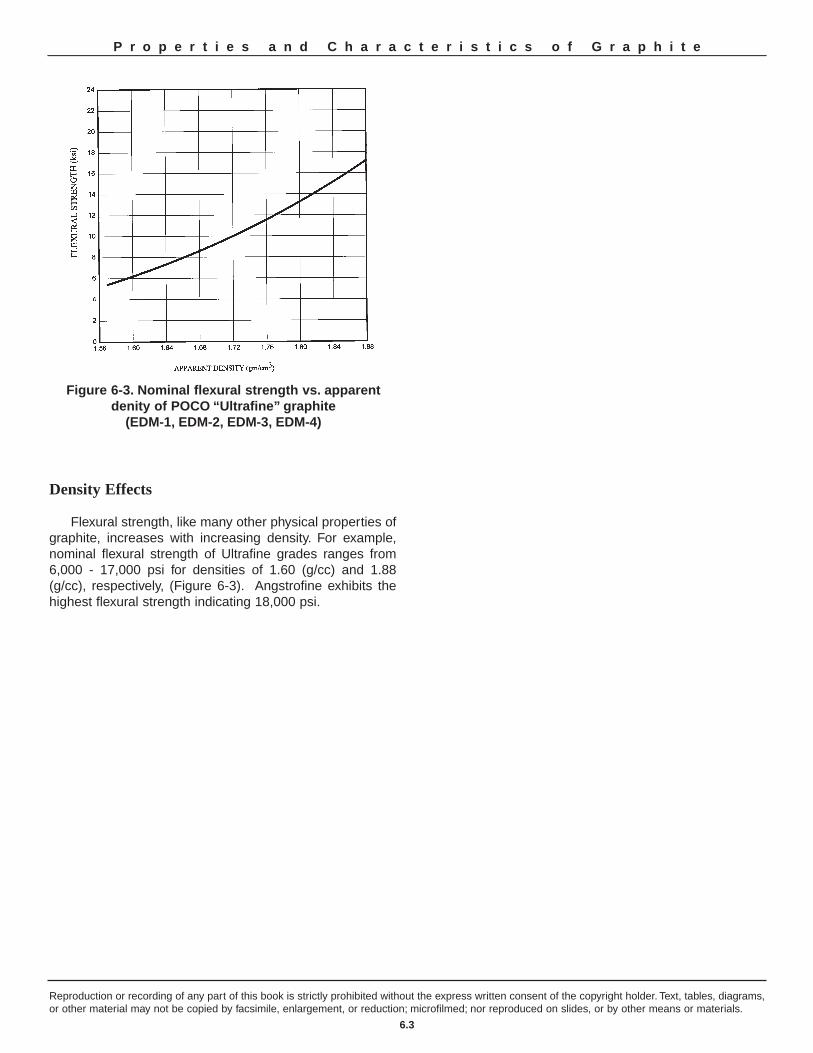
Flexural strength, like many other physical properties ofgraphite, increases with increasing density. For example,nominal flexural strength of Ultrafine grades ranges from6,000 - 17,000 psi for densities of 1.60 (g/cc) and 1.88(g/cc), respectively, (Figure 6-3). Angstrofine exhibits thehighest flexural strength indicating 18,000 psi.
Reproduction or recording of any part of this book is strictly prohibited without the express written consent of the copyright holder. Text, tables, diagrams,or other material may not be copied by facsimile, enlargement, or reduction; microfilmed; nor reproduced on slides, or by other means or materials.
6.3
P r o p e r t i e s a n d C h a r a c t e r i s t i c s o f G r a p h i t e
Figure 6-3. Nominal flexural strength vs. apparent denity of POCO “Ultrafine” graphite
(EDM-1, EDM-2, EDM-3, EDM-4)
Definition
The tensile strength of a material can be defined as itsstrength when a pulling force is applied along the length ofa sample. If a cylindrical bar of uniform cross-section is subjected to a steadily increasing tensile (“pulling apart”)force along its axis, the material will eventually rupture andtear apart when a large enough force is applied.
Tensile strength, like compressive strength, is expressedin pounds per square inch and is calculated in the samemanner as compressive strength, i.e. the applied force at fail-ure is divided by the cross-sectional area of the sample.
Sample calculation:
If a rod with a cross-sectional area of 0.25 in2 breaks ata load of 2,000 pounds, then the tensile strength is 8,000pounds per inch2.
To convert to kg/cm2, multiply by 0.0703.Tensile Strength = 562 kg/cm2
Test Method
Reference ASTM Procedure C565 for detailed methodscommonly used for tensile testing. Other more sophisticatedtesting equipment has been developed for this test; one ofthe better methods uses hemispherical air bearings to elim-inate misalignment of the sample.
POCO Graphites vs. Conventional Graphites
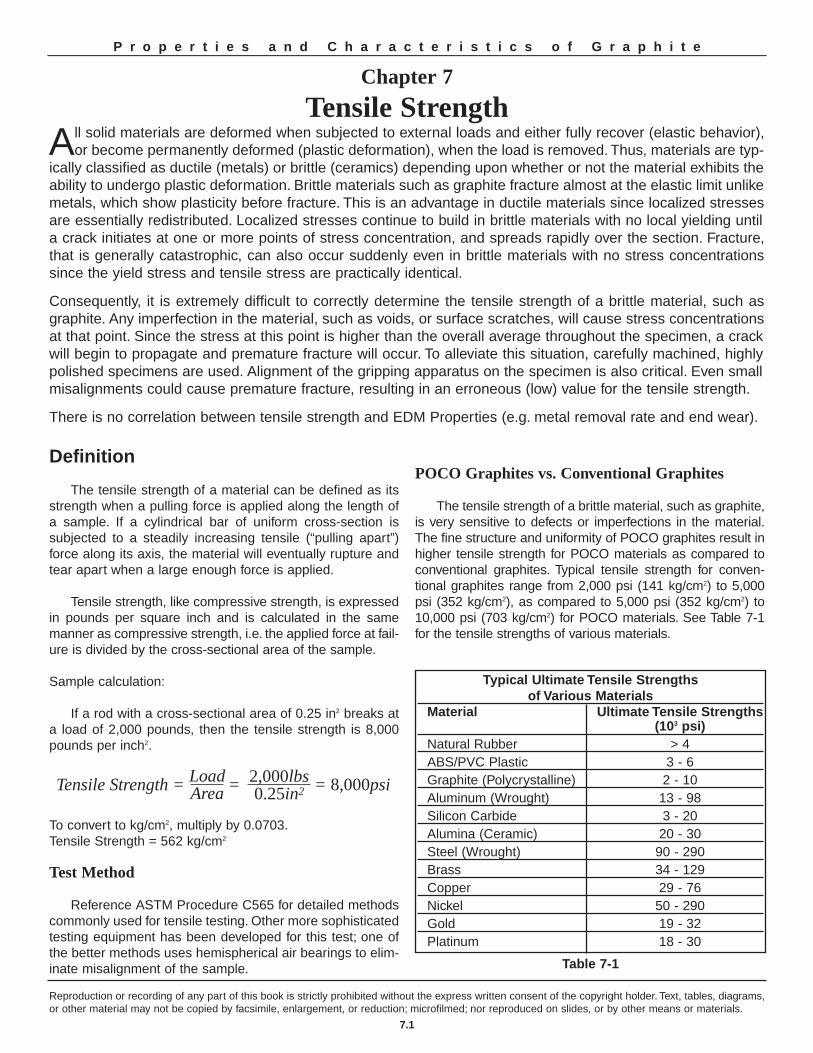
The tensile strength of a brittle material, such as graphite,is very sensitive to defects or imperfections in the material.The fine structure and uniformity of POCO graphites result inhigher tensile strength for POCO materials as compared toconventional graphites. Typical tensile strength for conven-tional graphites range from 2,000 psi (141 kg/cm2) to 5,000psi (352 kg/cm2), as compared to 5,000 psi (352 kg/cm2) to10,000 psi (703 kg/cm2) for POCO materials. See Table 7-1for the tensile strengths of various materials.
Reproduction or recording of any part of this book is strictly prohibited without the express written consent of the copyright holder. Text, tables, diagrams,or other material may not be copied by facsimile, enlargement, or reduction; microfilmed; nor reproduced on slides, or by other means or materials.
7.1
P r o p e r t i e s a n d C h a r a c t e r i s t i c s o f G r a p h i t e
Chapter 7
Tensile StrengthAll solid materials are deformed when subjected to external loads and either fully recover (elastic behavior),
or become permanently deformed (plastic deformation), when the load is removed. Thus, materials are typ-ically classified as ductile (metals) or brittle (ceramics) depending upon whether or not the material exhibits theability to undergo plastic deformation. Brittle materials such as graphite fracture almost at the elastic limit unlikemetals, which show plasticity before fracture. This is an advantage in ductile materials since localized stressesare essentially redistributed. Localized stresses continue to build in brittle materials with no local yielding untila crack initiates at one or more points of stress concentration, and spreads rapidly over the section. Fracture,that is generally catastrophic, can also occur suddenly even in brittle materials with no stress concentrationssince the yield stress and tensile stress are practically identical.
Consequently, it is extremely difficult to correctly determine the tensile strength of a brittle material, such asgraphite. Any imperfection in the material, such as voids, or surface scratches, will cause stress concentrationsat that point. Since the stress at this point is higher than the overall average throughout the specimen, a crackwill begin to propagate and premature fracture will occur. To alleviate this situation, carefully machined, highlypolished specimens are used. Alignment of the gripping apparatus on the specimen is also critical. Even smallmisalignments could cause premature fracture, resulting in an erroneous (low) value for the tensile strength.
There is no correlation between tensile strength and EDM Properties (e.g. metal removal rate and end wear).
Tensile Strength = = = 8,000psi2,000lbs0.25in2
LoadArea
Typical Ultimate Tensile Strengths of Various Materials
Material Ultimate Tensile Strengths(103 psi)
Natural Rubber > 4 ABS/PVC Plastic 3 - 6 Graphite (Polycrystalline) 2 - 10 Aluminum (Wrought) 13 - 98 Silicon Carbide 3 - 20 Alumina (Ceramic) 20 - 30 Steel (Wrought) 90 - 290 Brass 34 - 129 Copper 29 - 76 Nickel 50 - 290 Gold 19 - 32 Platinum 18 - 30
Table 7-1
Temperature Effects
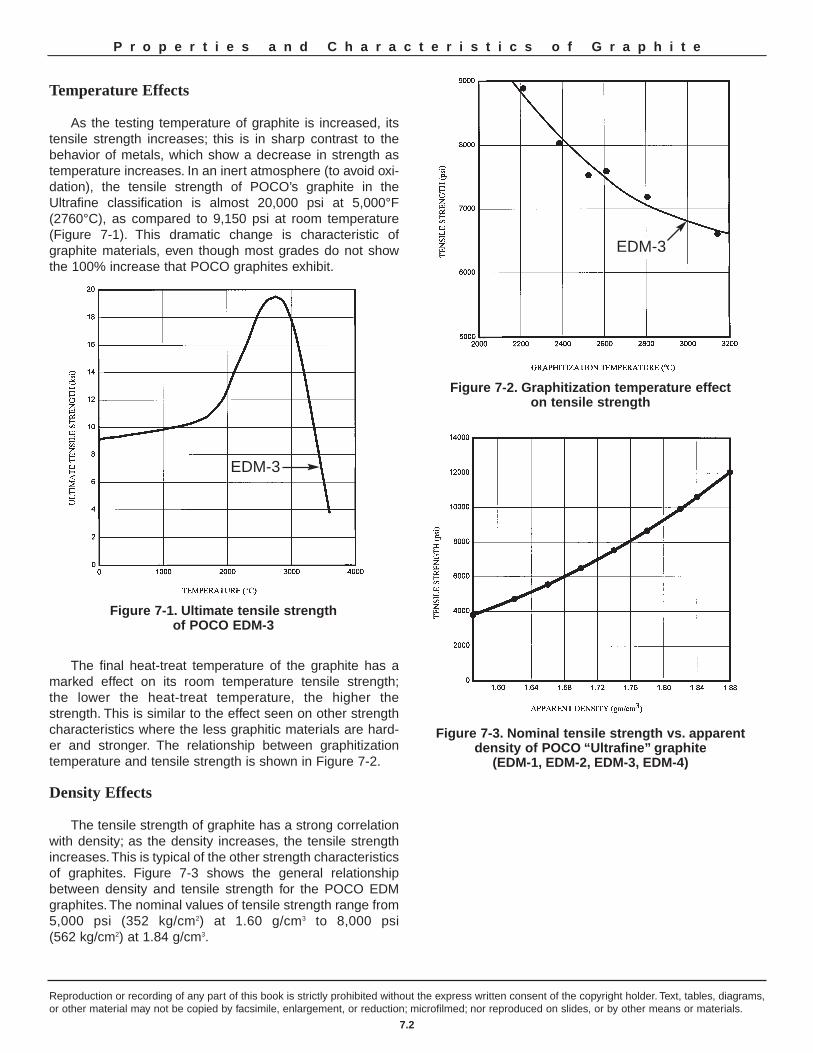
As the testing temperature of graphite is increased, itstensile strength increases; this is in sharp contrast to thebehavior of metals, which show a decrease in strength astemperature increases. In an inert atmosphere (to avoid oxi-dation), the tensile strength of POCO’s graphite in theUltrafine classification is almost 20,000 psi at 5,000°F(2760°C), as compared to 9,150 psi at room temperature(Figure 7-1). This dramatic change is characteristic of graphite materials, even though most grades do not showthe 100% increase that POCO graphites exhibit.
The final heat-treat temperature of the graphite has amarked effect on its room temperature tensile strength;the lower the heat-treat temperature, the higher thestrength. This is similar to the effect seen on other strengthcharacteristics where the less graphitic materials are hard-er and stronger. The relationship between graphitizationtemperature and tensile strength is shown in Figure 7-2.
Density Effects
The tensile strength of graphite has a strong correlationwith density; as the density increases, the tensile strengthincreases.This is typical of the other strength characteristicsof graphites. Figure 7-3 shows the general relationshipbetween density and tensile strength for the POCO EDMgraphites. The nominal values of tensile strength range from5,000 psi (352 kg/cm2) at 1.60 g/cm3 to 8,000 psi (562 kg/cm2) at 1.84 g/cm3.
Reproduction or recording of any part of this book is strictly prohibited without the express written consent of the copyright holder. Text, tables, diagrams,or other material may not be copied by facsimile, enlargement, or reduction; microfilmed; nor reproduced on slides, or by other means or materials.
7.2
P r o p e r t i e s a n d C h a r a c t e r i s t i c s o f G r a p h i t e
Figure 7-1. Ultimate tensile strength of POCO EDM-3
Figure 7-2. Graphitization temperature effect on tensile strength
Figure 7-3. Nominal tensile strength vs. apparent density of POCO “Ultrafine” graphite
(EDM-1, EDM-2, EDM-3, EDM-4)
EDM-3
EDM-3
Definition
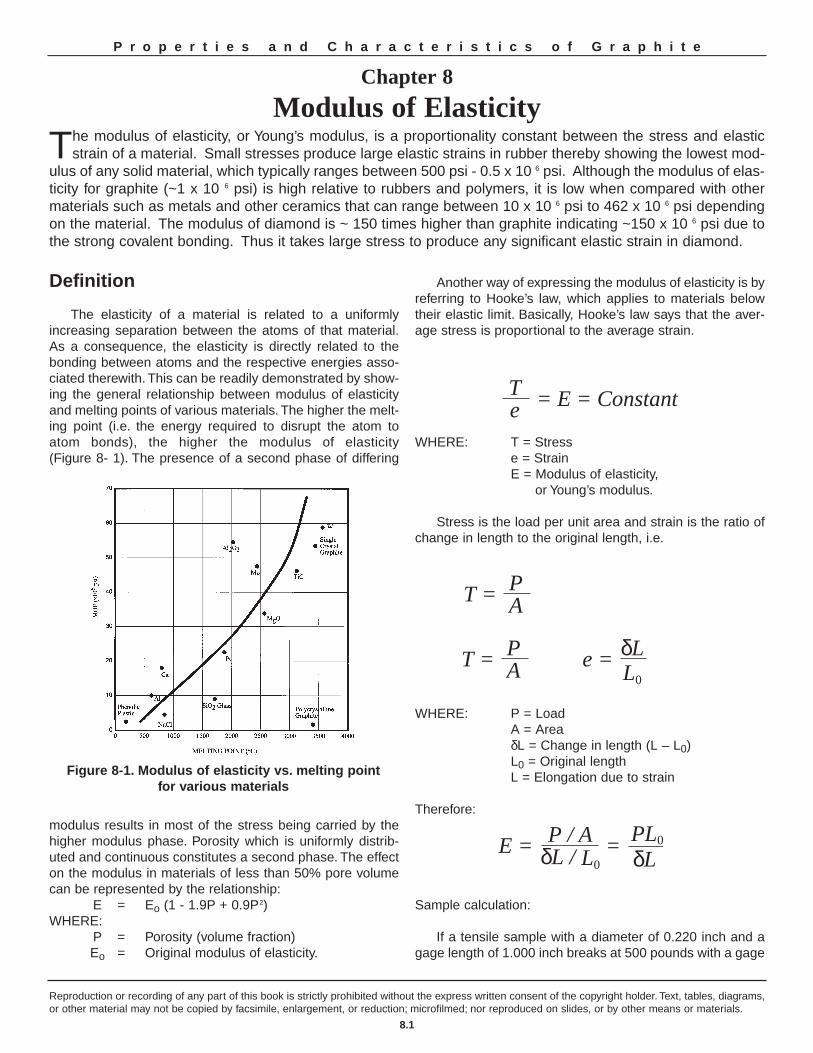
The elasticity of a material is related to a uniformlyincreasing separation between the atoms of that material.As a consequence, the elasticity is directly related to thebonding between atoms and the respective energies asso-ciated therewith. This can be readily demonstrated by show-ing the general relationship between modulus of elasticityand melting points of various materials. The higher the melt-ing point (i.e. the energy required to disrupt the atom toatom bonds), the higher the modulus of elasticity (Figure 8- 1). The presence of a second phase of differing
modulus results in most of the stress being carried by thehigher modulus phase. Porosity which is uniformly distrib-uted and continuous constitutes a second phase. The effecton the modulus in materials of less than 50% pore volumecan be represented by the relationship:
E = Eo (1 - 1.9P + 0.9P2)WHERE:
P = Porosity (volume fraction)Eo = Original modulus of elasticity.
Another way of expressing the modulus of elasticity is byreferring to Hooke’s law, which applies to materials belowtheir elastic limit. Basically, Hooke’s law says that the aver-age stress is proportional to the average strain.
WHERE: T = Stresse = Strain E = Modulus of elasticity,
or Young’s modulus.
Stress is the load per unit area and strain is the ratio ofchange in length to the original length, i.e.
WHERE: P = LoadA = AreaδL = Change in length (L – L0)L0 = Original lengthL = Elongation due to strain
Therefore:
Sample calculation:
If a tensile sample with a diameter of 0.220 inch and agage length of 1.000 inch breaks at 500 pounds with a gage
Reproduction or recording of any part of this book is strictly prohibited without the express written consent of the copyright holder. Text, tables, diagrams,or other material may not be copied by facsimile, enlargement, or reduction; microfilmed; nor reproduced on slides, or by other means or materials.
8.1
Chapter 8
Modulus of ElasticityThe modulus of elasticity, or Young’s modulus, is a proportionality constant between the stress and elastic
strain of a material. Small stresses produce large elastic strains in rubber thereby showing the lowest mod-ulus of any solid material, which typically ranges between 500 psi - 0.5 x 10 6 psi. Although the modulus of elas-ticity for graphite (~1 x 10 6 psi) is high relative to rubbers and polymers, it is low when compared with othermaterials such as metals and other ceramics that can range between 10 x 10 6 psi to 462 x 10 6 psi dependingon the material. The modulus of diamond is ~ 150 times higher than graphite indicating ~150 x 10 6 psi due tothe strong covalent bonding. Thus it takes large stress to produce any significant elastic strain in diamond.
= E = ConstantTe
T = PA e = δL
L0
T = PA e = δL
L0
E = = P / AδL / L0
PL0
δL
Figure 8-1. Modulus of elasticity vs. melting point for various materials
P r o p e r t i e s a n d C h a r a c t e r i s t i c s o f G r a p h i t e
length increase of 0.008 inch, the tensile MOE would be 1.6 x 10⁶ pounds per inch2.
The modulus of elasticity is usually expressed in millionsof pounds per square inch (106 psi), or in GPa in metric units.
Test Method
The standard method of measuring modulus of elastici-ty for graphite when not determined from samples tested in tension is described in ASTM C747 and C769. The methodsare approximations derived from other properties. A moreaccurate, but also more difficult, means is to attach properstrain measuring gages to tensile strength samples andmeasure strain along with stress during a tensile test. Then,employing Hooke’s law, the modulus can be calculated.
POCO Graphites vs. Conventional Graphites
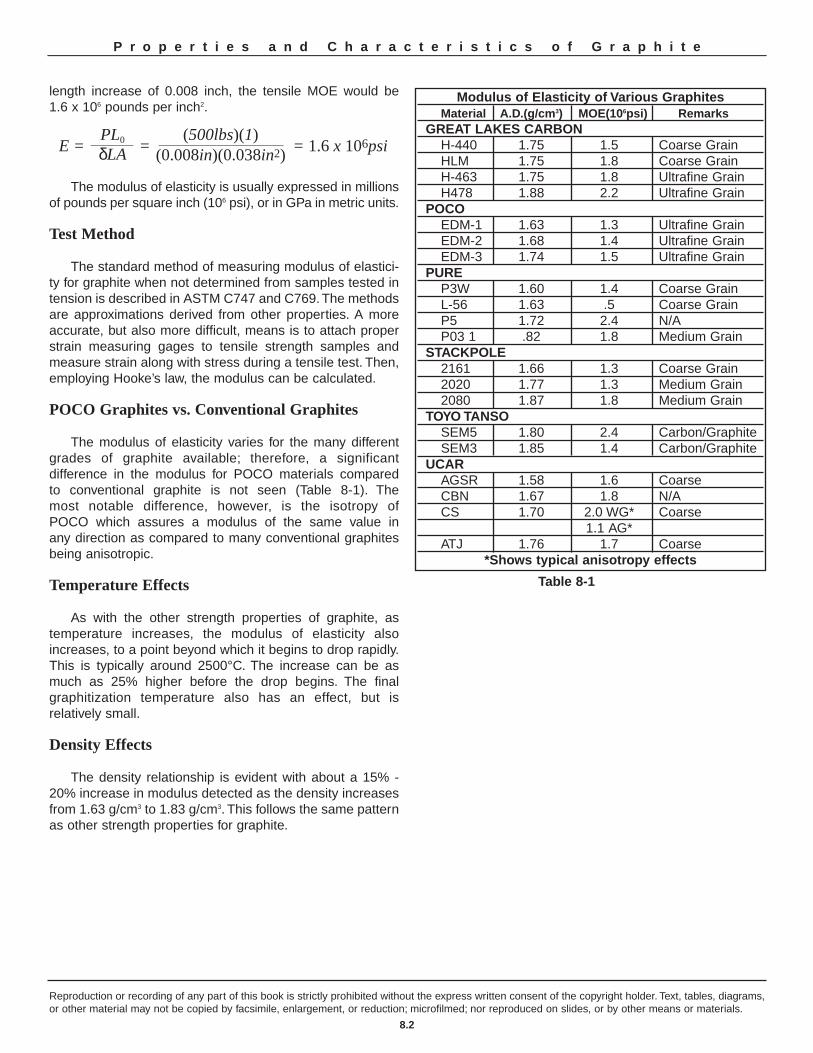
The modulus of elasticity varies for the many differentgrades of graphite available; therefore, a significant difference in the modulus for POCO materials compared to conventional graphite is not seen (Table 8-1). The most notable difference, however, is the isotropy of POCO which assures a modulus of the same value in any direction as compared to many conventional graphitesbeing anisotropic.
Temperature Effects
As with the other strength properties of graphite, as temperature increases, the modulus of elasticity alsoincreases, to a point beyond which it begins to drop rapidly.This is typically around 2500°C. The increase can be asmuch as 25% higher before the drop begins. The finalgraphitization temperature also has an effect, but is relatively small.
Density Effects
The density relationship is evident with about a 15% -20% increase in modulus detected as the density increasesfrom 1.63 g/cm3 to 1.83 g/cm3. This follows the same patternas other strength properties for graphite.
Reproduction or recording of any part of this book is strictly prohibited without the express written consent of the copyright holder. Text, tables, diagrams,or other material may not be copied by facsimile, enlargement, or reduction; microfilmed; nor reproduced on slides, or by other means or materials.
8.2
E = = = 1.6 x 10⁶psiPL0
δLA(500lbs)(1)
(0.008in)(0.038in2)
Modulus of Elasticity of Various Graphites Material A.D.(g/cm3) MOE(106psi) Remarks
GREAT LAKES CARBON H-440 1.75 1.5 Coarse GrainHLM 1.75 1.8 Coarse GrainH-463 1.75 1.8 Ultrafine GrainH478 1.88 2.2 Ultrafine Grain
POCO EDM-1 1.63 1.3 Ultrafine GrainEDM-2 1.68 1.4 Ultrafine GrainEDM-3 1.74 1.5 Ultrafine Grain
PUREP3W 1.60 1.4 Coarse GrainL-56 1.63 .5 Coarse GrainP5 1.72 2.4 N/AP03 1 .82 1.8 Medium Grain
STACKPOLE2161 1.66 1.3 Coarse Grain2020 1.77 1.3 Medium Grain2080 1.87 1.8 Medium Grain
TOYO TANSOSEM5 1.80 2.4 Carbon/Graphite SEM3 1.85 1.4 Carbon/Graphite
UCARAGSR 1.58 1.6 CoarseCBN 1.67 1.8 N/ACS 1.70 2.0 WG* Coarse
1.1 AG*ATJ 1.76 1.7 Coarse
*Shows typical anisotropy effects
Table 8-1
P r o p e r t i e s a n d C h a r a c t e r i s t i c s o f G r a p h i t e
Chapter 9
Electrical ResistivityT he electrical resistivity of a material is the reciprocal of its electrical conductivity and values are tempera-
ture dependant and affected by impurities. In general, electrical resistivity will not influence EDMPerformance. The exceptions would be working with thin ribs and rods. Due to the limited cross sectional areaof the electrode, thin ribs could overheat if the ER is too high. When small hole drilling with multiple rods, theER should be uniform. The speed of the cut is dependent on the slowest electrode.
Definition
The electrical resistivity is that property of a material,which determines its resistance to the flow of an electricalcurrent and is an intrinsic property. The electrical resistanceof a substance is directly proportional to the length of thecurrent path, i.e. as the current path increases, the resist-ance increases. It is also inversely proportional to its crosssectional area, i.e. as the area increases, the resistancedecreases. The mathematical expression for the determina-tion of electrical resistivity is:
WHERE: ER = Electrical resistivity at room temperature
A = Cross sectional area (in2)R = Electrical resistance of the material (Ω)L = Distance between potential contacts (in)
Sample calculation:
For a graphite sample with cross-sectional area of 0.25(in)2, distance between the potential contacts of 2.0 inchesand an electrical resistance reading of 0.00425 (Ω); calcu-late the electrical resistivity.
ER = 0.000531 (Ω-in)ER = 531 (µ-Ω-in)
To convert to micro-ohm-centimeter, multiply by 2.54.
ER = 1349 (µ-Ω-cm)
Test Method
The standard method of measuring the electrical resis-tivity of a graphite sample is described in ASTM C611. AtPOCO only two resistance readings are taken, using a spe-cial sample holder with eight (8) electrical contacts whichtakes the equivalent of four readings at once. POCO usesTDI 4.1.1.2 (Appendix B).
POCO Graphite vs. Conventional Graphites
POCO graphites have electrical resistivity values that fallinto the range of most conventional graphites. POCOgraphites have a range from around 450 (µ-Ω-in) to 1050 (µ-Ω-in). This may be compared to copper, which hasa range of 1.1-1.5 (µ-Ω-in) or tool steels ranging from 7.1-7.5 (µ-Ω-in). See Table 9-1 for other common material resistivities.
Temperature Effects
Electrical resistivity varies with temperature1 (Figure 9-1).As the temperature increases from room temperature toabout 700°C, the electrical resistivity decreases. From thatpoint, however, as the temperature increases, the resistivity also increases.
Graphitization temperature also has an effect on electri-cal resistivity. The higher the graphitization temperature, thelower the electrical resistivity becomes, as measured atroom temperature.
Density Effects
Density is a particularly important characteristic ofgraphite because, in addition to its inherent significance, ithas a large and direct influence on other properties. As the density of POCO graphite increases, its electrical resistivitydecreases (Figure 9-2).
Reproduction or recording of any part of this book is strictly prohibited without the express written consent of the copyright holder. Text, tables, diagrams,or other material may not be copied by facsimile, enlargement, or reduction; microfilmed; nor reproduced on slides, or by other means or materials.
9.1
P r o p e r t i e s a n d C h a r a c t e r i s t i c s o f G r a p h i t e
ER = ARL
ER = (0.25in2)(0.00425ohms)(2.0in)
1Taylor, R. E., & Groot, H. Thermophysical Properties of POCO Graphite.(West Lafayette, Indiana: Purdue University, July 1978. [NTIS No.ADA060419]), p.16.
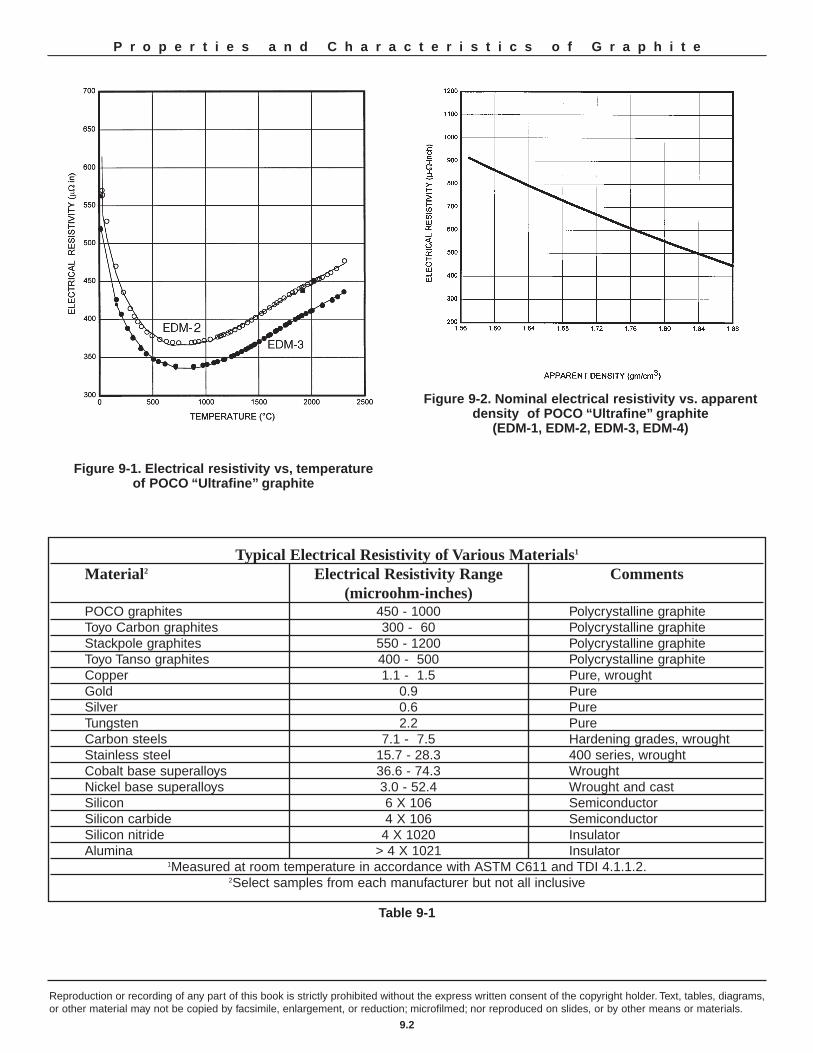
Reproduction or recording of any part of this book is strictly prohibited without the express written consent of the copyright holder. Text, tables, diagrams,or other material may not be copied by facsimile, enlargement, or reduction; microfilmed; nor reproduced on slides, or by other means or materials.
9.2
P r o p e r t i e s a n d C h a r a c t e r i s t i c s o f G r a p h i t e
Typical Electrical Resistivity of Various Materials1
Material2 Electrical Resistivity Range Comments(microohm-inches)
POCO graphites 450 - 1000 Polycrystalline graphite Toyo Carbon graphites 300 - 60 Polycrystalline graphite Stackpole graphites 550 - 1200 Polycrystalline graphite Toyo Tanso graphites 400 - 500 Polycrystalline graphite Copper 1.1 - 1.5 Pure, wrought Gold 0.9 Pure Silver 0.6 Pure Tungsten 2.2 Pure Carbon steels 7.1 - 7.5 Hardening grades, wrought Stainless steel 15.7 - 28.3 400 series, wrought Cobalt base superalloys 36.6 - 74.3 Wrought Nickel base superalloys 3.0 - 52.4 Wrought and cast Silicon 6 X 10⁶ Semiconductor Silicon carbide 4 X 10⁶ Semiconductor Silicon nitride 4 X 10²⁰ Insulator Alumina > 4 X 10²¹ Insulator
1Measured at room temperature in accordance with ASTM C611 and TDI 4.1.1.2.2Select samples from each manufacturer but not all inclusive
Table 9-1
Figure 9-1. Electrical resistivity vs, temperature of POCO “Ultrafine” graphite
Figure 9-2. Nominal electrical resistivity vs. apparentdensity of POCO “Ultrafine” graphite
(EDM-1, EDM-2, EDM-3, EDM-4)
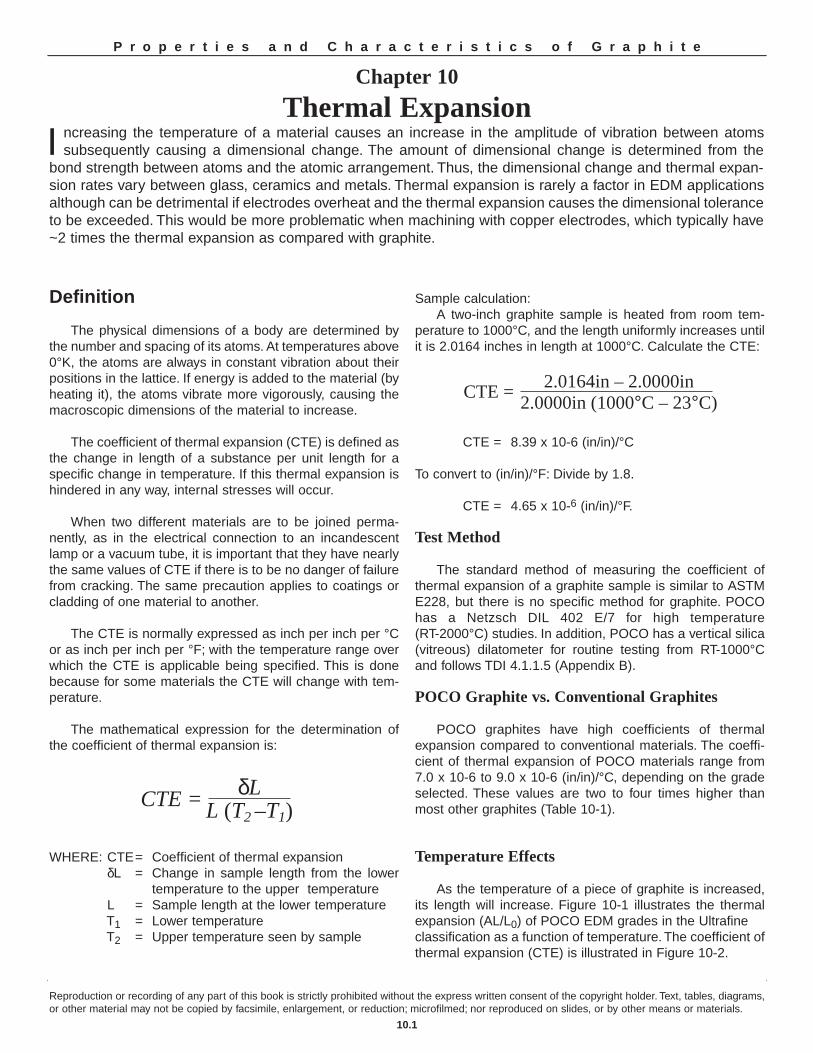
Reproduction or recording of any part of this book is strictly prohibited without the express written consent of the copyright holder. Text, tables, diagrams,or other material may not be copied by facsimile, enlargement, or reduction; microfilmed; nor reproduced on slides, or by other means or materials.
10.1
P r o p e r t i e s a n d C h a r a c t e r i s t i c s o f G r a p h i t e
Definition
The physical dimensions of a body are determined bythe number and spacing of its atoms. At temperatures above0°K, the atoms are always in constant vibration about theirpositions in the lattice. If energy is added to the material (byheating it), the atoms vibrate more vigorously, causing themacroscopic dimensions of the material to increase.
The coefficient of thermal expansion (CTE) is defined asthe change in length of a substance per unit length for aspecific change in temperature. If this thermal expansion ishindered in any way, internal stresses will occur.
When two different materials are to be joined perma-nently, as in the electrical connection to an incandescentlamp or a vacuum tube, it is important that they have nearlythe same values of CTE if there is to be no danger of failurefrom cracking. The same precaution applies to coatings orcladding of one material to another.
The CTE is normally expressed as inch per inch per °Cor as inch per inch per °F; with the temperature range overwhich the CTE is applicable being specified. This is donebecause for some materials the CTE will change with tem-perature.
The mathematical expression for the determination ofthe coefficient of thermal expansion is:
WHERE: CTE= Coefficient of thermal expansionδL = Change in sample length from the lower
temperature to the upper temperatureL = Sample length at the lower temperature T1 = Lower temperature T2 = Upper temperature seen by sample
Sample calculation:A two-inch graphite sample is heated from room tem-
perature to 1000°C, and the length uniformly increases untilit is 2.0164 inches in length at 1000°C. Calculate the CTE:
CTE = 8.39 x 10⁻⁶ (in/in)/°C
To convert to (in/in)/°F: Divide by 1.8.
CTE = 4.65 x 10⁻⁶ (in/in)/°F.
Test Method
The standard method of measuring the coefficient ofthermal expansion of a graphite sample is similar to ASTME228, but there is no specific method for graphite. POCOhas a Netzsch DIL 402 E/7 for high temperature (RT-2000°C) studies. In addition, POCO has a vertical silica (vitreous) dilatometer for routine testing from RT-1000°Cand follows TDI 4.1.1.5 (Appendix B).
POCO Graphite vs. Conventional Graphites
POCO graphites have high coefficients of thermalexpansion compared to conventional materials. The coeffi-cient of thermal expansion of POCO materials range from7.0 x 10-6 to 9.0 x 10⁻⁶ (in/in)/°C, depending on the gradeselected. These values are two to four times higher thanmost other graphites (Table 10-1).
Temperature Effects
As the temperature of a piece of graphite is increased,its length will increase. Figure 10-1 illustrates the thermalexpansion (AL/L0) of POCO EDM grades in the Ultrafineclassification as a function of temperature. The coefficient ofthermal expansion (CTE) is illustrated in Figure 10-2.
Chapter 10
Thermal ExpansionI ncreasing the temperature of a material causes an increase in the amplitude of vibration between atoms
subsequently causing a dimensional change. The amount of dimensional change is determined from thebond strength between atoms and the atomic arrangement. Thus, the dimensional change and thermal expan-sion rates vary between glass, ceramics and metals. Thermal expansion is rarely a factor in EDM applicationsalthough can be detrimental if electrodes overheat and the thermal expansion causes the dimensional toleranceto be exceeded. This would be more problematic when machining with copper electrodes, which typically have~2 times the thermal expansion as compared with graphite.
CTE = δLL (T2 –T1)
CTE = 2.0164in – 2.0000in2.0000in (1000°C – 23°C)
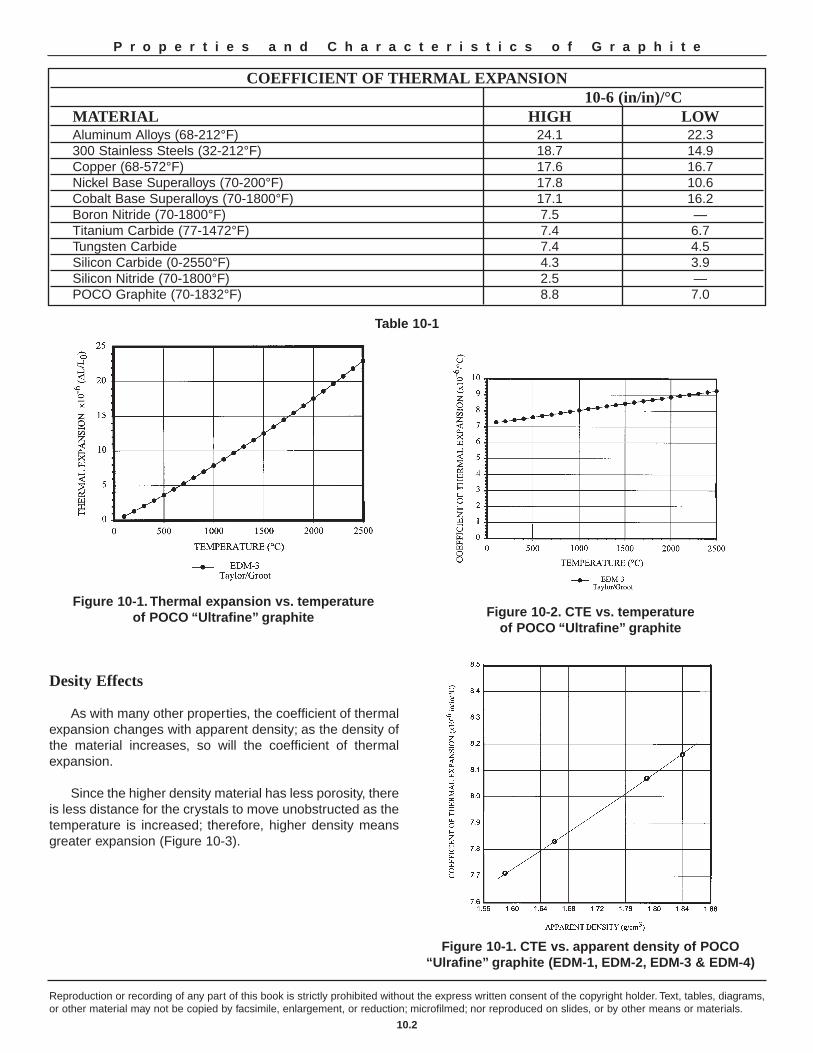
Desity Effects
As with many other properties, the coefficient of thermalexpansion changes with apparent density; as the density ofthe material increases, so will the coefficient of thermalexpansion.
Since the higher density material has less porosity, thereis less distance for the crystals to move unobstructed as thetemperature is increased; therefore, higher density meansgreater expansion (Figure 10-3).
Reproduction or recording of any part of this book is strictly prohibited without the express written consent of the copyright holder. Text, tables, diagrams,or other material may not be copied by facsimile, enlargement, or reduction; microfilmed; nor reproduced on slides, or by other means or materials.
10.2
P r o p e r t i e s a n d C h a r a c t e r i s t i c s o f G r a p h i t e
COEFFICIENT OF THERMAL EXPANSION10-6 (in/in)/°C
MATERIAL HIGH LOW Aluminum Alloys (68-212°F) 24.1 22.3 300 Stainless Steels (32-212°F) 18.7 14.9 Copper (68-572°F) 17.6 16.7 Nickel Base Superalloys (70-200°F) 17.8 10.6 Cobalt Base Superalloys (70-1800°F) 17.1 16.2 Boron Nitride (70-1800°F) 7.5 — Titanium Carbide (77-1472°F) 7.4 6.7 Tungsten Carbide 7.4 4.5 Silicon Carbide (0-2550°F) 4.3 3.9 Silicon Nitride (70-1800°F) 2.5 — POCO Graphite (70-1832°F) 8.8 7.0
Table 10-1
Figure 10-1. Thermal expansion vs. temperature of POCO “Ultrafine” graphite Figure 10-2. CTE vs. temperature
of POCO “Ultrafine” graphite
Figure 10-1. CTE vs. apparent density of POCO“Ulrafine” graphite (EDM-1, EDM-2, EDM-3 & EDM-4)
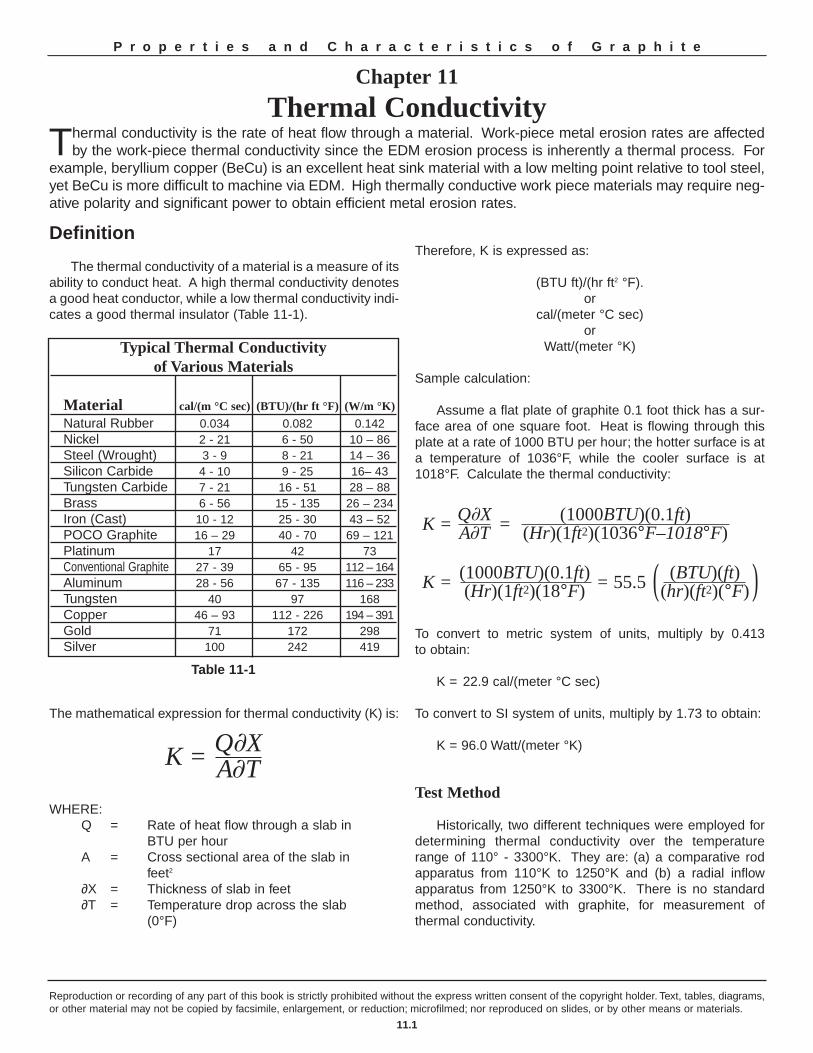
Definition
The thermal conductivity of a material is a measure of itsability to conduct heat. A high thermal conductivity denotesa good heat conductor, while a low thermal conductivity indi-cates a good thermal insulator (Table 11-1).
The mathematical expression for thermal conductivity (K) is:
WHERE:Q = Rate of heat flow through a slab in
BTU per hourA = Cross sectional area of the slab in
feet2
∂X = Thickness of slab in feet∂T = Temperature drop across the slab
(0°F)
Therefore, K is expressed as:
(BTU ft)/(hr ft2 °F).or
cal/(meter °C sec) or
Watt/(meter °K)
Sample calculation:
Assume a flat plate of graphite 0.1 foot thick has a sur-face area of one square foot. Heat is flowing through thisplate at a rate of 1000 BTU per hour; the hotter surface is ata temperature of 1036°F, while the cooler surface is at1018°F. Calculate the thermal conductivity:
To convert to metric system of units, multiply by 0.413 to obtain:
K = 22.9 cal/(meter °C sec)
To convert to SI system of units, multiply by 1.73 to obtain:
K = 96.0 Watt/(meter °K)
Test Method
Historically, two different techniques were employed fordetermining thermal conductivity over the temperaturerange of 110° - 3300°K. They are: (a) a comparative rodapparatus from 110°K to 1250°K and (b) a radial inflowapparatus from 1250°K to 3300°K. There is no standardmethod, associated with graphite, for measurement of thermal conductivity.
Reproduction or recording of any part of this book is strictly prohibited without the express written consent of the copyright holder. Text, tables, diagrams,or other material may not be copied by facsimile, enlargement, or reduction; microfilmed; nor reproduced on slides, or by other means or materials.
11.1
P r o p e r t i e s a n d C h a r a c t e r i s t i c s o f G r a p h i t e
Chapter 11
Thermal ConductivityThermal conductivity is the rate of heat flow through a material. Work-piece metal erosion rates are affected
by the work-piece thermal conductivity since the EDM erosion process is inherently a thermal process. Forexample, beryllium copper (BeCu) is an excellent heat sink material with a low melting point relative to tool steel,yet BeCu is more difficult to machine via EDM. High thermally conductive work piece materials may require neg-ative polarity and significant power to obtain efficient metal erosion rates.
K = Q XA T
(BTU)(ft)(hr)(ft2)(°F)( )
K = = Q XA T
(1000BTU)(0.1ft)(Hr)(1ft2)(1036°F–1018°F)
K = = 55.5(1000BTU)(0.1ft)(Hr)(1ft2)(18°F)
Typical Thermal Conductivity of Various Materials
Material cal/(m °C sec) (BTU)/(hr ft °F) (W/m °K)
Natural Rubber 0.034 0.082 0.142Nickel 2 - 21 6 - 50 10 – 86Steel (Wrought) 3 - 9 8 - 21 14 – 36Silicon Carbide 4 - 10 9 - 25 16– 43Tungsten Carbide 7 - 21 16 - 51 28 – 88Brass 6 - 56 15 - 135 26 – 234Iron (Cast) 10 - 12 25 - 30 43 – 52POCO Graphite 16 – 29 40 - 70 69 – 121Platinum 17 42 73Conventional Graphite 27 - 39 65 - 95 112 – 164Aluminum 28 - 56 67 - 135 116 – 233Tungsten 40 97 168Copper 46 – 93 112 - 226 194 – 391Gold 71 172 298Silver 100 242 419
Table 11-1
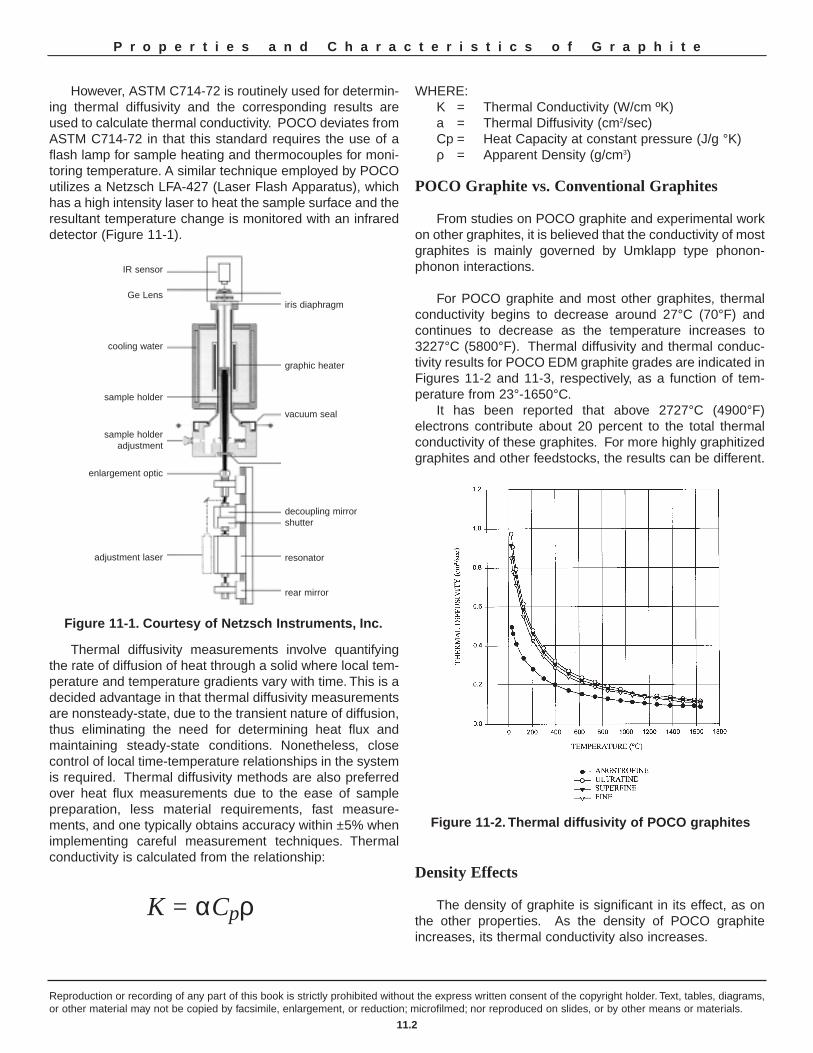
However, ASTM C714-72 is routinely used for determin-ing thermal diffusivity and the corresponding results areused to calculate thermal conductivity. POCO deviates fromASTM C714-72 in that this standard requires the use of aflash lamp for sample heating and thermocouples for moni-toring temperature. A similar technique employed by POCO utilizes a Netzsch LFA-427 (Laser Flash Apparatus), whichhas a high intensity laser to heat the sample surface and theresultant temperature change is monitored with an infrareddetector (Figure 11-1).
Thermal diffusivity measurements involve quantifyingthe rate of diffusion of heat through a solid where local tem-perature and temperature gradients vary with time. This is adecided advantage in that thermal diffusivity measurementsare nonsteady-state, due to the transient nature of diffusion,thus eliminating the need for determining heat flux andmaintaining steady-state conditions. Nonetheless, closecontrol of local time-temperature relationships in the systemis required. Thermal diffusivity methods are also preferredover heat flux measurements due to the ease of samplepreparation, less material requirements, fast measure-ments, and one typically obtains accuracy within ±5% whenimplementing careful measurement techniques. Thermalconductivity is calculated from the relationship:
WHERE:K = Thermal Conductivity (W/cm ºK)a = Thermal Diffusivity (cm2/sec)Cp = Heat Capacity at constant pressure (J/g °K)ρ = Apparent Density (g/cm3)
POCO Graphite vs. Conventional Graphites
From studies on POCO graphite and experimental workon other graphites, it is believed that the conductivity of mostgraphites is mainly governed by Umklapp type phonon-phonon interactions.
For POCO graphite and most other graphites, thermalconductivity begins to decrease around 27°C (70°F) andcontinues to decrease as the temperature increases to3227°C (5800°F). Thermal diffusivity and thermal conduc-tivity results for POCO EDM graphite grades are indicated inFigures 11-2 and 11-3, respectively, as a function of tem-perature from 23°-1650°C.
It has been reported that above 2727°C (4900°F) electrons contribute about 20 percent to the total thermalconductivity of these graphites. For more highly graphitizedgraphites and other feedstocks, the results can be different.
Density Effects
The density of graphite is significant in its effect, as onthe other properties. As the density of POCO graphiteincreases, its thermal conductivity also increases.
Reproduction or recording of any part of this book is strictly prohibited without the express written consent of the copyright holder. Text, tables, diagrams,or other material may not be copied by facsimile, enlargement, or reduction; microfilmed; nor reproduced on slides, or by other means or materials.
11.2
P r o p e r t i e s a n d C h a r a c t e r i s t i c s o f G r a p h i t e
Figure 11-2. Thermal diffusivity of POCO graphites
K = αCpρ
Figure 11-1. Courtesy of Netzsch Instruments, Inc.
iris diaphragm
graphic heater
vacuum seal
decoupling mirrorshutter
resonator
rear mirror
Ge Lens
cooling water
adjustment laser
enlargement optic
sample holder adjustment
sample holder
IR sensor

Reproduction or recording of any part of this book is strictly prohibited without the express written consent of the copyright holder. Text, tables, diagrams,or other material may not be copied by facsimile, enlargement, or reduction; microfilmed; nor reproduced on slides, or by other means or materials.
11.3
P r o p e r t i e s a n d C h a r a c t e r i s t i c s o f G r a p h i t e
Figure 11-3. Thermal conductivity of POCO graphites
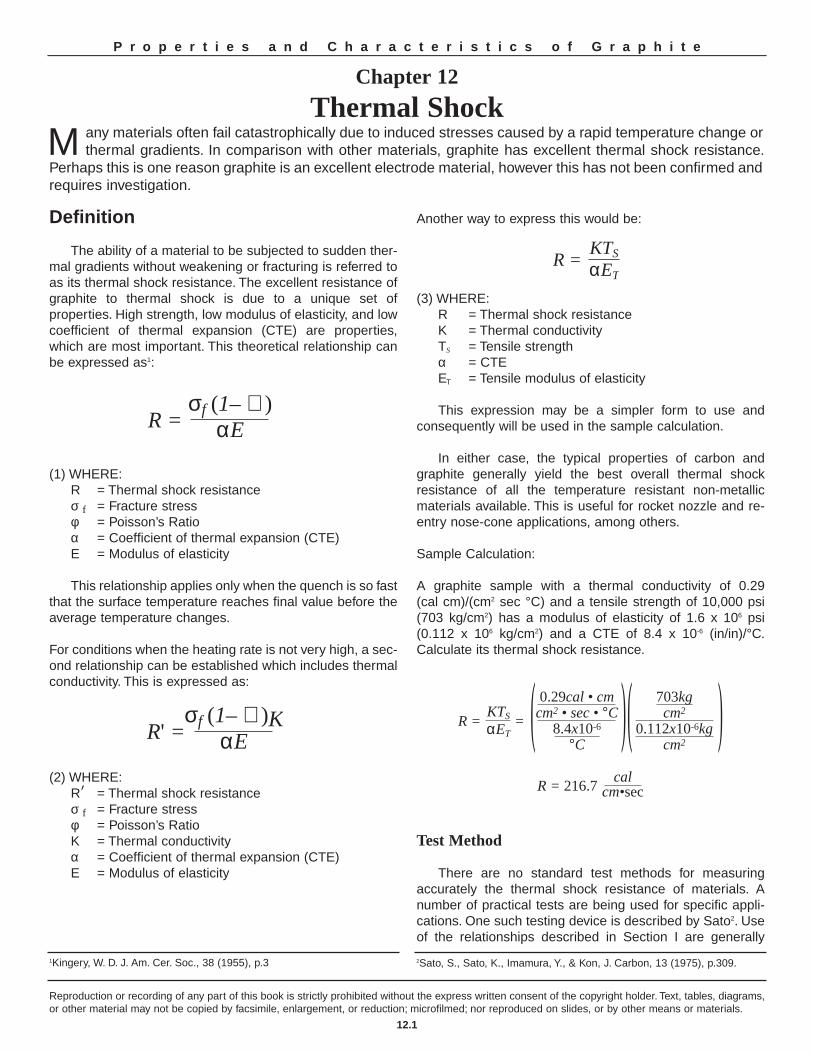
Definition
The ability of a material to be subjected to sudden ther-mal gradients without weakening or fracturing is referred to as its thermal shock resistance. The excellent resistance ofgraphite to thermal shock is due to a unique set of properties. High strength, low modulus of elasticity, and lowcoefficient of thermal expansion (CTE) are properties,which are most important. This theoretical relationship canbe expressed as1:
(1) WHERE:R = Thermal shock resistanceσ f = Fracture stress φ = Poisson’s Ratioα = Coefficient of thermal expansion (CTE)Ε = Modulus of elasticity
This relationship applies only when the quench is so fastthat the surface temperature reaches final value before theaverage temperature changes.
For conditions when the heating rate is not very high, a sec-ond relationship can be established which includes thermalconductivity. This is expressed as:
(2) WHERE:R’ = Thermal shock resistanceσ f = Fracture stressφ = Poisson’s RatioΚ = Thermal conductivityα = Coefficient of thermal expansion (CTE)Ε = Modulus of elasticity
Another way to express this would be:
(3) WHERE:R = Thermal shock resistanceΚ = Thermal conductivityΤS = Tensile strengthα = CTEΕΤ = Tensile modulus of elasticity
This expression may be a simpler form to use and consequently will be used in the sample calculation.
In either case, the typical properties of carbon andgraphite generally yield the best overall thermal shockresistance of all the temperature resistant non-metallicmaterials available. This is useful for rocket nozzle and re-entry nose-cone applications, among others.
Sample Calculation:
A graphite sample with a thermal conductivity of 0.29 (cal cm)/(cm2 sec °C) and a tensile strength of 10,000 psi(703 kg/cm2) has a modulus of elasticity of 1.6 x 10⁶ psi(0.112 x 10⁶ kg/cm2) and a CTE of 8.4 x 10⁻⁶ (in/in)/°C.Calculate its thermal shock resistance.
Test Method
There are no standard test methods for measuringaccurately the thermal shock resistance of materials. Anumber of practical tests are being used for specific appli-cations. One such testing device is described by Sato2. Useof the relationships described in Section I are generally
Reproduction or recording of any part of this book is strictly prohibited without the express written consent of the copyright holder. Text, tables, diagrams,or other material may not be copied by facsimile, enlargement, or reduction; microfilmed; nor reproduced on slides, or by other means or materials.
12.1
P r o p e r t i e s a n d C h a r a c t e r i s t i c s o f G r a p h i t e
Chapter 12
Thermal ShockM any materials often fail catastrophically due to induced stresses caused by a rapid temperature change or
thermal gradients. In comparison with other materials, graphite has excellent thermal shock resistance.Perhaps this is one reason graphite is an excellent electrode material, however this has not been confirmed andrequires investigation.
R =σf (1– ∅ )
αE
R' =σf (1– ∅ )K
αE
R =KTS
αET
R = 216.7cal
cm•sec
R = =KTS
αET
0.29cal • cmcm2 • sec • °C
8.4x10⁻⁶
°C
703kgcm2
0.112x10⁻⁶kgcm2
( )( )
1Kingery, W. D. J. Am. Cer. Soc., 38 (1955), p.3 2Sato, S., Sato, K., Imamura, Y., & Kon, J. Carbon, 13 (1975), p.309.
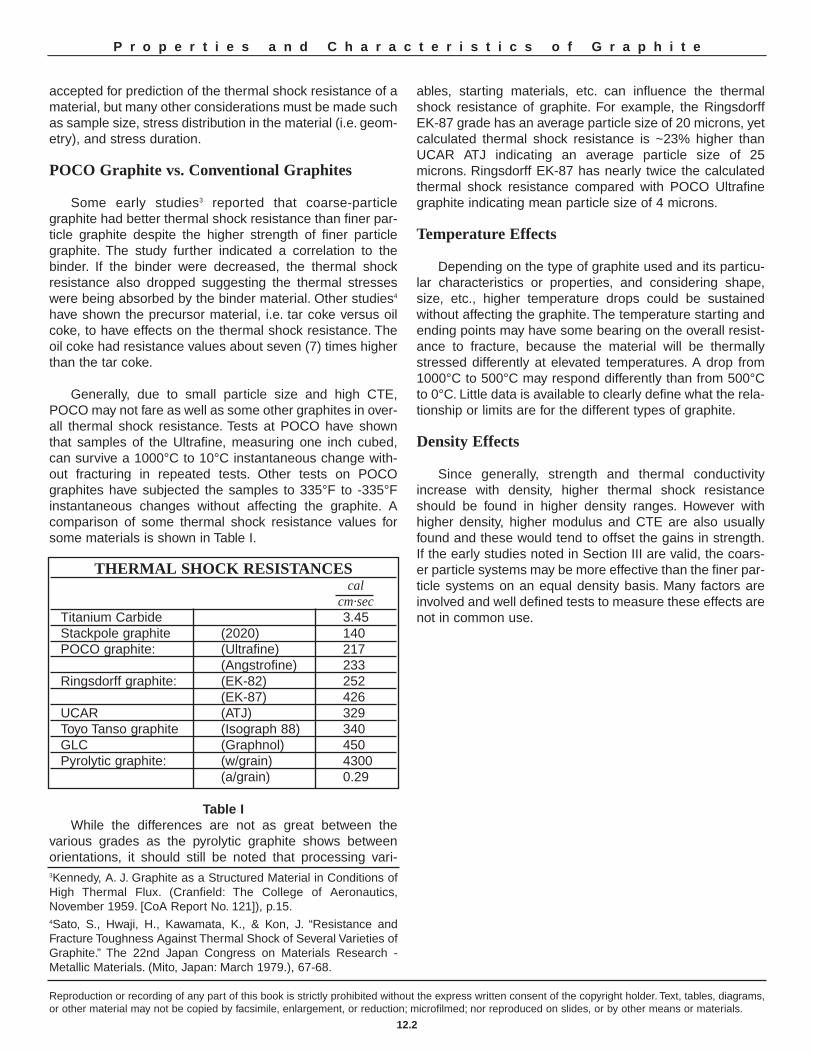
accepted for prediction of the thermal shock resistance of amaterial, but many other considerations must be made suchas sample size, stress distribution in the material (i.e. geom-etry), and stress duration.
POCO Graphite vs. Conventional Graphites
Some early studies3 reported that coarse-particlegraphite had better thermal shock resistance than finer par-ticle graphite despite the higher strength of finer particlegraphite. The study further indicated a correlation to thebinder. If the binder were decreased, the thermal shockresistance also dropped suggesting the thermal stresseswere being absorbed by the binder material. Other studies4
have shown the precursor material, i.e. tar coke versus oilcoke, to have effects on the thermal shock resistance. Theoil coke had resistance values about seven (7) times higherthan the tar coke.
Generally, due to small particle size and high CTE,POCO may not fare as well as some other graphites in over-all thermal shock resistance. Tests at POCO have shownthat samples of the Ultrafine, measuring one inch cubed,can survive a 1000°C to 10°C instantaneous change with-out fracturing in repeated tests. Other tests on POCOgraphites have subjected the samples to 335°F to -335°Finstantaneous changes without affecting the graphite. Acomparison of some thermal shock resistance values forsome materials is shown in Table I.
Table IWhile the differences are not as great between the
various grades as the pyrolytic graphite shows between orientations, it should still be noted that processing vari-
ables, starting materials, etc. can influence the thermalshock resistance of graphite. For example, the RingsdorffEK-87 grade has an average particle size of 20 microns, yetcalculated thermal shock resistance is ~23% higher thanUCAR ATJ indicating an average particle size of 25microns. Ringsdorff EK-87 has nearly twice the calculatedthermal shock resistance compared with POCO Ultrafinegraphite indicating mean particle size of 4 microns.
Temperature Effects
Depending on the type of graphite used and its particu-lar characteristics or properties, and considering shape,size, etc., higher temperature drops could be sustainedwithout affecting the graphite. The temperature starting andending points may have some bearing on the overall resist-ance to fracture, because the material will be thermallystressed differently at elevated temperatures. A drop from1000°C to 500°C may respond differently than from 500°Cto 0°C. Little data is available to clearly define what the rela-tionship or limits are for the different types of graphite.
Density Effects
Since generally, strength and thermal conductivityincrease with density, higher thermal shock resistanceshould be found in higher density ranges. However withhigher density, higher modulus and CTE are also usuallyfound and these would tend to offset the gains in strength.If the early studies noted in Section III are valid, the coars-er particle systems may be more effective than the finer par-ticle systems on an equal density basis. Many factors areinvolved and well defined tests to measure these effects arenot in common use.
Reproduction or recording of any part of this book is strictly prohibited without the express written consent of the copyright holder. Text, tables, diagrams,or other material may not be copied by facsimile, enlargement, or reduction; microfilmed; nor reproduced on slides, or by other means or materials.
12.2
P r o p e r t i e s a n d C h a r a c t e r i s t i c s o f G r a p h i t e
THERMAL SHOCK RESISTANCES cal
cm·sec Titanium Carbide 3.45 Stackpole graphite (2020) 140 POCO graphite: (Ultrafine) 217
(Angstrofine) 233 Ringsdorff graphite: (EK-82) 252
(EK-87) 426 UCAR (ATJ) 329 Toyo Tanso graphite (Isograph 88) 340 GLC (Graphnol) 450 Pyrolytic graphite: (w/grain) 4300
(a/grain) 0.29
3Kennedy, A. J. Graphite as a Structured Material in Conditions ofHigh Thermal Flux. (Cranfield: The College of Aeronautics,November 1959. [CoA Report No. 121]), p.15.4Sato, S., Hwaji, H., Kawamata, K., & Kon, J. “Resistance andFracture Toughness Against Thermal Shock of Several Varieties ofGraphite.” The 22nd Japan Congress on Materials Research -Metallic Materials. (Mito, Japan: March 1979.), 67-68.
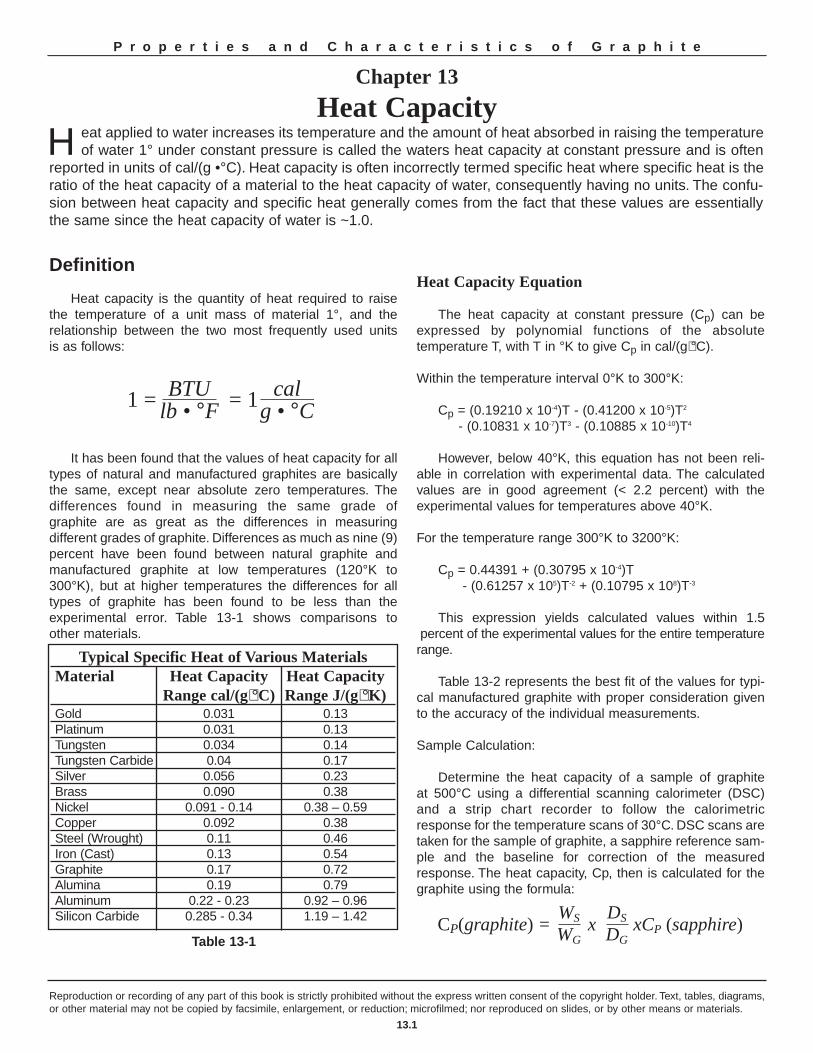
Definition
Heat capacity is the quantity of heat required to raise the temperature of a unit mass of material 1°, and the relationship between the two most frequently used units is as follows:
It has been found that the values of heat capacity for alltypes of natural and manufactured graphites are basicallythe same, except near absolute zero temperatures. The differences found in measuring the same grade of graphite are as great as the differences in measuring different grades of graphite. Differences as much as nine (9)percent have been found between natural graphite andmanufactured graphite at low temperatures (120°K to300°K), but at higher temperatures the differences for alltypes of graphite has been found to be less than the experimental error. Table 13-1 shows comparisons to other materials.
Heat Capacity Equation
The heat capacity at constant pressure (Cp) can beexpressed by polynomial functions of the absolute temperature T, with T in °K to give Cp in cal/(g⋅°C).
Within the temperature interval 0°K to 300°K:
Cp = (0.19210 x 10⁻⁴)T - (0.41200 x 10⁻⁵)T2
- (0.10831 x 10⁻⁷)T3 - (0.10885 x 10⁻¹⁰)T4
However, below 40°K, this equation has not been reli-able in correlation with experimental data. The calculatedvalues are in good agreement (< 2.2 percent) with theexperimental values for temperatures above 40°K.
For the temperature range 300°K to 3200°K:
Cp = 0.44391 + (0.30795 x 10⁻⁴)T - (0.61257 x 10⁵)T-2 + (0.10795 x 10⁸)T-3
This expression yields calculated values within 1.5percent of the experimental values for the entire temperature
range.
Table 13-2 represents the best fit of the values for typi-cal manufactured graphite with proper consideration givento the accuracy of the individual measurements.
Sample Calculation:
Determine the heat capacity of a sample of graphite at 500°C using a differential scanning calorimeter (DSC)and a strip chart recorder to follow the calorimetricresponse for the temperature scans of 30°C. DSC scans aretaken for the sample of graphite, a sapphire reference sam-ple and the baseline for correction of the measuredresponse. The heat capacity, Cp, then is calculated for thegraphite using the formula:
Reproduction or recording of any part of this book is strictly prohibited without the express written consent of the copyright holder. Text, tables, diagrams,or other material may not be copied by facsimile, enlargement, or reduction; microfilmed; nor reproduced on slides, or by other means or materials.
13.1
P r o p e r t i e s a n d C h a r a c t e r i s t i c s o f G r a p h i t e
Chapter 13
Heat CapacityH eat applied to water increases its temperature and the amount of heat absorbed in raising the temperature
of water 1° under constant pressure is called the waters heat capacity at constant pressure and is oftenreported in units of cal/(g •°C). Heat capacity is often incorrectly termed specific heat where specific heat is theratio of the heat capacity of a material to the heat capacity of water, consequently having no units. The confu-sion between heat capacity and specific heat generally comes from the fact that these values are essentiallythe same since the heat capacity of water is ~1.0.
1 = = 1BTUlb • °F
calg • °C
CP(graphite) = x xCP (sapphire)WS
WG
DS
DG
Typical Specific Heat of Various MaterialsMaterial Heat Capacity Heat Capacity
Range cal/(g⋅°C) Range J/(g⋅°K) Gold 0.031 0.13 Platinum 0.031 0.13 Tungsten 0.034 0.14 Tungsten Carbide 0.04 0.17 Silver 0.056 0.23 Brass 0.090 0.38 Nickel 0.091 - 0.14 0.38 – 0.59 Copper 0.092 0.38 Steel (Wrought) 0.11 0.46 Iron (Cast) 0.13 0.54 Graphite 0.17 0.72 Alumina 0.19 0.79 Aluminum 0.22 - 0.23 0.92 – 0.96 Silicon Carbide 0.285 - 0.34 1.19 – 1.42
Table 13-1
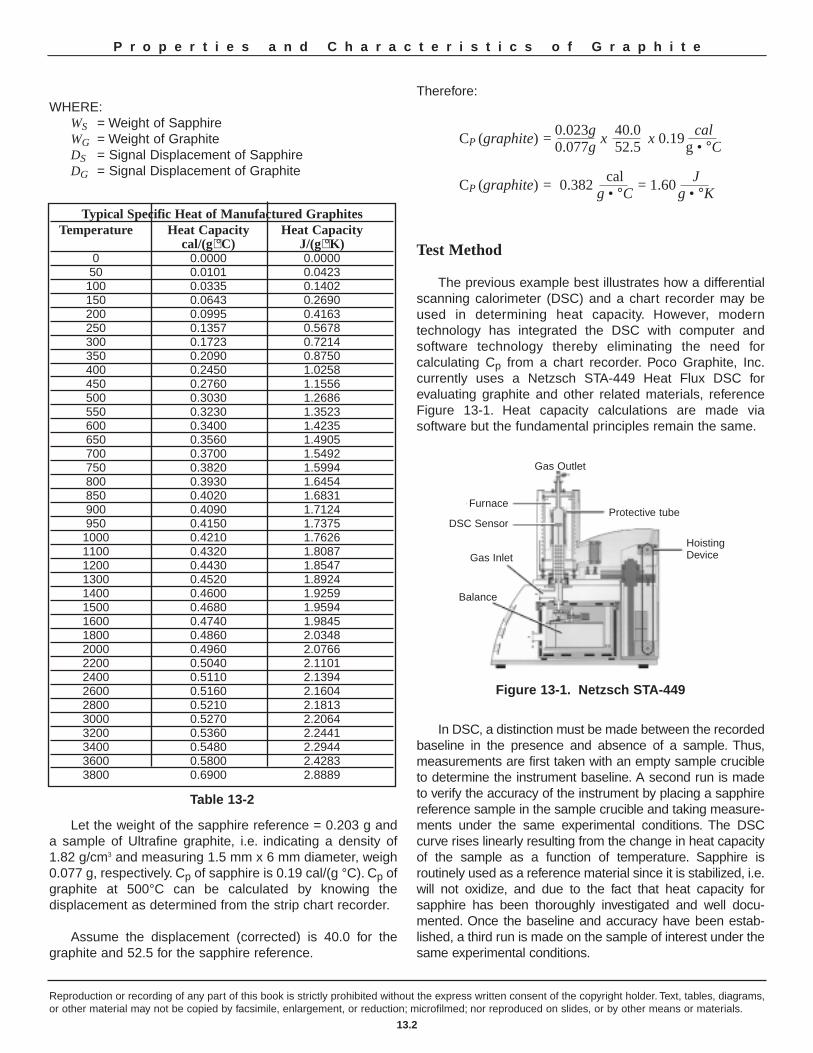
WHERE:WS = Weight of SapphireWG = Weight of GraphiteDS = Signal Displacement of SapphireDG = Signal Displacement of Graphite
Let the weight of the sapphire reference = 0.203 g anda sample of Ultrafine graphite, i.e. indicating a density of1.82 g/cm3 and measuring 1.5 mm x 6 mm diameter, weigh0.077 g, respectively. Cp of sapphire is 0.19 cal/(g °C). Cp ofgraphite at 500°C can be calculated by knowing the displacement as determined from the strip chart recorder.
Assume the displacement (corrected) is 40.0 for thegraphite and 52.5 for the sapphire reference.
Therefore:
Test Method
The previous example best illustrates how a differentialscanning calorimeter (DSC) and a chart recorder may beused in determining heat capacity. However, modern technology has integrated the DSC with computer and software technology thereby eliminating the need for calculating Cp from a chart recorder. Poco Graphite, Inc.currently uses a Netzsch STA-449 Heat Flux DSC for evaluating graphite and other related materials, referenceFigure 13-1. Heat capacity calculations are made via software but the fundamental principles remain the same.
In DSC, a distinction must be made between the recordedbaseline in the presence and absence of a sample. Thus,measurements are first taken with an empty sample crucibleto determine the instrument baseline. A second run is madeto verify the accuracy of the instrument by placing a sapphire reference sample in the sample crucible and taking measure-ments under the same experimental conditions. The DSCcurve rises linearly resulting from the change in heat capacityof the sample as a function of temperature. Sapphire is routinely used as a reference material since it is stabilized, i.e.will not oxidize, and due to the fact that heat capacity for sapphire has been thoroughly investigated and well docu-mented. Once the baseline and accuracy have been estab-lished, a third run is made on the sample of interest under thesame experimental conditions.
Typical Specific Heat of Manufactured GraphitesTemperature Heat Capacity Heat Capacity
cal/(g⋅°C) J/(g⋅°K) 0 0.0000 0.000050 0.0101 0.0423100 0.0335 0.1402150 0.0643 0.2690200 0.0995 0.4163250 0.1357 0.5678300 0.1723 0.7214350 0.2090 0.8750400 0.2450 1.0258450 0.2760 1.1556500 0.3030 1.2686550 0.3230 1.3523600 0.3400 1.4235650 0.3560 1.4905700 0.3700 1.5492750 0.3820 1.5994800 0.3930 1.6454850 0.4020 1.6831900 0.4090 1.7124950 0.4150 1.73751000 0.4210 1.76261100 0.4320 1.80871200 0.4430 1.85471300 0.4520 1.89241400 0.4600 1.92591500 0.4680 1.95941600 0.4740 1.98451800 0.4860 2.03482000 0.4960 2.07662200 0.5040 2.11012400 0.5110 2.13942600 0.5160 2.16042800 0.5210 2.18133000 0.5270 2.20643200 0.5360 2.24413400 0.5480 2.29443600 0.5800 2.42833800 0.6900 2.8889
Table 13-2
Reproduction or recording of any part of this book is strictly prohibited without the express written consent of the copyright holder. Text, tables, diagrams,or other material may not be copied by facsimile, enlargement, or reduction; microfilmed; nor reproduced on slides, or by other means or materials.
13.2
P r o p e r t i e s a n d C h a r a c t e r i s t i c s o f G r a p h i t e
CP (graphite) = x x 0.190.023g0.077g
40.052.5
calg • °C
CP (graphite) = 0.382 = 1.60cal
g • °CJ
g • °K
Figure 13-1. Netzsch STA-449
HoistingDevice
Furnace
DSC Sensor
Gas Inlet
Balance
Protective tube
Gas Outlet
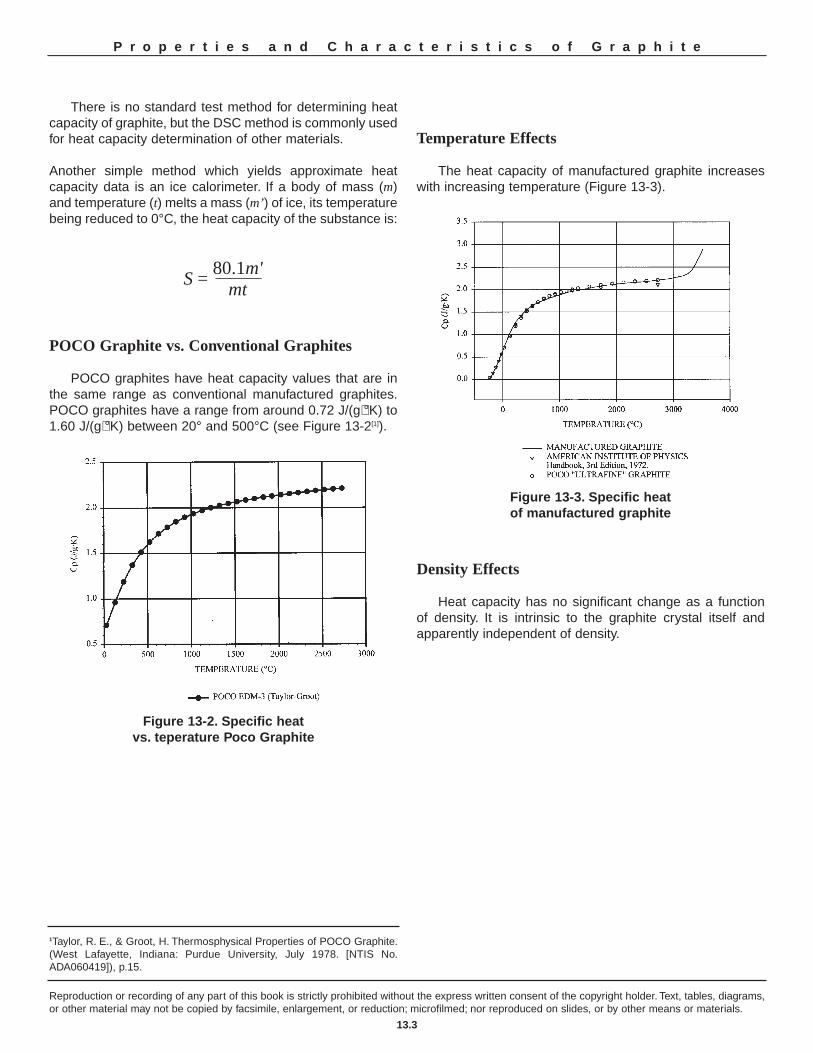
There is no standard test method for determining heatcapacity of graphite, but the DSC method is commonly usedfor heat capacity determination of other materials.
Another simple method which yields approximate heatcapacity data is an ice calorimeter. If a body of mass (m)and temperature (t) melts a mass (m’) of ice, its temperaturebeing reduced to 0°C, the heat capacity of the substance is:
POCO Graphite vs. Conventional Graphites
POCO graphites have heat capacity values that are inthe same range as conventional manufactured graphites.POCO graphites have a range from around 0.72 J/(g⋅°K) to1.60 J/(g⋅°K) between 20° and 500°C (see Figure 13-2[1]).
Temperature Effects
The heat capacity of manufactured graphite increaseswith increasing temperature (Figure 13-3).
Density Effects
Heat capacity has no significant change as a function of density. It is intrinsic to the graphite crystal itself andapparently independent of density.
Reproduction or recording of any part of this book is strictly prohibited without the express written consent of the copyright holder. Text, tables, diagrams,or other material may not be copied by facsimile, enlargement, or reduction; microfilmed; nor reproduced on slides, or by other means or materials.
13.3
P r o p e r t i e s a n d C h a r a c t e r i s t i c s o f G r a p h i t e
Figure 13-2. Specific heat vs. teperature Poco Graphite
Figure 13-3. Specific heat of manufactured graphite
1Taylor, R. E., & Groot, H. Thermosphysical Properties of POCO Graphite.(West Lafayette, Indiana: Purdue University, July 1978. [NTIS No.ADA060419]), p.15.
S =80.1m'
mt
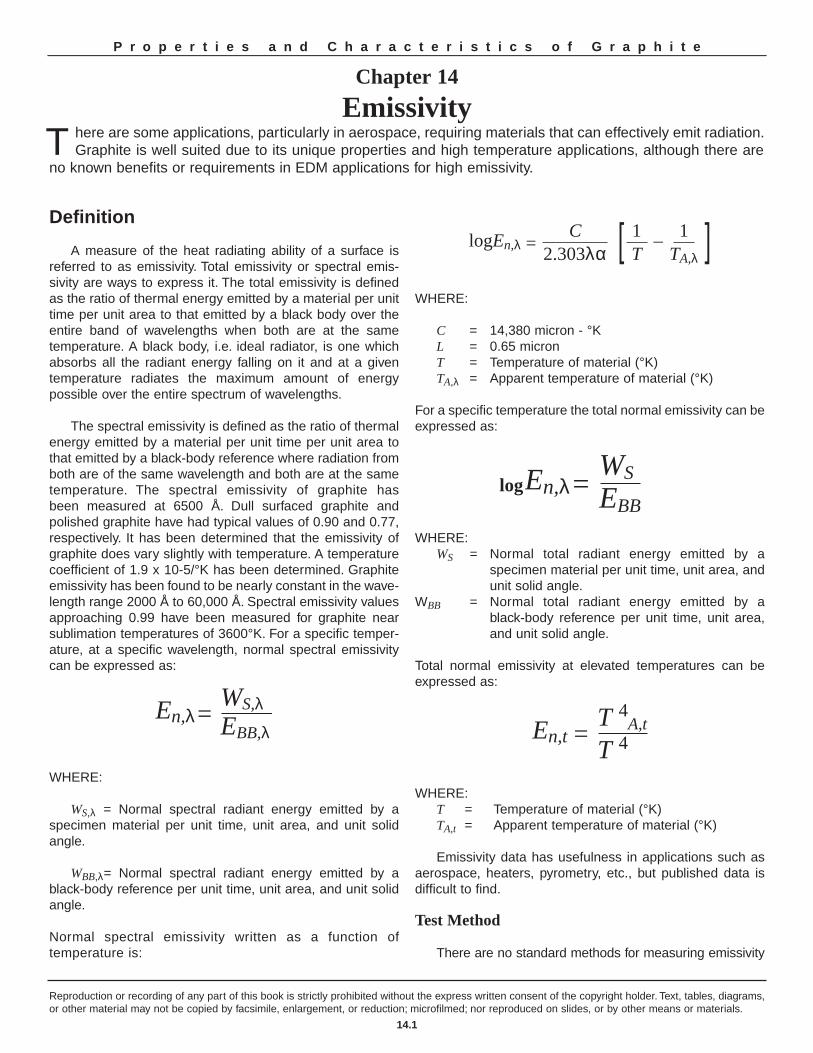
Definition
A measure of the heat radiating ability of a surface isreferred to as emissivity. Total emissivity or spectral emis-sivity are ways to express it. The total emissivity is definedas the ratio of thermal energy emitted by a material per unittime per unit area to that emitted by a black body over theentire band of wavelengths when both are at the same temperature. A black body, i.e. ideal radiator, is one whichabsorbs all the radiant energy falling on it and at a giventemperature radiates the maximum amount of energy possible over the entire spectrum of wavelengths.
The spectral emissivity is defined as the ratio of thermalenergy emitted by a material per unit time per unit area tothat emitted by a black-body reference where radiation fromboth are of the same wavelength and both are at the sametemperature. The spectral emissivity of graphite has been measured at 6500 Å. Dull surfaced graphite and polished graphite have had typical values of 0.90 and 0.77,respectively. It has been determined that the emissivity ofgraphite does vary slightly with temperature. A temperaturecoefficient of 1.9 x 10⁻⁵/°K has been determined. Graphiteemissivity has been found to be nearly constant in the wave-length range 2000 Å to 60,000 Å. Spectral emissivity valuesapproaching 0.99 have been measured for graphite nearsublimation temperatures of 3600°K. For a specific temper-ature, at a specific wavelength, normal spectral emissivitycan be expressed as:
WHERE:
WS,λ = Normal spectral radiant energy emitted by aspecimen material per unit time, unit area, and unit solidangle.
WBB,λ= Normal spectral radiant energy emitted by ablack-body reference per unit time, unit area, and unit solidangle.
Normal spectral emissivity written as a function of temperature is:
WHERE:
C = 14,380 micron - °KL = 0.65 micronT = Temperature of material (°K)TA,λ = Apparent temperature of material (°K)
For a specific temperature the total normal emissivity can beexpressed as:
WHERE:WS = Normal total radiant energy emitted by a
specimen material per unit time, unit area, and unit solid angle.
WBB = Normal total radiant energy emitted by a black-body reference per unit time, unit area,and unit solid angle.
Total normal emissivity at elevated temperatures can beexpressed as:
WHERE:T = Temperature of material (°K) TA,t = Apparent temperature of material (°K)
Emissivity data has usefulness in applications such asaerospace, heaters, pyrometry, etc., but published data isdifficult to find.
Test Method
There are no standard methods for measuring emissivity
Reproduction or recording of any part of this book is strictly prohibited without the express written consent of the copyright holder. Text, tables, diagrams,or other material may not be copied by facsimile, enlargement, or reduction; microfilmed; nor reproduced on slides, or by other means or materials.
14.1
P r o p e r t i e s a n d C h a r a c t e r i s t i c s o f G r a p h i t e
Chapter 14
EmissivityT here are some applications, particularly in aerospace, requiring materials that can effectively emit radiation.
Graphite is well suited due to its unique properties and high temperature applications, although there areno known benefits or requirements in EDM applications for high emissivity.
En,λ= WS,λEBB,λ
En,λ= WS
EBB
C2.303λα
logEn,λ = – [ ]1TA,λ
1T
En,t = T 4A,t
T 4
log
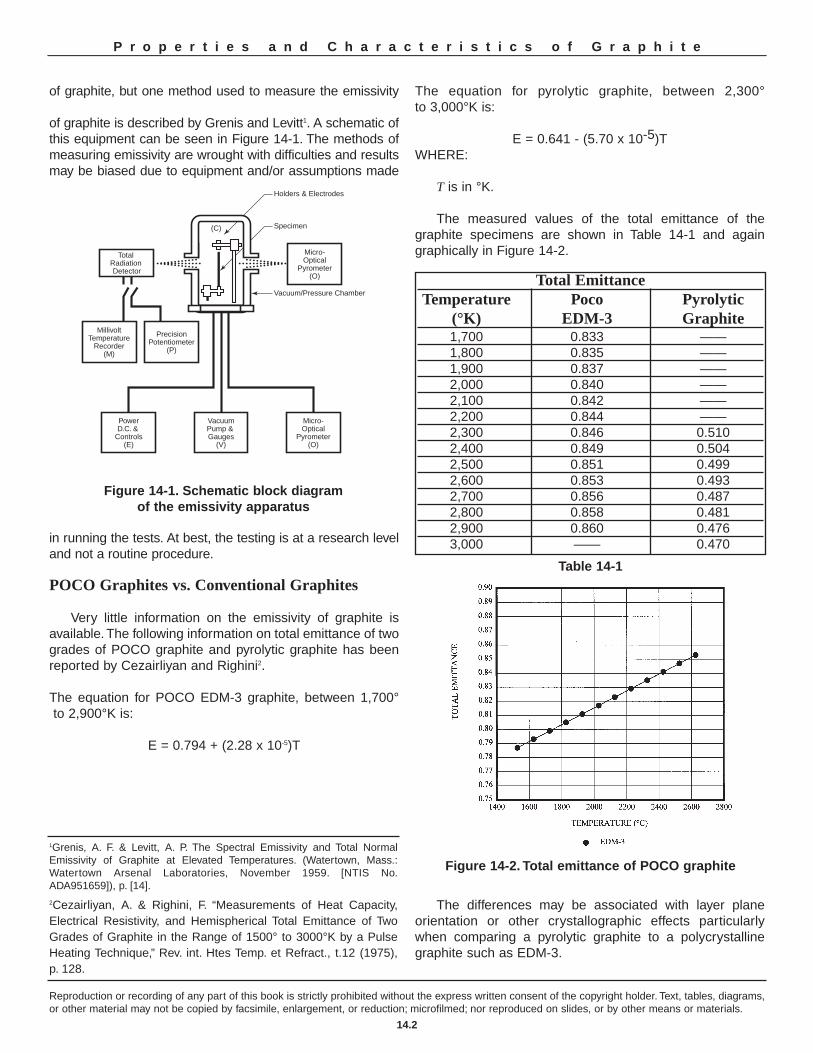
of graphite, but one method used to measure the emissivity
of graphite is described by Grenis and Levitt1. A schematic ofthis equipment can be seen in Figure 14-1. The methods ofmeasuring emissivity are wrought with difficulties and resultsmay be biased due to equipment and/or assumptions made
in running the tests. At best, the testing is at a research leveland not a routine procedure.
POCO Graphites vs. Conventional Graphites
Very little information on the emissivity of graphite is available. The following information on total emittance of twogrades of POCO graphite and pyrolytic graphite has beenreported by Cezairliyan and Righini2.
The equation for POCO EDM-3 graphite, between 1,700°to 2,900°K is:
E = 0.794 + (2.28 x 10⁻⁵)T
The equation for pyrolytic graphite, between 2,300°to 3,000°K is:
E = 0.641 - (5.70 x 10⁻⁵)TWHERE:
T is in °K.
The measured values of the total emittance of thegraphite specimens are shown in Table 14-1 and againgraphically in Figure 14-2.
The differences may be associated with layer plane orientation or other crystallographic effects particularlywhen comparing a pyrolytic graphite to a polycrystallinegraphite such as EDM-3.
Reproduction or recording of any part of this book is strictly prohibited without the express written consent of the copyright holder. Text, tables, diagrams,or other material may not be copied by facsimile, enlargement, or reduction; microfilmed; nor reproduced on slides, or by other means or materials.
14.2
P r o p e r t i e s a n d C h a r a c t e r i s t i c s o f G r a p h i t e
2Cezairliyan, A. & Righini, F. “Measurements of Heat Capacity,Electrical Resistivity, and Hemispherical Total Emittance of TwoGrades of Graphite in the Range of 1500° to 3000°K by a PulseHeating Technique,” Rev. int. Htes Temp. et Refract., t.12 (1975), p. 128.
Figure 14-2. Total emittance of POCO graphite
Total Emittance Temperature Poco Pyrolytic
(°K) EDM-3 Graphite1,700 0.833 —— 1,800 0.835 —— 1,900 0.837 —— 2,000 0.840 —— 2,100 0.842 —— 2,200 0.844 —— 2,300 0.846 0.510 2,400 0.849 0.504 2,500 0.851 0.499 2,600 0.853 0.493 2,700 0.856 0.487 2,800 0.858 0.481 2,900 0.860 0.476 3,000 —— 0.470
(C)
Total Radiation Detector
MillivoltTemperature
Recorder(M)
Micro-Optical
Pyrometer(O)
Holders & Electrodes
Specimen
Vacuum/Pressure Chamber
Micro-Optical
Pyrometer(O)
VacuumPump & Gauges
(V)
PowerD.C. &
Controls(E)
PrecisionPotentiometer
(P)
Figure 14-1. Schematic block diagram of the emissivity apparatus
Table 14-1
1Grenis, A. F. & Levitt, A. P. The Spectral Emissivity and Total NormalEmissivity of Graphite at Elevated Temperatures. (Watertown, Mass.:Watertown Arsenal Laboratories, November 1959. [NTIS No.ADA951659]), p. [14].
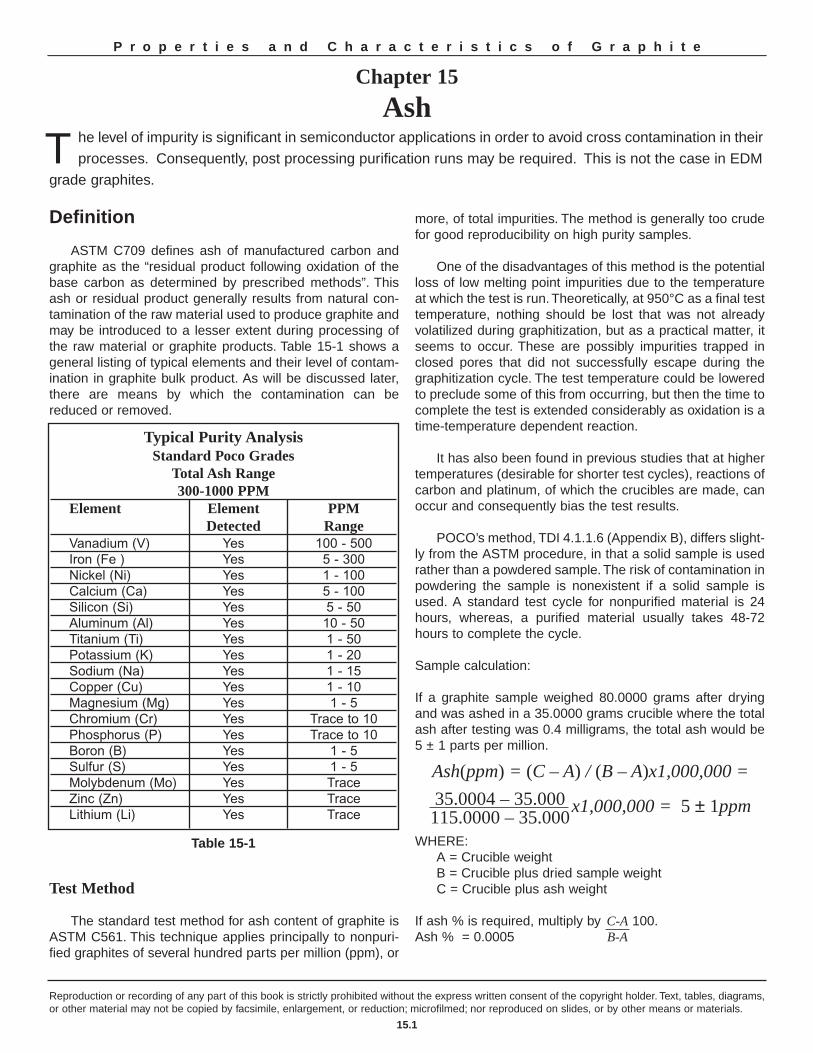
Definition
ASTM C709 defines ash of manufactured carbon andgraphite as the “residual product following oxidation of thebase carbon as determined by prescribed methods”. Thisash or residual product generally results from natural con-tamination of the raw material used to produce graphite andmay be introduced to a lesser extent during processing ofthe raw material or graphite products. Table 15-1 shows ageneral listing of typical elements and their level of contam-ination in graphite bulk product. As will be discussed later,there are means by which the contamination can bereduced or removed.
Test Method
The standard test method for ash content of graphite isASTM C561. This technique applies principally to nonpuri-fied graphites of several hundred parts per million (ppm), or
more, of total impurities. The method is generally too crudefor good reproducibility on high purity samples.
One of the disadvantages of this method is the potentialloss of low melting point impurities due to the temperatureat which the test is run. Theoretically, at 950°C as a final testtemperature, nothing should be lost that was not alreadyvolatilized during graphitization, but as a practical matter, itseems to occur. These are possibly impurities trapped inclosed pores that did not successfully escape during thegraphitization cycle. The test temperature could be loweredto preclude some of this from occurring, but then the time tocomplete the test is extended considerably as oxidation is atime-temperature dependent reaction.
It has also been found in previous studies that at highertemperatures (desirable for shorter test cycles), reactions ofcarbon and platinum, of which the crucibles are made, canoccur and consequently bias the test results.
POCO’s method, TDI 4.1.1.6 (Appendix B), differs slight-ly from the ASTM procedure, in that a solid sample is usedrather than a powdered sample. The risk of contamination inpowdering the sample is nonexistent if a solid sample isused. A standard test cycle for nonpurified material is 24hours, whereas, a purified material usually takes 48-72hours to complete the cycle.
Sample calculation:
If a graphite sample weighed 80.0000 grams after dryingand was ashed in a 35.0000 grams crucible where the totalash after testing was 0.4 milligrams, the total ash would be5 ± 1 parts per million.
WHERE:A = Crucible weightB = Crucible plus dried sample weightC = Crucible plus ash weight
If ash % is required, multiply by 100.Ash % = 0.0005
Reproduction or recording of any part of this book is strictly prohibited without the express written consent of the copyright holder. Text, tables, diagrams,or other material may not be copied by facsimile, enlargement, or reduction; microfilmed; nor reproduced on slides, or by other means or materials.
15.1
P r o p e r t i e s a n d C h a r a c t e r i s t i c s o f G r a p h i t e
Chapter 15
Ash
T he level of impurity is significant in semiconductor applications in order to avoid cross contamination in their
processes. Consequently, post processing purification runs may be required. This is not the case in EDM
grade graphites.
Typical Purity AnalysisStandard Poco Grades
Total Ash Range300-1000 PPM
Element Element PPMDetected Range
Vanadium (V) Yes 100 - 500 Iron (Fe ) Yes 5 - 300 Nickel (Ni) Yes 1 - 100 Calcium (Ca) Yes 5 - 100 Silicon (Si) Yes 5 - 50 Aluminum (Al) Yes 10 - 50 Titanium (Ti) Yes 1 - 50 Potassium (K) Yes 1 - 20 Sodium (Na) Yes 1 - 15 Copper (Cu) Yes 1 - 10 Magnesium (Mg) Yes 1 - 5 Chromium (Cr) Yes Trace to 10 Phosphorus (P) Yes Trace to 10 Boron (B) Yes 1 - 5 Sulfur (S) Yes 1 - 5 Molybdenum (Mo) Yes Trace Zinc (Zn) Yes Trace Lithium (Li) Yes Trace
Table 15-1
Ash(ppm) = (C – A) / (B – A)x1,000,000 =
x1,000,000 = 5 ± 1ppm35.0004 – 35.000115.0000 – 35.000
C-AB-A
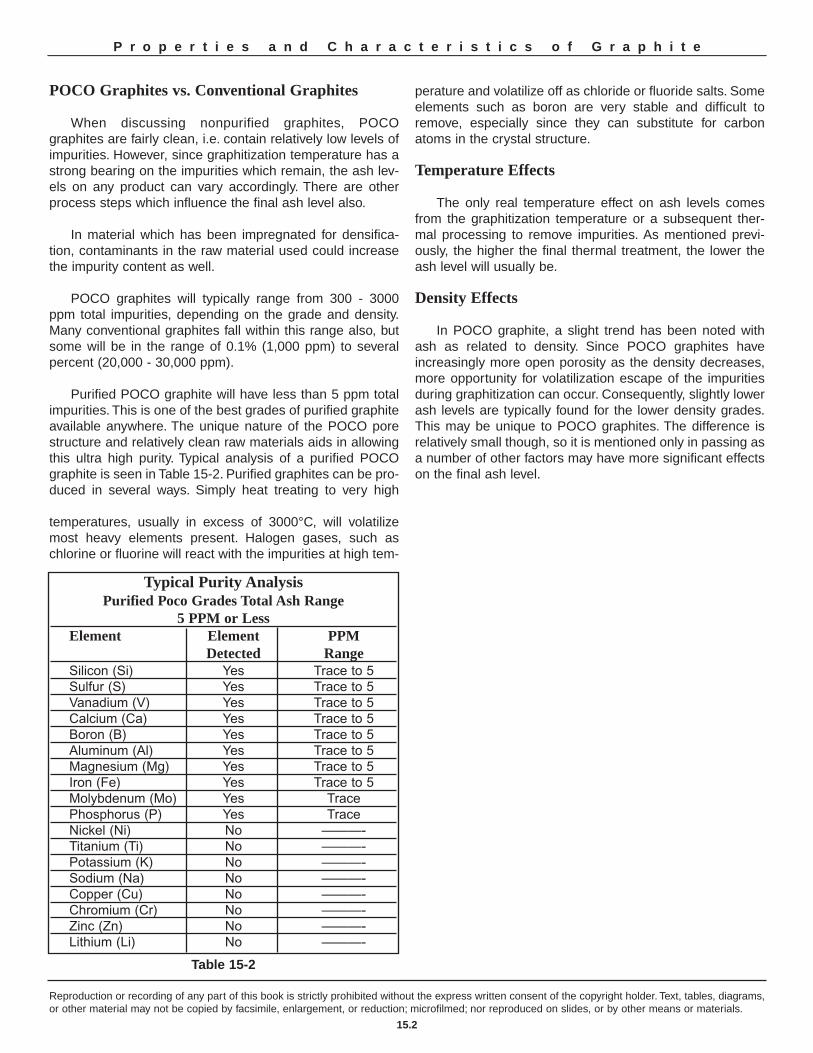
POCO Graphites vs. Conventional Graphites
When discussing nonpurified graphites, POCOgraphites are fairly clean, i.e. contain relatively low levels ofimpurities. However, since graphitization temperature has astrong bearing on the impurities which remain, the ash lev-els on any product can vary accordingly. There are otherprocess steps which influence the final ash level also.
In material which has been impregnated for densifica-tion, contaminants in the raw material used could increasethe impurity content as well.
POCO graphites will typically range from 300 - 3000ppm total impurities, depending on the grade and density.Many conventional graphites fall within this range also, butsome will be in the range of 0.1% (1,000 ppm) to severalpercent (20,000 - 30,000 ppm).
Purified POCO graphite will have less than 5 ppm totalimpurities. This is one of the best grades of purified graphiteavailable anywhere. The unique nature of the POCO porestructure and relatively clean raw materials aids in allowingthis ultra high purity. Typical analysis of a purified POCOgraphite is seen in Table 15-2. Purified graphites can be pro-duced in several ways. Simply heat treating to very high
temperatures, usually in excess of 3000°C, will volatilizemost heavy elements present. Halogen gases, such aschlorine or fluorine will react with the impurities at high tem-
perature and volatilize off as chloride or fluoride salts. Someelements such as boron are very stable and difficult toremove, especially since they can substitute for carbonatoms in the crystal structure.
Temperature Effects
The only real temperature effect on ash levels comesfrom the graphitization temperature or a subsequent ther-mal processing to remove impurities. As mentioned previ-ously, the higher the final thermal treatment, the lower theash level will usually be.
Density Effects
In POCO graphite, a slight trend has been noted withash as related to density. Since POCO graphites haveincreasingly more open porosity as the density decreases,more opportunity for volatilization escape of the impuritiesduring graphitization can occur. Consequently, slightly lowerash levels are typically found for the lower density grades.This may be unique to POCO graphites. The difference isrelatively small though, so it is mentioned only in passing asa number of other factors may have more significant effectson the final ash level.
Reproduction or recording of any part of this book is strictly prohibited without the express written consent of the copyright holder. Text, tables, diagrams,or other material may not be copied by facsimile, enlargement, or reduction; microfilmed; nor reproduced on slides, or by other means or materials.
15.2
P r o p e r t i e s a n d C h a r a c t e r i s t i c s o f G r a p h i t e
Typical Purity AnalysisPurified Poco Grades Total Ash Range
5 PPM or LessElement Element PPM
Detected RangeSilicon (Si) Yes Trace to 5 Sulfur (S) Yes Trace to 5 Vanadium (V) Yes Trace to 5 Calcium (Ca) Yes Trace to 5 Boron (B) Yes Trace to 5 Aluminum (Al) Yes Trace to 5 Magnesium (Mg) Yes Trace to 5 Iron (Fe) Yes Trace to 5 Molybdenum (Mo) Yes Trace Phosphorus (P) Yes Trace Nickel (Ni) No ———- Titanium (Ti) No ———- Potassium (K) No ———- Sodium (Na) No ———- Copper (Cu) No ———- Chromium (Cr) No ———- Zinc (Zn) No ———- Lithium (Li) No ———-
Table 15-2
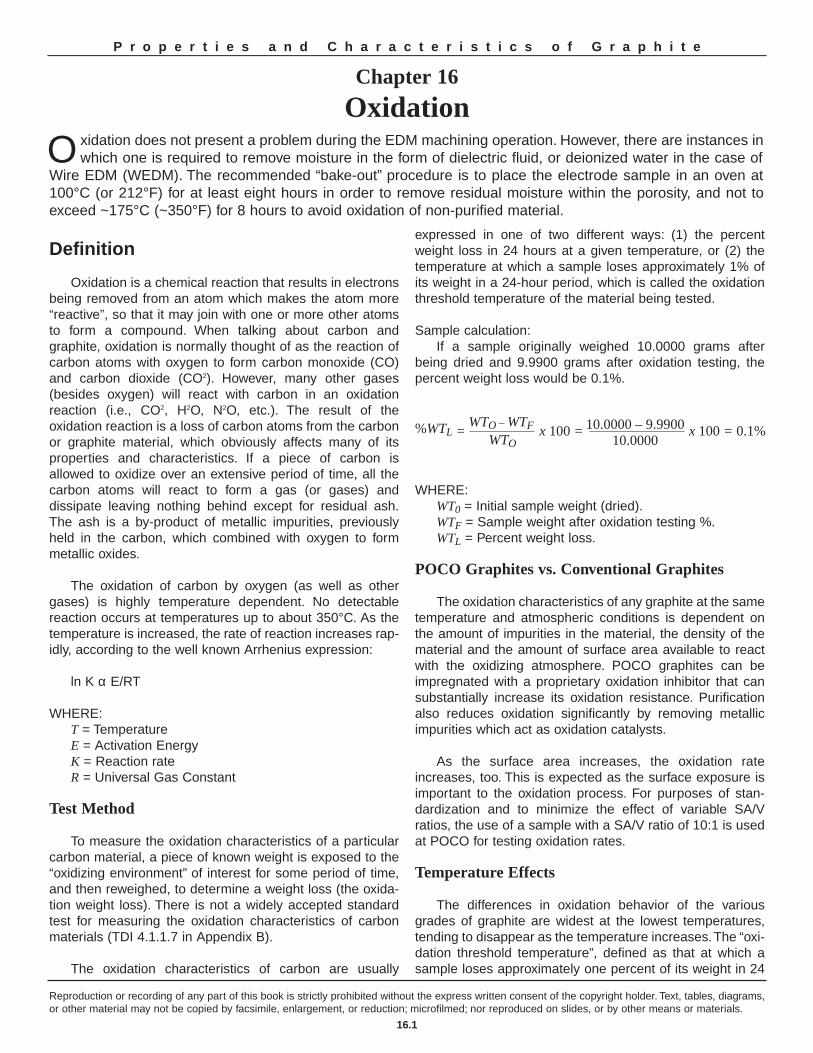
Definition
Oxidation is a chemical reaction that results in electronsbeing removed from an atom which makes the atom more“reactive”, so that it may join with one or more other atomsto form a compound. When talking about carbon andgraphite, oxidation is normally thought of as the reaction ofcarbon atoms with oxygen to form carbon monoxide (CO)and carbon dioxide (CO2). However, many other gases(besides oxygen) will react with carbon in an oxidation reaction (i.e., CO2, H2O, N2O, etc.). The result of the oxidation reaction is a loss of carbon atoms from the carbonor graphite material, which obviously affects many of itsproperties and characteristics. If a piece of carbon isallowed to oxidize over an extensive period of time, all thecarbon atoms will react to form a gas (or gases) and dissipate leaving nothing behind except for residual ash.The ash is a by-product of metallic impurities, previouslyheld in the carbon, which combined with oxygen to formmetallic oxides.
The oxidation of carbon by oxygen (as well as othergases) is highly temperature dependent. No detectablereaction occurs at temperatures up to about 350°C. As thetemperature is increased, the rate of reaction increases rap-idly, according to the well known Arrhenius expression:
ln K α E/RT
WHERE:T = TemperatureE = Activation Energy K = Reaction rateR = Universal Gas Constant
Test Method
To measure the oxidation characteristics of a particularcarbon material, a piece of known weight is exposed to the“oxidizing environment” of interest for some period of time,and then reweighed, to determine a weight loss (the oxida-tion weight loss). There is not a widely accepted standardtest for measuring the oxidation characteristics of carbonmaterials (TDI 4.1.1.7 in Appendix B).
The oxidation characteristics of carbon are usually
expressed in one of two different ways: (1) the percentweight loss in 24 hours at a given temperature, or (2) thetemperature at which a sample loses approximately 1% ofits weight in a 24-hour period, which is called the oxidationthreshold temperature of the material being tested.
Sample calculation:If a sample originally weighed 10.0000 grams after
being dried and 9.9900 grams after oxidation testing, thepercent weight loss would be 0.1%.
WHERE:WT0 = Initial sample weight (dried).WTF = Sample weight after oxidation testing %.WTL = Percent weight loss.
POCO Graphites vs. Conventional Graphites
The oxidation characteristics of any graphite at the sametemperature and atmospheric conditions is dependent onthe amount of impurities in the material, the density of thematerial and the amount of surface area available to reactwith the oxidizing atmosphere. POCO graphites can beimpregnated with a proprietary oxidation inhibitor that cansubstantially increase its oxidation resistance. Purificationalso reduces oxidation significantly by removing metallicimpurities which act as oxidation catalysts.
As the surface area increases, the oxidation rateincreases, too. This is expected as the surface exposure isimportant to the oxidation process. For purposes of stan-dardization and to minimize the effect of variable SA/Vratios, the use of a sample with a SA/V ratio of 10:1 is usedat POCO for testing oxidation rates.
Temperature Effects
The differences in oxidation behavior of the variousgrades of graphite are widest at the lowest temperatures,tending to disappear as the temperature increases.The “oxi-dation threshold temperature”, defined as that at which asample loses approximately one percent of its weight in 24
Reproduction or recording of any part of this book is strictly prohibited without the express written consent of the copyright holder. Text, tables, diagrams,or other material may not be copied by facsimile, enlargement, or reduction; microfilmed; nor reproduced on slides, or by other means or materials.
16.1
P r o p e r t i e s a n d C h a r a c t e r i s t i c s o f G r a p h i t e
Chapter 16
Oxidation
Oxidation does not present a problem during the EDM machining operation. However, there are instances inwhich one is required to remove moisture in the form of dielectric fluid, or deionized water in the case of
Wire EDM (WEDM). The recommended “bake-out” procedure is to place the electrode sample in an oven at100°C (or 212°F) for at least eight hours in order to remove residual moisture within the porosity, and not toexceed ~175°C (~350°F) for 8 hours to avoid oxidation of non-purified material.
%WTL = x 100 = x 100 = 0.1%WTO – WTF
WTO
10.0000 – 9.990010.0000
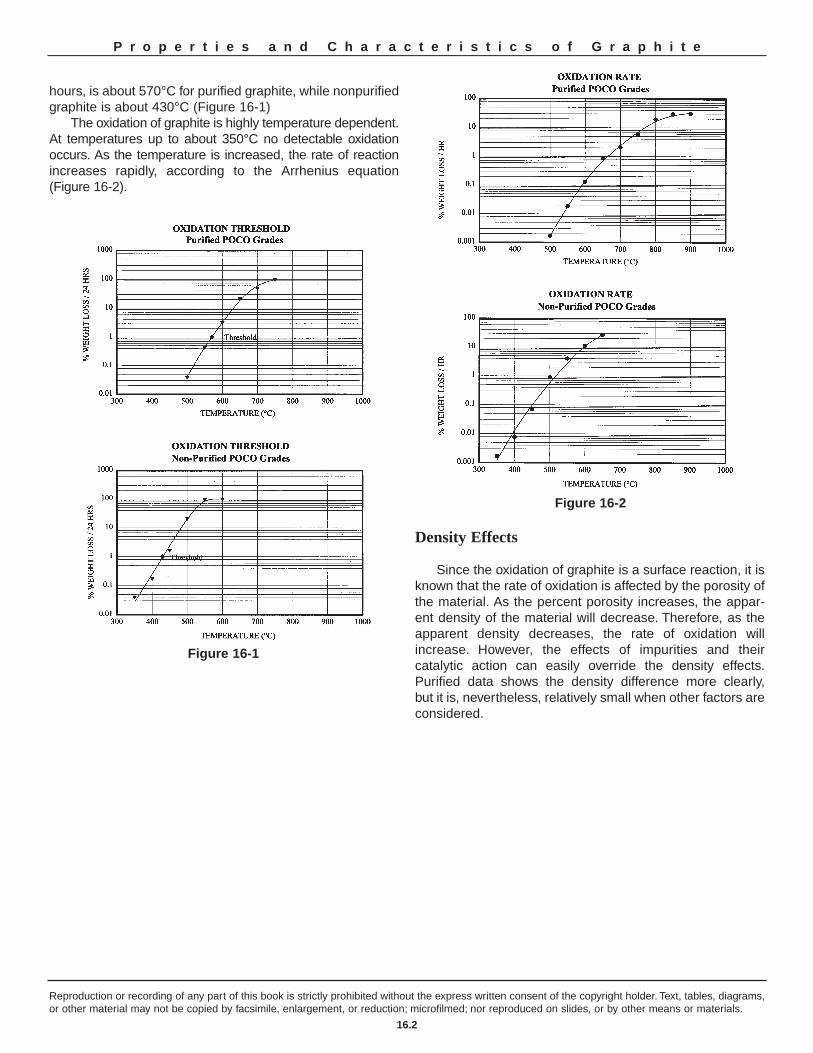
hours, is about 570°C for purified graphite, while nonpurifiedgraphite is about 430°C (Figure 16-1)
The oxidation of graphite is highly temperature dependent.At temperatures up to about 350°C no detectable oxidationoccurs. As the temperature is increased, the rate of reactionincreases rapidly, according to the Arrhenius equation (Figure 16-2).
Density Effects
Since the oxidation of graphite is a surface reaction, it isknown that the rate of oxidation is affected by the porosity ofthe material. As the percent porosity increases, the appar-ent density of the material will decrease. Therefore, as theapparent density decreases, the rate of oxidation willincrease. However, the effects of impurities and their catalytic action can easily override the density effects.Purified data shows the density difference more clearly, but it is, nevertheless, relatively small when other factors areconsidered.
Reproduction or recording of any part of this book is strictly prohibited without the express written consent of the copyright holder. Text, tables, diagrams,or other material may not be copied by facsimile, enlargement, or reduction; microfilmed; nor reproduced on slides, or by other means or materials.
16.2
P r o p e r t i e s a n d C h a r a c t e r i s t i c s o f G r a p h i t e
Figure 16-1
Figure 16-2
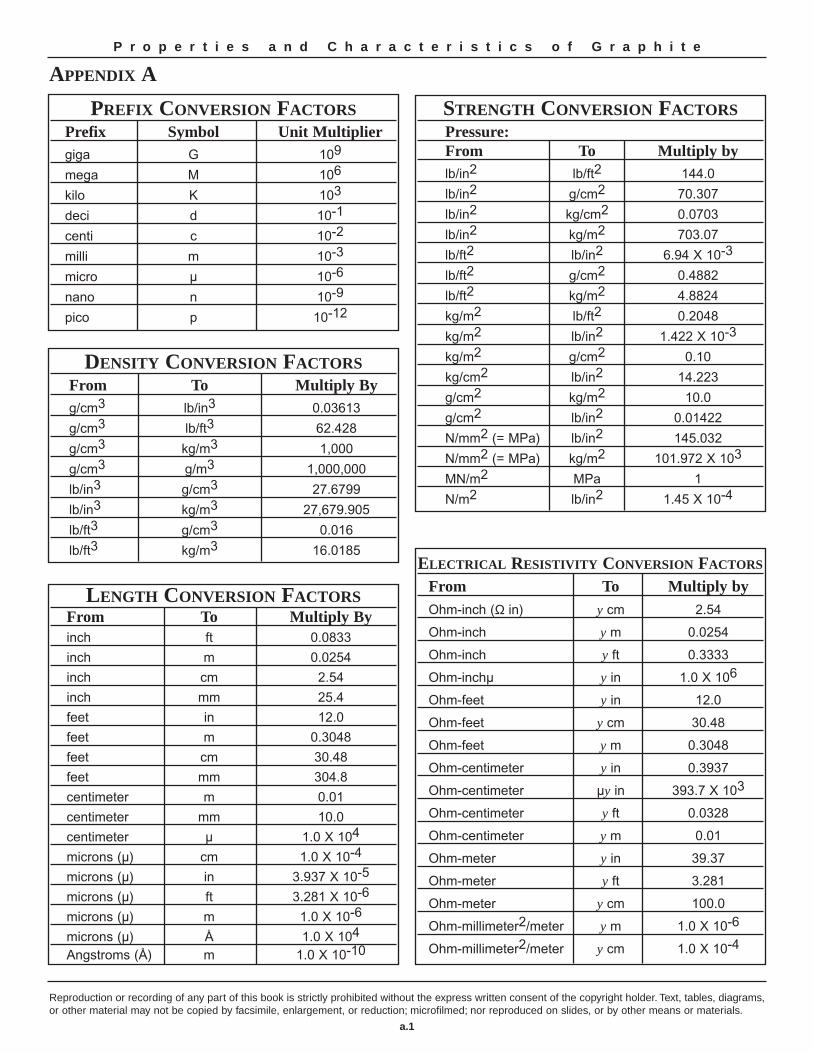
P r o p e r t i e s a n d C h a r a c t e r i s t i c s o f G r a p h i t e
Reproduction or recording of any part of this book is strictly prohibited without the express written consent of the copyright holder. Text, tables, diagrams,or other material may not be copied by facsimile, enlargement, or reduction; microfilmed; nor reproduced on slides, or by other means or materials.
a.1
PREFIX CONVERSION FACTORSPrefix Symbol Unit Multiplier giga G 109
mega M 106
kilo K 103
deci d 10-1
centi c 10-2
milli m 10-3
micro µ 10-6
nano n 10-9
pico p 10-12
DENSITY CONVERSION FACTORSFrom To Multiply By g/cm3 lb/in3 0.03613
g/cm3 lb/ft3 62.428
g/cm3 kg/m3 1,000
g/cm3 g/m3 1,000,000
lb/in3 g/cm3 27.6799
lb/in3 kg/m3 27,679.905
lb/ft3 g/cm3 0.016
lb/ft3 kg/m3 16.0185
LENGTH CONVERSION FACTORSFrom To Multiply By inch ft 0.0833
inch m 0.0254
inch cm 2.54
inch mm 25.4
feet in 12.0
feet m 0.3048
feet cm 30.48
feet mm 304.8
centimeter m 0.01
centimeter mm 10.0
centimeter µ 1.0 X 10⁴
microns (µ) cm 1.0 X 10⁻⁴
microns (µ) in 3.937 X 10⁻⁵
microns (µ) ft 3.281 X 10⁻⁶
microns (µ) m 1.0 X 10⁻⁶
microns (µ) Å 1.0 X 10⁴
Angstroms (Å) m 1.0 X 10⁻¹⁰
APPENDIX A
STRENGTH CONVERSION FACTORSPressure:From To Multiply by lb/in2 lb/ft2 144.0
lb/in2 g/cm2 70.307
lb/in2 kg/cm2 0.0703
lb/in2 kg/m2 703.07
lb/ft2 lb/in2 6.94 X 10⁻³
lb/ft2 g/cm2 0.4882
lb/ft2 kg/m2 4.8824
kg/m2 lb/ft2 0.2048
kg/m2 lb/in2 1.422 X 10⁻³
kg/m2 g/cm2 0.10
kg/cm2 lb/in2 14.223
g/cm2 kg/m2 10.0
g/cm2 lb/in2 0.01422
N/mm2 (= MPa) lb/in2 145.032
N/mm2 (= MPa) kg/m2 101.972 X 10³
MN/m2 MPa 1
N/m2 lb/in2 1.45 X 10⁻⁴
ELECTRICAL RESISTIVITY CONVERSION FACTORS
From To Multiply by Ohm-inch (Ω in) y cm 2.54
Ohm-inch y m 0.0254
Ohm-inch y ft 0.3333
Ohm-inchµ y in 1.0 X 10⁶
Ohm-feet y in 12.0
Ohm-feet y cm 30.48
Ohm-feet y m 0.3048
Ohm-centimeter y in 0.3937
Ohm-centimeter µy in 393.7 X 10³
Ohm-centimeter y ft 0.0328
Ohm-centimeter y m 0.01
Ohm-meter y in 39.37
Ohm-meter y ft 3.281
Ohm-meter y cm 100.0
Ohm-millimeter2/meter y m 1.0 X 10⁻⁶
Ohm-millimeter2/meter y cm 1.0 X 10⁻⁴
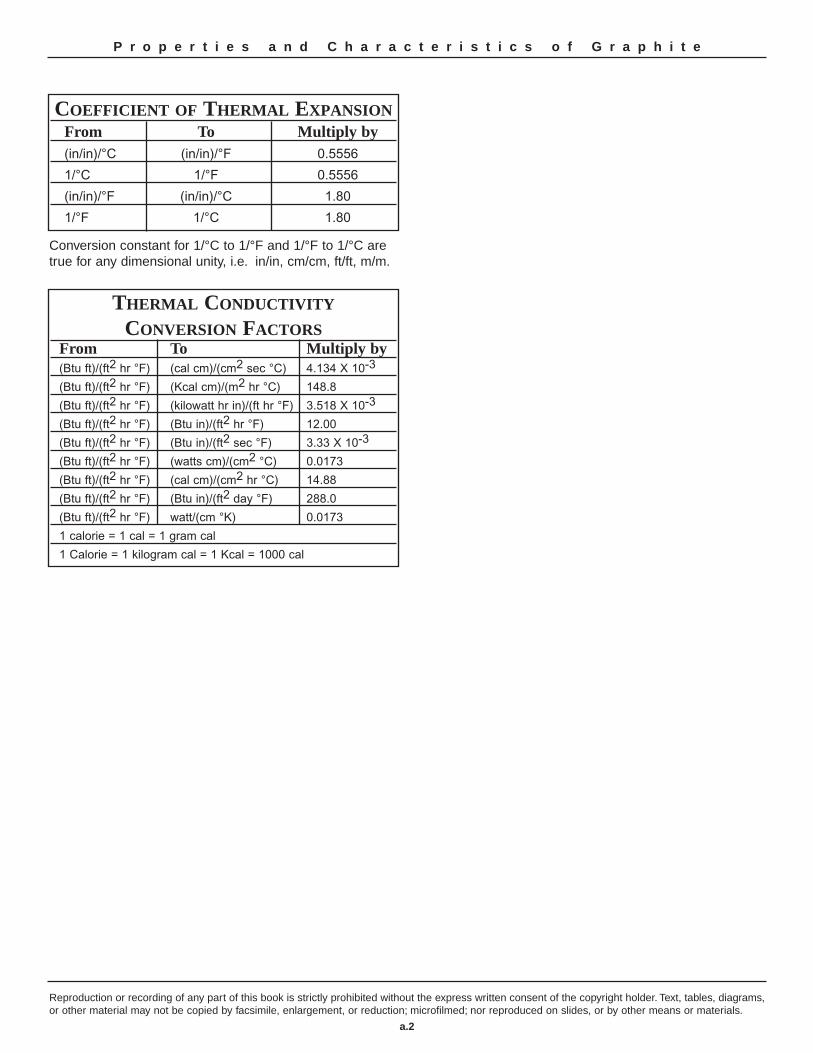
Reproduction or recording of any part of this book is strictly prohibited without the express written consent of the copyright holder. Text, tables, diagrams,or other material may not be copied by facsimile, enlargement, or reduction; microfilmed; nor reproduced on slides, or by other means or materials.
a.2
P r o p e r t i e s a n d C h a r a c t e r i s t i c s o f G r a p h i t e
COEFFICIENT OF THERMAL EXPANSIONFrom To Multiply by (in/in)/°C (in/in)/°F 0.5556
1/°C 1/°F 0.5556
(in/in)/°F (in/in)/°C 1.80
1/°F 1/°C 1.80
Conversion constant for 1/°C to 1/°F and 1/°F to 1/°C aretrue for any dimensional unity, i.e. in/in, cm/cm, ft/ft, m/m.
THERMAL CONDUCTIVITY
CONVERSION FACTORSFrom To Multiply by (Btu ft)/(ft2 hr °F) (cal cm)/(cm2 sec °C) 4.134 X 10⁻³
(Btu ft)/(ft2 hr °F) (Kcal cm)/(m2 hr °C) 148.8
(Btu ft)/(ft2 hr °F) (kilowatt hr in)/(ft hr °F) 3.518 X 10⁻³
(Btu ft)/(ft2 hr °F) (Btu in)/(ft2 hr °F) 12.00
(Btu ft)/(ft2 hr °F) (Btu in)/(ft2 sec °F) 3.33 X 10⁻³
(Btu ft)/(ft2 hr °F) (watts cm)/(cm2 °C) 0.0173
(Btu ft)/(ft2 hr °F) (cal cm)/(cm2 hr °C) 14.88
(Btu ft)/(ft2 hr °F) (Btu in)/(ft2 day °F) 288.0
(Btu ft)/(ft2 hr °F) watt/(cm °K) 0.0173
1 calorie = 1 cal = 1 gram cal
1 Calorie = 1 kilogram cal = 1 Kcal = 1000 cal
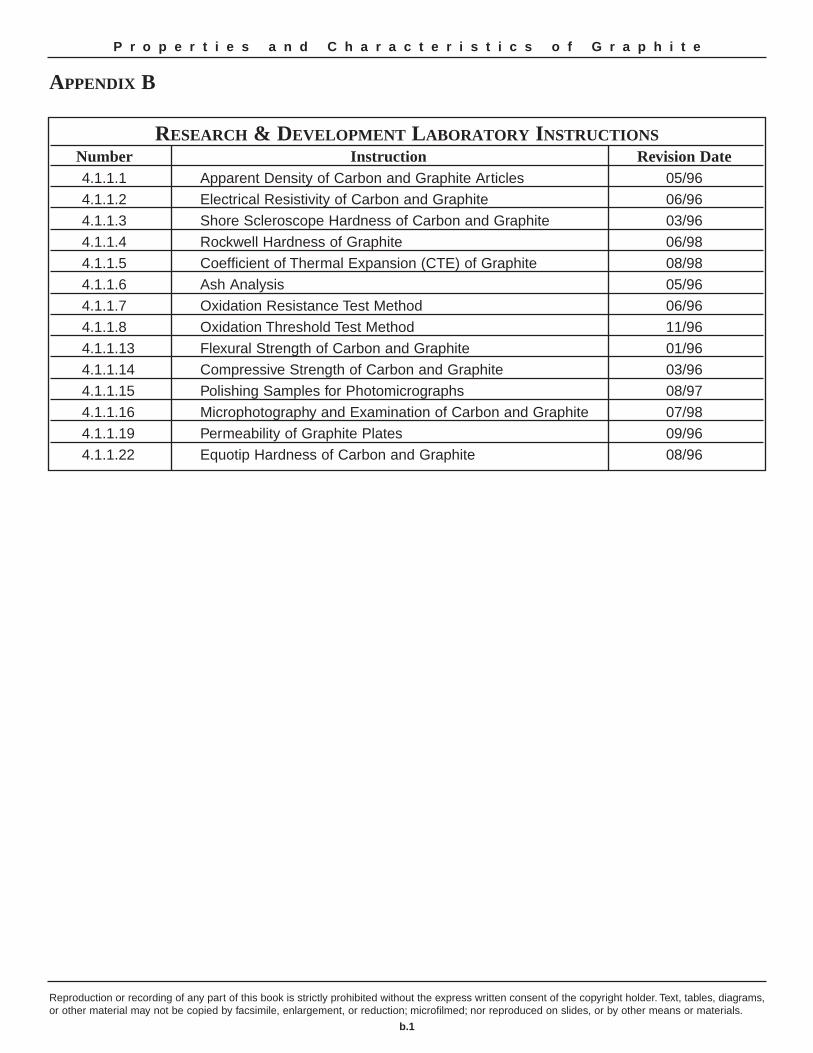
P r o p e r t i e s a n d C h a r a c t e r i s t i c s o f G r a p h i t e
Reproduction or recording of any part of this book is strictly prohibited without the express written consent of the copyright holder. Text, tables, diagrams,or other material may not be copied by facsimile, enlargement, or reduction; microfilmed; nor reproduced on slides, or by other means or materials.
b.1
APPENDIX B
RESEARCH & DEVELOPMENT LABORATORY INSTRUCTIONSNumber Instruction Revision Date 4.1.1.1 Apparent Density of Carbon and Graphite Articles 05/96
4.1.1.2 Electrical Resistivity of Carbon and Graphite 06/96
4.1.1.3 Shore Scleroscope Hardness of Carbon and Graphite 03/96
4.1.1.4 Rockwell Hardness of Graphite 06/98
4.1.1.5 Coefficient of Thermal Expansion (CTE) of Graphite 08/98
4.1.1.6 Ash Analysis 05/96
4.1.1.7 Oxidation Resistance Test Method 06/96
4.1.1.8 Oxidation Threshold Test Method 11/96
4.1.1.13 Flexural Strength of Carbon and Graphite 01/96
4.1.1.14 Compressive Strength of Carbon and Graphite 03/96
4.1.1.15 Polishing Samples for Photomicrographs 08/97
4.1.1.16 Microphotography and Examination of Carbon and Graphite 07/98
4.1.1.19 Permeability of Graphite Plates 09/96
4.1.1.22 Equotip Hardness of Carbon and Graphite 08/96

APPENDIX C BIBLIOGRAPHY
Campbell, I. E., & Sherwood, E. M. High TemperatureMaterials and Technology. New York: John Wiley & Sons,Inc., 1967.
Cezairliyan, A. & Righini, F. “Measurements of HeatCapacity, Electrical Resistivity, and Hemisherical TotalEmittance of Two Grades of Graphite in the Range of 1500°to 3000°K by a Pulse Heating Technique.” Rev. int. HtesTemp. et Refract. t.12 (1975), 124-131.
Grenis, A. F., & Levitt, A. P. The Spectral Emissivity and TotalNormal Emissivity of Graphite at Elevated Temperatures.Watertown, Mass.: Watertown Arsenal Laboratories,November, 1959. (NTIS No. ADA951659)
Hasselman, D. P. H., Becher, P. F., Mazdiyasni, K. S.“Analysis of the Resistance of High-E, Low-E BrittleComposites to Failure by Thermal Shock.” Z. Werkstofftech.11 (1980), 82-92.
The Industrial Graphite Engineering Handbook. New York:Union Carbide Corporation, 1969.
Kelly, B. T. Physics of Graphite. London: Applied SciencePublishers LTD, 1981.
Kennedy, A. J. Graphite as a Structured Material inConditions of High Thermal Flux. Cranfield: The College ofAeronautics, November 1959. (CoA Report No. 121)
King, Charles R. “Development of an ExperimentalTechnique to Thermally Shock Graphites.” Carbon. 8 (1970),479-484.
Kingery, W. D. Introduction to Ceramics. New York: JohnWiley & Sons, Inc., 1960.
Kingery, W. D. J. Am. Cer. Soc. 38 (1955).
Lockyer, G. E., Lenoe, E. M., Schultz, A. W. Investigation ofNondestructive Methods for the Evaluation of GraphiteMaterials. Lowell, Mass.: AVCO Corporation, September1966. (AFML-TR-66-101)
“Materials Selector 1987.” Materials Engineering. Cleveland,Ohio: Penton Publishing, December 1986.
Reynolds, W. N. Physical Properties of Graphite.Amsterdam: Elsevier Publishing Co. LTD., 1968.
Rossi, R. C. “Thermal-Shock Resistant Materials.” MaterialsScience Research. 5 (1971), 12-136.
Sato, S., Hwaji, H., Kawamata, K., & Kon, J. “Resistance
and Fracture Toughness Against Thermal Shock of SeveralVarieties of Graphite.” The 22nd Japan Congress onMaterials Research - Metallic Materials. Mito, Japan: March1979.
Sato, S., Sato, K., Imamura, Y., & Kon, J. Carbon. 13 (1975).
Taylor, R. E., & Groot, H. Thermophysical Properties ofPOCO Graphite. West Lafayette, Indiana: Purdue University,July 1978. (NTIS No. ADA060419)
Walker, P. L. Jr. Chemistry and Physics of Carbon. New York:Marcel Dekker, Inc., Vols.1-7, 1965-1971.
Walker, P. L. Jr. & Thrower, P. A. Chemistry and Physics ofCarbon. New York: Marcel Dekker, Inc., Vols.8-17, 1973-1981.
Wirt, William. “Specific Heat of POCO Graphite AXF-5Q atSeveral Temperatures Between 30°-500°C.” (Job No. 84-826Prepared for Maxwell Laboratories). Analytical ServiceCenter, September 18, 1984.
Zhao, J., Wood, J. L., Bradt, A.C., & Walker, P. L. Jr.“Oxidation Effects on CTE and Thermal Shock FractureInitiation in Polycrystalline Graphites.” Carbon. 19 No.6,(1981), 405-408.
E. Fitzer, K.-H. K6chling, H.P. Boehm, and H. Marsh,“Recommended Terminology for the Description of Carbonas a Solid”, Pure and Applied Chemistry, 67, 473-506(1995).
R. Loison, P. Foch and A. Boyer, in “Coke: Quality andProduction”, Butterworths, London (1989).
Henry Petroski, in “The Pencil- A History of Design andCircumstance”, Alfred A. Knopf, New York (1990).
E.A. Heintz, “The Characterization of Petroleum Cokes”,Carbon, 34, 699-709 (1996).
M. Serlie and H.A. Oye, in “Cathodes in AluminiumElectrolysis”, 2nd Edition, Dusseldorf, Germany, Aluminium-Verlag (1994).
“Anodes of the Aluminium Industry”, R&D Carbon Ltd., P.O.Box 157,CH-3960, Sierre, Switzerland.
H. Marsh and M.-A. Diez, in “Liquid Crystalline andMesomorphic Polymers”, Eds. V.P. Shibaev and L. Lam, Ch.7., Mesophase of Graphitizable Carbons, Springer-Verlag,New York, 231-257 (1994).
J.D. Brooks and G.H. Taylor, “The Formation of someGraphitizing Carbons”, Chemistry and Physics of Carbon,
Reproduction or recording of any part of this book is strictly prohibited without the express written consent of the copyright holder. Text, tables, diagrams,or other material may not be copied by facsimile, enlargement, or reduction; microfilmed; nor reproduced on slides, or by other means or materials.
c.1
P r o p e r t i e s a n d C h a r a c t e r i s t i c s o f G r a p h i t e
Ed. P.L. Walker, Jr., Marcel Dekker, New York, 4, 243-283(1968).
F.P. Bundy, W.A. Bassett, M.S. Weathers, R.J. Hemley, H.K.Mao and A.F. Goncharov, The Pressure-Temperature Phaseand Transformation Diagram for Carbon; Updated Through1994, Carbon, 34, 141-153, (1996).
Y. Matsumura, S. Wang and J. Mondori, “Interactionsbetween Disordered Carbon and Lithium Ion RechargeableBatteries”, Carbon, 33, 1457-1462 (1995).
Y. Liu, J.S. Xue, T. Zheng and J.R. Dahn, “Mechanism ofLithium Insertion in Hard Carbons Prepared by Pyrolysis ofEpoxy Resins”, Carbon, 34, 193-200 (1996).
J.S. Xue and J.R. Dahn, “Dramatic Effect of Oxidation onLithium Insertion in Carbons Made from Epoxy Resins”, J.Electrochem. Soc., 142, 3668-3677 (1995).
Reproduction or recording of any part of this book is strictly prohibited without the express written consent of the copyright holder. Text, tables, diagrams,or other material may not be copied by facsimile, enlargement, or reduction; microfilmed; nor reproduced on slides, or by other means or materials.
c.2
P r o p e r t i e s a n d C h a r a c t e r i s t i c s o f G r a p h i t e