pocket guide to south africa 2010/2011: agriculture, forestry and
TRANSCRIPT

Pocket Guide to South Africa 2010/11 AGRICULTURE, FORESTRY AND FISHERIES
111
AGRICULTURE, FORESTRY AND FISHERIES

112
Pocket Guide to South Africa 2010/11 AGRICULTURE, FORESTRY AND FISHERIES
112
High-potential arable land comprises only 22% of total arable land. About 12% of the country’s surface area can be used for crop production. Some 1,3 million hectares (ha) are under irrigation.
Agricultural activities range from intensive crop production and mixed farming to cattle ranching in the bushveld, and sheep farming in the more arid regions.
The Department of Agriculture, Forestry and Fisheries is responsible for production and resource management; agricul-tural support services; trade and economic development; food safety and biosecurity; forestry; and marine aquaculture.
Economic contributionPrimary agriculture contributes about 3% to South Africa’s gross domestic product (GDP) and about 7% to formal employment. However, there are strong linkages into the economy, so that the agro-industrial sector comprises about 12% of GDP.
For the past five years, agricultural exports have contrib-uted on average about 6,5% of total South African exports. Exports increased from 5% (1988) to 46% (2009) of agricul-tural production.
The largest export groups are wine, citrus, maize, grapes, sugar, apples, pears and quinces. Other important export products are undermatured ethyl alcohol, avocados, pineapples, dates, preserved fruit and nuts, as well as hides and skins.
ProductionProducer prices of agricultural products increased on average by 2,6% from 2008 to 2009. The weighted average price of field crops dropped by 7,4%. This was mainly the result of lower prices received for winter grains, oilseeds, summer grains, dry beans and cotton, which decreased by 24,3%; 20,7%; 9,5%; 8,4%; and 5,8%, respectively. Prices of vegetables, fruit and viticultural products increased by 42,3%; 6,8%; and 1,8%; respectively.
The weighted average price of animal products was 6,2% higher in 2009 than in 2008. Prices received for poultry and slaughtered stock increased by 12,9% and 3,7%, respec-tively, while the average price of pastoral products and dairy products decreased by 4,5% and 2,4%, respectively.
The demand for meat remained strong and meat prices increased between 8% and 15%.

113
Poc
ket
Gui
de t
o So
uth
Afr
ica
2010
/11
AG
RIC
ULT
UR
E,
FO
RE
ST
RY
AN
D F
ISH
ER
IES
Pocket Guide to South Africa 2010/11 AGRICULTURE, FORESTRY AND FISHERIES
The prices of milk and most dairy products decreased in 2009 due to the surplus production of raw milk in 2008 and a slump in international dairy prices.
Gross value of agricultural production, 2009 (R’000)
Source: Directorate: Agricultural Statistics, Department of Agriculture, Forestry and Fisheries
Field cropsMaize 16 346Wheat 3 057Hay 3 198Grain sorghum 474Sugar cane 4 769Groundnuts 715Tobacco 262Sunflower seed 2 378Cotton 80Other 3 178Total 34 457HorticultureViticulture 3 297Citrus fruit 4 628Subtropical fruit 2 030Deciduous and other fruit 8 040Vegetables 7 843Potatoes 4 058Other 1 890Total 31 786Animal productsWool 1 234Poultry and poultry products 23 165Cattle and cattle products 12 808Sheep and goats slaughtered 3 107Pigs slaughtered 3 126Milk 9 138Other 10 291Total 62 869Grand total 129 112

114
Pocket Guide to South Africa 2010/11 AGRICULTURE, FORESTRY AND FISHERIES
Field crops and horticultureThe gross income from field crops decreased by 21,2%, from R40 306 million in 2008 to R31 768 million in 2009. This was mainly a result of a decrease of income from maize, wheat and sunflower seed by 25,2%; 45,1%; and 38,6%; respectively.• Maize is the largest locally produced field crop, and the most
important source of carbohydrates in the Southern African Development Community (SADC) for animal and human consumption. South Africa is the main maize producer in the SADC region, with an average production of about 9,7 Mt a year over the past 10 years. It is estimated that more than 8 000 commercial maize producers are responsible for the major part of the South African crop, while the rest is produced by thousands of small-scale producers. Maize is produced mainly in North West, the Free State and Mpumalanga. A total of 12,6 Mt of maize was produced in the 2008/09 on 2,9 million ha of land (non-commercial agriculture included).
• Wheat is produced in the Western Cape and the Free State. In 2009, 1,96 Mt were produced on 642 500 ha of land.
• South Africa is the world’s 12th-largest producer of sunflower seed. An area of 636 800 ha was planted in 2008/09, producing 801 000 t.
• There are about 35 300 sugar-cane growers in South Africa, the majority of whom are small, medium and micro-enter-prises (SMMEs) and who collectively farm 391 483 ha of sugar cane. Sugar-cane farms vary in size and subsistence farms average 1,7 ha, while family owned farms average 186 ha.
• South Africa is the leading exporter of protea cut flowers, which account for more than half of proteas sold on the world market.
iIn June 2010, President Jacob Zuma launched the Masibuyele Emasimini mechanisation scheme, a food-production intens-ification programme, at Marapyane Village in Mpumalanga.
This project affords black farmers a realistic chance to improve production, increase yields and gain access to domestic and global markets. The project also ensures the utilisation of fallow land and seeks to resuscitate collapsed land-reform projects.
By March 2010, a further increase in the productive land as a result of Masibuyele Emasimini indicated a coverage of 36 223 ha of land. In all, 42 430 households are benefiting from this intervention.

115
Poc
ket
Gui
de t
o So
uth
Afr
ica
2010
/11
AG
RIC
ULT
UR
E,
FO
RE
ST
RY
AN
D F
ISH
ER
IES
Pocket Guide to South Africa 2010/11 AGRICULTURE, FORESTRY AND FISHERIES
Some other crops• Deciduous fruit is grown mainly in the Western Cape and in
the Langkloof Valley in the Eastern Cape. Smaller produc-tion areas are found along the Orange River and in the Free State, Mpumalanga and Gauteng.
• The gross income from field crops decreased by 21,2%, from R40 306 million in 2008 to R31 768 million in 2009, because of a decrease of income from maize, wheat and sunflower seed by 25,2%; 45,1%; and 38,6%; respectively. These decreases were the result of both a drop in produc-tion and lower prices received by farmers.
• Citrus production is largely limited to irrigation areas and takes place in Limpopo (16 255 ha), Mpumalanga (11 681 ha), the Eastern Cape (12 923 ha), KwaZulu-Natal (4 004 ha), the Western Cape (9 524 ha) and Northern Cape (639 ha). In 2009, income from citrus showed a decrease of 20,7% and amounted to R4 628 million. In 2009, South Africa produced 655 156 t of subtropical fruit, which were 73 950 t or 10,1% more than in 2008.
• The third crop estimate made by producer cellars and viticulturists in the various regions during February 2010, showed a decrease of more than 62 000 t compared to the January 2010 estimate. The 2010 crop was estimated to amount to 1 243 449 t – a decrease of 6,5% and in effect 86 908 t less than the 2009 crop and 182 164 t less than the 2008 record crop.
Maize 12 567Wheat 1 928Sugar cane 20 411Grain sorghum 318Groundnuts 113Sunflower seed 833Deciduous and other soft fruit 1 829Citrus fruit 2 218 Subtropical fruit 655Vegetables 2 442Potatoes 1 819
Production of important field crops and horticultural products, 2009 (’000 t)
Source: Directorate: Agricultural Statistics, Department of Agriculture, Forestry and Fisheries
116
Pocket Guide to South Africa 2010/11 AGRICULTURE, FORESTRY AND FISHERIES
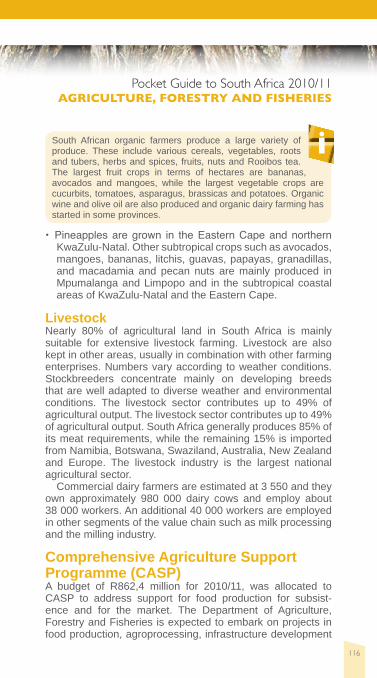
• Pineapples are grown in the Eastern Cape and northern KwaZulu-Natal. Other subtropical crops such as avocados, mangoes, bananas, litchis, guavas, papayas, granadillas, and macadamia and pecan nuts are mainly produced in Mpumalanga and Limpopo and in the subtropical coastal areas of KwaZulu-Natal and the Eastern Cape.
LivestockNearly 80% of agricultural land in South Africa is mainly suitable for extensive livestock farming. Livestock are also kept in other areas, usually in combination with other farming enterprises. Numbers vary according to weather conditions. Stockbreeders concentrate mainly on developing breeds that are well adapted to diverse weather and environmental conditions. The livestock sector contributes up to 49% of agricultural output. The livestock sector contributes up to 49% of agricultural output. South Africa generally produces 85% of its meat requirements, while the remaining 15% is imported from Namibia, Botswana, Swaziland, Australia, New Zealand and Europe. The livestock industry is the largest national agricultural sector.
Commercial dairy farmers are estimated at 3 550 and they own approximately 980 000 dairy cows and employ about 38 000 workers. An additional 40 000 workers are employed in other segments of the value chain such as milk processing and the milling industry.
Comprehensive Agriculture Support Programme (CASP)A budget of R862,4 million for 2010/11, was allocated to CASP to address support for food production for subsist-ence and for the market. The Department of Agriculture, Forestry and Fisheries is expected to embark on projects in food production, agroprocessing, infrastructure development
iSouth African organic farmers produce a large variety of produce. These include various cereals, vegetables, roots and tubers, herbs and spices, fruits, nuts and Rooibos tea. The largest fruit crops in terms of hectares are bananas, avocados and mangoes, while the largest vegetable crops are cucurbits, tomatoes, asparagus, brassicas and potatoes. Organic wine and olive oil are also produced and organic dairy farming has started in some provinces.

117
Poc
ket
Gui
de t
o So
uth
Afr
ica
2010
/11
AG
RIC
ULT
UR
E,
FO
RE
ST
RY
AN
D F
ISH
ER
IES
Pocket Guide to South Africa 2010/11 AGRICULTURE, FORESTRY AND FISHERIES
(water, dams, irrigation systems and fencing), cooperatives and stokvels (social economy) as well as the green economy (agro-ecology). CASP outputs for the 2010/11 financial year included the establishment of 1 739 food-security projects; creation of 760 jobs; and training and improvement of knowledge and skills of 5 089 beneficiaries to ensure that 7 961 on- and off-farm infrastructure targets were completed and were functioning.
Climate changeThe Department of Agriculture, Forestry and Fisheries is a major role player in climate-change activities within the agricul-tural sector. The department has several climate change- related policies and programmes. These are in addition to the Disaster Management Act, 2002 and the National Disaster Risk-Management Framework, 2005, which address agricul-tural risk-management and climate change. The department’s climate-change programmes and policies are aligned with South Africa’s National Climate-Change Response Policy. The Climate Change Sector Plan for Agriculture (Working Paper, April 2008) outlines measures of addressing agricul-tural sector challenges, namely creating awareness of climate change and the effects of climate change; improving knowledge on climate change; increasing capacity to respond to climate-change impacts; research; and funding research projects.
ForestryIn terms of land use, the area under forestry is about 1,257 million ha or about 1% of the total South African land
iBy mid-2010, the implementation of the Micro-Agricultural Financial Institutional Scheme of South Africa (Mafisa) was on course with eight accredited institutions operating as intermediaries retailing Mafisa loans. In the 2009/10 financial year, R56 million was disbursed as production loans for, among other things, livestock, grains, vegetables, poultry and sugar-cane production activities.
Funded projects include cotton and groundnut farmers in the Taung irrigation scheme in North West; vegetable projects in Nwanedi, Limpopo; sugar-cane farmers in KwaZulu-Natal; and livestock projects in the Northern Cape. Various job opportunities were created and to fast-track service delivery, a Mafisa call centre was established to assist with information dissemination.

118
Pocket Guide to South Africa 2010/11 AGRICULTURE, FORESTRY AND FISHERIES
area of 122,3 million ha. The forestry sector (forestry and forest products) contributes about 1% to GDP. In terms of regional GDP, forestry in KwaZulu-Natal contributes 4,7%; in Mpumalanga 5,5%; and about 0,8% in Limpopo.
The export of forest products increased from R9,5 billion in 2001 to R12,5 billion in 2009. The forestry sector employed around 170 000 people in 2009. The forestry subsector provided about 77 000 direct jobs and 30 000 indirect jobs. The pulp and paper subsector provided approximately 13 000 direct and 11 000 indirect employment opportunities. Some 20 000 workers were employed in sawmilling, 6 000 in the timber board and 2 200 in the mining timber subsectors, while another 11 000 workers were employed in miscellaneous jobs in the forestry sector. In 2008, the total investment in the forestry industry amounted to R18,8 billion. This investment comprised 56,2% in trees; 24,6% in land; 11,6% in roads; 6,2% in fixed assets; and 1,4% in moveable assets. Regarding the investment in the forest products sector by type of processing plant for 2008, the total book value of investments amounted to R15,8 billion. This investment comprised 84,7% in pulp and board plants; 10,2% in sawmills and veneer plants; 0,7% in pole plants; 0,3% in mining timber; and 4,1% other plants.
Indigenous forestsThere are about 530 000 ha of indigenous or natural forests in the country, which occur mainly along the southern and eastern escarpment, the coastal belt and in sheltered kloofs or ravines.
There has been an increase in the use of natural forests as sources of medicine, building material, fuel wood and food.
iSouth Africa has 183 primary wood-processing plants, 180 of which are owned by the private sector and three of which are owned by local and state authorities. Of these, 102 are sawmills; 13 are mining-timber sawmills; 44 are pole-treating plants; 19 are pulp, paper and board mills; one is a match factory; and four are charcoal plants.
The total roundwood intake into these processing plants in 2008 was 19,6 million m3, valued at R6 billion. The value of sales of timber products produced by these primary processing plants totalled R21,4 billion. Some R15,8 billion was invested in primary roundwood-processing plants (at book value). At market value, this increased to an estimated R40 billion.
119
Poc
ket
Gui
de t
o So
uth
Afr
ica
2010
/11
AG
RIC
ULT
UR
E,
FO
RE
ST
RY
AN
D F
ISH
ER
IES
Pocket Guide to South Africa 2010/11 AGRICULTURE, FORESTRY AND FISHERIES
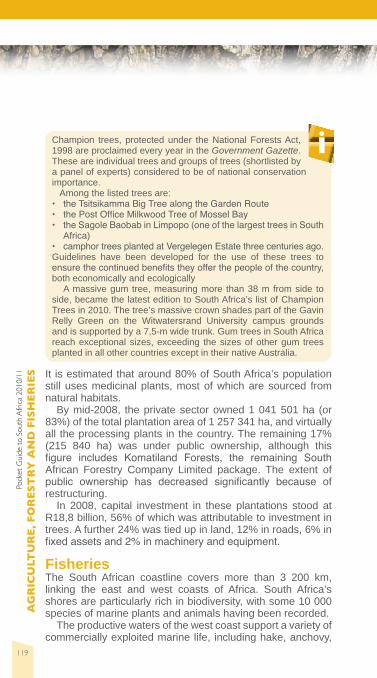
It is estimated that around 80% of South Africa’s population still uses medicinal plants, most of which are sourced from natural habitats.
By mid-2008, the private sector owned 1 041 501 ha (or 83%) of the total plantation area of 1 257 341 ha, and virtually all the processing plants in the country. The remaining 17% (215 840 ha) was under public ownership, although this figure includes Komatiland Forests, the remaining South African Forestry Company Limited package. The extent of public ownership has decreased significantly because of restructuring.
In 2008, capital investment in these plantations stood at R18,8 billion, 56% of which was attributable to investment in trees. A further 24% was tied up in land, 12% in roads, 6% in fixed assets and 2% in machinery and equipment.
FisheriesThe South African coastline covers more than 3 200 km, linking the east and west coasts of Africa. South Africa’s shores are particularly rich in biodiversity, with some 10 000 species of marine plants and animals having been recorded.
The productive waters of the west coast support a variety of commercially exploited marine life, including hake, anchovy,
iChampion trees, protected under the National Forests Act, 1998 are proclaimed every year in the Government Gazette. These are individual trees and groups of trees (shortlisted by a panel of experts) considered to be of national conservation importance.
Among the listed trees are:• the Tsitsikamma Big Tree along the Garden Route• the Post Office Milkwood Tree of Mossel Bay• the Sagole Baobab in Limpopo (one of the largest trees in South
Africa)• camphor trees planted at Vergelegen Estate three centuries ago.Guidelines have been developed for the use of these trees to ensure the continued benefits they offer the people of the country, both economically and ecologically
A massive gum tree, measuring more than 38 m from side to side, became the latest edition to South Africa’s list of Champion Trees in 2010. The tree’s massive crown shades part of the Gavin Relly Green on the Witwatersrand University campus grounds and is supported by a 7,5-m wide trunk. Gum trees in South Africa reach exceptional sizes, exceeding the sizes of other gum trees planted in all other countries except in their native Australia.

120
Pocket Guide to South Africa 2010/11 AGRICULTURE, FORESTRY AND FISHERIES
sardine, horse mackerel, tuna, snoek, rock lobster and abalone.
On the east coast, squid, linefish and a wide range of intertidal resources provide an important source of food and livelihood for coastal communities. Marine life that is not harvested, such as whales, dolphins and seabirds, is increasingly recognised as a valuable resource for nature-based tourism.
The South African fishing industry, which was once concen-trated in the hands of a few, largely white-owned companies, has under gone intensive transformation over the past few years.
South Africa has a well-established fishery sector and is a net exporter of fishery products. However, most of South African fisheries are considered to be fully utilised and high-value fisheries such as abalone, prawns and linefish are largely overexploited.
The country also has a well-developed fisheries manage-ment system and is one of the leading countries in the implementation of an ecosystem approach for fisheries management. South Africa plays an important role interna-tionally, in the regional fisheries management organisations and regional programmes such as the Benguela Current Commission and other related programmes.
The programme aims to promote the equitable and sustain-able management and efficient use of marine living resources.
The South African coast provides substantial opportunities for economic and social development. However, it is a resource at risk from inappropriate developments, pollution, poaching and over use. The Department of Agriculture, Forestry and Fisheries plans to look at the economic prospects for marine culture, namely the husbanding and harvesting of sea plants for economic purposes.
The department plans to reduce the degradation of the marine environment through policies that promote conserva-tion and sustainable use of marine living resources. It also aims to restore and maintain productive capacity and biodiver-sity of the marine environment and protect human health.
The projected increase in demand for high-end fishery products provides an opportunity for substantial increases in aquaculture production.
iSouth Africa’s national tree, the yellowwood tree (Podacarpus), can grow to a height of more than 40 m with a girth of 8 m, and can live for up to 800 years.

121
Poc
ket
Gui
de t
o So
uth
Afr
ica
2010
/11
AG
RIC
ULT
UR
E,
FO
RE
ST
RY
AN
D F
ISH
ER
IES
Pocket Guide to South Africa 2010/11 AGRICULTURE, FORESTRY AND FISHERIES
South Africa’s commercial fishery industry is valued at about R2 billion annually and employs about 27 000 people.
The total annual fish production from marine fisheries is more than 600 000 t. Given the market trends, South Africa’s environmental potential for aquaculture and the state of development of its industry, production could grow from the level of 3 543 t (worth R218 million) to more than 90 000 t (worth R2,4 billion) over the next 10 to 20 years.
The fishing industry has an annual turnover of about R80 billion and contributes 0,5% to the GDP.
In 2010, a policy review process was developed and implemented for fishing rights allocations in the commercial sector. A strategy was also put in place for abalone and hake fishing.
122
Pocket Guide to South Africa 2010/11 AGRICULTURE, FORESTRY AND FISHERIES