pmoc report - honoluluhartdocs.honolulu.gov/docushare/dsweb/get/document-17013/20140814... · pmoc...
TRANSCRIPT
PMOC REPORT
2014 Risk Refresh
Honolulu Rail Transit Project
Honolulu Authority for Rapid Transportation (HART) City and County of Honolulu
Honolulu, HI
July 2014 (FINAL)
PMOC Contract Number: DTFT60-09-D-00012 Task Order Number 5 Work Order Number 9 Project No. DC-27-5140 OPs Referenced: OP 1, OP 32C, 33, 34, 40 Jacobs Engineering Group, Inc., 501 North Broadway, St. Louis, MO 63102 Tim Mantych, P.E., (314) 335-4454, [email protected] Length of Time Assigned: Five Years (November 18, 2009 through November 17, 2014)

Honolulu Rail Transit Project PMOC Report – 2014 Risk Refresh July 2014 (FINAL)
i
TABLE OF CONTENTS TABLE OF CONTENTS .............................................................................................................. i LIST OF TABLES ........................................................................................................................ ii LIST OF FIGURES ...................................................................................................................... ii LIST OF APPENDICES ............................................................................................................. iii
1.0 EXECUTIVE SUMMARY .............................................................................................. 4 1.1 Introduction ..............................................................................................................4 1.2 PMOC Review .........................................................................................................4 1.3 Findings/Recommendations .....................................................................................4
1.3.1 Technical Capacity and Capability (TCC) Review .....................................4 1.3.2 Project Scope Review ..................................................................................5 1.3.3 Project Schedule Review .............................................................................6 1.3.4 Project Cost Estimate ...................................................................................7 1.3.5 Project Risk and Contingency Review ........................................................8
2.0 INTRODUCTION........................................................................................................... 11 2.1 Project Sponsor ......................................................................................................11 2.2 Project Description.................................................................................................11 2.3 Project Status .........................................................................................................13 2.4 Project Budget ........................................................................................................13 2.5 Project Schedule.....................................................................................................16 2.6 Project Management Oversight Contractor (PMOC) ............................................16 2.7 Evaluation Team ....................................................................................................16
3.0 TECHNICAL CAPACITY AND CAPABILITY REVIEW ....................................... 17 3.1 PMOC Assessment ................................................................................................17 3.2 PMOC Recommendations .....................................................................................18
4.0 PROJECT SCOPE REVIEW ........................................................................................ 19 4.1 PMOC Assessment ................................................................................................19 4.2 PMOC Recommendations .....................................................................................20
5.0 PROJECT SCHEDULE REVIEW ............................................................................... 21 5.1 PMOC Assessment ................................................................................................21 5.2 PMOC Recommendations .....................................................................................21
6.0 PROJECT COST ESTIMATE REVIEW .................................................................... 23 6.1 PMOC Assessment ................................................................................................23 6.2 PMOC Recommendations .....................................................................................25
7.0 PROJECT RISK ............................................................................................................. 26 7.1 Purpose ...................................................................................................................26 7.2 Methodology ..........................................................................................................26 7.3 Risk Identification ..................................................................................................27

Honolulu Rail Transit Project PMOC Report – 2014 Risk Refresh July 2014 (FINAL)
ii
7.4 Contract Packaging ................................................................................................27 7.5 Cost Risk Assessment ............................................................................................27
7.5.1 Methodology ..............................................................................................27 7.5.2 SCC Adjustments .......................................................................................28 7.5.3 Baseline Beta Values .................................................................................29 7.5.4 Beta Value Adjustments ............................................................................32 7.5.5 Cost Risk Analysis .....................................................................................33 7.5.6 Cost Contingency .......................................................................................34
7.6 Schedule Risk Assessment .....................................................................................35 7.6.1 Methodology ..............................................................................................35 7.6.2 Schedule Risk Analysis..............................................................................37 7.6.3 Schedule Contingency ...............................................................................42
7.7 Risk Mitigation ......................................................................................................43 7.7.1 Primary Mitigation .....................................................................................43 7.7.2 Secondary Mitigation .................................................................................43
7.8 Conclusion .............................................................................................................44 7.8.1 Cost Risk Analysis .....................................................................................44 7.8.2 Schedule Risk Analysis..............................................................................46
8.0 APPENDICES ................................................................................................................. 48
LIST OF TABLES Table 1. PMOC Evaluation Team ....................................................................................... 16 Table 2. Updated Contract Packages .................................................................................. 19 Table 3. Summary of Contract Change Orders (CCO) ....................................................... 24 Table 4. HART Forecast of Change Orders (February 2014) ............................................. 25 Table 5. Adjusted Stripped BCE ......................................................................................... 25 Table 6. PMOC Adjustments to HART Estimate $YOE .................................................... 29 Table 7. Imported Beta Values for Risk Profile 1............................................................... 30 Table 8. Imported Beta Values for Risk Profile 2............................................................... 30 Table 9. Imported Beta Values for Risk Profile 3............................................................... 30 Table 10. Beta Values Risk Refresh ..................................................................................... 31 Table 11. Risk Model Data ................................................................................................... 34 Table 12. PMOC Recommended Contingency ..................................................................... 34 Table 13. Schedule Contingency Final Design through RSD ............................................... 42 Table 14. PMOC Recommended Secondary Mitigation ...................................................... 44
LIST OF FIGURES Figure 1. Project Map Showing Line Segments ................................................................... 12 Figure 2. Project Map ........................................................................................................... 13 Figure 3. Schedule Risk Assessment Process ...................................................................... 37 Figure 4. Schedule Risk Assessment Steps and Schedule Types ......................................... 37 Figure 5. Duration Distribution Type ................................................................................... 39 Figure 6. Schedule Risk Scoring Chart ................................................................................ 40

Honolulu Rail Transit Project PMOC Report – 2014 Risk Refresh July 2014 (FINAL)
iii
Figure 7. Project Completion Date Confidence Level ......................................................... 41 Figure 8. Buffer Float and RSD Analysis ............................................................................ 43
LIST OF APPENDICES Appendix A: List of Acronyms

Honolulu Rail Transit Project PMOC Report – 2014 Risk Refresh July 2014 (FINAL)
4
1.0 EXECUTIVE SUMMARY
1.1 Introduction
The Honolulu Authority for Rapid Transportation (HART) continues to advance development of its Honolulu Rail Transit Project (“Project”) in accordance with the Federal Transit Administration (FTA) New Starts requirements. FTA assigned Jacobs as a Project Management Oversight Contractor (PMOC) on September 24, 2009, for the purpose of monitoring the Project and providing FTA with “information and well-grounded professional opinions regarding the reliability of the project scope, cost, and schedule” of the Project. The PMOC completed a Risk Refresh in 2012 prior to execution of the Full Funding Grant Agreement (FFGA) in December 2012. This report represents an updated Risk Refresh based on information provided by HART as of April 2014. It should be noted that this assessment is an update of the assessment that was completed in advance of the FFGA. In addition, all legal litigations have been resolved since the last risk assessment. The PMOC reviewed any Project changes, including those changes as a result of litigation period impacts, that may affect the technical capacity and capability of the grantee as well as changes associated with Project’s current FFGA scope, schedule, cost estimate, and risk and contingency management. 1.2 PMOC Review
This report represents an update of the PMOC’s assessment at time of FFGA of HART’s technical capacity and capability as well as an assessment of the Project’s current FFGA scope, schedule, cost estimate, and risk and contingency management. This assessment is governed by the following FTA Oversight Procedures (OP):
• OP 21 – Technical Capacity and Capability Review • OP 32C – Project Scope Review • OP 32D – Project Delivery Method Review • OP 33 – Capital Cost Estimate Review • OP 34 – Project Schedule Review • OP 40 – Risk and Contingency Review
1.3 Findings/Recommendations
1.3.1 Technical Capacity and Capability (TCC) Review
The PMOC has assessed that the HART organization should be streamlined to be more effective. There is a sense that critical decisions are rendered “by committee”, which is not an effective means for management on a capital program of this magnitude. HART should consider identifying a Project Director who serves as the focal point for all capital program decisions. This will eliminate management by committee, expedite critical decisions, and help ensure strong schedule and contract management principles are implemented.
Honolulu Rail Transit Project PMOC Report – 2014 Risk Refresh July 2014 (FINAL)
5
Recommendations (1) HART should identify a Project Director. (2) HART must complete the update of the Project Management Plan (PMP). (3) HART should identify a permanent Risk Manager. (4) HART and their consultant organization should be streamlined to be more
effective (e.g. evaluate need for HART Construction Assistant Deputy; clearly define the roles and responsibilities of HART Project Manager and CE&I Resident Engineer; evaluate need for HART Assistant Project Managers).
(5) HART must update its management plans to include the Assistant Deputy Director positions that weren’t included in the most recent updates provided to the PMOC in March 2014.
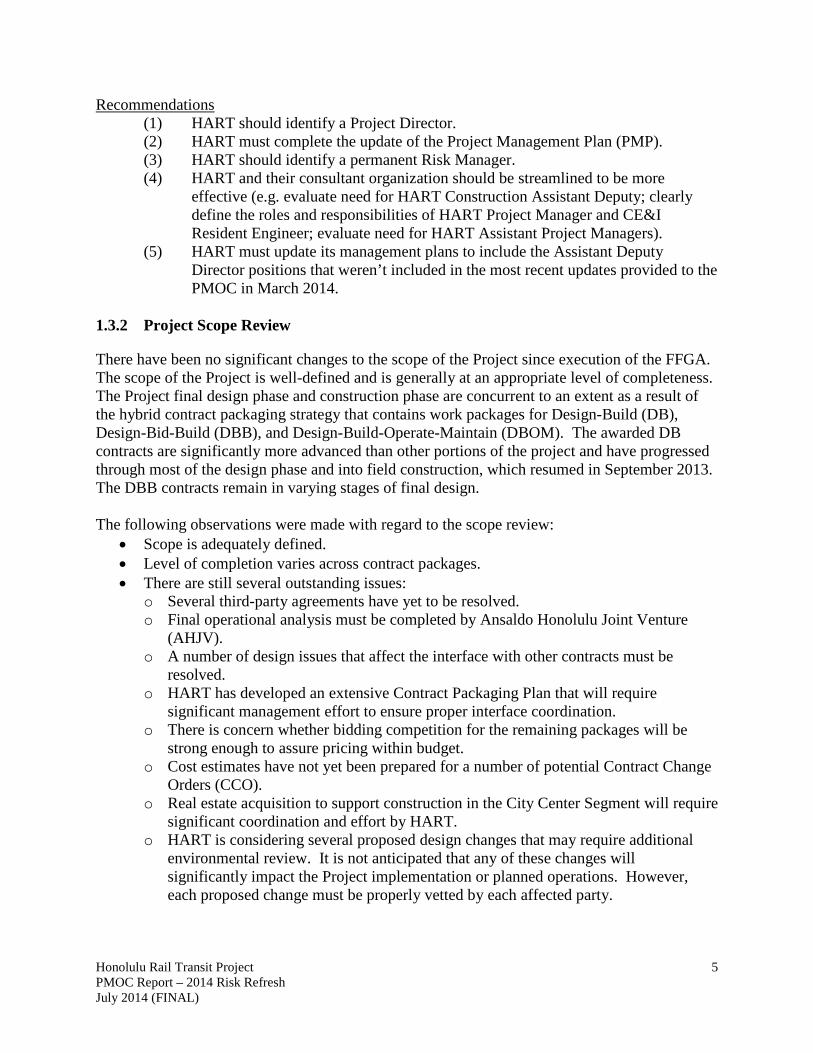
1.3.2 Project Scope Review
There have been no significant changes to the scope of the Project since execution of the FFGA. The scope of the Project is well-defined and is generally at an appropriate level of completeness. The Project final design phase and construction phase are concurrent to an extent as a result of the hybrid contract packaging strategy that contains work packages for Design-Build (DB), Design-Bid-Build (DBB), and Design-Build-Operate-Maintain (DBOM). The awarded DB contracts are significantly more advanced than other portions of the project and have progressed through most of the design phase and into field construction, which resumed in September 2013. The DBB contracts remain in varying stages of final design. The following observations were made with regard to the scope review:
• Scope is adequately defined. • Level of completion varies across contract packages. • There are still several outstanding issues:
o Several third-party agreements have yet to be resolved. o Final operational analysis must be completed by Ansaldo Honolulu Joint Venture
(AHJV). o A number of design issues that affect the interface with other contracts must be
resolved. o HART has developed an extensive Contract Packaging Plan that will require
significant management effort to ensure proper interface coordination. o There is concern whether bidding competition for the remaining packages will be
strong enough to assure pricing within budget. o Cost estimates have not yet been prepared for a number of potential Contract Change
Orders (CCO). o Real estate acquisition to support construction in the City Center Segment will require
significant coordination and effort by HART. o HART is considering several proposed design changes that may require additional
environmental review. It is not anticipated that any of these changes will significantly impact the Project implementation or planned operations. However, each proposed change must be properly vetted by each affected party.

Honolulu Rail Transit Project PMOC Report – 2014 Risk Refresh July 2014 (FINAL)
6
Recommendations (1) Continue to review and vet all potential Contract Change Orders. Prepare cost
estimates for any potential Contract Change Orders that cannot be eliminated at this time.
(2) Continue to review all post-Record of Decision (ROD) changes to ensure they do not have an impact on the environmental documentation, the project scope, or future operations.
(3) Prioritize resolution of required third-party agreements, real estate acquisitions, and coordination between various contractors and designers.
1.3.3 Project Schedule Review
The PMOC reviewed HART’s Master Program Schedule (MPS) with a Data Date of February 28, 2014. The PMOC has assessed that the MPS remains achievable but contains little margin for error or delay to critical path and near critical path activities due to schedule compression. HART should also engage tighter management oversight over the Core Systems Contractor especially since they continue to slip critical schedule dates with vehicle design and manufacturing and systems design. The following observations were made with regard to the schedule review:
• The FFGA Revenue Service Date (RSD) is January 31, 2020. • HART’s target RSD is March 29, 2019 and the MPS includes more than 300 calendar
days of buffer float up to the FFGA RSD. • The adjusted/stripped schedule RSD is February 7, 2019. • HART MPS consists of the master schedule connected to multiple contractor’s schedules.
The CSC’s AHJV schedule is the only one whose base calendar is a 7-day calendar due to it being mainly a manufacturing and procurement schedule.
• The current MPS contains more logic density and schedule-compression than ever before, which may require more concurrent utilization of resources. It is recommended that HART and consultant staff projections be re-visited as a result of this concurrent utilization.
• Most of the Risk Register items used by the PMOC in the schedule risk analysis are the same as the previous risk refresh.
Recommendations
(1) HART and consultant staff projections should be re-visited as a result of projected concurrent utilization.
(2) HART should require all construction contractors to consistently apply 5-day and 6-day-per-week calendars in lieu of 7-day- per-week calendars.
(3) HART should revise its staffing plan to ensure that schedule compression has not caused excessive staff requirements during peak demand.
(4) HART should withhold partial or full payment of contractor monthly pay applications if the contractors continue failing to submit timely and acceptable Critical Path Method (CPM) project schedule updates.
(5) HART should consider placing a senior level scheduler in the CSC offices to support more aggressive schedule management oversight.
Honolulu Rail Transit Project PMOC Report – 2014 Risk Refresh July 2014 (FINAL)
7
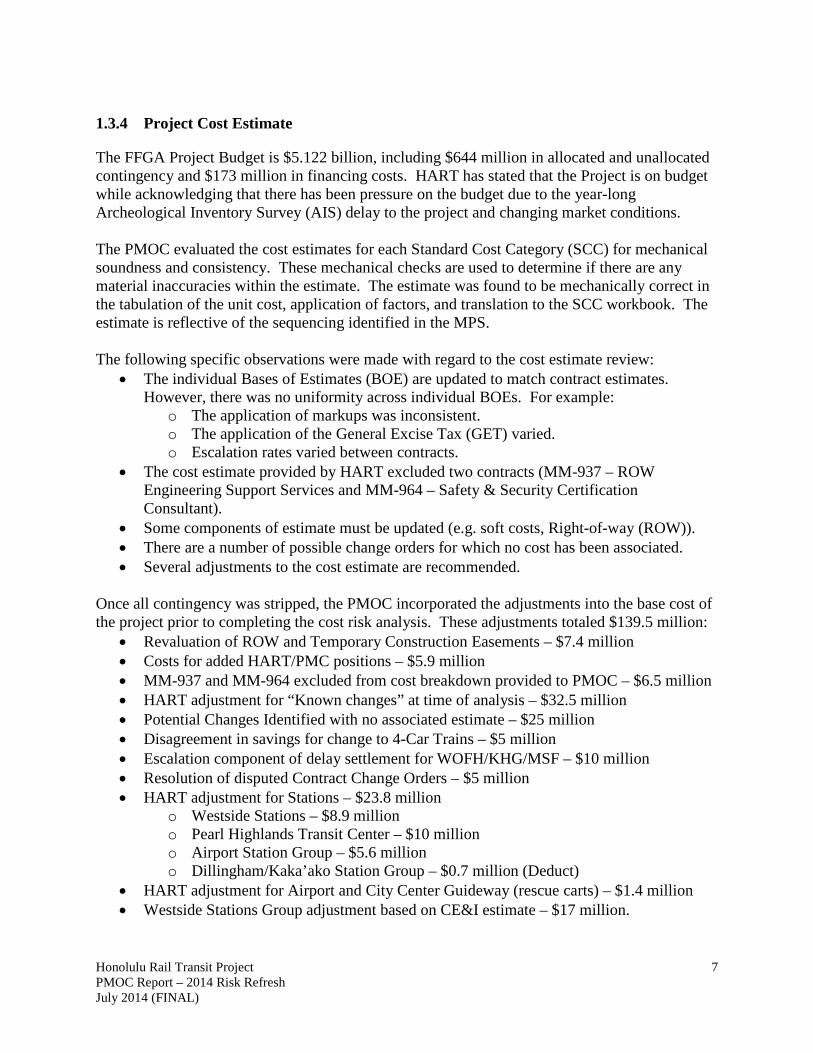
1.3.4 Project Cost Estimate
The FFGA Project Budget is $5.122 billion, including $644 million in allocated and unallocated contingency and $173 million in financing costs. HART has stated that the Project is on budget while acknowledging that there has been pressure on the budget due to the year-long Archeological Inventory Survey (AIS) delay to the project and changing market conditions. The PMOC evaluated the cost estimates for each Standard Cost Category (SCC) for mechanical soundness and consistency. These mechanical checks are used to determine if there are any material inaccuracies within the estimate. The estimate was found to be mechanically correct in the tabulation of the unit cost, application of factors, and translation to the SCC workbook. The estimate is reflective of the sequencing identified in the MPS. The following specific observations were made with regard to the cost estimate review:
• The individual Bases of Estimates (BOE) are updated to match contract estimates. However, there was no uniformity across individual BOEs. For example:
o The application of markups was inconsistent. o The application of the General Excise Tax (GET) varied. o Escalation rates varied between contracts.
• The cost estimate provided by HART excluded two contracts (MM-937 – ROW Engineering Support Services and MM-964 – Safety & Security Certification Consultant).
• Some components of estimate must be updated (e.g. soft costs, Right-of-way (ROW)). • There are a number of possible change orders for which no cost has been associated. • Several adjustments to the cost estimate are recommended.
Once all contingency was stripped, the PMOC incorporated the adjustments into the base cost of the project prior to completing the cost risk analysis. These adjustments totaled $139.5 million:
• Revaluation of ROW and Temporary Construction Easements – $7.4 million • Costs for added HART/PMC positions – $5.9 million • MM-937 and MM-964 excluded from cost breakdown provided to PMOC – $6.5 million • HART adjustment for “Known changes” at time of analysis – $32.5 million • Potential Changes Identified with no associated estimate – $25 million • Disagreement in savings for change to 4-Car Trains – $5 million • Escalation component of delay settlement for WOFH/KHG/MSF – $10 million • Resolution of disputed Contract Change Orders – $5 million • HART adjustment for Stations – $23.8 million
o Westside Stations – $8.9 million o Pearl Highlands Transit Center – $10 million o Airport Station Group – $5.6 million o Dillingham/Kaka’ako Station Group – $0.7 million (Deduct)
• HART adjustment for Airport and City Center Guideway (rescue carts) – $1.4 million • Westside Stations Group adjustment based on CE&I estimate – $17 million.

Honolulu Rail Transit Project PMOC Report – 2014 Risk Refresh July 2014 (FINAL)
8
In addition, the Net Stripped, Adjusted Estimate includes $177.6 million in forecast Change Orders that had previously been identified by HART.
Recommendations
(1) HART should prepare cost estimates for all identified possible changes (contract change orders).
(2) HART should focus on completion of the Airport & City Center Guideway Estimate to allow time for mitigation if there is a budget issue with this contract.
(3) HART should refresh its ROW estimate to reflect current property costs and include costs for Temporary Construction Easements.
(4) HART should refresh its personnel manpower charts to account for new positions and a refined schedule to verify the cost included in SCC 80 soft costs.
(5) HART should re-baseline its budget following completion of the Risk Refresh activities.
(6) HART should verify that its budgets and any ongoing estimate refresh include adequate funds for escalation.
1.3.5 Project Risk and Contingency Review
The PMOC has performed regular monitoring visits to the project and has refreshed its earlier risk assessment based upon an updated understanding of project risks and updated schedule and cost information provided by HART. In April 2014, the PMOC participated in a risk refresh workshop with HART, the purpose of which was to discuss HART’s progress in its risk management efforts, and to discuss PMOC’s observations and reflections from PMOC’s initial review of HART’s updated scope, cost, schedule, and risk information. For the purposes of its risk refresh, the PMOC considered the project in three separate elements, which are termed here as “risk profiles”:
• Risk Profile 1 is associated with currently-contracted direct cost work; • Risk Profile 2 is associated with yet-to-be-contracted direct cost work; and • Risk Profile 3 is associated with “soft costs”.
Cost Risk Analysis During the April 2014 risk workshop, information was provided indicating that HART was aware of additional costs that should be included, and which were added by the PMOC as estimate adjustments, along with PMOC’s independent estimate adjustments. The PMOC has prepared this risk refresh based upon additional information provided by HART after the workshop. The PMOC found that the HART’s risk identification effort, including its risk mitigation activities, generally conforms to its documented processes. The cost risk assessment recognized general reductions in risk due to advancement of design. However, little additional construction has occurred and so no major changes in construction risk were made. Further, the project delay has caused the bidding effort to occur during an increase in the construction market, which adds market risk to the model. A major influence in the risk for Risk Profile 2 is market risk due to an increasingly strong construction market both at the project location and on the west coast of the U.S.

Honolulu Rail Transit Project PMOC Report – 2014 Risk Refresh July 2014 (FINAL)
9
It is recognized that efforts have been made to recover contingency levels through cost reduction measures, value engineering, and revised project delivery strategies. However, these types of changes are becoming increasingly less likely. The PMOC basis of the stripped, adjusted estimate for cost risk modeling is as follows:
Project Budget $5,122 HART Current Available Contingency $463 Financing $173 Net Stripped Estimate $4,486 PMOC Adjustments $139.5 Net Stripped, Adjusted Estimate $4,625
With adjustments of $139.5 million, the current contingency is reduced to $323.5 million (7% of the adjusted, stripped estimate). This level of contingency would be commensurate with a project that is completely bid and has progressed in construction beyond the point of being “in the ground”. Considering the project progress to date is 22%, this current level of contingency would only reflect an approximate achievable probability of 42%. The predicted FTA model outcome is $5,214 million (excluding finance costs). This includes $588 million in recommended contingency (13% of the adjusted, stripped estimate). HART’s estimate falls short of the predicted FTA model outcome by $265 million ($139.5 million in recommended adjustments plus $125.5 million in additional recommended contingency). There is a 5.4% difference between HART’s project estimate of $4,949 million and the predicted FTA model outcome of $5,214 million. The recommended estimate represents the median value from the FTA risk assessment model, when adjusted for the specifics of this project. The historic trend indicates 40%-likely to 80%-likely range of $5,101 million to $5,670 million. The RCMP includes several potential Secondary Mitigation options. However, there is a general lack of detailed development of plans and cost estimates for the items identified in the RCMP. Recommendations
(1) HART’s estimate falls short of the predicted FTA model outcome by $265 million ($139.5 million in recommended adjustments plus $125.5 million in additional recommended contingency). HART should review its project estimate and determine how to reduce costs to close this gap.
(2) The PMOC-recommended amount of secondary mitigation is $195.5 million. (3) The RCMP must be updated to strengthen risk contingency tracking, custody, and
reporting. The RCMP should include an updated contingency draw-down curve that reflects the current contingency balance and more accurate drawdown milestones. Diligence and vigilance must continue to be applied to this effort to avoid a rapid contingency usage that could ultimately leave the project unprotected.
(4) HART should update and continue its tracking of the Secondary Mitigation items,

Honolulu Rail Transit Project PMOC Report – 2014 Risk Refresh July 2014 (FINAL)
10
and develop a process by which those items may be priced by the bidders of the remaining work at the time of bidding. This strategy avoids attempting to trigger Secondary Mitigation after receipt of bids or after contracting, at which point the cost reduction may be significantly reduced due to lack of competitive forces.
(5) Strong controls must be put in place immediately to avoid future rapid contingency reduction. The frequency and the levels of project management to which these statistics are reported should be improved and monitored monthly.
(6) The PMOC and HART should engage in a focused “cost containment workshop” on a monthly basis to monitor the efforts taken to avoid rapid contingency usage.
Schedule Risk Analysis HART’s target Revenue Service Date is March 2019. The FFGA Date is January 31, 2020. The Impacted Risk Model (IRM) distribution range for project completion from the 0% to 100% confidence levels span a 549-day period. The probability percentage points for the IRM are:
• 20% Confidence level completion date: 20-Aug-19 • 50% Confidence level completion date: 17-Dec-19 • 75% Confidence level completion date: 20-Feb-20 • 90% Confidence level completion date : 20-Apr-20 • 100% Confidence level completion date: 31-Jul-20
The probability confidence level for achieving project completion by January 2020, the FFGA RSD, has been reduced by 15-20% since the last Risk Assessment refresh in July 2012. The Schedule Risk Analysis indicates 66-70% probability of completing the project by the FFGA RSD of 31-Jan-20. The schedule risk analyses using the OP40 calculation indicates a recommended RSD of July 13, 2020. The FFGA RSD of January 2020 can be achieved; however, HART must implement strong schedule and contract management throughout the remainder of the project. Recommendations
(1) HART should closely monitor the MPS longest critical path and near critical paths as a means to prevent depletion of project total float to achieve RSD by January 2020.
(2) HART should revise its staffing plan to ensure that schedule compression has not caused excessive staff requirements during peak demand during construction.
(3) The PMOC and HART should engage in focused “schedule containment workshops” on a monthly basis to monitor the efforts taken to achieve the FFGA RSD.

Honolulu Rail Transit Project PMOC Report – 2014 Risk Refresh July 2014 (FINAL)
11
2.0 INTRODUCTION
The Honolulu Authority for Rapid Transportation (HART) continues to advance development of its Honolulu Rail Transit Project (“Project”) in accordance with the Federal Transit Administration (FTA) New Starts requirements. The Project is intended to provide improved mobility in the highly-congested east-west corridor along Oahu’s south shore between Kapolei and the Ala Moana Center. FTA assigned Jacobs as a Project Management Oversight Contractor (PMOC) on September 24, 2009, for the purpose of monitoring the Project and providing FTA with “information and well-grounded professional opinions regarding the reliability of the project scope, cost, and schedule” of the Project. That effort continues with this update report, which represents the PMOC’s assessment of Risk and Contingency Management. The PMOC completed a Risk Refresh in 2012 prior to execution of the Full Funding Grant Agreement (FFGA) in December 2012. This report represents an updated Risk Refresh based on information provided by HART as of April 2014. It should be noted that this assessment is an update of the assessment that was completed in advance of the FFGA. In addition, all legal litigations have been resolved since the last risk assessment. The PMOC reviewed any Project changes, including those changes as a result of litigation period impacts, that may affect the technical capacity and capability of the grantee as well as changes associated with Project’s current FFGA scope, schedule, cost estimate, and risk and contingency management. 2.1 Project Sponsor
The City and County of Honolulu (“City”) is the overarching FTA grantee. The City’s Department of Transportation Services (DTS) and HART have executed a Memorandum of Understanding, which delineates each agency’s roles and responsibilities so as not to jeopardize the City’s standing as an FTA grantee. HART is responsible for the New Starts grants for the Project and may share responsibilities with DTS for grants using Section 5307 or other FTA funding sources. 2.2 Project Description
The Project is an approximately 20-mile elevated fixed guideway rail system along Oahu’s south shore between East Kapolei and Ala Moana Center. The alignment is elevated, except for a 0.6-mile at-grade portion at the Leeward Community College station. The proposed investment includes 21 stations (20 aerial and 1 at-grade), 80 “light metro” rail transit vehicles, administrative/operations facilities, surface and structural parking, and maintenance facilities. HART plans to deliver the Project in four guideway segments:
• Segment I (West Oahu/Farrington Highway/WOFH) – East Kapolei to Pearl Highlands (6 miles/7 stations)
• Segment II (Kamehameha Highway/KH) – Pearl Highlands to Aloha Stadium (4 miles/2 stations)
• Segment III (Airport) – Aloha Stadium to Middle Street (5 miles/4 stations)
Honolulu Rail Transit Project PMOC Report – 2014 Risk Refresh July 2014 (FINAL)
12
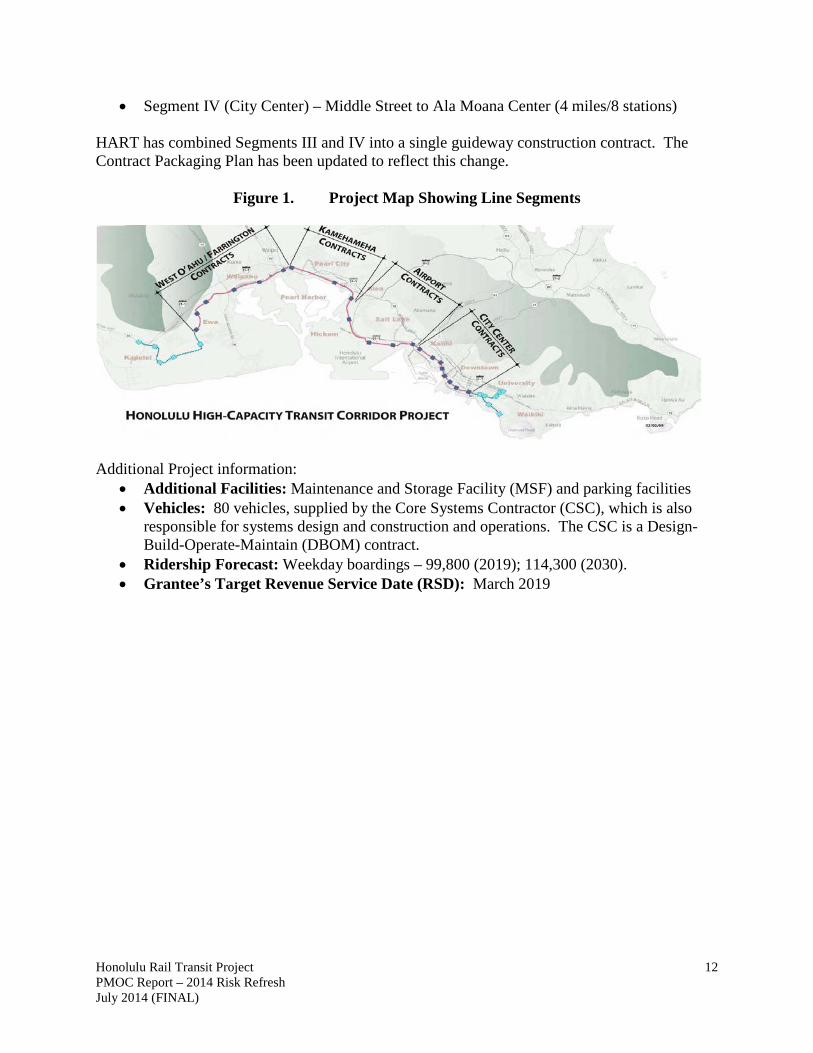
• Segment IV (City Center) – Middle Street to Ala Moana Center (4 miles/8 stations)
HART has combined Segments III and IV into a single guideway construction contract. The Contract Packaging Plan has been updated to reflect this change.
Figure 1. Project Map Showing Line Segments
Additional Project information:
• Additional Facilities: Maintenance and Storage Facility (MSF) and parking facilities • Vehicles: 80 vehicles, supplied by the Core Systems Contractor (CSC), which is also
responsible for systems design and construction and operations. The CSC is a Design-Build-Operate-Maintain (DBOM) contract.
• Ridership Forecast: Weekday boardings – 99,800 (2019); 114,300 (2030). • Grantee’s Target Revenue Service Date (RSD): March 2019
Honolulu Rail Transit Project PMOC Report – 2014 Risk Refresh July 2014 (FINAL)
13
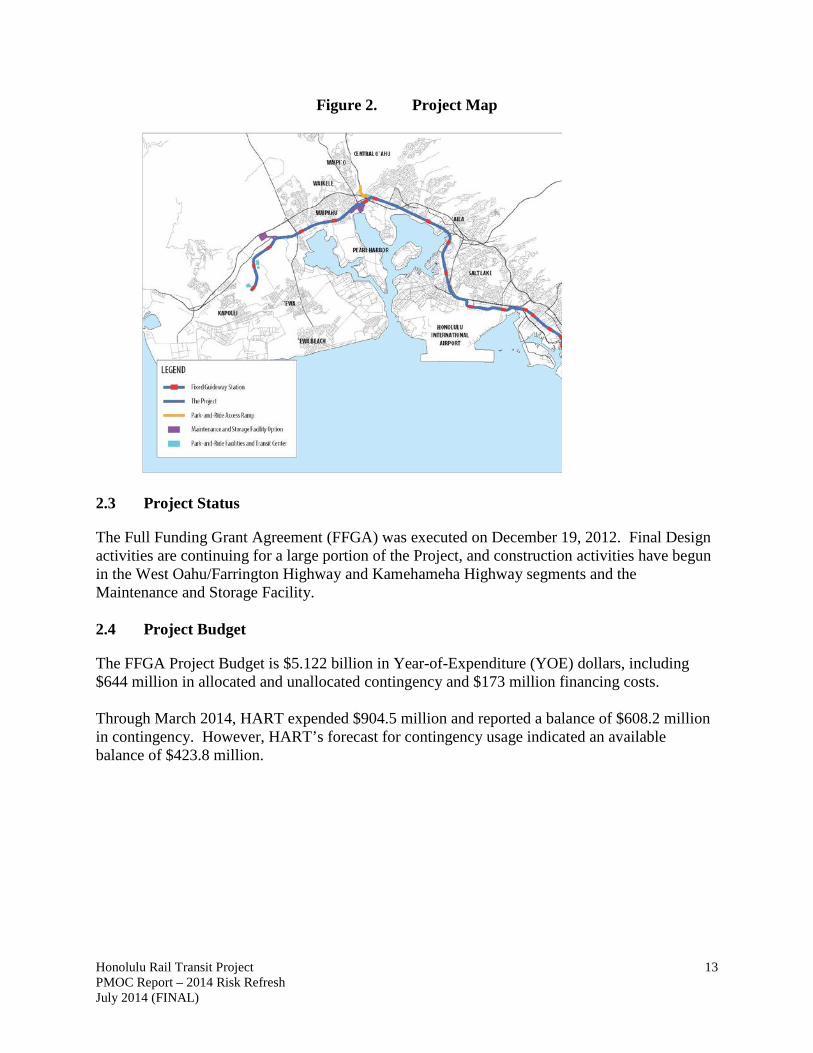
Figure 2. Project Map
2.3 Project Status
The Full Funding Grant Agreement (FFGA) was executed on December 19, 2012. Final Design activities are continuing for a large portion of the Project, and construction activities have begun in the West Oahu/Farrington Highway and Kamehameha Highway segments and the Maintenance and Storage Facility. 2.4 Project Budget
The FFGA Project Budget is $5.122 billion in Year-of-Expenditure (YOE) dollars, including $644 million in allocated and unallocated contingency and $173 million financing costs. Through March 2014, HART expended $904.5 million and reported a balance of $608.2 million in contingency. However, HART’s forecast for contingency usage indicated an available balance of $423.8 million.
Honolulu Rail Transit Project PMOC Report – 2014 Risk Refresh July 2014 (FINAL)
14
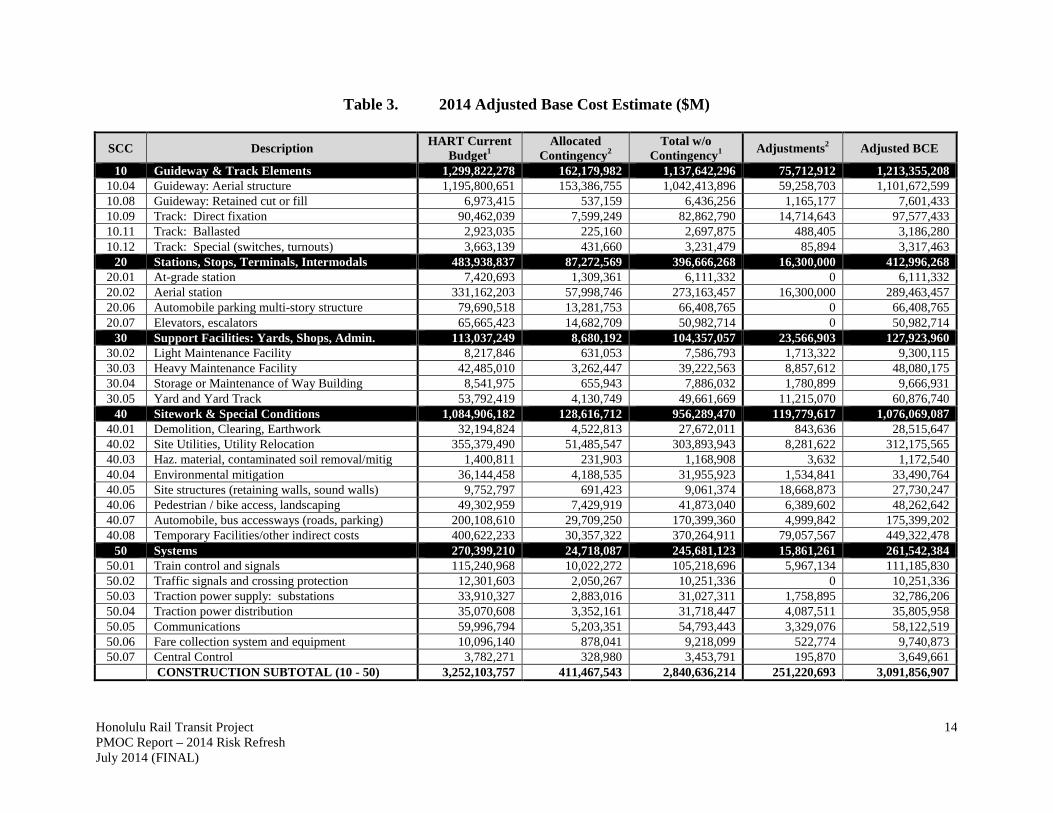
Table 3. 2014 Adjusted Base Cost Estimate ($M)
SCC Description HART Current Budget1
Allocated Contingency2
Total w/o Contingency1 Adjustments2 Adjusted BCE
10 Guideway & Track Elements 1,299,822,278 162,179,982 1,137,642,296 75,712,912 1,213,355,208 10.04 Guideway: Aerial structure 1,195,800,651 153,386,755 1,042,413,896 59,258,703 1,101,672,599 10.08 Guideway: Retained cut or fill 6,973,415 537,159 6,436,256 1,165,177 7,601,433 10.09 Track: Direct fixation 90,462,039 7,599,249 82,862,790 14,714,643 97,577,433 10.11 Track: Ballasted 2,923,035 225,160 2,697,875 488,405 3,186,280 10.12 Track: Special (switches, turnouts) 3,663,139 431,660 3,231,479 85,894 3,317,463
20 Stations, Stops, Terminals, Intermodals 483,938,837 87,272,569 396,666,268 16,300,000 412,996,268 20.01 At-grade station 7,420,693 1,309,361 6,111,332 0 6,111,332 20.02 Aerial station 331,162,203 57,998,746 273,163,457 16,300,000 289,463,457 20.06 Automobile parking multi-story structure 79,690,518 13,281,753 66,408,765 0 66,408,765 20.07 Elevators, escalators 65,665,423 14,682,709 50,982,714 0 50,982,714
30 Support Facilities: Yards, Shops, Admin. 113,037,249 8,680,192 104,357,057 23,566,903 127,923,960 30.02 Light Maintenance Facility 8,217,846 631,053 7,586,793 1,713,322 9,300,115 30.03 Heavy Maintenance Facility 42,485,010 3,262,447 39,222,563 8,857,612 48,080,175 30.04 Storage or Maintenance of Way Building 8,541,975 655,943 7,886,032 1,780,899 9,666,931 30.05 Yard and Yard Track 53,792,419 4,130,749 49,661,669 11,215,070 60,876,740
40 Sitework & Special Conditions 1,084,906,182 128,616,712 956,289,470 119,779,617 1,076,069,087 40.01 Demolition, Clearing, Earthwork 32,194,824 4,522,813 27,672,011 843,636 28,515,647 40.02 Site Utilities, Utility Relocation 355,379,490 51,485,547 303,893,943 8,281,622 312,175,565 40.03 Haz. material, contaminated soil removal/mitig 1,400,811 231,903 1,168,908 3,632 1,172,540 40.04 Environmental mitigation 36,144,458 4,188,535 31,955,923 1,534,841 33,490,764 40.05 Site structures (retaining walls, sound walls) 9,752,797 691,423 9,061,374 18,668,873 27,730,247 40.06 Pedestrian / bike access, landscaping 49,302,959 7,429,919 41,873,040 6,389,602 48,262,642 40.07 Automobile, bus accessways (roads, parking) 200,108,610 29,709,250 170,399,360 4,999,842 175,399,202 40.08 Temporary Facilities/other indirect costs 400,622,233 30,357,322 370,264,911 79,057,567 449,322,478
50 Systems 270,399,210 24,718,087 245,681,123 15,861,261 261,542,384 50.01 Train control and signals 115,240,968 10,022,272 105,218,696 5,967,134 111,185,830 50.02 Traffic signals and crossing protection 12,301,603 2,050,267 10,251,336 0 10,251,336 50.03 Traction power supply: substations 33,910,327 2,883,016 31,027,311 1,758,895 32,786,206 50.04 Traction power distribution 35,070,608 3,352,161 31,718,447 4,087,511 35,805,958 50.05 Communications 59,996,794 5,203,351 54,793,443 3,329,076 58,122,519 50.06 Fare collection system and equipment 10,096,140 878,041 9,218,099 522,774 9,740,873 50.07 Central Control 3,782,271 328,980 3,453,791 195,870 3,649,661
CONSTRUCTION SUBTOTAL (10 - 50) 3,252,103,757 411,467,543 2,840,636,214 251,220,693 3,091,856,907
Honolulu Rail Transit Project PMOC Report – 2014 Risk Refresh July 2014 (FINAL)
15
SCC Description HART Current Budget1
Allocated Contingency2
Total w/o Contingency1 Adjustments2 Adjusted BCE
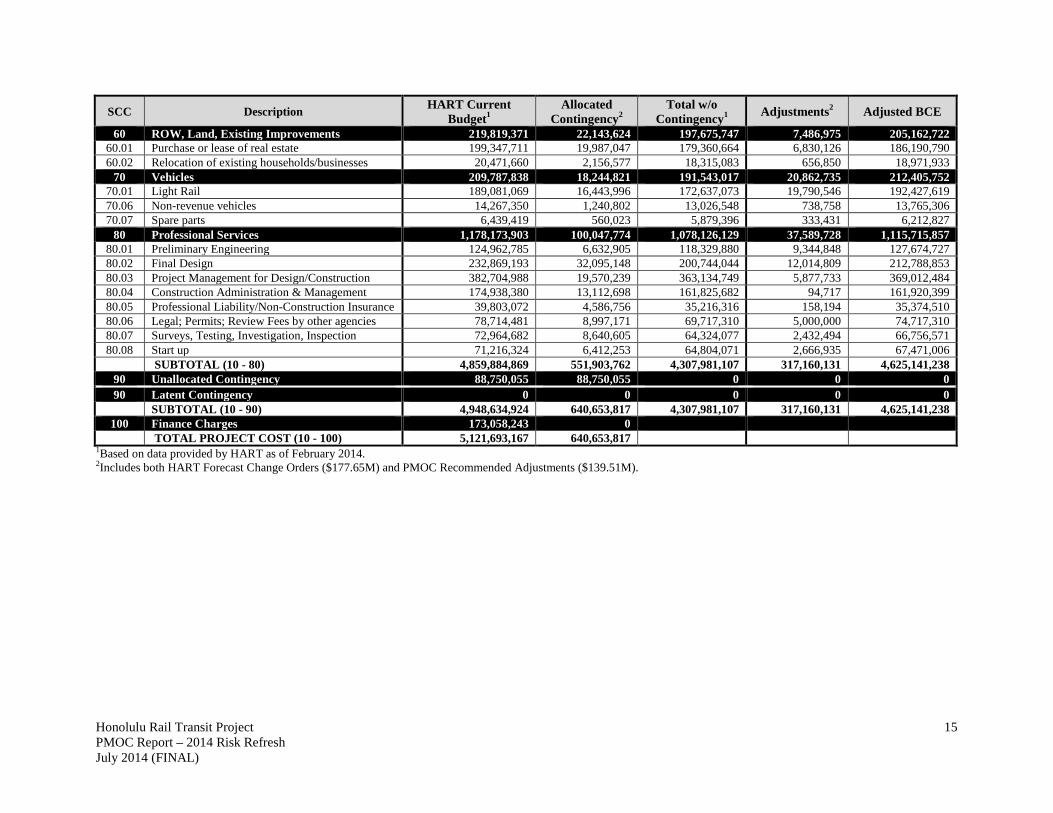
60 ROW, Land, Existing Improvements 219,819,371 22,143,624 197,675,747 7,486,975 205,162,722 60.01 Purchase or lease of real estate 199,347,711 19,987,047 179,360,664 6,830,126 186,190,790 60.02 Relocation of existing households/businesses 20,471,660 2,156,577 18,315,083 656,850 18,971,933
70 Vehicles 209,787,838 18,244,821 191,543,017 20,862,735 212,405,752 70.01 Light Rail 189,081,069 16,443,996 172,637,073 19,790,546 192,427,619 70.06 Non-revenue vehicles 14,267,350 1,240,802 13,026,548 738,758 13,765,306 70.07 Spare parts 6,439,419 560,023 5,879,396 333,431 6,212,827
80 Professional Services 1,178,173,903 100,047,774 1,078,126,129 37,589,728 1,115,715,857 80.01 Preliminary Engineering 124,962,785 6,632,905 118,329,880 9,344,848 127,674,727 80.02 Final Design 232,869,193 32,095,148 200,744,044 12,014,809 212,788,853 80.03 Project Management for Design/Construction 382,704,988 19,570,239 363,134,749 5,877,733 369,012,484 80.04 Construction Administration & Management 174,938,380 13,112,698 161,825,682 94,717 161,920,399 80.05 Professional Liability/Non-Construction Insurance 39,803,072 4,586,756 35,216,316 158,194 35,374,510 80.06 Legal; Permits; Review Fees by other agencies 78,714,481 8,997,171 69,717,310 5,000,000 74,717,310 80.07 Surveys, Testing, Investigation, Inspection 72,964,682 8,640,605 64,324,077 2,432,494 66,756,571 80.08 Start up 71,216,324 6,412,253 64,804,071 2,666,935 67,471,006
SUBTOTAL (10 - 80) 4,859,884,869 551,903,762 4,307,981,107 317,160,131 4,625,141,238 90 Unallocated Contingency 88,750,055 88,750,055 0 0 0 90 Latent Contingency 0 0 0 0 0
SUBTOTAL (10 - 90) 4,948,634,924 640,653,817 4,307,981,107 317,160,131 4,625,141,238 100 Finance Charges 173,058,243 0
TOTAL PROJECT COST (10 - 100) 5,121,693,167 640,653,817 1Based on data provided by HART as of February 2014. 2Includes both HART Forecast Change Orders ($177.65M) and PMOC Recommended Adjustments ($139.51M).
Honolulu Rail Transit Project PMOC Report – 2014 Risk Refresh July 2014 (FINAL)
16
2.5 Project Schedule
The Revenue Service Date (RSD) identified in the FFGA is January 31, 2020. HART’s current target date for the start of full revenue operations is March 2019. HART intends to begin partial revenue service from East Kapolei Station to Aloha Stadium Station in June 2017. 2.6 Project Management Oversight Contractor (PMOC)
This report represents an update of the PMOC’s assessment at time of FFGA of HART’s technical capacity and capability as well as an assessment of the Project’s current FFGA scope, schedule, cost estimate, and risk and contingency management. This assessment is governed by the following FTA Oversight Procedures (OP):
• OP 21 – Technical Capacity and Capability Review • OP 32C – Project Scope Review • OP 32D – Project Delivery Method Review • OP 33 – Capital Cost Estimate Review • OP 34 – Project Schedule Review • OP 40 – Risk and Contingency Review
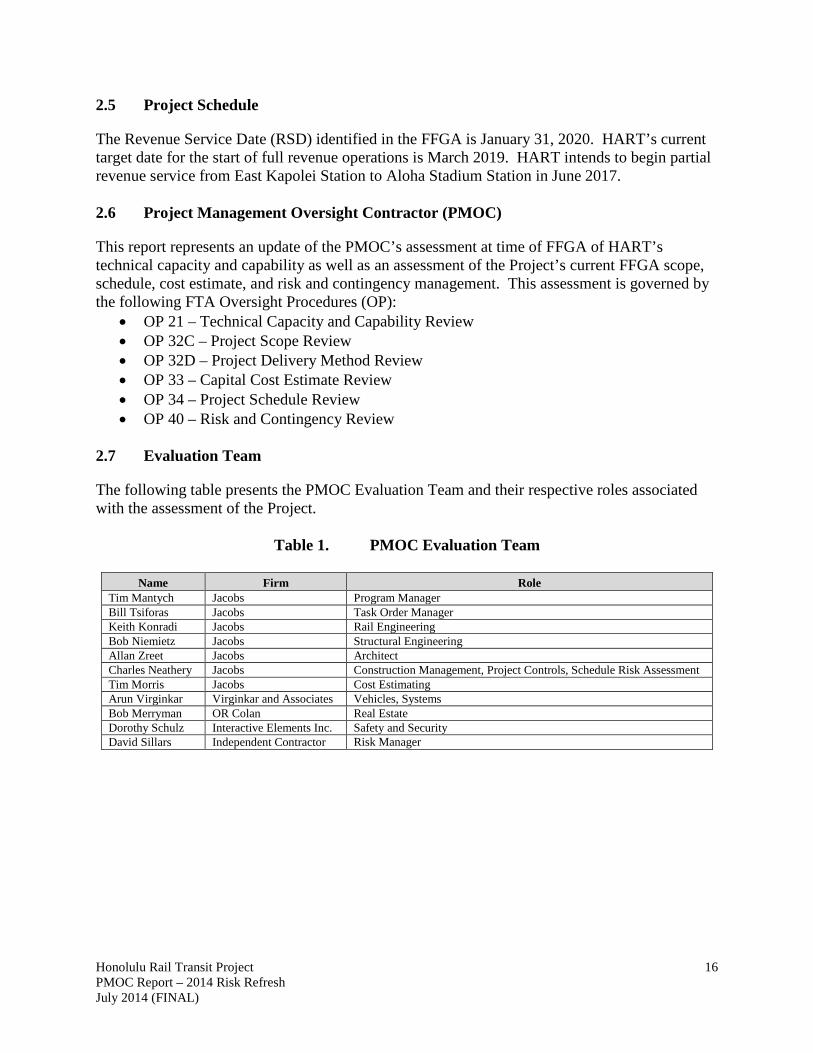
2.7 Evaluation Team
The following table presents the PMOC Evaluation Team and their respective roles associated with the assessment of the Project.
Table 1. PMOC Evaluation Team
Name Firm Role Tim Mantych Jacobs Program Manager Bill Tsiforas Jacobs Task Order Manager Keith Konradi Jacobs Rail Engineering Bob Niemietz Jacobs Structural Engineering Allan Zreet Jacobs Architect Charles Neathery Jacobs Construction Management, Project Controls, Schedule Risk Assessment Tim Morris Jacobs Cost Estimating Arun Virginkar Virginkar and Associates Vehicles, Systems Bob Merryman OR Colan Real Estate Dorothy Schulz Interactive Elements Inc. Safety and Security David Sillars Independent Contractor Risk Manager

Honolulu Rail Transit Project PMOC Report – 2014 Risk Refresh July 2014 (FINAL)
17
3.0 TECHNICAL CAPACITY AND CAPABILITY REVIEW
The PMOC reviewed HART’s organization, policies and procedures in accordance with OP 21: Grantee Technical Capacity and Capability Review dated May 2010, to determine whether there had been any significant changes that would affect management of the Project. 3.1 PMOC Assessment
The PMOC previously expressed concern that HART may continue experiencing difficulty attracting and retaining the experienced staff needed for long-term project assignment and permanent HART employment (post-Project) given Hawaii’s geographic isolation, salary limits, and high cost of living relative to the mainland. It was recommended that HART adhere to the staffing plan to address the transition of staff during the final design and construction phases for positions currently occupied by PMC staff to HART staff. The PMOC also recommended that HART must strive to transition the key management positions currently occupied by the PMC and General Engineering Consultant (GEC) as early as possible. This transition is necessary in order for HART to have more ownership and maintain stronger continuing control of the project without having to rely too heavily on the PMC and GEC. There are currently several key positions that remain vacant. The most critical positions that HART is diligently working to permanently fill include:
• Deputy Director of Construction • Risk Manager • Assistant Deputy Directors (5)
HART has improved recruitment and hiring of additional Project staff. HART will use the GEC III to fill the Risk Manager position on an interim basis. However, the Assistant Deputy Directors were not included in the Staffing and Succession Plan recently reviewed by the PMOC. HART recently submitted the following management plans and procedures for review:
• Resident Engineers Manual for DB (dated March 5, 2014) • Resident Engineers Manual for DBB (dated March 6, 2014) • Quality Management Plan (dated March 4, 2014) • Staffing and Succession Plan (dated March 5, 2014) • Construction Management Plan (dated March 7, 2014) • Change Management Plan (dated March 7, 2014 and previously identified as
Configuration Management Plan) • Contract Change Procedure 5CA-11 (dated March 7, 2014)
The PMOC has reviewed these plans/procedures and provided comments to HART. HART is in the process of updating several additional management plans including its Project Management Plan (PMP).
Honolulu Rail Transit Project PMOC Report – 2014 Risk Refresh July 2014 (FINAL)
18
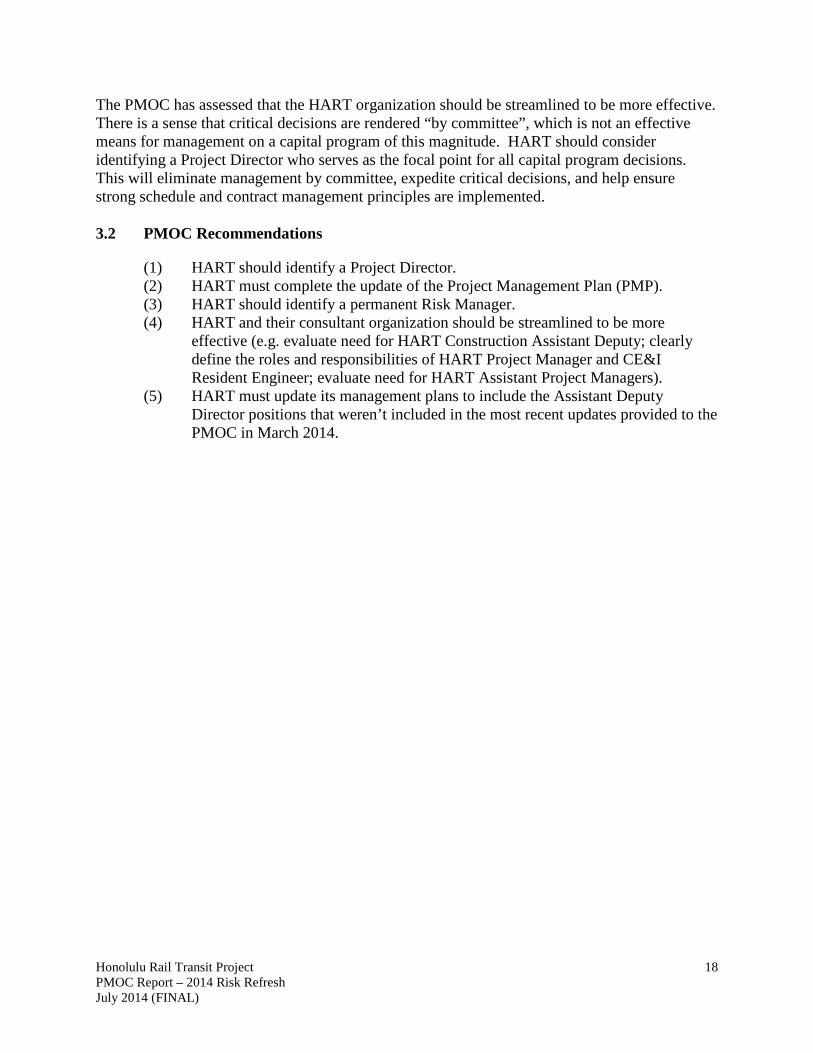
The PMOC has assessed that the HART organization should be streamlined to be more effective. There is a sense that critical decisions are rendered “by committee”, which is not an effective means for management on a capital program of this magnitude. HART should consider identifying a Project Director who serves as the focal point for all capital program decisions. This will eliminate management by committee, expedite critical decisions, and help ensure strong schedule and contract management principles are implemented. 3.2 PMOC Recommendations
(1) HART should identify a Project Director. (2) HART must complete the update of the Project Management Plan (PMP). (3) HART should identify a permanent Risk Manager. (4) HART and their consultant organization should be streamlined to be more
effective (e.g. evaluate need for HART Construction Assistant Deputy; clearly define the roles and responsibilities of HART Project Manager and CE&I Resident Engineer; evaluate need for HART Assistant Project Managers).
(5) HART must update its management plans to include the Assistant Deputy Director positions that weren’t included in the most recent updates provided to the PMOC in March 2014.

Honolulu Rail Transit Project PMOC Report – 2014 Risk Refresh July 2014 (FINAL)
19
4.0 PROJECT SCOPE REVIEW
The PMOC reviewed the Project in accordance with OP 32C: Project Scope Review and OP 32D: Project Delivery Method Review, both dated May 2010, to determine whether there had been any significant changes regarding the scope of the Project. 4.1 PMOC Assessment
In general, there have been no significant changes to the scope of the Project since execution of the FFGA. The scope of the Project is well-defined and is generally at an appropriate level of completeness. The Project final design phase and construction phase are concurrent to an extent as a result of the hybrid contract packaging strategy that contains work packages for DB, DBB, and DBOM. The awarded DB contracts are significantly more advanced than other portions of the project and have progressed through most of the design phase and into field construction, which resumed in September 2013 following suspension to complete the Archaeological Inventory Survey per the Hawaii Supreme Court ruling. The DBB contracts remain in varying stages of final design. It is advisable to acknowledge the project risks to completing the project on schedule and within budget, given the varying level of completion of the final design documents. PMOC primarily focused its review on those contract packages that have not yet been bid or have been significantly advanced since time of the FFGA. These contract packages include:
Table 2. Updated Contract Packages
Contract ID Contract Description DBOM920 Core Systems Contract (CSC) Design-Build-Operate-Maintain DBB185 Westside (WOSG, FHSG, KHSG) Station Group Construction DBB470 Airport Station Group Construction DBB505 Airport Section Utility Relocation Contract DBB595 Airport/City Center Guideway Construction + City Center Utility Relocation DBB580 Dillingham / Kaka'ako (Eastside) Station Group Construction
The drawings for the four line segments present right-of-way plans, drainage plans and details, demolition plans, guideway plans and profiles, typical cross sections, utility plans, roadway plans, signing and striping plans, maintenance of traffic plans, traffic signal plans, street lighting plans, structural drawings, landscaping plans, station drawings, and contact rail installation plans. The West Oahu/Farrington Highway (WOFH), Kamehameha Highway (KHG), and MSF DB contracts have progressed beyond the others as they near completion of final design as they have proceeded into construction. The following observations were made with regard to the scope review:
• Scope is adequately defined. • Level of completion varies across contract packages. • There are still several outstanding issues:
o Several third-party agreements have yet to be resolved.

Honolulu Rail Transit Project PMOC Report – 2014 Risk Refresh July 2014 (FINAL)
20
o Final operational analysis must be completed by Ansaldo Honolulu Joint Venture (AHJV).
o A number of design issues that affect the interface with other contracts must be resolved.
o HART has developed an extensive Contract Packaging Plan that will require significant management effort to ensure proper interface coordination.
o There is concern whether bidding competition for the remaining packages will be strong enough to assure pricing within budget.
o Cost estimates have not yet been prepared for a number of potential Contract Change Orders (CCO).
o Real estate acquisition to support construction in the City Center Segment will require significant coordination and effort by HART.
o HART is considering several proposed design changes that may require additional environmental review. It is not anticipated that any of these changes will significantly impact the Project implementation or planned operations. However, each proposed change must be properly vetted by each affected party.
4.2 PMOC Recommendations
(1) Continue to review and vet all potential Contract Change Orders. Prepare cost estimates for any potential Contract Change Orders that cannot be eliminated at this time.
(2) Continue to review all post-ROD changes to ensure they do not have an impact on the environmental documentation, the project scope, project cost, project schedule, or future operations.
(3) Prioritize resolution of required third-party agreements, real estate acquisitions, and coordination between various contractors and designers.

Honolulu Rail Transit Project PMOC Report – 2014 Risk Refresh July 2014 (FINAL)
21
5.0 PROJECT SCHEDULE REVIEW
The PMOC reviewed the Project in accordance with FTA OP 34: Project Schedule Review dated May 2010 to assess and evaluate HART’s project schedule. 5.1 PMOC Assessment
The PMOC reviewed HART’s Master Program Schedule (MPS) with a Data Date of February 28, 2014. The following observations were made with regard to the schedule review:
• The FFGA RSD is January 31, 2020. • HART’s target Revenue Service Date (RSD) is March 29, 2019 and the MPS includes
more than 300 calendar days of buffer float up to the FFGA RSD. • The adjusted/stripped schedule RSD is February 7, 2019. • HART MPS consists of the master schedule connected to multiple contractor’s schedules.
The CSC’s AHJV schedule is the only one whose base calendar is a 7-day calendar due to it being mainly a manufacturing and procurement schedule.
• The current MPS contains more logic density and schedule-compression than ever before, which may require more concurrent utilization of resources. It is recommended that HART and consultant staff projections be re-visited as a result of this concurrent utilization.
• Most of the Risk Register items used by the PMOC in the schedule risk analysis are the same as the previous risk refresh.
The PMOC incorporated the following adjustments to schedule prior to completing the schedule risk analysis:
• Removed/dissolved “buffer” float activities. • Minor mechanical corrections were made based on results of Schedule Analyzer: • Removed constraint date(s). • Added logic and modified lags to reduce excessive float. • Incorporated logic and relationship/lag adjustments to reduce excessive float. • Estimate Uncertainty modeling will account for activity duration adjustments. • No adjustments were made to the calendar library.
In general, the PMOC has assessed that the MPS remains achievable but contains little margin for error or delay to critical path and near critical path activities due to schedule compression. HART should also engage tighter management oversight over the Core Systems Contractor especially since they continue to slip critical schedule dates with vehicle design and manufacturing and systems design. 5.2 PMOC Recommendations
(1) HART and consultant staff projections should be re-visited as a result of projected concurrent utilization.
(2) HART should require all construction contractors to consistently apply 5-day and 6-day-per-week calendars in lieu of 7-day-per-week calendars.
Honolulu Rail Transit Project PMOC Report – 2014 Risk Refresh July 2014 (FINAL)
22
(3) HART should revise its staffing plan to ensure that schedule compression has not caused excessive staff requirements during peak demand.
(4) HART should withhold partial or full payment of contractor monthly pay applications if the contractors continue failing to submit timely and acceptable CPM project schedule updates.
(5) HART should consider placing a senior level scheduler in the CSC offices to support more aggressive schedule management oversight.

Honolulu Rail Transit Project PMOC Report – 2014 Risk Refresh July 2014 (FINAL)
23
6.0 PROJECT COST ESTIMATE REVIEW
The PMOC followed the requirements outlined in the FTA OP 33: Capital Cost Estimate Review, dated May 2010, to assess and evaluate changes to HART’s FFGA cost estimate. 6.1 PMOC Assessment
The Project Budget is $5.122 billion, including $644 million in allocated and unallocated contingency and $173 million in financing costs. HART has stated that the Project is on budget while acknowledging there has been pressure on the budget due to the year-long Archeological Inventory Survey (AIS) delay to the project and changing market conditions. The PMOC evaluated the cost estimates for each SCC for mechanical soundness and consistency. These mechanical checks are used to determine if there are any material inaccuracies within the estimate. The estimate was found to be mechanically correct in the tabulation of the unit cost, application of factors, and translation to the SCC workbook. The estimate is reflective of the sequencing identified in the MPS. Given the various formats of the composite Project Cost Estimate, the PMOC had some difficulty completing the analysis. The current estimate is a combination of an Estimate at Completion (EAC) or Contract tally with allowances of various types for change orders or issues. At present, approximately half of the construction work is awarded and the remaining work is “estimated” from varied sources or entities. Some of the budget costs are based on estimates from the original FFGA but were not updated for this Risk Assessment refresh. The contract change orders, especially for the construction contracts, are at best uncertain as many of the issues do not have an associated agency estimate. A significant setback occurred with the federal/state lawsuits for most of 2013 and this cost has been partially captured by HART change orders or adjustments included in the PMOC’s analysis. However, the net result is that the agency has eroded the project contingency without making any significant progress in the work, construction contract awards, acquisition of right of way, or lessening of the project’s risks. The time loss is concerning as the stations, real estate procurement, and east sections of the guideway will be bid in a market that may be less favorable for the owner. The City Center and Airport Guideways with Utilities will require HART to purchase ROW in the costliest areas of the project with significant utility and construction challenges. The current HART budget relies generally on the FFGA budget for this portion of the work as an update based on more recent engineering was not complete at the time of the risk refresh. The updated estimate for this contract will not be available until June or July 2014. HART is fully aware of the importance of this large contract as it has the potential to require a large share of the contingency if the bids are higher than originally anticipated at FFGA. Escalation was discussed in general terms at the April 2014 Risk Refresh Workshop, but it is unclear if HART’s budget adequately addresses this project risk. Once the contracts are awarded this risk should decline significantly, but the PMOC recommends for the interim that HART verify that its budgets and any ongoing estimate refresh efforts include adequate funds for

Honolulu Rail Transit Project PMOC Report – 2014 Risk Refresh July 2014 (FINAL)
24
escalation. The following specific observations were made with regard to the cost estimate review:
• The individual Bases of Estimates (BOE) are updated to match contract estimates. However, there was no uniformity across individual BOEs. For example:
o The application of markups was inconsistent. o The application of the General Excise Tax (GET) varied. o Escalation rates varied between contracts.
• The cost estimate provided by HART excluded two contracts (MM-937 – ROW Engineering Support Services and MM-964 – Safety & Security Certification Consultant).
• Some components of estimate must be updated (e.g. soft costs, ROW). • It was unclear how increased costs for the Owner Controlled Insurance Program were
handled, but clarification was subsequently provided by HART. • There are a number of possible change orders for which no cost has been associated (see
table below). • Several adjustments to the cost estimate are recommended.
Table 3. Summary of Contract Change Orders (CCO)
Category Number
Executed CCOs 108 Pending Changes 22 Probable/Potential Changes 57 Issues/Possible 143 Issues/Possible w/out Estimate* 90 Disputed 10
63% of the Issues/Possible do not have associated cost estimate.
Once all contingency was stripped, the PMOC incorporated the adjustments into the base cost of the project prior to completing the cost risk analysis. These adjustments totaled $139.5 million:
• Revaluation of ROW and Temporary Construction Easements – $7.4 million • Costs for added HART/PMC positions – $5.9 million • MM-937 and MM-964 excluded from cost breakdown provided to PMOC – $6.5 million • HART adjustment for “Known changes” at time of analysis – $32.5 million • Potential Changes Identified with no associated estimate – $25 million • Disagreement in savings for change to 4-Car Trains – $5 million • Escalation component of delay settlement for WOFH/KHG/MSF – $10 million • Resolution of disputed Contract Change Orders – $5 million • HART adjustment for Stations – $23.8 million
o Westside Stations – $8.9 million o Pearl Highlands Transit Center – $10 million o Airport Station Group – $5.6 million o Dillingham/Kaka’ako Station Group – $0.7 million (Deduct)
• HART adjustment for Airport and City Center Guideway (rescue carts) – $1.4 million
Honolulu Rail Transit Project PMOC Report – 2014 Risk Refresh July 2014 (FINAL)
25
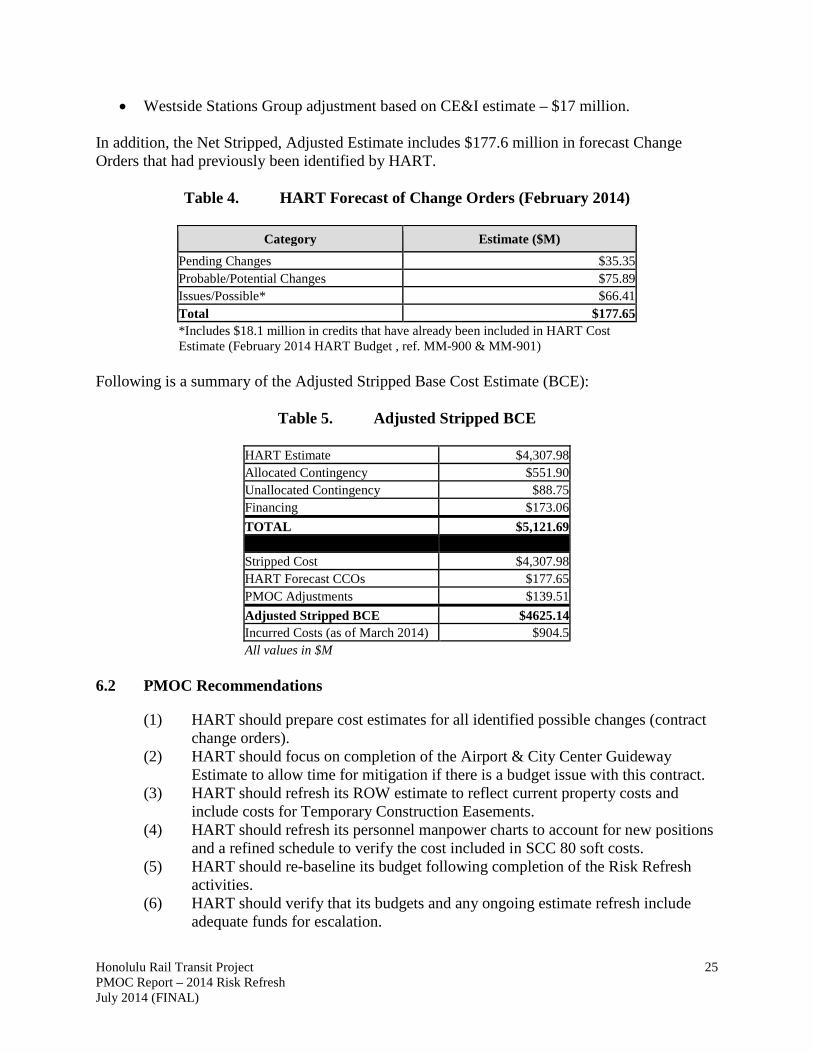
• Westside Stations Group adjustment based on CE&I estimate – $17 million. In addition, the Net Stripped, Adjusted Estimate includes $177.6 million in forecast Change Orders that had previously been identified by HART.
Table 4. HART Forecast of Change Orders (February 2014)
Category Estimate ($M) Pending Changes $35.35 Probable/Potential Changes $75.89 Issues/Possible* $66.41 Total $177.65 *Includes $18.1 million in credits that have already been included in HART Cost Estimate (February 2014 HART Budget , ref. MM-900 & MM-901)
Following is a summary of the Adjusted Stripped Base Cost Estimate (BCE):
Table 5. Adjusted Stripped BCE
HART Estimate $4,307.98 Allocated Contingency $551.90 Unallocated Contingency $88.75 Financing $173.06 TOTAL $5,121.69 Stripped Cost $4,307.98 HART Forecast CCOs $177.65 PMOC Adjustments $139.51 Adjusted Stripped BCE $4625.14 Incurred Costs (as of March 2014) $904.5 All values in $M
6.2 PMOC Recommendations
(1) HART should prepare cost estimates for all identified possible changes (contract change orders).
(2) HART should focus on completion of the Airport & City Center Guideway Estimate to allow time for mitigation if there is a budget issue with this contract.
(3) HART should refresh its ROW estimate to reflect current property costs and include costs for Temporary Construction Easements.
(4) HART should refresh its personnel manpower charts to account for new positions and a refined schedule to verify the cost included in SCC 80 soft costs.
(5) HART should re-baseline its budget following completion of the Risk Refresh activities.
(6) HART should verify that its budgets and any ongoing estimate refresh include adequate funds for escalation.

Honolulu Rail Transit Project PMOC Report – 2014 Risk Refresh July 2014 (FINAL)
26
7.0 PROJECT RISK
7.1 Purpose
Per FTA Oversight Procedure (OP) 40, PMOC has performed “an evaluation of the reliability of the grantee’s project scope, cost estimate, and schedule, with special focus on the elements of uncertainty associated with the effectiveness and efficiency of the grantee’s project implementation and within the context of the surrounding project conditions.” Through the process of risk and contingency review, the PMOC attempts to aid the grantee in its efforts to better define the project’s risks and to provide avenues for recovery should those risks become reality. The purpose of this report is to provide a refresh of recommendations for adjustments to scope, cost, schedule, and project delivery options and to consider risk identification and risk mitigation options and alternatives, particularly in regard to contingencies, in order to respond to established project risks. This report is produced to establish the Project’s ability to complete on time and within the identified budget. This report is based on information provided by HART as of April 2014.
7.2 Methodology
The purpose of this section is to describe the review and evaluation methodology utilized by the PMOC with regards to HART’s identification of project risk and its plans for mitigating and managing these risks, including the use of schedule and cost contingencies. The PMOC is required to synthesize available project information, explore and analyze uncertainties and risks, and provide a qualitative and quantitative assessment of ranges of forecasted cost and schedule. The PMOC reviewed risk mitigation options and alternatives, including use of cost and schedule contingencies. The risk refresh requires an evaluation of the reliability of HART’s project scope, cost estimate, and schedule, with specific focus on the elements of uncertainty normally associated with the implementation of the project. PMOC reviewed scope, cost, and schedule documents and presented these reviews in separate spot reports on each topic. The objective of this refresh is to assess changes in the project risks and uncertainties associated with project conditions and the effectiveness and efficiency of project implementation in identifying and mitigating risks in regard to scope, cost and schedule. This report provides a qualitative and quantitative assessment of the ranges of forecasted cost and schedule and project management planning in order to respond to project risk. The PMOC’s refresh is understood to be a critical input to FTA’s decision regarding project advancement and funding. The PMOC has performed regular monitoring visits to HART’s project and has refreshed the PMOC’s earlier risk assessment based upon an updated understanding of project risks and updated schedule and cost information provided by HART. In April 2014, the PMOC participated in a risk refresh workshop with HART, the purpose of which was to discuss HART’s progress in its risk management efforts, and to discuss PMOC’s observations and reflections from PMOC’s initial review of HART’s updated scope, cost, schedule, and risk information.
Honolulu Rail Transit Project PMOC Report – 2014 Risk Refresh July 2014 (FINAL)
27
For the purposes of its risk refresh, the PMOC considered the project in three separate elements, which are termed here as “risk profiles”:
• Risk Profile 1 is associated with currently-contracted direct cost work; • Risk Profile 2 is associated with yet-to-be-contracted direct cost work; and • Risk Profile 3 is associated with “soft costs.”
7.3 Risk Identification
The PMOC has reviewed HART’s updated risk register and has found that HART has been reasonably diligent in its efforts to track and revise its risk register through internal project risk tracking processes. In its review of the project’s scope, estimate, and schedule, the PMOC did not develop any recommendations for adjustment to HART’s risk register.
7.4 Contract Packaging
HART is utilizing both traditional (Design/Bid/Build or DBB) and alternative (Design/Build or DB and Design/Build/Operate/Maintain or DBOM) project delivery methods for the various contracts. The WOFH DB Contract, KHG DB Contract, MSF DB Contract, and the CSC DBOM have all been selected and contracted. The majority of the remaining work (Airport and City Center Guideway and Utilities and stations) is anticipated to be procured utilizing a traditional DBB method. HART is utilizing DB for the Pearl Highlands Station, Parking Structure and H-1 Ramps. To achieve expected market efficiencies and in hope of reducing cost, elements of this work have been consolidated into larger packages than earlier planned.
7.5 Cost Risk Assessment
This section includes the PMOC refresh of the cost risk of the project, based on the PMOC’s review of HART’s capital cost estimate. This section also describes the Beta Range Factor (BRF) assignments for the SCC Risk Assessment utilized in the FTA Risk and Contingency Review Workbook. Finally, the cost risk evaluation is described and the results are reported. 7.5.1 Methodology
Cost risk evaluation is a combination of the PMOC’s professional judgment and objective cost data to summarize and make adjustments to HART’s cost estimate. This is in addition to a rational and empirical application of a risk model analysis used to simulate the magnitude of project risk and establish the potential responses to manage the risk. In the context of the project risk evaluation, quantitative risk assessment is utilized in the analysis of risk exposure and the corresponding management of uncertainty. The PMOC utilized the following steps for the cost risk analysis of the project:
(1) The PMOC conducted a cost review of the estimates of the project budget. The results of the PMOC review include an adjusted cost estimate that represents a more likely base cost of the project costs. For the project, HART costs are largely based on detailed and parametric estimating procedures, utilizing industry standards and pricing recently received on contracts for this project.
(2) A Stripped Cost Estimate was then developed from the adjusted cost estimate.

Honolulu Rail Transit Project PMOC Report – 2014 Risk Refresh July 2014 (FINAL)
28
The PMOC removed contingency funds embedded in the adjusted estimate, including both contingencies allocated by SCC and general unallocated contingencies. The PMOC interviewed HART’s estimating staff to determine the extent to which latent (hidden) contingencies existed within the estimate, and found no latent contingency to review. The resulting Adjusted Cost Estimate was reported in YOE dollars.
(3) A likely range of costs was then established, utilizing the FTA Risk and Contingency Review Workbook. The Adjusted Cost Estimate for each SCC Cost Element was then established as the lower bound value of the SCC Element Cost Range. The upper bound of the SCC Cost Element range is established through multiplying the lower bound value by a BRF, i.e., upper bound = BRF*lower bound.
(4) For the Project, the Adjusted Estimate was divided between Risk Profiles 1, 2, and 3, as described earlier.
(5) BRF values were established by the PMOC through a process that initially utilized the guidelines indicated in OP 40 and then adjusted the Beta Factors based upon specific project situations and identified risks. An example is that, for the project, the design and market factors for the DB and DBOM work warranted much lower beta factors than other cost categories, since their design and market prices are largely established. With previously developed information from the risk registers, an assessment of appropriate beta factors for the risk worksheet was made. This assessment occurred independently for each Risk Profile.
(6) Once the Beta values were assigned to each portion of work, the resulting Risk Profiles were combined to develop an overall project risk assessment, including establishment of a target budget and recommended contingencies. These results provided a basis for evaluation of HART’s budget and contingencies.
7.5.2 SCC Adjustments
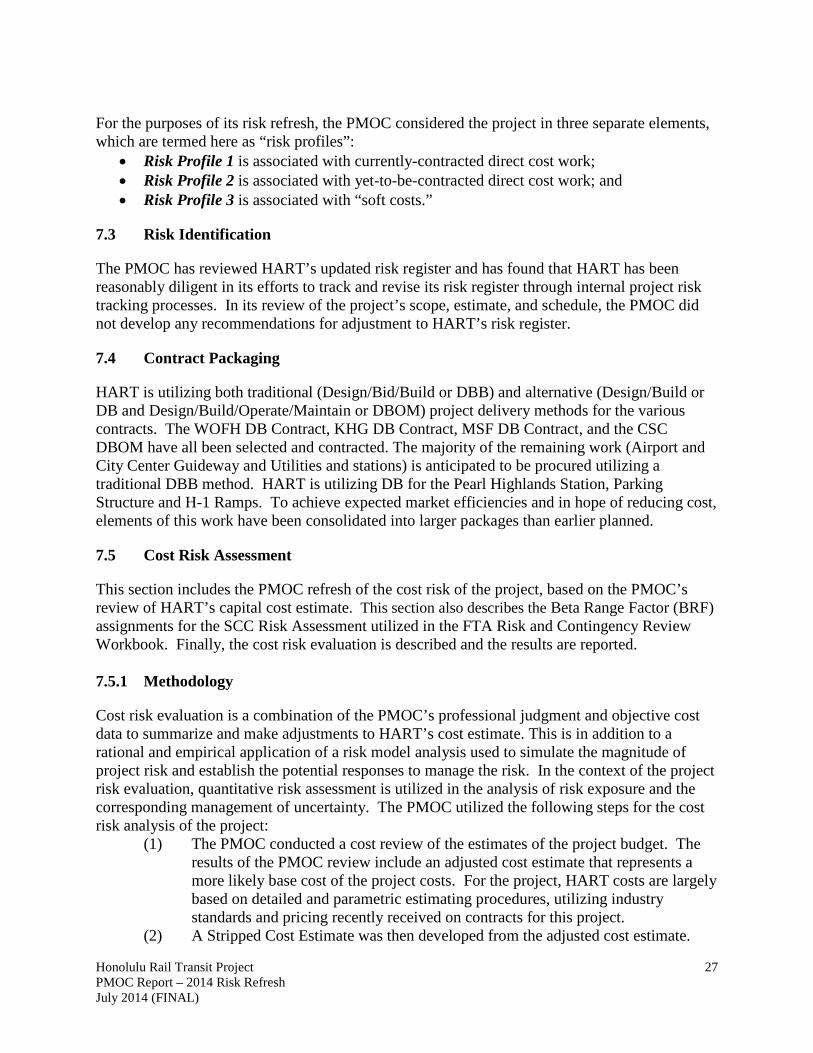
The PMOC used its professional judgment as well as evaluation of objective data to develop its assessment of the Project costs and to develop the indicated adjustments. Adjustments noted below include changes proposed by the PMOC as well as changes proposed by HART, largely as a result of the April 15, 2014 Risk Workshop, and includes some minor adjustments due to post-workshop information received from HART. The following indicates adjustments made to the HART estimate; some adjustments were made to each risk profile. See Table 6 for a summary of PMOC/HART adjusted project costs by major SCC. The Adjusted Estimate represents the stripped project cost in $YOE.
Honolulu Rail Transit Project PMOC Report – 2014 Risk Refresh July 2014 (FINAL)
29
Table 6. PMOC Adjustments to HART Estimate $YOE
The PMOC recommended an adjustment to the base cost estimate in the amount of $139.5 million. Note that no latent contingency adjustments were made from any portion of HART’s estimate. Details of the adjustments are discussed Section 6.0 of this report. 7.5.3 Baseline Beta Values
For each risk profile, the starting point for the Beta values in this risk assessment were based on the Beta values imported from the prior, 2012 risk refresh and are shown by major SCC category in the tables below. These values are developed from FTA standards, adjusted in consideration of slight advancements in the stage of project and in consideration of the current level of estimate.

Honolulu Rail Transit Project PMOC Report – 2014 Risk Refresh July 2014 (FINAL)
30
Table 7. Imported Beta Values for Risk Profile 1
SCC R D M C Total Beta
SCC 10 - 50 0.00 0.00 0.00 0.38 1.43 SCC 60 0.00 0.25 0.40 0.25 1.95 SCC 70 0.00 0.50 0.10 0.30 1.95 SCC 80.01-08 Not applicable R = Requirements Risk D = Design Risk M = Market Risk C = Construction Risk Total Beta = 1 + (R + D + M + C)
Table 8. Imported Beta Values for Risk Profile 2
SCC R D M C Total Beta
SCC 10 - 50 0.00 0.25 0.25 0.45 2.20 SCC 60 0.00 0.40 0.80 0.25 2.40 SCC 70 Not applicable SCC 80.01-08 Not applicable R = Requirements Risk D = Design Risk M = Market Risk C = Construction Risk Total Beta = 1 + (R + D + M + C)
Table 9. Imported Beta Values for Risk Profile 3
SCC R D M C Total Beta
SCC 10-50 Not applicable SCC 70 Not applicable SCC 80.01 Not applicable SCC 80.02 SCC 80.03 SCC 80.04 SCC 80.05 SCC 80.06 SCC 80.07 SCC 80.08
0.00 0.00 0.00 0.00 0.00 0.00 0.00
0.14 0.17 0.24 0.08 0.19 0.19 0.42
0.14 0.06 0.31 0.05 0.11 0.23 0.25
0.21 0.40 0.35 0.25 0.39 0.47 0.60
1.54 1.68 1.95 1.43 1.74 1.94 2.32
R = Requirements Risk D = Design Risk M = Market Risk C = Construction Risk Total Beta = 1 + (R + D + M + C)
Beta values for the current project were developed based on a refreshed view of the Scope, Cost, and Schedule risks identified in the project, informed by regular PMOC site visits and project reviews. The Beta values were refreshed from previous Beta assignments by the PMOC team and used for the refreshed final cost risk assessment. Note that the Beta value adjustments occurred independently for each Risk Profile as applicable. These Beta values were assigned as outlined in FTA guidance OP 40, and generally fall within ranges expected for this character of project. Beta values were applied at the second level SCC structure.

Honolulu Rail Transit Project PMOC Report – 2014 Risk Refresh July 2014 (FINAL)
31
Table 10. Beta Values Risk Refresh
SCC Description Risk Profile 1
Risk Profile 2
Risk Profile 3
10 Guideway& Track Elements (Route Miles) 10.04 Guideway: Aerial structure 1.33 2.05 - 10.08 Guideway: Retained cut or fill 1.33 - - 10.09 Track: Direct fixation 1.33 2.05 - 10.11 Track: Ballasted 1.33 - - 10.12 Track: Special (switches, turnouts) - 2.05 - 20 Stations, Stops, Terminals, Intermodals 20.01 At-grade station, stop, shelter, mall, terminal, platform - 2.03 - 20.02 Aerial station, stop, shelter, mall, terminal, platform - 2.03 - 20.06 Automobile parking multi-story structure - 2.03 - 20.07 Elevators, escalators 1.33 - - 30 Support Facilities: Yards, Shops, Admin. Bldgs. 30.02 Light Maintenance Facility 1.33 - - 30.03 Heavy Maintenance Facility 1.33 - - 30.04 Storage or Maintenance of Way Building 1.33 - - 30.05 Yard and Yard Track 1.33 - - 40 Sitework& Special Conditions 40.01 Demolition, Clearing, Earthwork 1.33 2.10 - 40.02 Site Utilities, Utility Relocation 1.33 2.10 - 40.03 Haz. mat'l, contam'd soil removal/mitigation, ground water treatments 1.33 2.10 - 40.04 Environmental mitigation, e.g. wetlands, historic/archeological, parks 1.33 2.10 - 40.05 Site structures including retaining walls, sound walls 1.33 2.10 - 40.06 Pedestrian / bike access and accommodation, landscaping 1.33 2.10 - 40.07 Automobile, bus, van accessways including roads, parking lots 1.33 2.10 - 40.08 Temporary Facilities and other indirect costs during construction 1.33 - - 50 Systems 50.01 Train control and signals 1.33 - - 50.02 Traffic signals and crossing protection - 2.10 - 50.03 Traction power supply: substations 1.33 - - 50.04 Traction power distribution: catenary and third rail 1.33 2.10 - 50.05 Communications 1.33 - - 50.06 Fare collection system and equipment 1.33 - - 50.07 Central Control 1.33 - - 60 ROW, Land, Existing Improvements 60.01 Purchase or lease of real estate - 2.00 - 60.02 Relocation of existing households and businesses 1.95 2.00 - 70 Vehicles 70.01 Light Rail 1.55 - - 70.06 Non-revenue vehicles 1.95 - - 70.07 Spare parts 1.55 - - 80 Professional Services 80.01 Preliminary Engineering - - 1.05 80.02 Final Design - - 1.25 80.03 Project Management for Design and Construction - - 1.35 80.04 Construction Administration & Management - - 1.45 80.05 Professional Liability and other Non-Construction Insurance - - 1.33 80.06 Legal; Permits; Review Fees by other agencies, cities, etc. - - 1.59 80.07 Surveys, Testing, Investigation, Inspection - - 1.72 80.08 Start up - - 2.32

Honolulu Rail Transit Project PMOC Report – 2014 Risk Refresh July 2014 (FINAL)
32
7.5.4 Beta Value Adjustments
Significant issues noted in the scope, cost, and schedule reviews are reflected in the risk assessment model by means of adjustments to the risk Beta factors (β) applied to each SCC sub-category. These adjustments result in forecasts of ranges of cost for the project. Standard FTA Beta values incorporate an expectation of common risks that occur across transit projects; Beta adjustments below reflect those increases or decreases in risk that differ from risks occurring within standard Beta values. The following sections present detail regarding the basis for adjustments, reflected previously in Table 6, beyond standard OP 40 Beta value suggestions. The purpose of this listing is to provide information regarding Beta values of note.
SCC Wide Beta Value Changes System-wide Beta adjustments were made to two Risk Profiles: in Risk Profile 1, a reduction of 0.1 to the Construction Beta was made to recognize the refinement of change order estimates since the last review; and in Risk Profile 2, a Beta increase of 0.10 was made to the Market Beta in recognition of cost pressure due to a tightening of the construction market and a Beta increase of 0.10 was made to the Construction Betas due to concern that many multiple contractors will increase risk due to potential conflicts among the contractors. SCC-Specific Beta Value Changes The following issues determined the final resulting Beta values for the SCC sub-categories, which are the Beta values that reflect risk across all four categories of Requirements, Design, Market, and Construction risk, including the general Beta value increases previously noted in the section above. Noted below are only those conditions where exceptional changes to the standard Betas were noted. “Normal” risks associated with similar construction are accounted for in the base risk model.
SCC-70 – Vehicles (Risk Profile 1)
• Design Risk o 70.01 & 70.07 (β) = 1.55, decrease D to 0.10. Vehicle design work has
advanced during the interim period since the last review. SCC-10 – Guideway (Risk Profile 2)
• Design Risk o 10.04, 10.09, & 10.12 (β) = 2.10, decrease D to 0.10. Guideway plans have
advanced to approximately the 90% level, and existing guideway work has provided the opportunity to resolve design unknowns.
SCC-20 – Stations, Stops (Risk Profile 2) • Requirements and Design Risk
o 20.01, 20.02, & 20.06 (β) = 2.30, increase R to 0.05 and decrease D to 0.30. Discussion continues with property owners that may result in design changes. At the same time, general design has advanced on the stations since the last review.

Honolulu Rail Transit Project PMOC Report – 2014 Risk Refresh July 2014 (FINAL)
33
SCC-40 – Sitework and Special Conditions (Risk Profile 2) • Design Risk
o 40.01 – 40.07 (β) = 2.10, decrease D to 0.15. Advanced work in siting and resolving utilities and other site investigations brings more certainty to the design.
SCC-50 – System (Risk Profile 2) • Requirements and Design Risk
o 50.02 & 50.04 (β) = 2.10, decrease D to 0.15. Systems design has advanced since the last review.
SCC-60 – Right of Way (Risk Profile 2) • Design and Market Risk
o 60.01 & 60.02 (β) = 2.00, decrease D to 0.10 and M to 0.60. This Beta change recognizes that estimate adjustments were made that increase cost. The Beta adjustment here is for potential risk above the estimate adjustment that was made to the stripped estimate.
SCC-80 – Soft costs (Risk Profile 3) • Design, Market, and Construction Risk: The following changes to the “soft cost”
portions of the work all reflect the same reason. Since the last review, much work has been done to resolve staffing and professional services contract issues. Further, the detailed review of the project team staffing also resulted in an increase to the stripped estimate. Therefore, this adjustment recognizes the resulting reduction in risk since the last review. o 80.02 (β) = 1.25, decrease D to 0.05, M to 0.05, & C to 0.10 o 80.03 (β) = 1.35, decrease D to 0.05, M to 0.05, & C to 0.20 o 80.04 (β) = 1.45, decrease D to 0.10, M to 0.05, & C to 0.25 o 80.06 (β) = 1.59, decrease D to 0.10 & M to 0.05 o 80.07 (β) = 1.25, decrease D to 0.19, M to 0.23, & C to 0.25
7.5.5 Cost Risk Analysis
This section presents the PMOC’s analysis of the model-based Project Cost Risk Assessment based on the FTA Risk and Contingency Review Workbook (version 4.0), utilizing the project-adjusted BRFs. This workbook is based on the summary organizational structure of the FTA SCC 10 through 80 for the capital cost elements of a project. SCC 90 (contingency) is specifically excluded as a duplicate measure of risk. Risk for SCC 100 (finance charges) is not covered in the standard FTA risk range factors. Project-level risk is an aggregated amount of the risk associated with all of the SCC Ranges. Using the Beta values in Table 10, a simulation project risk model was developed, as presented later in this report. Table 11 presents the corresponding numeric data results from the risk model.

Honolulu Rail Transit Project PMOC Report – 2014 Risk Refresh July 2014 (FINAL)
34
Table 11. Risk Model Data
Further analysis of these amounts is provided in other sections below. 7.5.6 Cost Contingency
The PMOC identified YOE $463 million in allocated and unallocated contingency, and found no additional latent contingency. This amount is reflected in Table 12. Further, with known estimate adjustments, that contingency is likely to be currently reduced to $323.5 million.
Table 12. PMOC Recommended Contingency
The PMOC prepared a risk assessment by Risk Profile as previously described. At this refresh, the PMOC recommends approximately 7% contingency for the Risk Profile 1 (contracted direct cost), 22% for the Risk Profile 2 (uncontracted direct cost), and 8% contingency for the Risk

Honolulu Rail Transit Project PMOC Report – 2014 Risk Refresh July 2014 (FINAL)
35
Profile 3 (soft costs), equating to an overall contingency recommendation of $588.8 million (or ~13%).
7.6 Schedule Risk Assessment
7.6.1 Methodology
The Schedule Risk Assessment is based on the Master Project Schedule with a Data Date of February 28, 2014. As noted in the following discussion, the PMOC conditioned the MPS for use in the risk assessment. This review focuses on the elements of schedule uncertainty associated with the effectiveness and efficiency of HART’s project implementation, the project scope, and surrounding project conditions. The OP 40 schedule analysis output data are generated from Oracle’s “Pertmaster Risk Analysis” software program used by the PMOC. The PMOC risk analysis process conforms to the software user manual and intent of the OP 40 as described below: There are two kinds of project risk:
• Uncertainty risks are inherent variability that makes it impossible to predict exactly how long an activity will take. For instance, you can estimate how long it will take within a range of uncertainty, but you can never predict exactly how long.
• Risk events are events separate from an activity that can disrupt or otherwise impact the activity.
Pertmaster handles risk events by using a Risk Register to enter potential risk events and estimates of the probability and impact of the risks on activity duration, costs, and project quality. Once uncertainty and risk event impact estimates have been entered for all tasks within a project, Pertmaster performs a high number of project simulations using “Monte Carlo” or “Latin Hypercube” sampling of the estimates to select random task duration and cost values for every run-through of the simulation. These simulations generate a range of outcomes that can be used to predict project duration and costs with statistical confidence. The Critical Path Method (CPM) is the traditional means for determining a project finish date. However, because CPM only determines a single date and does not consider potential risks, results are not always comprehensively reliable. Risk Analysis uses risk inputs to determine a range of project finish dates with more confidence and reliability. The Pertmaster risk analysis is based on the risk management process outlines in Chapter 11 of the Project Management Institute’s “A Guide to the Project Management Body of Knowledge” and consists of the components shown below. The process is not strictly linear; there may be considerable repetition of certain steps before moving on. Schedule Review The purpose of the Schedule Review “Characterization” is to check HART’s project schedule, referred to as the Current Probable Schedule (CPS) for logic errors, open-ended tasks, negative lags, start-to-finish links, and other potential problems that could compromise the risk analysis.
Honolulu Rail Transit Project PMOC Report – 2014 Risk Refresh July 2014 (FINAL)
36
This step ensures the integrity of the schedule and improves the chances for a meaningful analysis. If mechanical or fundamental revisions are necessary based upon the schedule characterization, the risk management team makes the necessary adjustments and creates a revised schedule file, called the Adjusted Project Schedule (APS). Pre-Analysis Check A rudimentary analysis of the schedule is performed to identify activities that drive project duration and costs. These activities merit the closest attention during subsequent detailed risk analysis. Build a Risk Model Estimates for duration, cost, and resource uncertainty for each project task are identified by a specific team of experts relying on industry statistics and experience. The estimate uncertainty duration ranges are incorporated into a copy of the project schedule called the Estimate Uncertainty Model (EUM). The team then brainstorms a list of potential risk events, evaluates the risk events as to how likely it is that they may occur and the potential impact such occurrences may have. The list of risk events is then entered into a risk register and each risk event is assigned a probability and impact, resulting in a risk degree factor, which is scored by the risk modeling software. At this point, a copy of the EUM is made, to which Pertmaster then applies the uncertainty and maps the risk events to the appropriate tasks to build a risk model, called an Impacted Risk Model (IRM). Analyze and Review A “Monte Carlo” or “Latin Hypercube” sampling analysis is run on the IRM. The risk analysis output can be viewed and evaluated in a wide variety of reports. The review options allow the risk management team to focus on areas of the schedule that pose the greatest risk to the overall program. This helps with the creation of an efficient and cost-effective risk mitigation plan.
Mitigate and Report Based on the preliminary analysis, the risk management team reviews and evaluates alternative scenarios with varying reductions to duration, resource and cost uncertainty. Ultimately, the most cost-effective risk mitigation strategy is chosen and formalized into a risk mitigation plan.

Honolulu Rail Transit Project PMOC Report – 2014 Risk Refresh July 2014 (FINAL)
37
Figure 3. Schedule Risk Assessment Process
The figure below describes the various schedules that are created once the PMOC commences the OP 34 review of HART’s project schedule, called the CPS. The final product is the IRM, which the PMOC uses for the risk analysis in Pertmaster.
Figure 4. Schedule Risk Assessment Steps and Schedule Types
7.6.2 Schedule Risk Analysis
Project Schedule Review The PMOC used HART’s project schedule file “FEB 2014 Update - Risk Refresh-04-02-14.xer” (CPS) to conduct the Schedule Review. The PMOC concentrated its efforts on ensuring that a detailed, mechanical and fundamentally sound schedule was used for both the risk assessment and the contingency analysis. HART and the PMOC collaboratively worked through initial master program schedule development to ensure adequate detail and logic to support the PMOC risk analysis. The PMOC made a backup copy of the CPS electronic file and made several logic adjustments to
RiskRegister
DescriptionStep
Identification
Mitigation
Qualitative Analysis
Quantitative Analysis
Tracking
Asse
ssm
ent
Risk assessment begins by identifying potential project risk events, usually from “brainstorming” session.
Analyze the risk probability and impact, and score “rank”identified risk. Risk Degree = Probability X Impact.
Transform risk data into decision making information by assessing probability and impact on a risk register.
Develop risk mitigation plan against identified and analyzed risk factor based on risk information.
Tracking residual risks, identify new risks, and accumulate risk information throughout the project life cycle.
Step
Identification
Mitigation
Qualitative Analysis
Quantitative Analysis
Tracking
Asse
ssm
ent
Risk assessment begins by identifying potential project risk events, usually from “brainstorming” session.
Analyze the risk probability and impact, and score “rank”identified risk. Risk Degree = Probability X Impact.
Transform risk data into decision making information by assessing probability and impact on a risk register.
Develop risk mitigation plan against identified and analyzed risk factor based on risk information.
Tracking residual risks, identify new risks, and accumulate risk information throughout the project life cycle.

Honolulu Rail Transit Project PMOC Report – 2014 Risk Refresh July 2014 (FINAL)
38
account for poor or missing logic ties and increased some activity detail to better represent the network logic in order to produce a more realistic risk analysis model. The PMOC used the “adjusted” project schedule, herein referred to as the “Adjusted Project Schedule” (APS), to provide more realistic risk assessment and contingency analysis output. The APS is considered most optimistic, as it is stripped of all latent and patent time contingency. The HART Basis of Schedule stated that all activities in the MPS contained a 4% contingency. Most activities in the MPS utilize a 7-day per week calendar that does not contain non-work periods for weekends or holidays. The PMOC has continually recommended HART use multiple calendars to more accurately represent and distinguish non-work periods. HART stated that it is having difficulty persuading the construction contractors to change their standard work calendar library from 7 days to 5 days. The PMOC reduced original durations on some longest critical path activities as a means to strip the embedded 4% contingency purported by HART. The risk analysis adjusts the activity duration distribution ranges in order to establish a reliable and supportable risk analysis calculation, primarily for determining the project completion date. A summary of the PMOC adjustments are listed below:
• Deleted (stripped) all activities containing “buffer float” • Minor logic changes were made for activities containing excessive float • Some longest critical path original durations were shorted to account for built-on time
contingency. Pre-Analysis Check The PMOC performed a pre-analysis check by applying a quick risk distribution range across all schedule activities and reviewing the confidence level range, duration sensitivity, and criticality index. Preliminary notes and observations were made for specific schedule drivers. Note that the pre-analysis check is performed as a pre-impacted risk analysis, meaning that the schedule does not have risk events incorporated at this point of the risk analysis process. Build a Risk Model “Impacted Risk Plan” (1) Estimate Uncertainty Model (EUM)
Before running the risk analysis, the PMOC assigned three durations to each activity in the schedule. The three durations for each activity represent best case “minimum”, most likely, and worst case “maximum”. The PMOC reviewed the activity Original Durations (OD) in the CPS and made an objective determination of the adequacy of each OD. The PMOC used most of the schedule OD durations as the most-likely durations and, in some cases, the PMOC determined that certain activity ODs were overly optimistic. Most of the “maximum” durations the PMOC assigned are 25-30% greater than their ODs, depending on the work task, project phase and task location. Also, some final design and FFGA related activities containing a one-day duration were assigned a worst-case duration of 3 days, or 300% of the original duration. The best-case durations were calculated as 95% of the OD, or “- 5%”. This value is low because the EUM is already based on a stripped and “best case” schedule. The value ranges (differences in activity

Honolulu Rail Transit Project PMOC Report – 2014 Risk Refresh July 2014 (FINAL)
39
durations) reflect levels of uncertainty. Based on the three durations, a triangular distribution was assigned to each activity.
Figure 5. Duration Distribution Type
Once the estimate uncertainty process step is complete, the EUM is used to develop the Impacted Risk Model (IRM). (2) Impacted Risk Model (IRM) The PMOC conducted a review and evaluation of all risks in the HART Project risk register and the PMOC risk register in order to decide which risk events should be used for the schedule risk analysis (Pertmaster). Once the risks were culled and prioritized, the PMOC assigned the risks events into the longest critical path and into the respective project alignment sections, WOFH/ Kamehameha, Airport and City Center, and the MSF. Risk events (ID numbers) are used in the risk register to build the risk plan. Many of the risk events are tied to the Airport and City Center section alignment since they are located near downtown and inherently contain more uncertainty than the more westerly, non-critical alignment sections that do not do adversely affect the risk analysis. The PMOC risk events used to perform the Risk Analysis are listed below:
• ROW acquisition delay (Airport/ City Center) • Utility issues & delays (Airport/ City Center) • Bidding delays, protests, rebidding required (Airport/ City Center) • Traffic management and congestion delays (Airport/ City Center) • Labor Availability Challenges (Airport/ City Center) • Encounter delays with core systems automation (Airport/ City Center) • Vehicle manufacturing delivery, startup, testing challenges (Airport/ City Center)
Each risk event was scored based on a risk degree factor. The risk degree factor is calculated by the risk event probability and impact factors. The probability and impact factors for each risk event are objectively determined by the PMOC risk management team. The risk register scoring system prioritizes each risk event by the risk degree factor, see figure below.
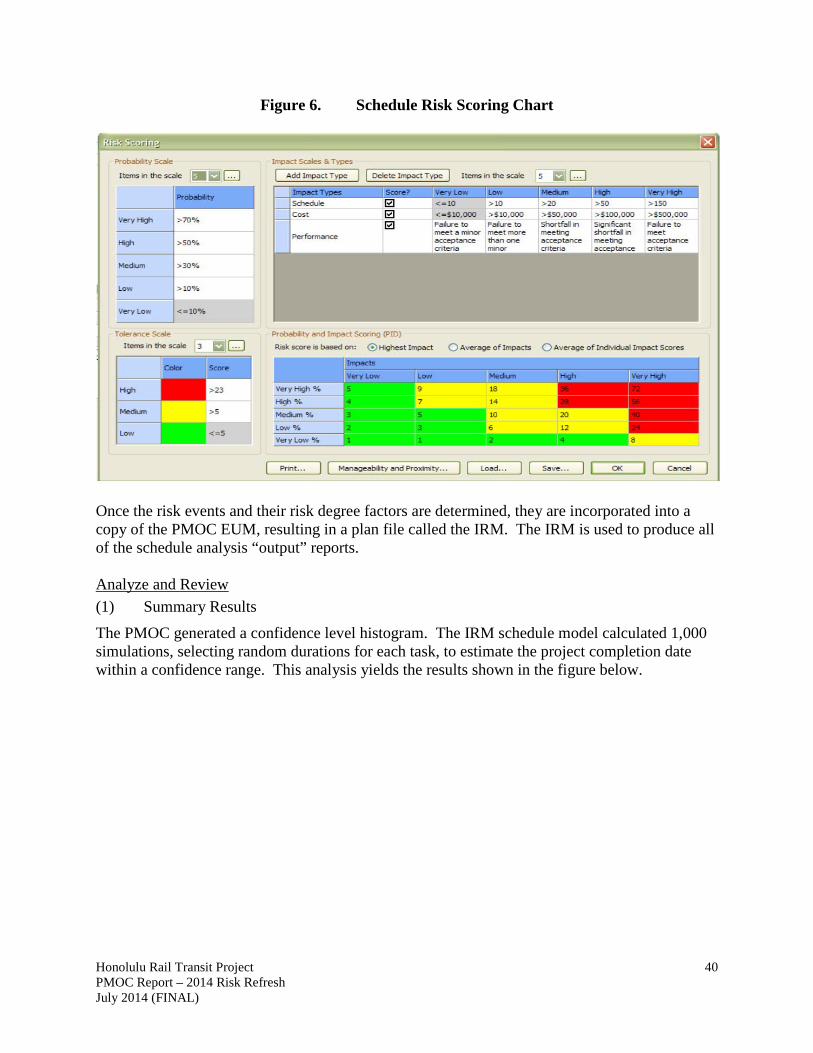
Honolulu Rail Transit Project PMOC Report – 2014 Risk Refresh July 2014 (FINAL)
40
Figure 6. Schedule Risk Scoring Chart
Once the risk events and their risk degree factors are determined, they are incorporated into a copy of the PMOC EUM, resulting in a plan file called the IRM. The IRM is used to produce all of the schedule analysis “output” reports. Analyze and Review (1) Summary Results
The PMOC generated a confidence level histogram. The IRM schedule model calculated 1,000 simulations, selecting random durations for each task, to estimate the project completion date within a confidence range. This analysis yields the results shown in the figure below.

Honolulu Rail Transit Project PMOC Report – 2014 Risk Refresh July 2014 (FINAL)
41
Figure 7. Project Completion Date Confidence Level
The IRM distribution range for project completion ranges from the 0% to 100% confidence levels span a 549-day period. The probability percentage points for the IRM are:
• 20% Confidence level completion date: 20-Aug-19 • 50% Confidence level completion date: 17-Dec-19 • 75% Confidence level completion date: 20-Feb-20 • 90% Confidence level completion date : 20-Apr-20 • 100% Confidence level completion date: 31-Jul-20
The risk event results are produced by running a schedule analysis using the IRM which contains qualitative risk events within the software risk register. The true indication of how sensitive each risk event ultimately becomes is not realized until the analysis is performed. For example, a risk event with a very high score does not necessarily mean that it will be highly sensitive to the schedule, as it may only affect non-critical activities containing total float. The schedule drivers that contain the most impact potential contain a high-risk degree and are on the longest critical path or near critical path.
22-Mar-19 08-Oct-19 25-Apr-20
Distribution (start of interval)
0.0
10.0
20.0
30.0
40.0
Hits
0% 28-Jan-19
5% 07-May-19
10% 19-Jun-19
15% 27-Jul-19 20% 20-Aug-19
25% 11-Sep-19
30% 03-Oct-19
35% 23-Oct-19
40% 12-Nov-19
45% 02-Dec-19 50% 17-Dec-19
55% 31-Dec-19
60% 14-Jan-20
65% 25-Jan-20
70% 06-Feb-20
75% 20-Feb-20
80% 08-Mar-20 85% 24-Mar-20
90% 20-Apr-20
95% 15-May-20
100% 31-Jul-20
Cum
ulat
ive
Freq
uenc
y
Impacted Risk Model - April 2014Entire Plan : Finish Date
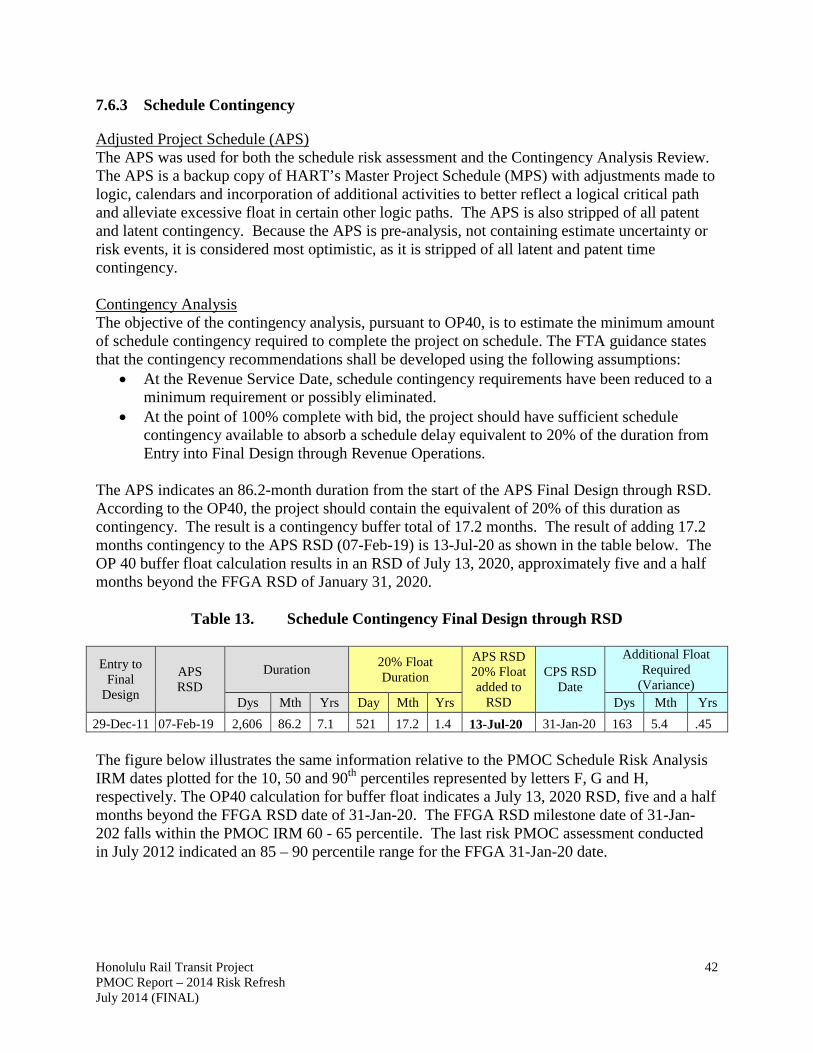
Honolulu Rail Transit Project PMOC Report – 2014 Risk Refresh July 2014 (FINAL)
42
7.6.3 Schedule Contingency
Adjusted Project Schedule (APS) The APS was used for both the schedule risk assessment and the Contingency Analysis Review. The APS is a backup copy of HART’s Master Project Schedule (MPS) with adjustments made to logic, calendars and incorporation of additional activities to better reflect a logical critical path and alleviate excessive float in certain other logic paths. The APS is also stripped of all patent and latent contingency. Because the APS is pre-analysis, not containing estimate uncertainty or risk events, it is considered most optimistic, as it is stripped of all latent and patent time contingency. Contingency Analysis The objective of the contingency analysis, pursuant to OP40, is to estimate the minimum amount of schedule contingency required to complete the project on schedule. The FTA guidance states that the contingency recommendations shall be developed using the following assumptions:
• At the Revenue Service Date, schedule contingency requirements have been reduced to a minimum requirement or possibly eliminated.
• At the point of 100% complete with bid, the project should have sufficient schedule contingency available to absorb a schedule delay equivalent to 20% of the duration from Entry into Final Design through Revenue Operations.
The APS indicates an 86.2-month duration from the start of the APS Final Design through RSD. According to the OP40, the project should contain the equivalent of 20% of this duration as contingency. The result is a contingency buffer total of 17.2 months. The result of adding 17.2 months contingency to the APS RSD (07-Feb-19) is 13-Jul-20 as shown in the table below. The OP 40 buffer float calculation results in an RSD of July 13, 2020, approximately five and a half months beyond the FFGA RSD of January 31, 2020.
Table 13. Schedule Contingency Final Design through RSD
Entry to Final
Design
APS RSD
Duration 20% Float Duration
APS RSD 20% Float added to
RSD
CPS RSD Date
Additional Float Required
(Variance) Dys Mth Yrs Day Mth Yrs Dys Mth Yrs
29-Dec-11 07-Feb-19 2,606 86.2 7.1 521 17.2 1.4 13-Jul-20 31-Jan-20 163 5.4 .45 The figure below illustrates the same information relative to the PMOC Schedule Risk Analysis IRM dates plotted for the 10, 50 and 90th percentiles represented by letters F, G and H, respectively. The OP40 calculation for buffer float indicates a July 13, 2020 RSD, five and a half months beyond the FFGA RSD date of 31-Jan-20. The FFGA RSD milestone date of 31-Jan-202 falls within the PMOC IRM 60 - 65 percentile. The last risk PMOC assessment conducted in July 2012 indicated an 85 – 90 percentile range for the FFGA 31-Jan-20 date.
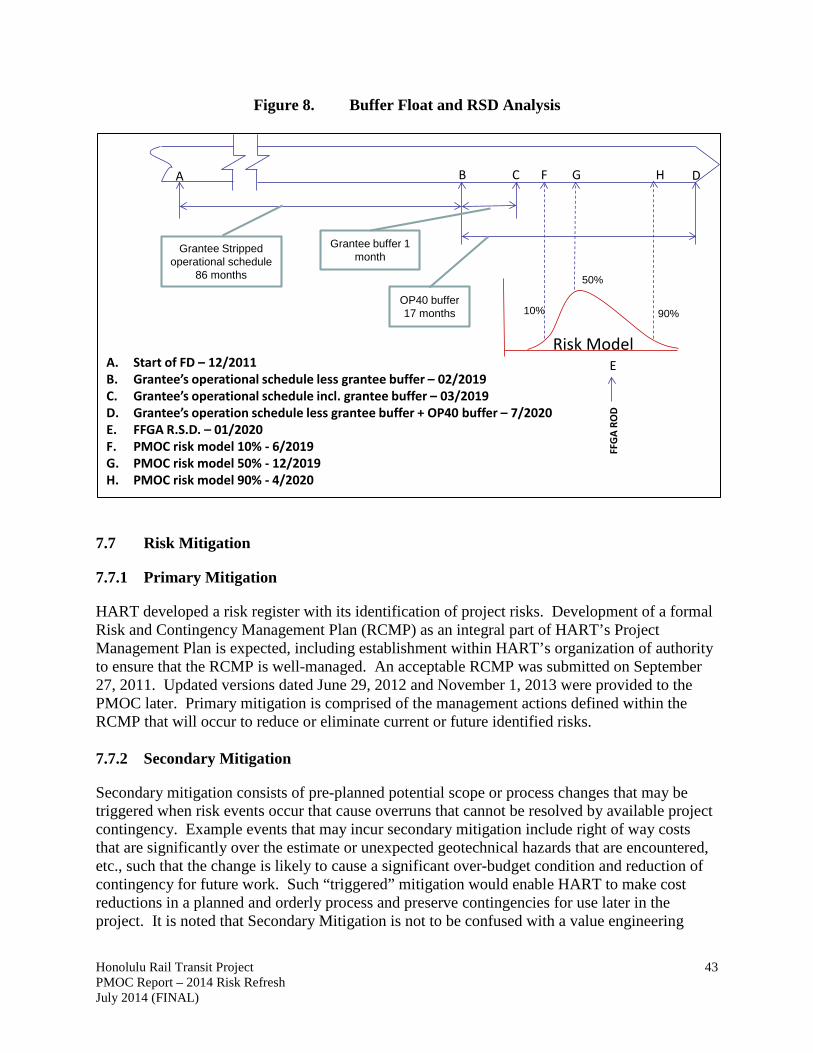
Honolulu Rail Transit Project PMOC Report – 2014 Risk Refresh July 2014 (FINAL)
43
Figure 8. Buffer Float and RSD Analysis
7.7 Risk Mitigation
7.7.1 Primary Mitigation
HART developed a risk register with its identification of project risks. Development of a formal Risk and Contingency Management Plan (RCMP) as an integral part of HART’s Project Management Plan is expected, including establishment within HART’s organization of authority to ensure that the RCMP is well-managed. An acceptable RCMP was submitted on September 27, 2011. Updated versions dated June 29, 2012 and November 1, 2013 were provided to the PMOC later. Primary mitigation is comprised of the management actions defined within the RCMP that will occur to reduce or eliminate current or future identified risks. 7.7.2 Secondary Mitigation
Secondary mitigation consists of pre-planned potential scope or process changes that may be triggered when risk events occur that cause overruns that cannot be resolved by available project contingency. Example events that may incur secondary mitigation include right of way costs that are significantly over the estimate or unexpected geotechnical hazards that are encountered, etc., such that the change is likely to cause a significant over-budget condition and reduction of contingency for future work. Such “triggered” mitigation would enable HART to make cost reductions in a planned and orderly process and preserve contingencies for use later in the project. It is noted that Secondary Mitigation is not to be confused with a value engineering
FFG
A RO
D
A. Start of FD – 12/2011B. Grantee’s operational schedule less grantee buffer – 02/2019C. Grantee’s operational schedule incl. grantee buffer – 03/2019D. Grantee’s operation schedule less grantee buffer + OP40 buffer – 7/2020E. FFGA R.S.D. – 01/2020F. PMOC risk model 10% - 6/2019G. PMOC risk model 50% - 12/2019H. PMOC risk model 90% - 4/2020
A B C D
E
F G H
Grantee Stripped operational schedule
86 months
Grantee buffer 1 month
OP40 buffer 17 months
Risk Model
10%
50%
90%
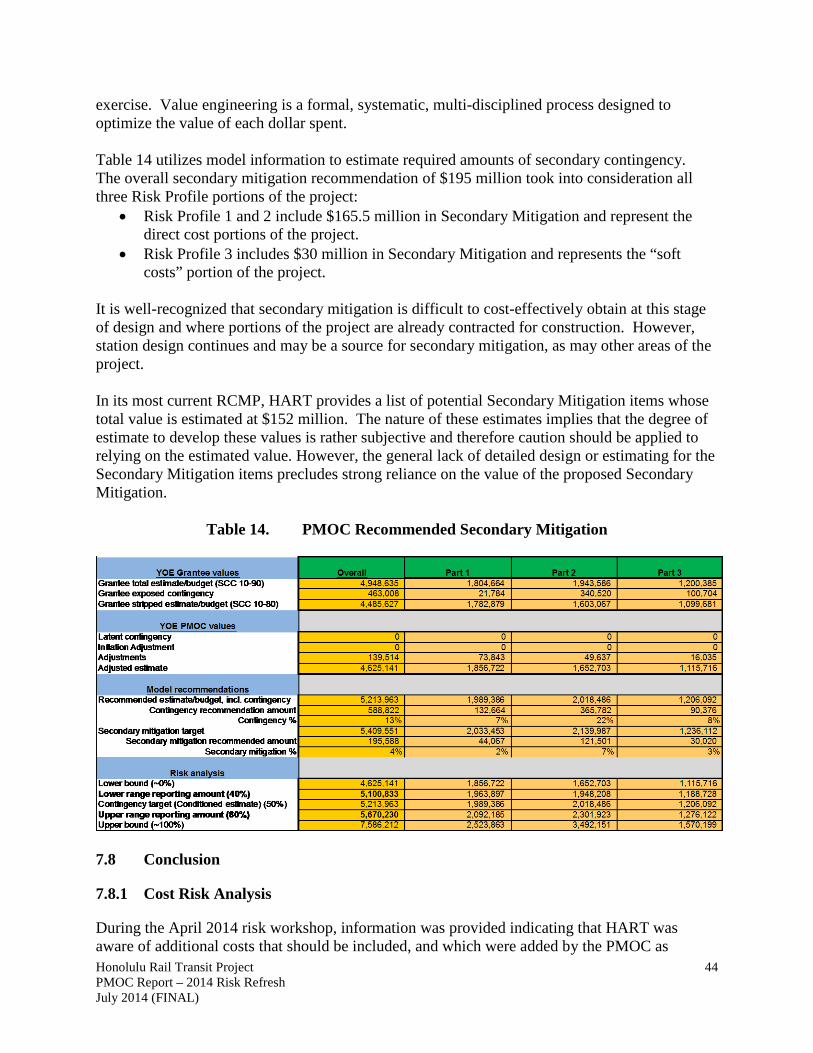
Honolulu Rail Transit Project PMOC Report – 2014 Risk Refresh July 2014 (FINAL)
44
exercise. Value engineering is a formal, systematic, multi-disciplined process designed to optimize the value of each dollar spent. Table 14 utilizes model information to estimate required amounts of secondary contingency. The overall secondary mitigation recommendation of $195 million took into consideration all three Risk Profile portions of the project:
• Risk Profile 1 and 2 include $165.5 million in Secondary Mitigation and represent the direct cost portions of the project.
• Risk Profile 3 includes $30 million in Secondary Mitigation and represents the “soft costs” portion of the project.
It is well-recognized that secondary mitigation is difficult to cost-effectively obtain at this stage of design and where portions of the project are already contracted for construction. However, station design continues and may be a source for secondary mitigation, as may other areas of the project. In its most current RCMP, HART provides a list of potential Secondary Mitigation items whose total value is estimated at $152 million. The nature of these estimates implies that the degree of estimate to develop these values is rather subjective and therefore caution should be applied to relying on the estimated value. However, the general lack of detailed design or estimating for the Secondary Mitigation items precludes strong reliance on the value of the proposed Secondary Mitigation.
Table 14. PMOC Recommended Secondary Mitigation
7.8 Conclusion
7.8.1 Cost Risk Analysis
During the April 2014 risk workshop, information was provided indicating that HART was aware of additional costs that should be included, and which were added by the PMOC as

Honolulu Rail Transit Project PMOC Report – 2014 Risk Refresh July 2014 (FINAL)
45
estimate adjustments, along with PMOC’s independent estimate adjustments. The PMOC has prepared this risk refresh based upon additional information provided by HART after the workshop. The PMOC found that HART’s risk identification effort, including its risk mitigation activities, generally conforms to its documented processes. The PMOC separated the project into three distinct risk profiles to better model the effect of risk upon the project. The cost risk assessment recognized general reductions in risk due to advancement of design. However, little additional construction has occurred and so no major changes in construction risk were made. Further, the project delay has caused the bidding effort to occur during an increase in the construction market, which adds market risk to the model. A major influence in the risk for Risk Profile 2 is market risk due to an increasingly strong construction market both at the project location and on the west coast of the U.S. It is recognized that efforts have been made to recover contingency levels through cost reduction measures, value engineering, and revised project delivery strategies. However, these types of changes are becoming increasingly less likely. The PMOC basis of the stripped, adjusted estimate for cost risk modeling is as follows:
Project Budget $5,122 HART Current Available Contingency $463 Financing $173 Net Stripped Estimate $4,486 PMOC Adjustments $139.5 Net Stripped, Adjusted Estimate $4,625
With adjustments of $139.5 million, the current contingency is reduced to $323.5 million (7% of the adjusted, stripped estimate). This level of contingency would be commensurate with a project that is completely bid and has progressed in construction beyond the point of being “in the ground”. Considering the project progress to date is 22%, this current level of contingency would only reflect an approximate achievable probability of 42%. The predicted FTA model outcome is $5,214 million (excluding finance costs). This includes $588 million in recommended contingency (13% of the adjusted, stripped estimate). HART’s estimate falls short of the predicted FTA model outcome by $265 million ($139.5 million in recommended adjustments plus $125.5 million in additional recommended contingency). There is a 5.4% difference between HART’s project estimate of $4,949 million and the predicted FTA model outcome of $5,214 million. The recommended estimate represents the median value from the FTA risk assessment model, when adjusted for the specifics of this project. The historic trend indicates 40%-likely to 80%-likely range of $5,101 million to $5,670 million. The RCMP includes several potential Secondary Mitigation options. However, there is a general lack of detailed development of plans and cost estimates for the items identified in the RCMP.
Honolulu Rail Transit Project PMOC Report – 2014 Risk Refresh July 2014 (FINAL)
46
Recommendations (1) HART’s estimate falls short of the predicted FTA model outcome by $265 million
($139.5 million in recommended adjustments plus $125.5 million in additional recommended contingency). HART should review its project estimate and determine how to reduce costs to close this gap.
(2) The PMOC-recommended amount of secondary mitigation is $195.5 million. (3) The RCMP must be updated to strengthen risk contingency tracking, custody, and
reporting. The RCMP should include an updated contingency draw-down curve that reflects the current contingency balance and more accurate drawdown milestones. Diligence and vigilance must continue to be applied to this effort to avoid a rapid contingency usage that could ultimately leave the project unprotected.
(4) HART should update and continue its tracking of the Secondary Mitigation items, and develop a process by which those items may be priced by the bidders of the remaining work at the time of bidding. This strategy avoids attempting to trigger Secondary Mitigation after receipt of bids or after contracting, at which point the cost reduction may be significantly reduced due to lack of competitive forces.
(5) Strong controls must be put in place immediately to avoid future rapid contingency reduction. The frequency and the levels of project management to which these statistics are reported should be improved and monitored monthly.
(6) The PMOC and HART should engage in a focused “cost containment workshop” on a monthly basis to monitor the efforts taken to avoid rapid contingency usage.
7.8.2 Schedule Risk Analysis
HART’s target Revenue Service Date is March 2019. The FFGA Date is January 31, 2020. The Impacted Risk Model (IRM) distribution range for project completion from the 0% to 100% confidence levels span a 549-day period. The probability percentage points for the IRM are:
• 20% Confidence level completion date: 20-Aug-19 • 50% Confidence level completion date: 17-Dec-19 • 75% Confidence level completion date: 20-Feb-20 • 90% Confidence level completion date : 20-Apr-20 • 100% Confidence level completion date: 31-Jul-20
The probability confidence level for achieving project completion by January 2020, the FFGA RSD, has been reduced by 15-20% since the last Risk Assessment refresh in July 2012. The Schedule Risk Analysis indicates 66-70% probability of completing the project by the FFGA RSD of 31-Jan-20. The schedule risk analyses using the OP40 calculation indicates a recommended RSD of July 13, 2020. The FFGA RSD of January 2020 can be achieved; however, HART must implement strong schedule and contract management throughout the remainder of the project. Recommendations
(1) HART should closely monitor the MPS longest critical path and near critical
Honolulu Rail Transit Project PMOC Report – 2014 Risk Refresh July 2014 (FINAL)
47
paths as a means to prevent depletion of project total float to achieve RSD by January 2020.
(2) HART should revise its staffing plan to ensure that schedule compression has not caused excessive staff requirements during peak demand during construction.
(3) The PMOC and HART should engage in focused “schedule containment workshops” on a monthly basis to monitor the efforts taken to achieve the FFGA RSD.
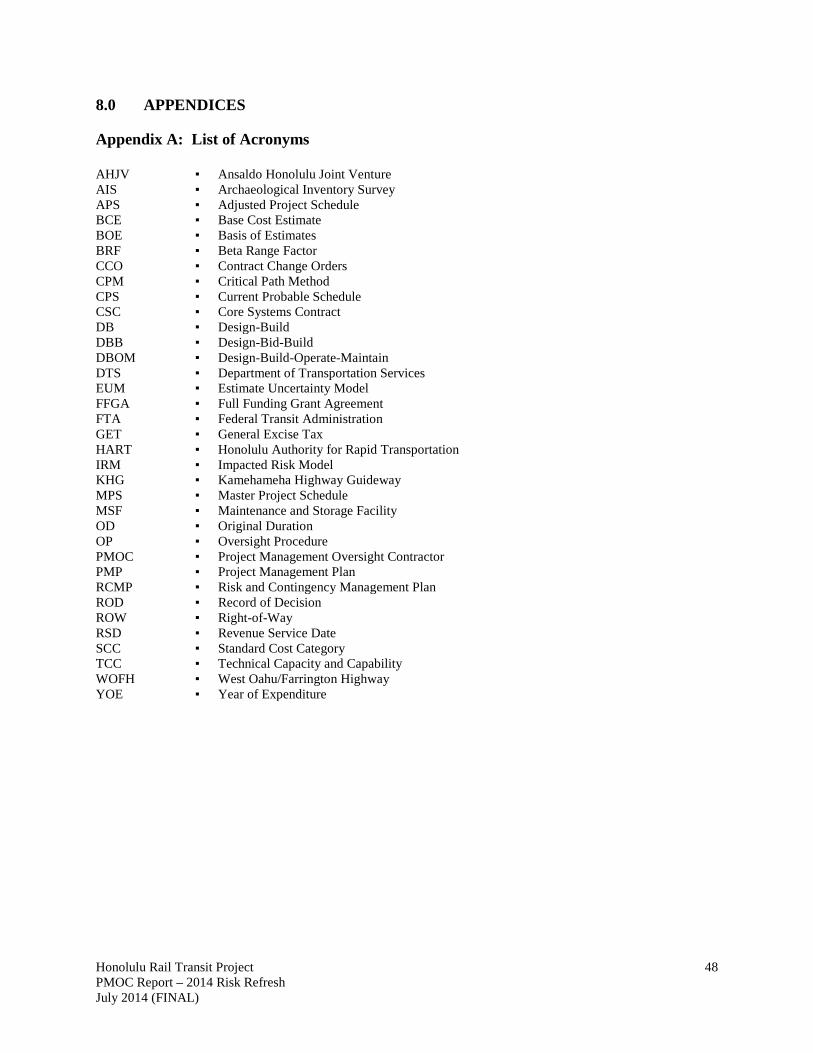
Honolulu Rail Transit Project PMOC Report – 2014 Risk Refresh July 2014 (FINAL)
48
8.0 APPENDICES
Appendix A: List of Acronyms AHJV ▪ Ansaldo Honolulu Joint Venture AIS ▪ Archaeological Inventory Survey APS ▪ Adjusted Project Schedule BCE ▪ Base Cost Estimate BOE ▪ Basis of Estimates BRF ▪ Beta Range Factor CCO ▪ Contract Change Orders CPM ▪ Critical Path Method CPS ▪ Current Probable Schedule CSC ▪ Core Systems Contract DB ▪ Design-Build DBB ▪ Design-Bid-Build DBOM ▪ Design-Build-Operate-Maintain DTS ▪ Department of Transportation Services EUM ▪ Estimate Uncertainty Model FFGA ▪ Full Funding Grant Agreement FTA ▪ Federal Transit Administration GET ▪ General Excise Tax HART ▪ Honolulu Authority for Rapid Transportation IRM ▪ Impacted Risk Model KHG ▪ Kamehameha Highway Guideway MPS ▪ Master Project Schedule MSF ▪ Maintenance and Storage Facility OD ▪ Original Duration OP ▪ Oversight Procedure PMOC ▪ Project Management Oversight Contractor PMP ▪ Project Management Plan RCMP ▪ Risk and Contingency Management Plan ROD ▪ Record of Decision ROW ▪ Right-of-Way RSD ▪ Revenue Service Date SCC ▪ Standard Cost Category TCC ▪ Technical Capacity and Capability WOFH ▪ West Oahu/Farrington Highway YOE ▪ Year of Expenditure