plutonium immobilization project baseline formulation (u)
TRANSCRIPT

UCRL-ID-133089PIP-99-012
Fissile Materials Disposition Program
Plutonium Immobilization Project
Baseline Formulation (U)
February 1999
Bart Ebbinghaus
Plutonium Immobilization ProjectLawrence Livermore National LaboratoryLiverrnore, California 94550

DISCLAIMER
This document was prepared as an account of work sponsored by an agency of the United StatesGovernment. Neither the United States Government nor the University of California nor any of theiremployees, makes any warranty, express or implied, or assumes any legal liability or responsibility forthe accuracy, completeness, or usefulness of any information, apparatus, product, or process disclosed, orrepresents that its use would not infringe privately owned rights. Reference herein to any specificcommercial product, process, or service by trade name, trademark, manufacturer, or otherwise, does notnecessarily constitute or imply its endorsement, recommendation, or favoring by the United StatesGovernment or the University of California. The views and opinions of authors expressed herein do notnecessarily state or reflect those of the United States Government or the University of California, andshall not be used for advertising or product endorsement purposes.
Work performed under the auspices of the U. S. Department of Energy by the University of CaliforniaLawrence Livermore National Laboratory under Contract W-7405-Eng-48.
This report has been reproduceddirectly from the best available copy.
Available to DOE and DOE contractors from theOffice of Scientific and Technical Information
P.O. Box 62, Oak Ridge, TN 37831Prices available from (423) 576-8401
http://apollo.osti.gov/bridge /
Available to the public from theNational Technical Information Service
U.S. Department of Commerce5285 Port Royal Rd.,
Springfield, VA 22161http://www.ntis.gov/
OR
Lawrence Livermore National LaboratoryTectmical Information Department’s Digital Library
http: //www.lInl.gov / tid/Library.html

UCRL-ID-133089PIP-99-012
Table of Contents
1 Introduction and Summary ................................................ 1
2 Form Development Strategy ............................................... 2
2.1 Plutonium Feed Assumptions ........................................ 22.1.1 Feed Materials ............................................... 22.1.2 Impurities and Isotopics ....................................... 3
2.2 Repository Requirements ........................................... 32.2.1 Criticality Safety and Durability ................................ 42.2.2 Compatibility with High Level Waste and the Can-in-Canister
Configuration ............................................. 52.2.3 Other Repository Requirements ................................. 6
2.3 Evolution of the Immobilization Form and Process ...................... 62.3.1 Mineralogical Selection ....................................... 82.3.2 Processing Considerations .................................... 12
3 Sample Test Plan ....................................................... 15
3.1 Program Overview ................................................ 153.1.1 Form Development Tasks ..................................... 153.1.2 Participants and Capabilities .................................. 16
3.2 Sample Test Matrices ............................................... 173.2.1 The A Series ................................................ 183.2.2 The B Series ................................................ 193.2.3 The C Series ................................................ 20
4 Immobilization Form Specifications ........................................ 21
4.1 Baseline Formulation .............................................. 214.1.1 Composition ............................................... 214.1.2 Precursor and Actinide Feed Specifications ...................... 234.1.3 Product Mineralogy ......................................... 26
4.2 Baseline Fabrication Process ......................................... 314.2.1 Ceramic Precursor Preparation ................................ 314.2.2 Baseline Immobilization Process ............................... 33
4.3 Mixing Recipes ............................................... .... 384.3.1 Attritor Mill Recipe ............................... ........... 394.3.2 Attritor Mixer/Blender Recipe ................................. 394.3.3 Conversion Factors for Other Actinides ......................... 404.3.4 Calculated Plutonium Ceramic Compositions .................... 41
5 The Path Forward ....................................................... 43
5.1 Preliminary, Final, and Recommended Specifications .................... 435.1.1 Preliminary Specifications .................................... 435.1.2 Final Specifications .......................................... 435.1.3 Recommended Specifications .................................. 43
5.2 Finalizing Preliminary Specifications ................................. 435.2.1 The Baseline Formulation - Feed Specifications ................... 445.2.2 The Baseline Formulation - Product Mineralogy .................. 445.2.3 The Baseline Formulation - Baseline Immobilization Process ....... 44

UCRL-ID-133089PIP-99-012
6 References ............................................................. 45
Appendix A - Detailed Test Matrices for Form Development ..................... 48
Appendix B - List of Acronyms ............................................. 61
List of Figures
2.1 Secondary electron image of zirconolite-rich form loadedwith 12 wt% plutonium ............................................... 10
2.2 Baseline electron image of pyrochlore-rich form loadedwith 10.5 wt% plutonium ............................................... 12
3.1 Linkages between tasks and sample test matrices ............................ 17
4.1 Depiction of the processing regime ....................................... 30
4.2 Recommended process for preparing ceramic precursors ..................... 32
4.3 The ceramic immobilization process flow diagram attritor mill ................ 33
4,4 Attritor mill discharging blending ceramic precursor powders ................. 35
4.5 The overall baseline firing schedule ....................................... 38
List of Tables
1.1 The baseline formulation ................................................. 1
2.1 Average and extreme impurity contents in the PuO2 feed ...................... 4
2.2 Summary of SYNROC and related variants .................................. 7
3.1 Readily available analytical capabilities for plutonium-loaded samples ......... 16
3.2 Surrogates for plutonium and americium .................................. 18
3.3 Summary of the B sample test matrices .................................... 20
4.1 The overall input composition of the baseline ceramic ........................ 21
4.2 Precursor feed compositions ............................................. 23
4.3 Feed specifications for precursor preparation ............................... 23
4.4 Uranium and plutonium oxide feed specifications ........................... 24
4.5 Impurity specifications for plutonium oxide feed ............................ 25
4.6 Phase abundance in baseline and product extremes .......................... 26
4.7 Nominal composition of plutonium ceramic and natural analog phases ......... 27
4.8 Actinides and neutron absorbers in the primary phases ...................... 30
4.9 Baseline burn-out schedule .............................................. 38
4.10 Baseline sintering schedule ............................................. 38
4.11 Mass of depleted or natural UO2 added to the attritor mill ................... 39
4.12 Mass of Precursor I and 2 added to the attritor mixer/blender ............... 40
4.13 Product compositions in baseline formulation ............................. 42
UCRL-ID-133089PIP-99-O 12
1. Introduction and Summary
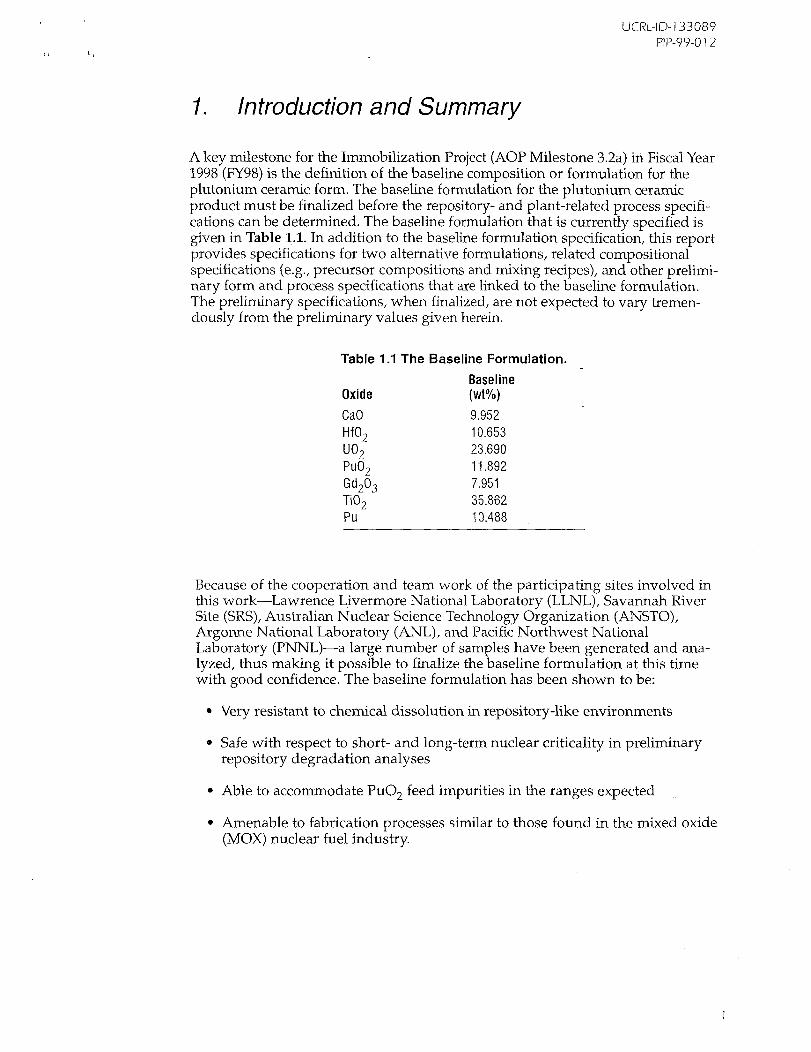
A key milestone for the Immobilization Project (AOP Milestone 3.2a) in Fiscal Year1998 (FY98) is the definition of the baseline composition or formulation for theplutonium ceramic form. The baseline formulation for the plutonium ceramicproduct must be finalized before the repository- and plant-related process specifi-cations can be determined. The baseline formulation that is currently specified isgiven in Table 1.1. In addition to the baseline formulation specification, this reportprovides specifications for two alternative formulations, related compositionalspecifications (e.g., precursor compositions and mixing recipes), and other prelimi-nary form and process specifications that are linked to the baseline formulation.The preliminary specifications, when finalized, are not expected to vary tremen-dously from the preliminary values given herein.
Table 1.1 The Baseline Formulation.Baseline
Oxide (wt%)CaO 9.952HfO2 10.653UO2 23.690PuO2 11.892Gd203 7.951TiO2 35.862Pu 10.488
Because of the cooperation and team work of the participating sites involved inthis work--Lawrence Livermore National Laboratory (LLNL), Savannah RiverSite (SRS), Australian Nuclear Science Technology Organization (ANSTO),Argonne National Laboratory (ANL), and Pacific Northwest NationalLaboratory (PNNL)--a large number of samples have been generated and ana-lyzed, thus making it possible to finalize the baseline formulation at this timewith good confidence. The baseline formulation has been shown to be:
¯ Very resistant to chemical dissolution in repository-like environments
¯ Safe with respect to short- and long-term nuclear criticality in preliminaryrepository degradation analyses
¯ Able to accommodate PuO2 feed impurities in the ranges expected
¯ Amenable to fabrication processes similar to those found in the mixed oxide(MOX) nuclear fuel industry.

UCRL-ID-133089PIP-99-012
~L
2. Form Development Strategy
2.1 Plutonium Feed Assumptions
The Department of Energy Materials Disposition Program (DOE-MD) within theOffice of Fissile Materials Disposition will be receiving fissile materials packagedby facilities operated for the Offices of Defense Programs (DOE-DP),Environmental Management (DOE-EM), and Nuclear Energy (DOE-NE). Thesematerials are to be dispositioned in a manner that meets the "spent fuel stan-dard" (i.e., one that "make[s] the weapons-usable plutonium roughly as unat-tractive and as inaccessible for retrieval and weapons reuse as the residual andgrowing stockpile of plutonium in spent fuel from commercial reactors"1). At thepresent time, approximately 18 metric tonnes of relatively impure plutonium aretargeted for disposition by immobilization and approximately 32 metric tonnesof relatively pure plutonium from decommissioned nuclear weapons are target-ed for disposition as MOX fuel in existing light water reactors. If political or eco-nomic factors for the MOX approach cannot be satisfied, the option exists to dis-position the entire 50 metric tonnes of plutonium by immobilization.
2.1.1 Feed Materials
The compositions, forms, and storage packages of surplus-plutonium-bearingmaterials throughout the complex are not well defined. The majority of the sepa-rated plutonium that is not in nuclear weapons components is housed in theproduction plants--Rocky Flats, Hanford, and Savannah River-in conditionsthat are not acceptable for long-term storage. These materials will requirerepackaging; some will require stabilization or minimal processing to allow safestorage until disposition is complete. Until 1994, complex-wide directives thatapplied to plutonium storage, including safety and safeguards orders, were gen-eral in nature. Therefore, current plutonium storage practices vary among sites.These directives do not provide much detail on how plutonium should be pre-pared for storage, in what sort of containers it should be placed, and how thecontainers should be monitored.
Chemical data for the plutonium feedstock targeted for disposition vary in com-pleteness but approximate groupings are as follows:
Group/--Materials with purity far exceeding what is required for immobi-lization: approximately 45 tonnes for the 50-tonne case, or approximately12 tonnes for the 18-tonne case.
Group IIa--Materials with relatively low impurity levels that can be useddirectly or may be easily blended into acceptable feed stocks for immobiliza-tion: approximately 3 tonnes.
Group IIb--Materials with higher levels of specific impurities that requiresome treatment before blending to remove or deplete the impurities of con-cern. These materials, approximately 1 tonne, will be handled in theImmobilization Conversion Facility. (These include the "chloride oxides" atRocky Flats and Hanford.)

UCRL-ID- 133089PIP-99-O 12
Group IIIa--Materials previously identified by internal DOE studies asrequiring processing in the SRS canyon (aqueous dissolution and reprecipita-tion): approximately I tonne. These materials include fluoride materials andscrub alloy at Rocky Flats as well as sand, slag, and crucible materials atboth Rocky Flats and Hanford. (After processing at Savannah River, theseGroup IIIa materials will move into Group I.)
Group IIIb--Salt residues from molten salt processing: approximately 1tonne. These have been previously identified as needing removal of the chlo-ride salts for stabilization purposes. (After removal of about 75% of the 16tonnes of spent chloride salts, this material would meet the description ofGroup IIa.)
Group IIIc--A group of materials with plutonium contents as low as 5 wt%.These materials may be dispositioned in some other manner, but could ulti-mately end up as a feed stream at the Plutonium Immobilization Plant (PIP).
2.1.2 Impurities and Isotopics
The isotopic composition of the 50 tonnes of excess plutonium feed stock varyfrom 3% 24°pu to approximately 40% 240pu. The plutonium assay in the candidatematerials varies from under 10 wt% to over 99 wt%. The last date of purificationof these materials varies from the early 1960s to the late 1990s. Therefore, the241Am content varies from as little as 200 ppm for the recently purified materialsto as much as 20 wt% for some of the older reactor grade or americium-enrichedmaterials. The uranium content varies from trace depleted uranium in theplutonium to trace plutonium in fully enriched (93% 235U) uranium. A summaryof the average and extreme impurity amounts in the PuO2 feed is given in Table2.1. An average impurity concentration is also given in the table for the impureoxides. In general, the impurities in the existing feed stock contain the followingelements: aluminum, carbon, calcium, chlorine, iron, fluorine, gallium, potassium,magnesium, molybdenum, sodium, silicon, tantalum, uranium, and tungsten.Note that for the maximums given in Table 2.1, the total exceeds 100% because themaximum for each element generally occurs in different feed streams.
With the possible exceptions of carbon and the halides (chlorine and fluorine),fairly high levels of all the impurities listed in Table 2.1 are tolerated by theimmobilization form. Feed blending is required for the more extreme cases tocreate impurity concentrations closer to the average. Before the feeds are blend-ed and then immobilized, high carbon contents need to be removed or depletedand high halide contents should also be removed or depleted.
2.2 Repository Requirements
The immobilization form must provide adequate performance in a geologicrepository and be capable of qualification for acceptance by a repository. Thisimplies that the form must:
¯ Incorporate sufficient insoluble neutron absorber(s) to assure long-termcriticality safety

UCRL-ID-133089PIP-99-012
If
Table 2.1 Average and Extreme Impurity Contents in the PuO2 Feed.Average Average Max. Average Average Max.
Feed Impure All Feed Impure AllOxide Feeds Oxide Feeds
Impurity (wt%) (wt%) (wt%) Impurity (wt%) (wt%)AI 1.58 5.29 7.94 Mo 0.50 0.54 2.39Am 1.74 0.00 4.00 Na 0.71 1.18 2.36B 0.13 0.22 0.77 Ni 0.28 0.94 2.67Ba 0.53 0.45 4.48 Nd 1.03 0.00 12.57Be 0.00 0.00 0.00 Np 0.41 0.00 3.20C 1.99 4.50 40.68 P 0.01 0.00 0.69Ca 2.14 8.80 48.34 Pb 1.98 0.00 10.65Cd 0.00 0.00 0.00 Si 1.70 4.10 26.38Ce 0.62 0.48 2.16 Sn 0.02 0.00 0.23CI 1.76 2.92 12.37 Ta 0.27 0.75 6.07Cr 0.14 0.42 1.37 Th 0.00 0.00 0.01Cu 0.43 0.00 2.67 Ti 0.07 0.00 2.07F 2.06 1.46 29.94 U 20.92 0.00 68.39Fe 0.60 1.64 5.66 V 0.00 0.00 0.00Ga 1.19 0.00 9.55 W 0.06 0.00 2.16Gd 0.11 0.00 0.59 Zn 0.20 0.00 2.25Hf 0.83 0.00 0.63 Zr 0.00 0.00 0.02Hg 0.00 0.00 0.00K 0.77 3.28 7.95 Pu 38:67 38.96 88.20La 0.06 0.09 1.71 0 15.41 21.55 101.92Mg 1.08 2.42 22.49Mn 0.00 0.00 0.07 Total 100.00 100.00 535.60
¯ Be sufficiently durable, with respect to aqueous corrosion, under repositorydisposal conditions
Not have a deleterious effect on the repository performance of the surround-ing vitrified high level waste (HLW) (assuming the can-in-canister disposi-tion alternative)
¯ Withstand the thermal cycle associated with the HLW canister cool-downwith no adverse effects on performance or the capability to qualify the waste
¯ Meet the other applicable requirements for a waste form in a geologic reposi-tory as specified by regulations and repository acceptance documents.
2.2.1 Criticality Safety and Durability
If arranged in a suitable configuration, the quantity of plutonium in an HLWcanister of the current can-in-canister design is more than sufficient for nuclearcriticality to occur. It is therefore necessary to prevent this by the addition ofsuitable neutron absorbers. Ideally, one would choose a neutron absorber thathas chemical characteristics identical to plutonium so that ceramic degradationand transport processes will not separate the plutonium and absorber from oneanother. Unfortunately, such a material does not exist. One can, however, choose

UCRL-ID-} 33089PIP-99-O 12
to incorporate neutron absorbers that are known to be relatively insoluble ingroundwater and will therefore remain in the waste package should the ceramiceventually degrade.
In the long term, of course, the plutonium will decay, primarily to the fissilenuclide 235U. In the case of uranium, it is possible to add the non-fissile 238U toisotopically "dilute" the 235U. The current ceramic formulation does involveaddition of depleted or natural uranium. Although it is not economically feasibleto add sufficient 238U to preclude criticality, the added uranium does assist inmaking far-field criticality even less likely by increasing the quantity of uraniumthat must be transported and then reprecipitated in a configuration free fromany of the added neutron absorbers.
As fabricated, the proposed ceramic formulation is criticality-safe in any config-uration, even when optimally moderated. As long as the form stays reasonablyintact, then, criticality safety is assured. It is only when the form begins todegrade by contact with groundwater in a repository that there can be a ques-tion of criticality safety. The rate and mechanism by which the ceramic degradesare thus intimately related to the question of long-term criticality safety.Obviously, the more durable the material, the longer one can be assured of criti-cality safety; however, there are no simple measures of "sufficiency" for eitherneutron absorber content or ceramic degradation rate. The envelope of accept-able composition and performance can only be determined by analysis. TheDepartment of Energy Office of Civilian Radioactive Waste Management(OCRWM) and its contractors are performing such analyses. Their latest series criticality analyses were conducted using a ceramic composition and plutoniumloading consistent with those given in this report. The relative degradation ratesof the ceramic, HLW glass, and container were varied independently, withinrealistic limits based on existing data. These analyses showed no physically real-izable scenarios in which a nuclear criticality was possible.
2.2.2 Compatibility with High-Level Waste (HLW) and the Can-in-Canister Configuration
Both the ceramic form and the associated hardware used to contain it in the can-in-canister configuration must be compatible with the vitrified HLW and its can-ister. Here, compatibility is taken to mean that the can-in-canister materials donot impede the pour of the HLW glass melt into the canister, that they do notreact with the melt or glass, and that they do not have a deleterious effect on theperformance of the HLW glass under repository conditions. Conversely, theceramic must be chosen such that the glass does not have a deleterious effect onthe performance of the ceramic.
Tests are being conducted as part of the performance testing effort of theresearch, development, and testing (RD&T) program to demonstrate that suchundesirable interactions do not occur. Testing to date indicates that the ceramicdegrades at a rate so much slower than the glass that it can be considered inertfrom the standpoint of the glass. Similarl?4 it is not expected that the degradationof the glass will affect the degradation rate of the ceramic. It is possible, however,that colloidal material produced by the alteration of the HLW glass could pro-vide a transport mechanism within the repository for surface-acfive species suchas plutonium. Such an interaction, however, would exist for any waste formchosen for plutonium disposition in the can-in-canister configuration.
UCRLqD-133089PIP-99-O 12
In addition to chemical considerations, the ceramic form must be capable ofwithstanding the thermal cycle associated with the HLW canister cool-downwith no adverse effects on performance or on the capability to qualify the waste.Thermal cycling tests conducted with early versions of the current ceramic for-mulation indicate that no detectable changes occur in mineralogy, chemistry, orgrain size of ceramics subjected to simulated cooling histories. Some cracking ofthe pellets due to thermal shock may occur. The extent to which this occurs willneed to be quantified and reported to the repository, as fracturing will changethe exposed surface area of the ceramic.
2.2.3 Other Repository Requirements
The current Nuclear Regulatory Commission (NRC) regulation governing thelicensing of a high-level nuclear waste repository is 10 CFR 60.* This code speci-fies certain requirements on repository subsystems, including several designrequirements that pertain specifically to the contents of the waste packages(including the waste forms). These requirements are that to the extent thatorganic materials, free liquids, or explosive, pyrophoric or combustible materialsmight compromise the ability of the disposal system to isolate waste, the wastepackage cannot contain them. The ceramic proposed for plutonium dispositionwill easily meet these requirements.
In addition to the regulatory requirements of Part 60, the repository programalso requires that any waste form be free of hazardous materials. Specifically, theproducer must determine and report to DOE-EM and OCRWM the presence orabsence of any hazardous waste (listed in 40 CFR 261.31 through 40 CFR 261.33)in the waste. Any Resource Conservation and Recovery Act listed (RCRA-listed)component in the waste requires the producer to petition the EnvironmentalProtection Act (EPA) and receive exemption to delist the waste.
The producer must also perform appropriate tests and procedures (as describedin 40 CFR 261.20 through 40 CFR 261.24) using samples from production runs orprototypical specimens to determine if the immobilized form that will bereceived by the repository has hazardous characteristics. Any waste that isshown to have hazardous characteristics must be treated to remove such charac-teristics.
2.3. Evolution of the Immobilization Form and Process
The ceramic form and process for immobilization of excess plutonium hasevolved considerably since the summer of 1995 when they were first con-ceived. The initial ceramic form considered was synthetic rock (SYNROC),specifically, SYNROC-C.2 This is composed of roughly equal amounts of zir-conolite, perovskite, and hollandite with lesser amounts of rutile and noble
* The NRC is currently in the process of revising Part 60, and is expected to promulgate newregulations (10 CFR 63) that will supersede Part 60 for the case of licensing a repository Yucca Mountain. The draft of Part 63, which is currently under review, does not include thesubsystem specifications and requirements present in Part 60. Requirements are only placedon the system as a whole. Although the regulatory basis for the waste package design require-ments may disappear, the requirements are reasonable and will probably be maintained asrequirements imposed by the repository program itself.

UCRL-ID-133089PIP-99-O 12
metal alloys. SYNROC (which is short for SYNthetic ROCk) was initiallydesigned for the immobilization of HLW.3 A variety of SYNROC variants havebeen proposed.3-10 Table 2.2 summarizes all of the SYNROC forms that havebeen studied to date. The SYNROC methodology has also been used to developa form to immobilize mixed wastes and, in this program, a form to immobilizeactinide-rich wastes. The mixed-waste ceramic and the plutonium ceramic variantsare also shown in Table 2.2 for comparison.
Table 2.2 Summary of SYNROC and Related Variants.I orm Name Mineralogy (wt%) "Waste" Loading
3YNROC-A 40% Ba-feldspar, 30% hollandite,20% perovskite, 10% zirconoia,kalsilite, and/or leucite 10% HLW
SYNROC-B 40% hollandite, 35% zirconolite,25% perovskite, None
SYNROC-C 33% hollandite, 28% zirconolite,19% perovskite, 15% rutile,5% noble metal alloy 20% HEW
SYNROC-D 46% spinel solid solution, 19% zirconolite,17% nepheline, 15% perovskite,3% hollandite 63% HLW sludge
SYNROC-E 79% rutile, 7% zirconolite, 7% perovskite,5% hollandite, 2% pyrochlore 7% HLW
SYNROC-F 90% pyrochlore, 5% hollandite, 5% rutile 50% U-rich HLW
SYNROC-FA89% pyrochlore, 8% perovskite,3% uraninite 50% U-rich HLW
Mixed Waste 36% nepheline, 31% spinel solid solution,Ceramic 12% zirconolite, 12% perovskite,
5% rutile, 4% calcium phosphate
Pu Ceramic 80% zirconolite (with some pyrochlore)Zirconolite- 10% hollandite, 10% rutile,<1% PuO2rich
Pu CeramicPyrochlore-rich
85% pyrochlore, 10% brannerite, 5% rutile,<1% uraninite solid solution
40% residue
12% Pu
10.5% Puand21% U
Fabrication Process
Melting and crystalizing1330°C
Hot pressing1200-1400°C
Hot pressing1150°0
Hot pressing1050-1100°C
Hot pressing1300°C
Hot pressing1250°C
Cold pressing and sintering1250-1400%
Cold pressing and sintering1150-1200°C
Cold pressing and sintering1325-1400°C
Cold pressing and sintering1275-1400°C

UCRL-ID-133089PIP-99-O 12
, I
Of all the SYNROC formulations, SYNROC-C is by far the most studied andprobably the most developed. The strategy underlying SYNROC is to immobilizethe radioactive isotopes of HLW in a mixture of minerals that all have naturalanalogs that:
¯ Have survived for periods exceeding 20 million years in a wide variety ofgeochemical environments
¯ Have crystal chemical properties that allow them to accept a wide rangeof elements into their crystalline matrix
¯ Are thermodynamically stable together.
A wide range of minerals meet these three criteria. Titanate-rich minerals wereselected because they not only meet the above criteria, but they are composed ofone of the most insoluble oxides known, namely TiO2.
Actinides are components of HLW that are easily accommodated into SYNROC.Consequently, SYNROC was also an attractive candidate for the narrower prob-lem of immobilizing excess plutonium. For the HLW application, the SYNROCproduct was to be prepared by using alkoxide and nitrate precursors and fabri-cated by hot uniaxial pressing (HUP) in stainless steel bellows. The bellows arenecessary to prevent the volatilization of some HLW species such as 137Cs dur-ing processing. Because it had already received a considerable amount of devel-opment and testing, the same process was initially selected for the plutoniumimmobilization application. Each ceramic disk produced would have weighedroughly 30 kg. This was about the largest size demonstrated in the late 1980s atthe ANSTO SYNROC Demonstration Plant in Lucas Heights, Australia.11
Two ceramic options were initially considered for disposition of excess plutoni-um. The first was a homogenous form in which both plutonium and radioactivecesium were contained in the ceramic matrix. The second was a heterogeneousform in which a plutonium-loaded ceramic interior form was embedded in HLWglass containing radioactive cesium (i.e., the "can-in-canister" option). Duelargely to technical risk, cost, and schedule considerations, the heterogeneouscan-in-canister option was selected for implementationx, The ceramic form wassubsequently chosen over LABs glass as the immobilization matrixY.
Over the past three years, the formulation has evolved from SYNROC-C to apyrochlore-rich form that contains some brannerite, zirconolite, and rutile.During the same time, the hot pressing in bellows operation has been replacedby a simpler cold pressing and sintering operation similar to that used in theMOX industry.
2.3.1 Mineralogical Selection
The SYNROC-C formulation would probably have been adequate for the pluto-nium disposition mission. However, it was originally designed and optimizedfor immobilization of HLW, not for the immobilization of plutonium-rich wastes.When the constituents of concern are mainly actinides (namely plutonium), theform is easily tailored to better meet the assumptions and goals of the plutoniumdisposition mission. As assumptions and goals have evolved since the program’sinception, so has the formulation evolved.

UCRL-ID- 133089PIP-99-012
In SYNROC-C, both zirconolite and perovskite are the host phases for theactinides. Because perovskite is known to be considerably less durable than zir-conolite, 12 perovskite was eliminated from the baseline plutonium ceramic andzirconolite was maximized to about 80 wt%. Because the plutonium feed streamdoes not contain any noble metal fission products, the noble metal alloys werealso eliminated from the plutonium ceramic. Hollandite is a host for cesium andbarium. Radioactive cesium was the gamma radiation source for homogenousform. Except for the small radioactive cesium in the form of Cs20, the same for-mulation was initially proposed for both the homogenous ceramic and the innerform in the heterogeneous (can-in-canister) form. Barium in the form of BaO wasneeded to stabilize the hollandite phase and was also needed as a sintering aidin this formulation when the fabrication route was cold pressing and sintering.The initial product was thus designed to contain about 15 wt% hollandite.Rutile provides a compositional buffer that can react with and immobilizeunanticipated impurities in the feed. The product was thus designed to containabout 5 wt% rutile.
The as-fabricated product had to be criticality safe in any configuration thatmight be used to load the HLW canister. As a result, neutron absorbers had to beincluded in the form. The rare earths (samarium, gadolinium, and europium)were selected as the preferred neutron absorbers because they were easilyaccommodated in large amounts into the plutonium ceramic form, and becausethey are considerably less soluble in groundwater environments than other com-monly used neutron absorbers such as lithium, boron, and cadmium. Of thethree rare earth elements (REEs) considered, gadolinium was selected as the pre-ferred neutron absorber. Europium is much more expensive than samarium orgadolinium, and gadolinium is recognized to be the most effective absorber ofthermal neutrons, which is important for preventing criticality events in heavilymoderated environments. At the time, it was not known how much neutronabsorber would be required for criticality control. A one-to-one atomic ratio ofgadolinium-to-plutonium was rather arbitrarily selected and later confirmed tobe more than adequate in the as-fabricated form.
The plutonium loading was also selected rather arbitrarily. The loading levelselected dates back to the original conception of the form and process for theplutonium disposition application in the summer of 1995. It was known fromprevious work at ANSTO that the form could easily accommodate more than10 wt% plutonium. The maximum size of the hot-pressed product demonstratedat ANSTO was around 33 kg and typical glovebox limits for plutonium processingwould likely be around 4 kg. The form was thus selected to contain 12 wt% pluto-nium, a number arrived at by dividing 4 kg plutonium by 33 kg of ceramic.Given all of the above considerations, the overall formulation was designed asfollows:
80 wt% zirconolite (Cao.75Gdo.25Zro.75Puo.25Ti207)
15 wt% hollandite (Bal.14A1 2.29Ti5.71016)
5 wt% rutile (TiO2).
The above formulation was then used to calculate the amounts of the precursorcomponents to be mixed together and processed. The fabricated product matchedthe design mineralogy reasonably well, although traces of pyrochlore were also

UCRL-ID-133089PIP-99-012
present. The rutile content appeared to be slightly greater than 5 wt% and thehollandite content appeared to be slightly less than 15 wt%. The theoretical densi-ty was calculated to be 4.92 g/cm3. The actual geometric density observed wasabout 4.5 g/cm3. This initial formulation is now referred to as the zirconolite-based form. A secondary electron image (SEI) of the zirconolite-rich plutoniumceramic form is shown in Figure 2.1.
The initial formulation assumed relatively pure PuO2 as the feed stream. Afterthis initial idealistic assumption was corrected and the preliminary composi-tions of the actual feed streams became available, it was apparent that the feedstreams targeted for immobilization had on average about equal amounts ofuranium (primarily natural and depleted uranium) and plutonium. If theplutonium-loading in the form were to remain at about 12 wt%, the excess ura-nium would stabilize considerable amounts of pyrochlore in the product. Thepotential for uranium-rich HLW had already lead to the develoRment ofpyrochlore-rich SYNROCs called SYNROC-F8 and SYNROC-FA9 (see Table 2.2).
At about the same time as the more realistic feed compositions were beingassembled, questions about the radiation damage effects in the ceramic formwere raised. An initial conservative long-term degradation analysis performedby OCRWM assumed that after a few thousand years, swelling caused by alphadecay of the plutonium in the ceramic would make the zirconolite-rich ceramicfracture into a powder at the gain boundaries.13 The same analysis byOCRWM13 indicated that under worst case assumptions the gadolinium couldbecome soluble, and that a small concentration of the insoluble neutron absorber
. , Pyrochlore
Zirconolite
Hollandite --
Actinide Oxide
Rutile
20 p.m
Figure 2.1 Secondary electron image of zirconolite-rich form loaded with 12 wt%plutonium.
10

UCRL-ID- 133089PIP-99-012
hafnium could prevent criticality. In particular, the small amount of hafniumpresent as a contaminant in zirconolite (2 to 5% of total zirconium) was found increase, by 50%, the amount of 239pu that could be carried in a waste packagewithout permitting criticality. It was clear that the ceramic form would benefitby redesigning the formulation.
On April 8, 1997, a videoconference among LLNL, SRS, and ANSTO was held todiscuss the redesign of the ceramic formulation and Generation of an initialimpurity test matrix (later called the Series A matrixl~). The following criteriawere agreed upon:
¯ Uranium-to-plutonium ratio of 2-to-1 (exceeds uranium content in most feedstreams)
¯ Gadolinium-to-plutonium ratio of 1-to-1 (same as in zirconolite-rich formu-lation)
Hafnium-to-plutonium ratio of 1-to-1 (replace zirconium with hafnium andselect 1-to-1 ratio as was done with gadolinium to provide additional criti-cality control)
¯ Eliminate BaO and hollandite from the form (no RCRA material)
For purposes of calculating the feed composition, assume a pyrochlore formwith a small amount of hafnium-futile (95 wt% pyrochlore, 5 wt% hafnium-futile)
¯ Plutonium concentration about the same as in the zirconolite-rich form(reduced to about 10 wt% due to higher density of pyrochlore).
Given the above criteria, the form was designed as follows:
95 wt% pyrochlore (Cao.89Gdo.22Hf0.23Uo.44Puo.22Ti207)
4 wt% rutile (TiO2)
1 wt% hafnia (HfO2).
Note that extra hafnia was added because the futile in the zirconolite-rich for-mulation was known to contain about 6 mol% zirconia. In the absence of experi-mental data, hafnia was expected to behave similarly and substitute into therutile. Given the differing molecular weight of hafnium versus zirconium, theHfO2 to TiO2 weight ratio in the hafnium-substituted rutile was expected to beabout 1-to-4. The theoretical density was calculated to be 5.98 g/cm3. The actualgeometric density observed was about 5.5 g/cm3.
As planned, pyrochlore was the primary phase and rutile was present in smallamounts. However, the actual form produced varied slightly from the designedmineralogy in the respect that brannerite was also formed. If impurities werepresent, zirconolite also formed. Although this result was slightly different thanexpected, zirconolite and brannerite were known or expected to be durablephases and both had natural mineral analogs that have survived over geologictime periods. Therefore, it was decided to leave the formulation as it was and, if
11

UCRL-ID-133089PIP-99-O 12
needed, redesign it slightly at a later time. By allowing a relatively wide range ofpyrochlore, zirconolite, and brannerite mineral abundances in the product, theform was much more tolerant to impurities in the PuO2 feed than a form target-ing a nominally single-phase product.
The baseline product produced from this formulation is shown in Figure 2.2.The actual product formed was composed of about 80 wt% pyrochlore with thebalance being roughly equal amounts of brannerite and rutile. Since the April1997 videoconference, the composition of the baseline form has remained essen-tially unchanged. At a form development meeting at LLNL on June 9 and 10,1998, the baseline formulation was reviewed. It was noted that the form could bemade more tolerant to impurities by increasing the hafnium-rutile content in theform, but for the current plutonium disposition mission the formulation did notneed to be redesigned.
2.3.2 Processing Considerations
As mentioned earlier, the ceramic product was originally conceived to be fabri-cated as hot-pressed disks weighing about 30 kg each. These disks were plannedto be about I foot in diameter by about 3.5 inches high. Due largely to their sizeand shape, these disks presented some engineering problems for the preferredcan-in-canister immobilization option. The main problem was that the cross-sectional area of the disks was too large to allow unobstructed flow of the HLWglass into the canister. The initial solution was to scale down the size of the hot-pressed disks, but this was expected to significantly reduce the cost effectivenessof the proposed process. There were two alternatives. One alternative was to usehot isostatic pressing (HIP) rather than HUP. The HIP product could be made
Pyrochlore
Brannerite
Actinide Oxide
Rutile
20 p.m
Figure 2.2 Baseline electron image of pyrochlore-rich form loaded with 10.5 wt%plutonium.
12
UCRL-ID- 133089PIP-99-012
a can shape (long and slender rather than thin and wide), eliminating theobstruction of the molten HLW glass during the HLW glass-ffiling operation.The other alternative was to go to a cold pressing and sintering approach thatwas based primarily on the MOX industry. Data were already available showingthat cold pressing and sintering could be used to fabricate SYNROC-FA, whichis similar in composition to the pyrochlore-rich plutonium ceramic form. Basedon favorable tests performed in the early years of the program, the cold pressingand sintering option was quickly selected as the preferred option. The HIPoption, which was maintained as a backup for a short period of time, is nolonger being considered.
Although there are several well-developed processes for fabricating MOX pel-lets, the specific processes used for the ceramic form differ somewhat andrequire development and testing to prove that the processes will be suitable forthe proposed Plutonium Immobilization Plant.
There are substantial differences between the ceramic immobilization productand the MOX product in terms of size and composition of the product form. Thenominal size of the ceramic product was selected to be approximately 2.5 inchesin diameter by approximately 1 inch high. Based on discussions with severalceramic engineers and suppliers of automated presses, this was believed to be areasonable upper bound in size that could be fabricated reliably by an automat-ed process using cold pressing and sintering.
The most important steps in the fabrication process, in terms of impact on thefinal form, are the milling step, the blending/mixing step, the pressing step, andthe burnout and sintering step. Considering the processes developed and usedfor the MOX industry, there are two preferred options for the milling and blend-ing/mixing steps. One method involves the use of sequential attritor mills andthe other involves the use of ball mills. The processing route using sequentialattritors was developed by British Nuclear Fuels Limited (BNFL) and is com-monly referred to as the "Short Binderless Route.’’15, 16 The process using ballmills was developed at Belgonucleaire and Cogema and is commonly referred toas the Mimas" processS The sequential milling and blending/mixing processwith attritor mills is the baseline process for the plant. Dry ball-milling or dryball-blending/mixing was not selected since such milling has already beendemonstrated to be relatively ineffective for milling or blending/mixing eitherthe actinides or the precursors. Wet ball-milling and blending is an effectiveprocess, but would require additional water removal operations.
Pressing is performed at very low pressures compared to those used in the MOXindustry and many other ceramic fabrication processes. Using ungranulated pre-cursor material, pressures as low as 1000 psi have been demonstrated to be ade-quate for this form and process. Granulated material generally requires higherpressing pressures to obtain high pellet densities and good pellet integrity. Thepellet press will be specifically designed for this process, but will probably bevery similar to those used in the MOX industry.
For the binder burnout and sintering step, two types of furnaces were considered:a bottom-loading furnace and a conveyer-type furnace. The conveyer furnace isoften preferred for the MOX industry. However, the larger immobilization ceramic
13

UCRL-ID-133089PIP-99-012
"pucks" required a slower heating and cooling rate to avoid fracture. As a result,a high-temperature bottom-loading furnace is currently believed to be moresuitable for the ceramic immobilization plant.
The sintering temperature initially selected was 1325°C for I hour. For earlierzirconolite-based formulations, good densities at lower temperatures and shortertimes could not be achieved. Experiments on actinide oxide reaction kinetics onthe zirconolite-based formulation indicated that a firing temperature of 1350°Cfor 4 hours was required to get good reaction of PuO2 particles that are initiallyless than 20 microns with the ceramic matrix. Later experiments on thepyrochlore-based form indicated that lower temperatures could probably beused, but 1350°C for 4 hours has been retained as the baseline.
The sintering atmosphere was initially selected to be argon gas. Recent experimentson the pyrochlore-based form indicate that air is a suitable sintering atmosphere.Since air is cheaper and easier to use than argon, the preferred sintering atmos-phere is now air.

3. Sample Test Plan
UCRL-ID-133089PIP-99-O 12
3.1 Program Overview
Development of the baseline formulation and baseline process operations arecoupled; one cannot be complete without the other. More specifically, the base-line formulation has been designed so that the desired product mineralogy isobtained, but the fabrication process (still under development) can also affectproduct mineralogy.
The form development sample test plan was designed to understand how thebaseline formulation selected on the April 9 video conference13 was affected byvarious compositional and processing parameters. As a result of the tests con-ducted so far, the formulation has been verified to be suitable for the types ofcompositional and process variations that would be expected in the PlutoniumImmobilization Plant. If the baseline formulation had been determined to belacking in a needed or desirable attribute, it would have been redesigned. At thispoint, however, sufficient testing has been completed to allow the baseline for-mulation to be finalized.
3.1.1 Form Development Tasks
Form Development is divided in four primary task areas. The main objectivesaccording to each task are shown below in bulletized form.
Task 1. Planning and Facilities
¯ Establish capabilities for small-scale sample fabrications.
¯ Define the sample test matrix.
Task 2. Process Data
¯ Define the baseline formulation.
¯ Provide feed specifications for the PuO2 feed.
¯ Provide process data that supports scale up testing and design.
Task 3. Form Qualification Samples
¯ Provide samples for durability testing.
¯ Provide samples for thermodynamic data measurements.
¯ Provide range and composition of minerals in the ceramic form.
Task 4. Product Control Model Development
¯ Develop a product control model to qualify the fabrication process.
15
UCRL-ID-133089PIP-99-012
t
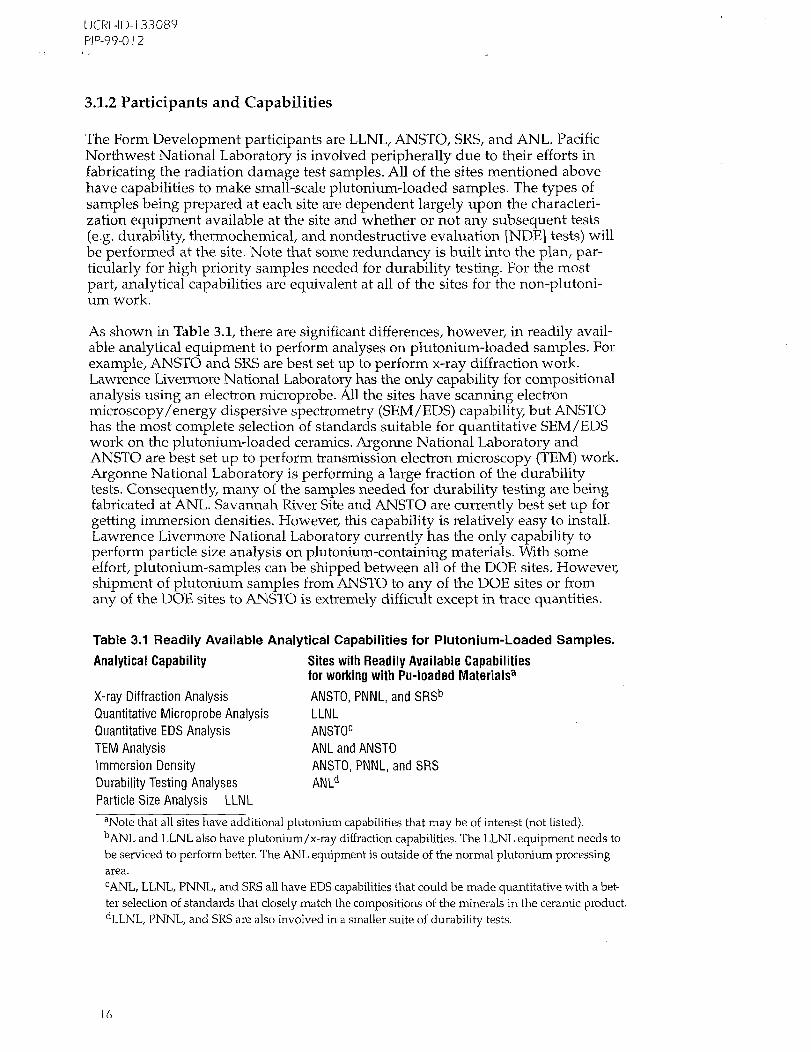
3.1.2 Participants and Capabilities
The Form Development participants are LLNL, ANSTO, SRS, and ANL. PacificNorthwest National Laboratory is involved peripherally due to their efforts infabricating the radiation damage test samples. All of the sites mentioned abovehave capabilities to make small-scale plutonium-loaded samples. The types ofsamples being prepared at each site are dependent largely upon the characteri-zation equipment available at the site and whether or not any subsequent tests(e.g. durability, thermochemical, and nondestructive evaluation [NDE] tests) willbe performed at the site. Note that some redundancy is built into the plan, par-ticularly for high priority samples needed for durability testing. For the mostpart, analytical capabilities are equivalent at all of the sites for the non-plutoni-um work.
As shown in Table 3.1, there are significant differences, however, in readily avail-able analytical equipment to perform analyses on plutonium-loaded samples. Forexample, ANSTO and SRS are best set up to perform x-ray diffraction work.Lawrence Livermore National Laboratory has the only capability for compositionalanalysis using an electron microprobe. All the sites have scanning electronmicroscopy/energy dispersive spectrometry (SEM/EDS) capability, but ANSTOhas the most complete selection of standards suitable for quantitative SEM/EDSwork on the plutonium-loaded ceramics. Argonne National Laboratory andANSTO are best set up to perform transmission electron microscopy (TEM) work.Argonne National Laboratory is performing a large fraction of the durabilitytests. Consequently, many of the samples needed for durability testing are beingfabricated, at ANL. Savannah River Site and ANSTO are currently best set up forgetting immersion densities. However, this capability is relatively easy to install.Lawrence Livermore National Laboratory currently has the only capability toperform particle size analysis on plutonium-containing materials. With someeffort, plutonium-samples can be shipped between all of the DOE sites. However,shipment of plutonium samples from ANSTO to any of the DOE sites or fromany of the DOE sites to ANSTO is extremely difficult except in trace quantities.
Table 3.1 Readily Available Analytical Capabilities for Plutonium-Loaded Samples.Analytical Capability
X-ray Diffraction AnalysisQuantitative Microprobe AnalysisQuantitative EDS AnalysisTEM AnalysisImmersion DensityDurability Testing AnalysesParticle Size Analysis LLNL
Sites with Readily Available Capabilitiesfor working with Pu-loaded Materialsa
ANSTO, PNNL, and SRSb
LLNLANSTOc
ANL and ANSTOANSTO, PNNL, and SRSANLd
aNote that all sites have additional plutonium capabilities that may be of interest (not listed).bANL and LLNL also have plutonium/x-ray diffraction capabilities. The LLNL equipment needs tobe serviced to perform better. The ANL equipment is outside of the normal plutonium processingarea.CANL, LLNL, PNNL, and SRS all have EDS capabilities that could be made quantitative with a bet-ter selection of standards that closely match the compositions of the minerals in the ceramic product.dLLNL, PNNL, and SRS are also involved in a smaller suite of durability tests.
16

UCRL-ID- 133089PIP-99-012
3.2 Sample Test Matrices
The sample test matrices were first developed in late December 1997 at a reviewmeeting at SRS. The sample test matrices were reviewed again and updated at aprogram-wide form development planning and review meeting at LLNL in earlyJune of 1998. The detailed test matrices as they currently stand are given inAppendix A. The A series originated in FY97 and the B series originated in FY98.The C series is planned to begin early in FY00. The series A samples are for themost part complete. The B series samples are in progress, and are nominally abouthalf-complete. Note that each sample series usually corresponds to a single com-position, but in some cases it corresponds to a range of compositions or impurityloading levels. For each composition identified, several to approximately a dozensamples are prepared. Some are sintered at different temperatures or under differ-ent atmospheres. Some are fabricated by different processes, and so on.
Note that the sample series support multiple tasks. The linkages between thesample test matrices and the tasks are shown in Figure 3.1. In general, eachseries supports primarily one task (the solid lines) and peripherally at least oneof the other tasks (dashed lines).
The development, testing, and finalization of the baseline formulation is depen-dent at least to some extent upon all of the sample series. However, the mainsample series that support the finalization of the baseline formulation are the Aseries, B1 series, B4 series, and B5 series. Although the B series are not complete,sufficient data have been generated to initially validate the current baseline for-mulation selection.
Tasks
Sub-TasksSingle-Phase Synthesis
BO Series
Near-EquilibriumProcessing Conditions
B1 Series
Equilibrium Phase Diagram [I
B2 Series
Process and ICompositional Extremes
B 1072-03
/
B3 Series
Impurity Studies
B4 Series
Sintering Aid Studies
B5 Series
Figure 3.1 Linkages between tasks and sample test matrices.
17

UCRL-ID-133089PIP-99-012
Although a significant number of validation tests are being performed with plu-tonium, the majority of sample fabrications are performed with various non-radioactive surrogates. Surrogates are selected based on similarity of atomic size,melting point of the constituent oxide, and relative stability of the valence states.These data for plutonium, americium, and various surrogates are shown inTable 3.2. In the baseline ceramic, the best surrogate for plutonium is generallycerium. Its ionic size and the melting point of the constituent oxide are almostidentical to plutonium.
If conditions in the sample preparation are moderately reducing, however, ceri-um can be a relatively poor surrogate for plutonium since it will generally con-vert to the trivalent ion whereas plutonium under the same conditions will gen-erally remain as the tetravalent ion. Under more reducing conditions, thorium isbelieved to be a better surrogate for plutonium than cerium. Thorium is also pre-ferred over cerium as a surrogate for plutonium in the "near-equilibrium" tests.Still, CeO2 is observed to be much more reactive than PuO2. ThO2 has a consid-erably lower reactivity than CeO2, and is much closer to that of PuO2. For testssimulating americium-enriched material, neodymium is selected as the best sur-rogate. Based on the atomic size, melting points, and relative ionic stability,neodymium is expected to behave very similarly to americium in this ceramic.
To easily identify surrogates in a sample, the following nomenclature is used. Asample composed of all baseline elements and no surrogates is referred to as ahafnium-plutonium-uranium sample. If cerium is used as a surrogate for pluto-nium, the sample is referred to as a hafnium-cerium-uranium sample. Likewise,if thorium is used as a surrogate for plutonium, the sample is referred to as ahafnium-thorium-uranium sample. A sample where cerium is used as a surro-gate for plutonium and uranium is referred to as a hafnium-cerium-cerium sam-ple. If zirconium is used instead of hafnium, the same sample is a zirconium-cerium-cerium sample.
3.2.1 The A Series
There are 10 sample compositions in the A series. This series includes the base-line composition (A-0), six typical impurity feed compositions (A-1 to A-6) three compositions with all the impurities: an average case (A-7), an extreme
Table 3.2 Surrogates for Plutonium and Americium.
CN = 8 An02 An203/An02Element r4+, (nm) M.P. (%) P(O2)*, (atm)Ce 0.110 2600 2.3 x 10⁻¹¹
Th 0.119 3220 N/APu 0.110 2425 2.5 x 10⁻¹⁸
CN = 8 An203 An203/AnO2Element r3÷, (nm) M.P. (°C) P(02)*, (atm)Nd 0.125 2315 >6.9 x 10⁻²
Am 0.123 >1200 2.1 x 10²
*p(O2) calculated at a temperature of 1350°C
18

UCRL-ID-133089PIP-99-012
case (A-8), and an intermediate case (A-9). For the most part, this series is plete. Some of the compositions continue to be fabricated to provide material fordurability testing or to test the fabrication processes at full-scale.
3.2.2 The B Series
Whereas the smaller set of A series samples demonstrated that the ceramic formwas suitable for the disposition of excess plutonium, the larger B series is aimedat understanding key parameters of the ceramic form, providing samples fordurability testing, and providing data that will be needed to scale up and qualifythe process. As shown in Figure 3.1, the B Series is divided into six subseries,each of which is discussed below.
3.2.2.1 Single-Phase Samples (B0 Series). These samples are needed for single-pass flow-through (SPFT) tests, enthalpy of formation measurements, entropydeterminations, radiation damage studies, x-ray standards, and other select cor-rosion tests.
3.2.2.2 Near-Equilibrium Samples (B1 Series). These samples are needed demonstrate that the product obtained by various "plant-like" processes is at ornear chemical equilibrium.
3.2.2.3 Equilibrium Phase Diagrams (B2 Series). These samples are needed define select phase equilibria in binary and ternary oxide systems. These phaseequilibria will be essential in the developing the product control model.
3.2.2.4 Process and Compositional Extremes (B3 Series). These are samples pre-pared at process and compositional extremes. They are needed for durabilityand NDE testing. Some are needed for radiation damage studies.
3.2.2.5 Impurity Effects (B4 Series). These samples, the largest of the B series, areneeded to determine feed specifications for the form and to develop the prelimi-nary product control model. The B4 series is divided into three subseries as follows:
Impurity Saturation (B4-S). These samples are needed to determine which sec-ondary phases form when saturated with specific impurities. This work isbeing performed primarily at LLNL.
Impurity Equivalence (B4-E). These samples are needed to determine whichimpurities are similar enough in behavior that they can be grouped together.This work is being performed primarily at ANSTO.
Impurity Volatility (B4-V). These samples are needed to determine the effectof volatile impurities on the product density. This work is being performedprimarily at SRS.
3.2.2.6 Sintering Aid Studies (B5 Series). A sintering aid may be needed increase the product density or to make product densities more uniform fromsample to sample. These samples are needed to determine which impurities actmost effectively as sintering aids.
19

UCRL-ID-133089PIP-99-012
In addition to the above samples, various samples are prepared on an as-neededbasis to address various technical issues as they arise.
The B Series samples discussed above are summarized in Table 3.3. The tableshows the sites fabricating, testing, or characterizing each samples; the total num-ber of sample series; and the approximate fraction of completion for each series.
3.2.3 The C Series
The C series will be designed to define, test, refine, and validate the preliminaryproduct control model. The samples in this series are not yet defined. However,the series will be a statistically designed test matrix that will likely involve sev-eral hundred samples. Sample fabrication will begin early in FY00. Once thetests in this series have been completed, the form development effort will becomplete.
Table 3.3 Summary of the B Sample Test Matrices.Series I.D. Sites Involved
Single-Phase Synthesis BO ANL, ANSTO, LLNL,PNNL, SRS, and UCD
Number*
26 samples
PercentComplete50
Near-Equilibrium B1 ANSTO and LLNL 22 compositions 35Processing Conditions
Equilibrium Phase B2 ANSTO and LLNL 16 series 25Diagram
Process and B3 ANL, LLNL, PNNL, 20 compositions 45Compositional Extremes and SRS
Impurity Studies B4 ANSTO, LLNL, and SRS 53 series 60Impurity Saturation B4-S LLNL 35 series 65Impurity Equivalence B4-E ANSTO 12 series 50Impurity Volatility B4-V SRS 6 series 60
Sintering Aid Studies B5 LLNL and SRS 10 series 80
*Normally between two and twelve samples are made for each composition and between two and twelve composi-tions are made for each series.
2O

UCRL-ID-133089PIP-99-012
4. Immobilization Form Specifications
4.1 Baseline Formulation
4.1.1 Composition
The baseline formulation is based upon the following target mineralogy andphase composition:
95.0 wt % pyrochlore (Cao.89Gdo.22Hfo.23Uo.44Puo.22Ti207)
4.0 wt % rutile (TiO2)
1.0 wt % hafnia (HfO2)
This target yields the overall baseline input composition (given in Table 4.1).This formulation is the baseline formulation. Note that up to about 3 wt% totalof sintering aids may be added, if needed. If so, they will be specified after thefabrication process is finalized.
Table 4.1 The Overall Input Composition of the Baseline Ceramic.
L0w-Pu High-PuBaseline Alternative Alternative
Oxide (wt%) (wt%) (wt%)CaO 9.952 9.488 9,950HfO2 10.653 11.100 10.651UO2 23.690 22.721 18.587PuO2 11.892 11.338 17.007Gd203 7.951 7.580 7.949
TiO2 35.862 37.773 35.856
Pu 10.488 10.000 i5.000
NotesBaseline. The baseline composition is to be used for immobilization of excess plutonium in a
ceramic matrix. This is the baseline composition selected by the Form Development team.Low-Plutonium Alternative (#1). If safeguards and security requirements at DWPF are such that
the form must have 10 wt% plutonium or less in the product, the low-plutonium alternate can beused. The composition does not adversely impact repository licensing or design of the immobi-lization plant. Note, however, that the number of canisters produced will be increased by about5%. In the low-plutonium alternate, the quantity of hah~ium-substituted rutile is increased byroughly 5 wt%. The increase in futile content lowers the plutonium content without changing thephase mineralogy. The extra rutile in this formulation will also give the formulation more flexi-bility to accommodate impurities in the plutonium feed streams.
High-Plutonium Alternative (#2). If circumstances arise such that the ceramic immobilization
plant will immobilize the entire 50 metric tonnes of excess plutonium, a higher plutonium load-ing would be cost-effective and would not adversely affect plant design. The plutonium loadingin the high-plutonium alternative is about 43% greater than in the baseline. Note that uraniumand plutonium can be substituted in the formulation without significantly affecting the mineralo-gy of the product form. Note also that the plutonium feed specifications are dependent upon theplutonium concentration in the form (see Section 4.1.2 below).
21

UCRL-ID-133089PIP-99-012
In addition to the baseline formulation, the following two variants are alsogiven. Each addresses specific programmatic requirements that may be desirablein the future.
1. Plutonium-loading may be dropped to 10 wt% to meet safeguards and secu-rity requirements at the Defense Waste Processing Facility (DWPF). This for-mulation is identified as the low-plutonium alternative in Table 4.1.
2. Plutonium-loading may be increased to 15 wt% if immobilization is selected asthe means of dispositioning the entire 50 metric tonnes of excess plutonium.This formulation is identified as the high-plutonium alternative in Table 4.1.
The low-plutonium alternative composition (#1) is calculated by adding hafni-um-substituted rutile to the baseline target mineralogy and phase composition.To achieve a 10 wt% plutonium loading, the target then becomes
95.34 wt% baseline formulation
95.0 wt% pyrochlore (Cao.89Gdo.22Hfo.23Uo.44Puo.22Ti207)
4.0 wt% rutile (TiO2)
1.0 wt% hafnia (HfO2)
4.66 wt% hafnium-rutile (Tio.90Hfo.09Uo.0102)
In general, adding hafnium-rutile (Tio.9oHfo.ogUo.ol02) to the baseline composi-tion gives a formulation with lower plutonium loadings but the same productmineralogy. The net result will be to generate more hafnium-futile in the prod-uct. The presence of additional rutile will in general increase the capability of theformulation to accommodate impurities.
The high-plutonium alternative (#2) is calculated by substituting plutonium foruranium in the baseline target mineralogy and phase compositions. To achieve a15 wt% plutonium loading, the target then becomes
95.0 wt% pyrochlore (Cao.89Gdo.22Hfo.23Uo.345Puo.315Ti207)
4.0 wt% rutile (TiO2)
1.0 wt% hafnia (HfO2)
Except for criticality control concerns at higher plutonium loadings, the baselineformulation can also be freely modified by trading uranium for plutonium orplutonium for uranium to get lower or higher plutonium loadings. The phaseequilibrium data currently available indicate that these modifications will notsignificantly affect the product mineralogy. Note, however, that higher plutoni-um loadings reduce the formulation’s capacity to accommodate impurities (seeEquation 4.1 in Section 4.1.2).
Although the baseline formulation is now set at a 10.5 wt% plutonium loading, arange of other formulations are acceptable (e.g., by adding hafnium-rutile or byexchanging uranium for plutonium or plutonium for uranium in the formula-tion) if there is a need to increase or decrease the plutonium loading in theimmobilization form. In other words, the formulation does not have to be limitedto the baseline, low-plutonium, or the high-plutonium cases if another plutonium
22

UCRL-ID-133089PIP-99-012
loading is needed. Note, however, that the maximum plutonium loading in theform is 31.4 wt% (corresponding to composition in which all the uranium hasbeen replaced by plutonium).
4.1.2. Precursor and Actinide Feed Specifications
The input compositions for the ceramic precursors are given in Table 4.2. A ven-dor would likely prepare these precursors. These compositions would be part ofthe specification in procuring the precursor material from a vendor. In bothcases, Precursor I is the primary precursor, which contains CaO. Precursor 2 is amake-up precursor to offset calcium (present as CaO, CaC12, or CaF2) in thePuO2 feed streams. In both cases, Precursor 2 does not contain any CaO.
All materials added to the immobilization process need to meet specificationsregarding form, particle size, and purity. The recommended specifications forthe oxides used to prepare the ceramic precursor are given in Table 4.3. If theprecursor materials meet the specifications given and the precursor is preparedby the process described in Section 4.2.1 below, the precursor produced will besuitable for use in the PIP. For HfO2 and Gd203, a potential supplier is alsogiven as an example of where the product can be obtained.
Table 4.2 Precursor Feed Compositions.Baseline and
High-Pu AlternateLow-Pu Alternate
Precursor 1 Precursor 2 Precursor 1Oxide (wt%) (wt%) (wt%)Ca0 15.449 0.00 14.389HfO2 16.537 19.559 16.833Gd203 12.343 14.598 11.495TiO2 55.671 65.843 57.283
Precursor 2(wt%)0.00
19.66213.42766.911
Table 4.3 Feed Specifications for Precursor Preparation.Oxide Form Particle Size PurityCaO Ca(OH)2 -325 mesh >99%
(or CaO) <1% 002
HfO2 HfO2 Micron sized Hf+Zr >99.99%or -600 mesh Hf > 95 %
Gd203 Gd203 -325 mesh REE >99.99%Gd >95%
TiO2 TiO2 (anatase) Micron sized >99.95%or-600 mesh <0.05% P
Potential SupplierNot Important
Wah Chang(S-Grade)
Pacific IndustrialDevelopment Corporation
Not Important
23

UCRL-ID-133089PIP-99-O ~ 2
The preliminary specifications for the actinide oxides are given in Table 4.4. Ifthe actinide oxides meet the specifications given, an acceptable ceramic productcan be obtained. For plutonium oxide, the specification is that which the oxidemust meet after blending. For uranium oxide, a potential supplier is also givenas an example of where the product can be obtained.
The impurity specifications for the PuO2 feed after blending are given in Table 4.5.In an attempt to simplify the specifications, impurities with similar behavior in theceramic product are grouped into the same category. The specifications are givenin moles of impurity per mole of PuO2. Moles are used in the specification ratherthan weight percents because the impurities substitute into lattice sites in theceramic matrix on an atomic basis, not a weight basis. The specifications given inTable 4.5 are basically the same specifications as given previously,18 but reformat-ted to allow for more specificity. For example, zirconolite stabilizers will have aspecification on the total amount of zirconolite stabilizers as well as specificationson the amount of +2, +3, and +4 stabilizers. Data are still being accumulated tocomplete this table.
The original impurity specifications for the PuO2 feeds were based largely on theresults obtained for the plutonium test sample of intermediate composition con-taining all impurities (A-9). Note that nickel, which was originally counted sepa-rately, has now been grouped with the zirconolite stabilizers. Consequently, thespecification has been changed from 0.75 to 0.85. In addition, the trivalent REEshave been grouped with the pyrochlore stabilizers.
The specification on calcium has been increased dramatically (from 0.25 to 4.0)because a second precursor blend with no CaO component now compensates forvariations in the calcium content of the plutonium feed. Uncompensated impuri-ties are impurities that are added to the formulation without adjusting the com-position or quantity of the precursor. Compensated impurities are impuritiesthat are added to the formulation with adjustments in the precursor compositionor quantity. For this process, most impurities are uncompensated. The actinidesand calcium are the only compensated impurities.
The PuO2 feed impurity specifications in Table 4.5 are valid for the baseline for-mulation only. For the low-plutonium alternative and the high-plutonium alter-native, the specifications must be modified by the following relationship:
(new spec) = (original spec) x 10.5/(Pu wt% in new formulation) (4.1)
Note that the feed specifications become more stringent for the high-plutoniumalternative and less stringent for the low-plutonium alternative.
Table 4.4 Uranium and Plutonium Oxide Feed Specifications.Oxide Form Particle Size Purity Potential Supplier
UO2 UO2 (or U308) -100 mesh > 99.99% Oameco
PuO2 PuO2 with -100 mesh See Table 4.5 N/AUO2 or U308
24

UCRL-ID-133089PIP-99-012
Table 4.5 Impurity Specifications for Plutonium Oxide Feed.
Phase StabilizedUncompensated
VolatilesFluorides ....Chlorides ....Oxides (Metal) ....Oxides (Non-metal) ....Subtotal 0.60
ZirconoliteBivalent Elements ....Trivalent Elements ....Tetravalent Elements ....Subtotal 0.85
PyrochoreTrivalent Elements 1.40Tetravalent Elements ....Pentavalent Elements ....Hexavalent Elements ....SubtotalSi 0.30B 0.15Subtotal 0.30
Whitlockite/MonaziteP 0.10Subtotal 0.10
Hollandite/BaTi03Ba 0.45Subtotal 0.45
Total Uncompensated 1.75CompensatedPyrochlore
U (depleted or natural) 2.0Pu 1.0Other Actinides 1.0Sub total 3.0
PerovskiteCa 4.0Sub total 4.0
Total Compensated 7.0
Moles Impurity perMole of PuOz Elements or Compounds
MgF2, CaF2NaCI, KCI, MgCI2, ZnCI2, CaCI2NaO0.5, KO0.5, CuO0.5COx, SO×, NOx
Co, Fe, Mg, Ni, ZnAI, Cr, Ga,Zr, Hf, Sn
Gd, La, Y, AmCeNb, TaMo, W
SiB
P
Ba
238U
Pu233U, 235U, Np, Am
25

UCRL-ID-133089PIP-99-012
4.1.3. Product Mineralogy
The approximate phase abundances in the baseline product are given in Table 4.6.When impurities are present in the PuO2 feed, the relative abundances of the min-erals can vary substantially from that of the baseline. Within the A series samples(see Table A-1 in Appendix A), the range of observed mineral abundances variesapproximately as given in Table 4.6. The acceptable range as currently proposed isalso given in the table. Note that the acceptable range has not yet been finalized.The range could be expanded when more durability and process developmentdata are available. Based on the durability and process data currently available, itis not likely that the acceptable range will be narrowed from that given here.
As indicated in Table 4.6, the ceramic product contains a mixture of threeactinide-bearing minerals (pyrochlore, zirconolite, and brannerite), some rutile,and a trace amount of partially or unreacted actinide oxide. The primaryactinide-bearing phases all have natural mineral analogs that have survived forgeologic time periods, which suggests that they are suitable actinide host phasesfor geologic disposal. Depending upon the impurity loadings in the PuO2 feed, avariety of other phases could be present in small amounts.
4.1.3.1 Pyrochlore. Pyrochlore has a cubic structure similar to fluorite. Theempirical formula unit is given as A2B206X. The space group symmetry is Fd3mand each unit cell contains eight formula units. The coordination numbers of theA and B sites are 8 and 6, respectively.19 For the plutonium ceramic, the A sitecan be occupied by Ca+2, Gd+3, U+4, Pu+4, and H~f+4. The B site is occupied byTi+4, and the X site is occupied by 0-2.
Pyrochlore is a relatively common mineral in nature. Natural pyrochlores aregrouped into three varieties: pyrochlore (niobium-rich), microlite (tantalum-rich), and betafite (titanium- and uranium-rich).2° Of the three varieties, betafitemost closely matches the composition of the pyrochlore phase in the plutoniumceramic. Some alteration in natural betafites is observed due to loss of relativelysoluble matrix species such as NaF, KF, and CaO, but actinides are effectivelyretained by most betafites for geologic time periods up to 1.4 billion years.21 Ifsufficient alteration has occurred by depletion of the soluble matrix species, asecond stage of alteration can begin in which up to 30% of the original amountof uranium is lost. A large fraction of this uranium is retained in nearby phases.
Table 4.6 Phase Abundance in Baseline and Product Extremes.
Baseline Observed Range Acceptable RangeMineralogy (vel%) (vol%) (vo1%)Pyrochlore 80 62 - 90 >50Brannerite 12 0 - 22 0 - 50Zirconolite 0 0 - 25 0 - 50Rutile 8 0 - 16 0 - 20Actinide Oxide 0.5 0.04 - 0.6 0 - 1Other Minor Phases 0 0 - 6 0 -10
Baseline: The observed mineral abundances in the baseline product without impurities.Observed Range: The approximate observed range of mineral abundances in the product withvarious impurities.Acceptable Range: The proposed range over which the product mineralogy will be controlled.
26

UCRL-ID-133089PIP-99-012
The nominal compositions of betafite 21-23 and the plutonium pyrochlore phasesare shown in Table 4.7. Although the compositions are similar, there are somesignificant differences between the composition of the natural pyrochlores andthe pyrochlores in the plutonium ceramic. Most notably, the natural pyrochloreshave substantial amounts of niobium and/or tantalum, whereas the pyrochloresin the plutonium ceramic do not contain any of these elements. Naturalpyrochlores also contain small but significant amounts of sodium, potassium,and fluoride ions. These ions are generally the first to be depleted in naturalpyrochlores that have undergone geochemical alteration.
4.1.3.2 Zirconolite. Zirconolite has many polytypes (i.e., structural variants)24, 25The most common polytype is zirconolite-2M, which is also the polytype foundin the plutonium ceramic. Zirconolite-2M has a monoclinic structure.Zirconolite-4M is sometimes found in the plutonium ceramic, but the otherknown polytypes (zirconolite-30, zirconolite-3T, and zirconolite-6T) have not yetbeen observed in the plutonium ceramic. All of the zirconolite polytypes and thepyrochlore structure are closely related to each other by the stacking of a com-mon fundamental unit of TiO6 octahedra that forms a linked plane of hexagonaland triangular rings.23, 25 The hexagonal rings are joined to form planar layers.The polytypes differ in the way the layers are stacked. The most symmetricstacking of layers forms pyrochlore. All of the other stacking arrangements pro-duce various zirconolite polytypes.
The empirical formula unit is given as ABC207. The space group symmetry isC2/c and each unit cell contains eight formula units. The coordination numbers
Table 4.7, Nominal Composition of Plutonium Ceramic and Natural Analog Phases.
ElementNa,KCa 0.905 0.741 0.74Y, REE’ 0.217 0.147 0.08Th 0.10U 0.432 0.133 0.02Pu 0.237 0.116Zr, Hf~ 0.265 0.002 0.839 1.01Mg, Mn, Fe 0.23 0.36AI 0,037 0.05 0.181 0.04Ti 1.905 1.33 1.842 1.38Nb, Ta 1.29 0.25Pb 0.O4 O.OO3Si 0.02 0,001F 0,120 (calc) 6.964 7.76 7.093 6.94
Pyrochlore Pyrochlore Zirconolite Zirconolite BranneriteBranneritePu Natural Pu Natural Pu Natural
Ceramic Ceramic Ceramic(mole) (mole) (mole) (mole) (mole) (mole)
0.060.410.040.020.50
0.071 0.240.110 0.07
0.040.534 0.560.2120.135
0.180.050 0.021.888 1.69
0.030.15
5.849 5.53
°For the Pu ceramic Y, REE is Gd onlybFor the Pu ceramic Zr, Hf is Hf and for the natural minerals Zr, Hf is Zr with a trace of Hf.
27

UCRL-ID- 133089PIP-99-012
of the A and B sites are 8 and 7, respectively. There are three different C sites:two have a coordination number of 6 and one has a coordination number of 5.25For the plutonium ceramic, the A site can be occupied by Ca+2, Gd+3, and Pu+3.The B site can be occupied by Hf+4, Gd+3, U+4, and Pu+~, and the C sites areoccupied by Ti+4.
Zirconolite minerals are also found in nature. Natural zirconolites up to 650 mil-lion years old have been found. With the exception of metamictization, no alter-ation has been observed and the actinides and decay products were retained inthe mineral.26 The nominal compositions of natural zirconolite 26-28 and the plu-tonium zirconolite phases are shown in Table 4.7. For the most part, the compo-sitions of the natural zirconolites and the zirconolites in the plutonium ceramicare comparable.
4.1.3.3 Brannerite. The empirical formula unit of brannerite is given as AB206.Brannerite has a monoclinic structure and a space group symmetry is C2/m.There are two formula units per unit cell. Coordination numbers of the A and Bsites are both 6.29 In the plutonium ceramic, the A site can be occupied by U+4,Pu+4, and lesser amounts of Hf+4 and Gd+3. The B site is occupied’by Ti44.
Brannerites are also found in nature. Natural brannerites have not been wellstudied, but preliminary data suggests that brannerites up to 800 million yearsold are often pristine and unaltered. When alteration is observed, however, ura-nium loss can be severe. The nominal compositions of natural brannerites29-31
and the plutonium brannerite phases are shown in Table 4.7. For the most part,the compositions of the natural brannerites and the brannerites in the plutoniumceramic are comparable.
4.1.3.4 Rutile. The empirical formula unit of rutile is given as AO2 Rutile has atetragonal structure and a space group symmetry of P42/mnm. Each unit cellcontains two formula units. In the plutonium ceramic, the A site can be occupied
+4 +4by Ti and lesser amounts of Hf . Rutile does not accommodate any plutoni-um or any significant amount of uranium into its structure.
4.1.3.5 Actinide Oxide. The actinide oxides have a cubic fluorite structure. Theempirical formula unit of actinide oxide is AO2. The space group symmetry isFm-3m and each unit cell contains four formula units. The coordination numberof the A site is 8. In the plutonium ceramic, the A site can be occupied by U+4and Pu+4 and lesser amounts of Hf+4 and Gd+3.
4.1.3.6 Other Minor Phases. Depending upon the impurities present in the PuO2feed, any of the following phases could be present in small amounts in theceramic product:
¯ Glasses (calcium-aluminum-titanium-silicates)
¯ Hafnium Titanate (HfTiO4)
¯ Hollandite (BaA12Ti6016)
¯ Loveringite (CaTi21038)
¯ Magnetoplumbite (CaAl12019)
28

UCRL-ID-133089PIP-99-O 12
¯ Perovskite (CaTiO3)
¯ Pseudobrookite (A12TiOs) -Armalcolite (Mg2TiOs)
¯ Scheelite (CaWO4) - Powellite (CaMoO4)
¯ Ulvospinel (TiFe204) - Spinel (MgA1204)
¯ Whitlockite (Ca3(PO4)2) -Monazite (GdPO4).
Example end-member compositions of these minerals are given in parentheses.Of these phases, the most common in the plutonium ceramic are glasses, per-ovskites, and pseudobrookite-armalcolites.
4.1.3.7. Phase Relationships. The acceptable phase compositional range of theceramic form is an important boundary yet to be finalized for the plutoniumceramic. The boundary given in Table 4.6 is depicted in the simplified ternarydiagram in Figure 4.1. Note that the baseline ceramic has six oxide components.To reduce the six-variable system to three variables, the following assumptionsare made:
¯ UO2 and PuO2 behave similarly enough that they can be treated as oneoxide, AnO2
¯ TiO2 is always in excess so the TiO2 activity is fixed at unity
¯ Gd203 is distributed relatively evenly among the actinide-bearing phases soit is proportioned out of the phase equilibria.
Each of these assumptions reduces the variables by one, thus resulting in athree-variable system that can be plotted on the ternary diagram shown inFigure 4.1. The Baseline Precursor 1 composition is at 22.2 mol% HfO2, 77.8mol% CaO, and 0 mol% AnO2 in the figure. Addition of UO2/PuO2 moves thecomposition in a straight line toward AnO2. The intersection across the greenregion is the acceptable compositional regime as it is currently defined. Thus,between about 30 to 50 mol% AnO2 can be added to the baseline product and anacceptable product will be produced. These boundaries will be modified slightlyby the addition of impurities.
To help ensure that the immobilized plutonium is not separated from the neu-tron absorbers over time in the repository, it is important that the most abundantplutonium-bearing phases also accommodate significant quantities of the neu-tron absorbers. Although not as critical, it is more defensible in the repositorylicense application if the less abundant plutonium-bearing phases also accom-modate significant quantities of neutron absorbers. For each mineral phase thathas been observed in the plutonium ceramic, its ability to accommodate gadolin-ium, hafnium, uranium, or plutonium is summarized in Table 4.8. Data aregiven as mole percent of element in the each phase. (Note that for each phase,between 60 and 70 tool% is oxygen.) Except for the residual actinide oxide, all ofthe primary phases accommodate more neutron absorbers (gadolinium andhafnium) than plutonium. Most of the other minor phases also accommodatemore neutron absorbers (gadolinium and hafnium) than plutonium. The excep-tions are magnetoplumbite and whitlockite/monazite. Magnetoplumbite has
29

UCRL-ID-133089PIP-99-012
T = 1350°C
P1 = Precursor 1 (with Ca)A-O = Baseline Composition
"CaTiO3"CaO
qb
Perovskite..._k@
B = BranneriteH = HfTiO4Pe = PerovskitePy = PyrochloreZ = Zirconolite
ZirconolitePyrochlore
,B + Z\,+ /’oi
¯ ,tq~\," HfTi ’, ~,
\, ,. \ \ !F ’, -
"i"HfTiO4" Brannerite
HfO2 0255075100
B1072-01
Figure 4.1 Depiction of the processing regime. ¯
Table 4.8 Actinides and Neutron Absorbers in the Primary Phases.
Gd Hf U PuPrimary Phases (moi%) (mol%) (tool%) (mol%)
Pyrochlore 2.0 1.8 3.7 2.1B ranne rite 1.4 1,2 5,7 2.4Zirco nolite-2M 1.4 6,4 1,4 1.0Zirconolite-4M 1.3 4.6 2,0 1.4Rutile 0.0 2.7 0.3 0.0Actinide Oxide 1 o6 1,0 <15 >13Other Minor Phases
Glass 0.4 0.2 0.7 0.3Hafnium Titanate ~1.5 ~15 ~1.5 <0.1Hollandite 0.2 0.7 0.3 0.2Loveringite <0.1 0.8 0.5 0.1Magnetoplumbite 0.1 0.0 0.0 1.5Perovskite 1.4 0.2 0.0 1.1Pseudobrookite/Armalcolite0.0 0.2 0.1 0.0Scheelite/Powellite <0.1 <0.1 <0.1 <0.1UIvospinel/Spinel <0.1 <0.1 <0.1 <0.1Whitlockite/Monazite 2.4 0.1 0.0 2.9
"AnTi206AnO2
3O

UCRL-ID-133089PIP-99-012
very little neutron absorbers and whitlockite/monazite has almost as muchgadolinium as plutonium. Most phases that accommodate significant amountsof plutonium also accommodate significant amounts of uranium. The exceptionsare magnetoplumbite, perovskite, and whitlockite/monazite, which accommo-date plutonium but not uranium. These phases prefer trivalent actinides becausethe substitution occurs on the calcium site, and trivalent actinide ions are muchcloser in size to the Ca2+ ions than the tetravalent actinides. Substitution of plu-tonium into these phases is minimized by sintering under oxidizing conditions.
4.2 Baseline Fabrication Process
The baseline formulation could not be finalized without some definition of howthe material is to be processed. In other words, the baseline formulation and thebaseline fabrication process are not completely separable. As a result, the base-line fabrication process is an integral part of this report. The fabrication processis well developed, but most of the fabrication steps are not yet at a point todeclare them as fully developed and issue final specifications. Even though thefabrication process is not yet final, the baseline formulation given above inSection 4.1 will remain valid as long as the following four criteria are met in thebaseline fabrication process:
¯ The final fabrication process selected is not substantially different than thepreliminary process described in this section
¯ The fabricated ceramic product is at or near equilibrium conditions
¯ The redox conditions during sintering are not altered (i.e., sintering atmos-phere primarily, but could include lubricants or binders)
¯ The sintering temperature and time are not altered.
Significant changes in the fabrication process could affect feed specifications,e.g., form, particle size, and purity. The greater the deviation from equilibriumconditions in the as-fabricated ceramic product, the more the product propertiesdepend on how the product was made. This creates more processing variablesthat affect product properties. If the as-fabricated ceramic product is at or nearequilibrium conditions, only changes in feed composition, redox conditions dur-ing sintering, or sintering temperatures could significantly alter the productmineralogy.
The baseline fabrication process applies not only to the immobilization process,but also to the preparation of the precursor materials. The compositions of theprecursors have been given in Section 4.1.1. The mixing recipes for precursor,uranium oxide, and plutonium oxide are given in Sections 4.3.1 and 4.3.2.
4.2.1 Ceramic Precursor Preparation
A commercial vendor will likely supply the oxide precursors to the PlutoniumImmobilization Plant. The recommended precursor preparation process isshown in Figure 4.2. The recommended process consists of wet mixing/millingof the precursors, drying of the precursor slurry, and pulverization (i.e., sizereduction) of the dried clumps as necessary. A final calcination step is performedto partially react the precursor materials and to remove residual materials that
31

UCRL-ID-133089PIP-99-012
Ca(OH)2 I I HfO2 I
Wet Mixing/Milling
Drying
Pulverization
I CalcinationI
B1072-04
Figure 4.2 Recommended process for preparing ceramic precursors.
will be volatile during the sintering process. Because a vendor will likely supplythe precursor material, alternative preparation processes are acceptable as longas an acceptable product can be made. The process recommended here has beenused successfully numerous times on full-scale fabrications of hafnium-cerium-cerium and hafnium-cerium-uranium formulations (i.e., ceramics in which ceri-um is used as an analog for plutonium or for both plutonium and uranium) andon several full-scale hafnium-plutonium-uranium fabrications.
4.2.1.1 Wet Mixing/Milling. In this step, the precursor feeds are weighed outand ball milled wet for a minimum of I hour. To minimize potentially incompat-ible contamination, the preference is to use a zirconia milling jar and zirconiagrinding media.
4.2.1.2 Drying. In this step, the wet slurry is transferred to a tray and dried in anoven at about 110°C overnight (approximately 16 hours). Convection drying preferred over vacuum drying.
4.2.1.3 Pulverization. After the drying step, a friable cake is formed. This cakemust be size-reduced to a granular and flowable powder, which can be accom-plished by using a flake breaker followed by a disk pulverizer.
4.2.1.4 Calcination. Calcination is used to decompose compounds and impuri-ties that would release gas during the sintering process and to partially react theprecursor material. Volatile impurities include but are not limited to nitrates andvolatile salts. Partially reacting the precursor reduces the likelihood of crack for-mation during sintering. The key to calcination is to heat-treat the powdered
32

UCRL-ID-133089PIP-99-O 12
material at a temperature high enough that the gases are released, but lowenough that most of the reactivity of the powder is retained. For this precursorcomposition, calcination between 600 and 750°C for 1 hour in air is recommend-ed. The layer of powder should not be more than about 2 inches thick.
Processing of the precursors will be performed under appropriate quality assur-ance controls with limits placed on the acceptable impurities (see Table 4.5).After completion of all processing steps, the precursor materials will be pack-aged for shipment to the Plutonium Immobilization Plant. Packaging willrequire that no excess moisture or impurities enter the container.
4.2.2. Baseline Immobilization Process
The envisioned process flow diagram for the Plutonium Immobilization Plant isshown in Figure 4.3. The envisioned process has changed very little since thesummer of 1997, but will continue to be investigated over the next few years toensure that the processing parameters have been suitably optimized.
In summary, the process consists of dry milling the actinide oxides to under 20 tim,mixing/blending the milled actinides with commercially fabricated precursors,granulating (if needed) the milled/mixed powders, pressing the conditionedpowders, and sintering the pressed pellets.
When the commercially supplied precursor is received at the PlutoniumImmobilization Plant, it is anticipated that each lot of the vendor-supplied mate--rials will be analyzed to ensure that the precursors are within acceptance specifi-cations (see Section 4.1.2). The specifications have yet to be defined, but will like-ly cover the targeted chemical composition, mineral phases, impurity limits,
Organic Additives Organic Additives
Organic Additives
1 Precursor w/Ca1UO2 or U308 Precursor w/o Ca
B1072-05
AttritorMill l ,~1 AttritorMix~5min, dry I
"~1 ~5min, dry
Press I20,0001bs. 1
3.5" diameter
Additive?
I Burn-Out I> 300°C, 2 h, air }
"1
l
Granulate(If needed)
Sinter1350°C, 4 h,
air or Ar
ISinteredProduct
>
Figure 4.3 The ceramic immobilization process flow diagram attritor mill.
33

UCRL-ID-133089PIP-99-012
flowability constraints, moisture limits, and particle size of the precursor materi-als. Acceptance specifications will be similar to those currently in place for theglass frit used in the DWPF. It is anticipated that no batch of precursor materialwill be processed in the Plutonium Immobilization Plant without first undergoingacceptance testing to ensure that an acceptable product can be made.
The current process flow diagram is based on receiving PuO2 from the plutoni-um conversion processes. The PuO2 powder is expected to be almost entirely-150 mesh with reasonably well-known impurity contents. In order to minimizecompositional variations and the effects of impurities on the plutonium ceramicform associated with the incoming PuO2 feed stream, PuO2 feed streams will beblended before milling occurs and before the PuO2 is introduced into the pluto-nium immobilization line. The blended PuO2 must meet the specifications inTable 4.5 before it can be immobilized. Out-of-specification material will bereblended.
Uranium oxide (depleted or natural) will also be added in the process to fabri-cate the plutonium ceramic form. The uranium oxide to be immobilized willmost likely be from commercial fuel fabricators or from well-characterizedexcess DOE stock. The preferred form is UO2, but U308 is also acceptable.
The milling operation is necessary to size-reduce the actinide oxide feed stream,as well as the recycle feed stream. The as-received actinides, which are expectedto be nominally less than 150 lam, will require size reduction (to less than 20 wn)to assure adequate interaction during sintering. As for the recycle feed stream,the current equipment selected for crushing and grinding unacceptable pelletswilt nominally produce particles of approximately 100 grn, so further millingwill be necessary to be able to accommodate this material into the form matrix.
The equipment selected for the milling operation is the attritor mill manufac-tured by Union Process. The attritor mill is best described as a stirred ball mill. Arotational shaft stirs the media at high speed, causing shearing and impact forceson the material, resulting in size reduction and dispersion. The high speed of theattritor mill imparts a large amount of energy to the feed powder. This highenergy dramatically reduces the time required to mill--from hours to minutes.Another advantage of the attritor mill is that milling can be accomplished with acompletely dry process. The attritor mill is manufactured in various sizes toaccommodate different feed batch sizes, so scale-up of the mill should be easilyaccomplished.
During the normal operation of this equipment, a discharging aid is required.The use of the discharging aid is necessary to prevent excessive packing of thepowders on the side of the mill and in the discharge valve. Figure 4.4 shows theattritor mill discharging blended powders. Currently, 3 wt% polyolefin A-12 isbeing used as the baseline discharge aid. Polyolefin has been shown to workwell as a discharge aid and has been shown to burn out cleanly from the pellets.
For accountability purposes, the input weight of actinide oxides to the attritormill will be recorded and compared to the output weight during production. Itis anticipated that there will be a holdup of a small amount of material. Oncethis heel has formed, the discharge from the mill has been shown to be approxi-mately 100%.
34

Figure 4.4 Attritor mill discharging blending ceramicprecursor powders.
4.2.2.1 Attritor Mixing/Blending. The amount of precursors and actinide oxidesto be blended will be determined by the equations given in Section 4.3.2. If theactinide oxide also meets the feed specifications given in Section 4.1.2, acceptablemineral phases will be produced. The acceptable mineral phases are given inSection 4.1.3.
A second, larger, attritor mill has been selected to perform ceramic precursorand actinide oxide micro-blending. Studies to date have shown that blending ofprecursors and actinide oxides on a micro-scale is necessary in order to producedense and high-integrity pellets. Of the options tested (V-blender, wet ball-mill,dry ball-mill, and attritor), the attritor has been shown to be the best option formicro-scale blending. The high energy of the attritor provides excellent mixingwith minimal time required.
It is hoped that the two precursor feeds and milled actinides can be fed to theblending attritor as three separate feed streams, so additional macro-scale blend-ing equipment will not be necessary. Some of the testing results to date indicatethat this may be possible. However, additional testing will be performed in theupcoming year on a larger attritor to see if omission of the macro-scale blending
35

UCRL-ID-133089PIP-99-012
equipment will be possible. If it is shown that this is not feasible, then the use ofmacro-scale blending equipment before the attritor mixing/blending step will beinvestigated.
Testing is also planned in the upcoming year to determine if the milling andmixing/blending processes can be combined into single process, thus eliminat-ing the need for a dedicated milling attritor. The target amount of actinides withthe corresponding amount of precursors would be added to the large blendingattritor. In this attritor, the actinides would be milled and blended concurrentlywith the precursors. The elimination of an additional grinding step would alsoaid in keeping the actinide powders from becoming too small and hence moredifficult to contain.
As with the milling operations, a discharge additive is also necessary during theblending operations to assist with feed recovery from the mill. Currently, thebaseline additive for this step is also 3 wt% polyolefin (oxidized polyethylene),but studies in the upcoming year will also focus on optimizing this dischargeadditive.
As part of the process development program, the milled and blended powderswill be analyzed to ensure that an acceptable composition has been producedand that sufficient homogeneity has been obtained. Before the blended powdersare granulated, pressed and sintered, acceptability will have to be determined.The acceptability specifications will be defined as the program continues. It isuncertain at this time how often the feed will need to be analyzed in the plantfor composition and homogeneity before the granulation, pressing, and sinteringoperations can be continued. In the plant, it is expected that this sort of analysiswould be infrequent.
In addition to the precursors and the actinide oxides, a binder and/or lubricantwill also likely be added to the blending attritor during the blending steps. Thecurrent baseline binder is polyethylene glycol 8K added at 5 wt% of the totalfeed. Optimization studies with different binders have been started and will becompleted once the granulation equipment for the process is determined.Comparison studies with different equipment for powder conditioning forpressing will be performed in the upcoming year and binder testing will befinalized.
The current baseline process requires lubrication of the die set with 10 wt% oleicacid in acetone for each pellet that is pressed. However, to try to avoid externallubrication, studies in this upcoming year will look at using internal lubricantsthat can be mixed in with the powders.
4.2.2.2 Granulate. In order to condition the powders for pressing, it may be nec-essary to perform a granulation step on the blended powder. The purpose of thegranulation step will be to help with powder flowability into the die set, mini-mize dusting of the powder, and assist with even filling of the die set.Investigation of several methods of granulation was begun this past year. Thesemethods included tumbling (to help with powder agglomeration), roller com-paction of the blended powders (to create harder and more consistent size gran-ules), and fluidized bed preparation methods that sprayed the binder onto thegranules. No definitive decisions were made on the optimal process: studies inthe upcoming year will focus on defining this process step. Flowability of the
36

s
UCRL-ID-133089PIP-99-012
powder into the press is the key parameter and the requirements will be better-defined in the upcoming year.
4.2.2.3. Press. The current baseline process utilizes a 3.5-inch-diameter die forpressing the feed powders, which has been shown to produce the nominal sin-tered pellet target diameter, currently set at 2.625 inches (+0.125, -0.225). The diesize is subject to change depending on the granulation process selected for thefeed powder and the shrinkage behavior of the "green body" (i.e., pressed butnot yet sintered pellet) during sintering.
The current press configuration is for double-action pressing, which will be test-ed extensively in the upcoming year. This double-action pressing should providemore even density distribution to the green pellet than the single-action pressingcurrently used. This is expected to minimize cracking that can occur during thesintering operation.
The milled, blended, and granulated powders will be pressed at the minimumpressure required to obtain high-density peUets with the appropriate mineralphases and minimal porosity. With the current powders being produced, thenominal pressure used is 20,000 pounds force or 2,000 psi pressing pressure toproduce a 3.5-inch-diameter green pellet. A hold time of 10 seconds is currentlyused. Studies in the past have shown that the final density obtained is not depen-dent upon the pressing pressures unless pressures substantially less than 2,000psi are used. However, different granulation methods being tested may requirehigher pressing pressures, so the pressing pressure used in the plant may behigher than 2,000 psi. The final pressure used will be defined in parameter opti-mization studies once the up-front processing and conditioning steps are betterdefined. These studies will also define the acceptable tolerances for production.
From the press, the green pellets will be transferred to the sintering furnacesusing remote handling equipment. The envisioned plant design is for severalfurnaces to be available in the Plutonium Immobilization Plant so sintering ofmany pellets can be performed at one time.
The baseline sintering schedule and temperature has been defined to producehigh density "pucks," while still allowing for some residual porosity in the sin-tered pellet. This residual porosity may be needed to reduce swelling and micro-cracking due to alpha-radiation damage of the ceramic over time. The theoreticaldensity of the pellets has been defined as 5.98 g/cc, with acceptable densitiescurrently defined as greater than 90% of theoretical.
4.2.2.4. Firing Schedule. The baseline sintering temperature is 1350°C for 4 hours inair. Heating and cooling rates are currently 5°C/minute with a slower initial rateand hold at 300° to bum out the binder. The sintering time and temperature willnot change, but the ramp rates and binder burn-out schedule are still subject tochange. Laser dilatometry studies are currently being performed to better refinethis schedule. The sintering atmosphere is air, but argon could also be used afterthe binder is removed. The baseline firing schedule is depicted in Figure 4.5.
The parameters for the baseline firing schedule are given in Table 4.9 and thosefor the baseline sintering schedule are given in Table 4.10. These processes areassumed to be performed one after the other to give the overall firing schedulegiven in Figure 4.5, but they could be accomplished in two steps with the same
37

UCRL-ID- 133089PIP-99-012
Air300°CAir-/ 2 hours
/3°C/min
1350°C _
Air (or ~
7
Air (or argon)
4 hours
B1072-06
Figure 4.5 The overall baseline firing schedule.
5oC/min~O~. Air(or
result. In the plant, it is currently assumed that, to reduce the cycle time, the sin-tered samples will be removed before they cool completely to room temperature.
4.3 Mixing Recipes
In the attritor mill, a relatively pure depleted or natural UO2 feed will be blend-ed with the relatively impure PuO~ feed. The amount of UO~ added to the PuO2will depend upon how much 238Uls already present in the PuO2 feed. Depletedor natural UO2 will be added to maintain a 2-to-1 molar ratio of uranium-to-plu-
238tonium. ThO~impurity in the PuO2 will be counted as UO2 on a 1-to-1 molarbasis. NpO2, 233UO2, Z35UO2, and AmO1.5 will be counted as PuO2 on a 1-to-1molar basis. In the second attritor, the milled actinide oxides are blended withthe two precursor feed streams. The relative amount of Precursor 2 is dependentupon the amount of calcium in the PuO2 feed. The amount of Precursor 1 isdependent upon the amount of plutonium and the amount of calcium in themilled actinide oxide. The three parameters needed are defined as follows:
Table 4.9 Baseline Burn-out Schedule.Start Temp. End Temp. Duration Atmosphere
Segment (°C) (°C) (rnin)1 30 300 90 Air2 300 300 120 Air
Table 4.10 Baseline Sintering Schedule.Start Temp. End Temp. Duration Atmosphere
Segment (°C) (°C) (rain)1 300 1350 210 Air (or argon)2 1350 1350 240 Air (or argon)3 1350 300 210 Air (or argon)
38

UCRL-ID-133089PIP-99-012
Xca: Total mass of calcium in the PuO2 feed
XNF: Total mass of 238U in the PuO2 feed
XF: Total mass of plutonium in the PuO2 feed.
It is expected that the 235U, neptunium, plutonium, and americium masses willbe determined by material control and accountability (MC&A) equipment afterblending. The thorium and 238U contents will either be determined by MC&Aafter blending or will be known accurately enough from the original PuO2 feedstreams that were blended. The calcium content will need to be determinedsemi-quantitatively. Possibly it will be known well enough from the known orestimated composition in the original PuO2 feed streams that were blended, butmore likely it will need to be measured at least on a semi-routine basis. Notealso that the amounts of all the other impurities do not affect the amounts ofUO2, Precursor 1, or Precursor 2 that will be added to the processes. The result isthat the impurities are added over and above all of the other components andare not compensated for by varying the feed composition of any of the primaryprecursor constituents.
4.3.1 Attritor Mill Recipe
The amount of depleted or natural UO2 that will added to the attritor mill isgiven by the equations in Table 4.11. XF and XNF are defined above. WUO2 isdefined as follows:
Wu02: Mass of UO2 (depleted or natural) added to the attritor mill.
If U308 is used instead of UO2, multiply Wuo2 by 1.0395 to get Wu308.
Table 4.11 Mass of Depleted or Natural UO2 Added to the Attritor Mill.Baseline L0w-Pu Alternative High-Pu Alternative
WUO2 = 2.25870XF = 2.27216XF = 1.23917XF- 1.13443XNF - 1.13443XNF - 1.13443XNF
4.3.2 Attritor Mixer/Blender Recipe
The amount of Precursor 1 and Precursor 2 that will be added to the attritormixer/blender is given by the equations in Table 4.12. XF and XNF are definedabove. Wprecursor I and Wprecursor 2 are defined as follows:
¯ Wprecursor 1 : Mass of Precursor 1 (calcium-containing) to add to the attritormixer/blender.
¯ Wprecursor 2 : Mass of Precursor 2 (calcium-free) to add to the attritormixer/blender.
Precursor 1 is the primary component added to the attritor mixer/blender.Precursor 2 does not contain any calcium and is used to offset calcium that ispresent in the PuO2 feed stream.
39

UCRL-ID-133089PIP-99-012
Table 4.12 Mass of Precursor 1 and 2 Added to the Attritor Mixer/Blender.Baseline L0w-Pu Alternative High-Pu Alternative
Wprecursor 1 = 6.14187XF =6.59428XF = 4.29385XF-9.05675Xca - 9.72426Xca -9.05689Xca
Wprecursor 2 = 7"65757Xca = 8"32507Xca = 7"65770Xca
4.3.3 Conversion Factors for Other Actinides
As mentioned above, 233U, 235U, neptunium, and americium are counted asplutonium in the formulation. The substitution is on an equimolar basis, not aweight basis. Since the molecular weights of 233U, 235U, neptunium, plutonium,and americium are relatively close, not much error is introduced by substitutingon an equivalent mass basis, but the correct substitution accounting for molecu-lar weight differences is given below:
XF = Xpu + (MWpu/MW233u)X233u + (MWpu/MW235u)X235U
(MWpu/MWNp)XNp + (MWpu/MW Am)XAm
or
XF = Xpu + 1.02601X2331d + 1.01726X235U + 1.00866XNp + 0.99188XAm
(4.2)
(4.3)
The same issue exists for substitution of thorium for 238U. The correct substitu-tion accounting for molecular weight differences is given below:
XNF = X238u + (MW238u/MWTh)XTh (4.4)
or
XNF = X238U + 1.02591XTh (4.5)
For the above relationships the molecular weights are taken to be as follows:
¯ MWTh = 232.038 g/mole
¯ MWU = 238.029 g/mole
¯ MW233U = 235.0439 g/mole
¯ MW235U = 235.0439 g/mole
¯ MW238U = 238.0508 g/mole
¯ MWNp = 237.0480 g/mole
¯ MWpu = 239.1 g/mole
¯ MW4m = 241.0567 g/mole.
4o

UCRL-ID-133089PIP-99-O 12
4.3.4 Calculated Plutonium Ceramic Compositions
As an illustration of how the equations given in Tables 4.11 and 4.12 are used,they are applied to yield product compositions for the baseline formulation withfour different PuO2 feeds:
¯ Clean PuO2 with no impurities
¯ An overall average feed for the 18-tonne immobilization case
¯ An average impure oxide case
¯ An extreme case of all the impurities.
The compositions of the various feeds have been given in Table 2.1. The productcompositions calculated are given in Table 4.13. For simplicity, all the impuritieshave been grouped together. They are in the same ratio as given in Table 2.1. Asexpected, the composition calculated for clean PuO2 matches the baseline com-position shown in Table 4.1. Note that the compositions given are before sinter-ing. Some of the impurities (e.g.., chlorine, fluorine, zinc) are volatilized at thesintering temperature and will be partially or completely volatilized, thus reduc-ing slightly the total quantity of impurities in the sintered product.
Each of the compositions in Table 4.13 corresponds very closely to several of thecompositions being tested in the sample test matrix. "Clean PuO2" corresponds toA-0, "Average Feed" corresponds to B3-13, "Average Impure Oxide" correspondsto B3-17, and "Maximum All Feeds" corresponds to B3-19. To simplify sample fab-rication on the B3-13, B3-17, and B3-19 compositions, 235U, neptunium, and ameri-cium are counted as plutonium on a mole-per-mole basis and thorium is countedas 238U on a mole-per-mole basis.
41

UCRL-ID-133089PIP-99-012
Table 4.13 Product Compositions in Baseline Formulation.
Oxide
PrimaryConstituents
CaO
Hf02U02Th02U02
AverageClean Average Impure MaximumPuOz Feed Oxide All Feeds(wt%) (wt%) (wt%) (wt%)
9.952 9.374 9.008 7.88910.653 10.271 9.643 8.509
0.000 0.000 0.000 0.00123.690 22.314 21.443 18.779
PuO2
235U02 0.000 0.000 0.000 0.000NpO2 0.000 0.113 0.000 0.317PuO2 11.892 10.614 10.764 8.716Am203 0.000 0.463 0.000 0.383
Gd203 7.951 7.520 7.197 6.362TiO2 35.862 33.808 32.461 28.728
Impurities
Total Impurities* 0.000 5.523 9.484 20.316
*Impurities are in the same abundance as shown in Table 2.1 except for carbon, which has beenexcluded,
42

UCRL-ID-133089PIP-99-O 12
5. The Path Forward
5.1 Preliminary, Final, and Recommended Specifications
The specifications given in this report are divided into three categories: prelimi-nary, final, and recommended.
5.1.1 Preliminary Specifications
The preliminary specifications are still in development. However, it is assumedthat when these specifications are finalized, they will not vary dramatically fromthose given in this report. The preliminary specifications given in this report areas follows:
¯ Baseline Formulation - Feed Specifications (Section 4.1.2)
¯ Baseline Formulation - Product Mineralogy (Section 4.1.3)
¯ Baseline Fabrication Process - Baseline Immobilization Process (Section 4.2.2).
5.1.2 Final Specifications
The final specifications will remain unchanged as long as there are no majorchanges in the plutonium disposition program assumptions and as long as the pre-liminary specifications still in development do not change dramatically from thosegiven in this report. The final specifications given in this report are as follows:
¯ Baseline Formulation - Input Composition (Section 4.1.1)
¯ Mixing Recipes - Attritor Mill Recipe (Section 4.3.1)
¯ Mixing Recipes - Attritor Mixer/Blender Recipe (Section 4.3.2)
¯ Mixing Recipes - Conversion Factors for Other Actinides (Section 4.3.3).
5.1.3 Recommended Specifications
The recommended specification on the Baseline Fabrication Process - CeramicPrecursor Preparation (Section 4.2.1) is given as a reference to aid in the procure-ment specification.
5.2 Finalizing Preliminary Specifications
The specifications identified as preliminary will be finalized during the course ofthe D&T program. The milestones relevant to finalizing the preliminary specifi-cations are given below. Milestones are taken from the PlutoniumImmobilization Program D&T Plan dated August 1998.
43

UCRL-ID-133089PIP-99-012
5.2.1 The Baseline Formulation - Feed Specifications
The baseline formulation - feed specifications will be finalized in the form devel-opment task. The relevant milestones are:
¯ Provide Final Feed Specifications
¯ Provide Preliminary Product Control Model.
5.2.2 The Baseline Formulation - Product Mineralogy
The baseline formulation - product mineralogy will be finalized in the formdevelopment task. The relevant milestones are:
¯ Provide Form Summary Report for Repository License Application
¯ Provide Preliminary Product Control Model.
5.2.3 The Baseline Fabrication Process - Baseline ImmobilizationProcess
The baseline fabrication process - baseline immobilization process specifica-tions will be finalized as part of the process development task in first-stageimmobilization.
44

UCRL-ID-133089PIP-99-012
6. References
,
.
.
.
.
.
.
.
.
10.
11.
12.
13.
National Academy of Sciences, Committee on International Security andArms Control, Management and Disposition of Excess Weapons Plutonium(National Academy Press, Washington, D.C., 1994).
L. W. Gray, et al., Screening of Alternate Immobilization Candidates forDisposition of Surplus Fissile Materials, Lawrence Livermore NationalLaboratory, Livermore, CA, UCRL-ID-118819 (February 1996).
A. E. Ringwood, Safe Disposal of High Level Nuclear Reactor Wastes: A NewStrategy (Australian Nuclear University Press, Canberra, Australia andNorwalk, CT, 1978).
A. E. Ringwood, S. E. Kesson, N. G. Ware, W. Hibberson, and A. Major,"Immobilization of High Level Nuclear Reactor Wastes in SYNROC,"Nature 278 (1979), pp. 219-223.
A. E. Ringwood, "Disposal of High-Level Nuclear Wastes: A GeologicalPerspective," Mineralogical Magazine 49 (1985), pp. 159-176.
J. Campbell et al., Properties of SYNROC-D Nuclear Waste Form: A State-of-the-Art Review, Lawrence Livermore National Laboratory, Livermore, CA,UCRL-53240 (December 1981).
S. E. Kesson and A. E. Ringwood, "immobilization of HLW in SYNROC-E,"Materials Research Society Symposium Proceedings 26 (1984), pp. 507-512.
S. E. Kesson and A. E. Ringwood, "Safe Disposal of Spent Nuclear Fuel,"Radioactive Waste Management and the Nuclear Fuel Cycle 4 (1983), pp. 159-174.
A. G. Solomah, P. G. Richardson, and A. K. McIlwain, "Phase Identification,Microstructural Characterization, Phase Microanalysis and LeachingPerformance Evaluation of SYNROC-FA Crystalline Ceramic Waste Form,"Journal of Nuclear Materials 148 (1987), pp. 157-165.
V. M. Oversby, R. A. VanKonynenburg, W. E. Glassley, and P. G. Curtis,"Immobilization in Ceramic Waste Forms of the Residues from Treatment ofMixed Wastes," Materials Research Society Symposium Proceedings 333 (1994),pp. 285-292.
A. Jostsons, "Status of SYNROC Development," in Australian NuclearAssociation 9th Pacific Basin Nuclear Conference, 94/6 (May 1994).
K. L. Smith, G. R. Lumpkin, M. G. Blackford, R. A. Day, and K. Po Hart,"The Durability of SYNROC," Journal of Nuclear Materials 190 (1992), pp.287-294.
Degraded Mode Criticality Analysis of Immobilized Plutonium Waste Forms in aGeologic Repository, Rev. 01, DI#: A00000000-01717-5705-00014, CRWMSM&O, March 1997.
45

UCRL-ID- 133089PIP-99-012
14.
15.
16.
17.
18.
19.
20.
21.
22.
23.
24.
25.
26.
J. S. Allender, Program Plan for Feed Impurity Tolerance Tests: CeramicImmobilization Form for Plutonium, Westinghouse Savannah River Company,Aiken, SC, SPM-SPI-97-0049 (April 28, 1997).
H. M. MacLeod and G. Yates, "Development of Mixed-Oxide FuelManufacture in the United Kingdom and the Influence of FuelCharacteristics on Irradiation Performance," Nuclear Technology 102 (1993),pp. 3-17.
J. Edwards, J. M. Brennan, H. M. MacLeod, and C. Brown, "MOX Fuel atBNFL," The Nuclear Engineer 37 (1996), pp. 178-181.
D. Haas, A. Vandergheynst, J. VanVliet, R. Lorenzelli, and J.-L. Nigon,"Mixed-Oxide Fuel Fabrication Technology and Experience at theBelgonueleaire and CFCa Plants and Further Developments for the MeloxPlant," Nuclear Technology 106 (1994), pp. 60-81.
L. W. Gray, B. B. Ebbinghaus, T. A. Edmunds, R. A. VanKonynenburg, andD. C. Riley, Materials Disposition Acceptance Specification for the PlutoniumImmobilization Project, Lawrence Livermore National Laboratory, Livermore,CA, PIP-98-047 (August 1998).
M. A. Subramanian, G. Aravamudan, and G. V. Subba Rao, "OxidePyrochlores-A Review," Progress in Solid State Chemistry 15 (1983), pp. 55-143.
D. D. Hogarth, "Classification and Nomenclature of the Pyrochlore Group,"American Mineralogist 62 (1977), pp. 403-410.
G. R. Lumpkin and R. C. Ewing, "Geochemical Alteration of PyrochloreGroup Minerals: Betafite Group," American Mineralogist 81 (1996), pp. 1237-1248.
D. D. Hogarth, "A Study of Pyrochlore and Betafite," Canadian Mineralogist,pp. 610-633.
G. R. Lumpkin, K. P. Hart, P. J. McGlinn, and T. E. Payne, "Retention ofActinides in Natural Pyrochlores and Zirconolites," Radiochimica Acta 66167(1994), pp. 469-474.
P. Bayliss, F. Mazzi, R. Munno, and T. J. White, "Mineral Nomenclature:Zirconolite," Mineralogical Magazine 53 (1989), pp. 565-569.
T. J. White, R. L. Segall, J. L. Hutchison, and J. C. Barry, "Polytypic Behaviorof Zirconolite," in Proceedings of the Royal Society of London A 392 (1984), pp.343-358.
V. M. Oversby and A. E. Ringwood, "Lead Isotopic Studies of Zirconoliteand Perovskite and Their Implications for Long Range SYNROC Stability,"Radioactive Waste Management I (1981), pp. 289-307.
46

UCRL-ID-133089PIP-99-012
27.
28.
29.
30.
31.
R. C. Ewing and R. F. Haaker, "Zirconolites from Sri Lanka, South Africa,and Brazil," in Scientific Basis for Nuclear Waste Management, ed. S. V. Topp(1982), pp. 249-256.
F. Purtscheller and R. Tessadri, "Zirconolite and Baddeleyite fromMetacarbonates of the Oetztal-Stubai Complex," Mineralogical Magazine 49(1985), pp. 523-529.
J. T. Szymanski and J. D. Scott, "A Crystal-Structure Refinement ofSynthetic Brannerite, UTi206, and Its Bearing on Rate of Alkaline-Carbonate Leaching of Brannerite Ore," Canadian Mineralogist 20 (1982), pp.271-279.
D. F. Hewett, J. Stone, and H. Levine, "Brannerite from San BernardinoCounty, California," U.S. Geological Survey (1956), pp. 30-38.
A. Pabst, "Brannerite from California," American Mineralogist 39 (1954), pp.109-117.
47

UCRL-ID-133089PIP-99-012
l
Appendix ADetailed Test Matrices for Form Development
A.1 Series A Test Matrix
The detailed test matrix for the series A samples is given in Table A-1. Headingsare defined as follows:
Subseries. The ID for the sample, composition, or series. Each compositiontypically corresponds to between 2 and 12 samples and each series typicallycorresponds to between 2 and 12 compositions.
Sites. The sites involved in the preparation of the sample, composition, orseries. If this column is blank, the sample, composition, or series is very lowpriority at this time.
¯ Composition. A general description of the sample composition or range ofcompositions. Detailed compositions are given in Section A.3.
¯ Plutonium Req. The work with plutonium required in all samples, some sam-ples, or no samples (for the sample, composition, or series).
¯ Impurity Elements. The description of the impurity elements added to thesample, composition, or series.
¯ Impurity Amount. The total weight percent of impurities or range of impuri-ties added to the sample, composition, or series.
¯ Fab. The preparation status of the sample, composition, or series.
¯ Dens. The status of density measurements on fabricated samples.
¯ Miner. The status of sample characterization (e.g. SEM, x-ray diffraction).
¯ Dur./Ther. The status of durability testing or thermodynamic data measure-ments on the sample, composition, or series.
¯ Addnl. Smpls. The use of additional samples if needed after completion oftesting on a sample, composition, or series.
A.2. Series B Test Matrices
The detailed test matrices for the B series follow. Tables A-2 through A-8 giveprogress against the test matrices. The headings on the test matrices are thesame as those used for the A series (see Section A.1). Note that:
¯ Common Volatiles = B203, CaCI2, CaF2, KC1, PbO, MgC12, MgF2, MoO3,NaC1, WO3,’ ZnO
¯ All Volatiles = Common Volatiles + K20, Na20, P205, PbO, and ZnC12
48

UCRL-ID- 133089PIP-99-012
Table A-1 The Series A Sample Matrix.
Site(s)Sub- Composition PuSeries Req.
A-O ANSTO Baseline SPNNL,SRS,ANL
A-1 SRS Typical Impure SLLNL Oxide
A-2 LLNL ZPPR Fuel S
A-3 ANSTO Atypical SImpure Metal
A-4 LLNL Atypical Clean SMetal
A-5 ANS-I-O U/Pu Oxides S
A-6 SRS Pu Alloys SLLNL
A-7 LLNL Average SANSTO ImpuritySRS
A-8 LLNL Extreme Oxide SANSTOSRS
A-9 LLNL Intermediate SANSTO Impurity
SRSANL
ImpurityElements
None
Impurity Fab. Dens. Miner. Dur./ Addnl.Amount Ther. Smpls.
0 Y Y Y P Y
All 2.8% Y Y Y P N
MoO3, AI203
Ga203, MgO,AI203, Fe203,
Ta205, NiO, WO3
0.6% Y Y Y P N
2.2% Y Y Y P N
Ga203,ZnO, MgO 0.3% y y . Y P N
AI203, MgO, 1.0% y y Y P N
Fe203, MoO3
AI203, MgO 1.2% y y Y P N
All 1.5% y Y Y P N
All 13.0% y y Y P N
All 5.1% Y Y Y P Y
Y = Yes, N = No, S = Some, P = Partial Completion or In Progress, ! = Needed, X = Not Needed or Do Later
49

UCRblD-133089PIP-g9-012
Table A-2 Series BO Samples (Single Phases).Site(s) Composition Pu Impurity
Req. ElementsSub-Series’B0-1 LLNL
UCDANSTO
B0-2 LLNLANSTOUCD
B0-3 LLNLANSTO
B0-4 LLNLANSTO
B0-5 ANSTOLLNLSRS
B0-6 LLNLPNNLSRS
ANSTOB0-7 LLNL
SRSANSTO
BO-8 ANSTOLLNL
BO-9 ANSTOLLNLSRS
B0-10B0-11B0-12
B0-13B0-14B0-15B0-16B0-17B0-18B0-19B0-20
B0-21
B0-22B0-23B0-24B0-25B0-26B0-27B0-28B0-29
PNNLPNNL
PNNLSRS, ANL
PNNLPNNLPNNL
SRS, ANLPNNL
CaZrTi207 N None
OaHfTi207 N None
CaOeTi207 N NoneCaPuTi207 y None
CaUTi207 N None
Gd2Ti207 N None
CeTi206 N None
PuTi206y None
Impurity Fab. Dens. Miner. Dur./ Addnl.Amount Ther. Smpls.
N/A Y X Y Y N
LLNL, ANLSRSUCD
LLNL, SRSLLNL, SRSLLNL, SRS
N/A Y X Y P
N/A Y X Y P
N/A P X P
N/A Y Y Y
N/A Y X P P
N/A Y X P
N/A P X P
UTi206 N None N/A P
CaTiO3 N None N/A X
Zirconolite ss (Ce) N None N/A Y
Pyrochlore ss (Ce) N None N/A Y
Brannerite ss (Ce) N None N/A Y
Glass (Ce) N None N/A Y
Zirconolite ss (Pu) Y None N/A Y
Pyrochlore ss (Pu) Y None N/A P
Brannerite ss (Pu} Y None N/A P
Glass (Pu) y None N/A Y
Brannerite ss (Th) N None N/A Y
Perovskite ss (Pu) Y None
Perovskite ss (Ce) N None
Ca Phosphate (Pu) Y None
Ca Phosphate (Ce) N None
Rutile ss N NoneCaHf_7_r.Ti207 N None
Actinide oxide Y None
Zirc w/2+ Imp (Ce) N 2+ Impurities
Zirc w/3+ Imp (Ce) N 3+ Impurities
Pyro w/5+ Imp (Ce) N 5+ Impurities
N/A
N/AN/AN/AN/AN/AN/Amaxmaxmax
X
XXPPYX
X P
y y p Xy y p X
Y P PX Y XY P
XY P
XX
X Y P N
B0-30 LLNL, SRS Pyro w/6+ Imp (Ce) N 6+ impurities max~{ = Yes, N = No, S = Some, P = Partial Completion or In Progress, ! = Needed, X = Not Needed or Do Later
50

UCRL-ID- 133089PIP-99-O 12
Table A-3 Series B1 Samples (Near Equilibrium).
Sub- Site(s)SeriesB1-1 LLNL
ANSTO A-O (Pu)B1-2 LLNL
ANSTO A-O (Th)B1-3 LLNL A-9 (Pu)
ANSTOB1-4 LLNL A-9 (Th)
ANSTOB1-5 ANSTO B3-1B1-6 ANSTO B3-1B1-7 B3-2B1-8 B3-2B1-9 ANSTO B3-3B1-10 ANSTO B3-3B1-11 ANSTO B3-4B1-12 ANSTO B3-4B1-13 ANSTO B3-9B1-14 ANSTO B3-9B1-15 ANSTO B3-11B1-16 ANSTO B3-11B1-17 LLNL B3-13B1-18 LLNL B3-13B1-19 LLNL B3-17B1-20 LLNL B3-17B1-21 LLNL B3-19B1-22 LLNL
Y = Yes, N = No,
Composition PuReq.
Impurity Impurity Fab. Dens Miner Dur./ Addnl.Elements Amount. Ther. Smpls.
Y None N/A Y Y p
N None N/A Y Y yY None N/A Y Y p
N None N/A Y Y y
(Pu) Y None N/A(Th) N None N/A(Pu) Y None N/A(Th) N None N/A(Pu) Y None N/A(Th) N None N/A(Pu) Y None N/A(Th) N None N/A(Pu) Y None N/A(Th) N None N/A(Pu) Y None N/A(Th) N None N/A(Pu) Y None N/A(Th) N None N/A(Pu) Y None N/A(Th) N None N/A(Pu) Y None N/A
B3-19 (Th) N None N/AS = Some, P = Partial Completion or In
Y Y PY Y YXXYY Y YYY Y YI
Y Y
Y Y
Progress, ! = Needed, X = Not Needed or Do Later
51

UCRL-ID-133089PIP-99-012
Table A-4 Series B2 Samples (Equilibrium Phase Diagram).
Sub- Site(s) Composition Pu Impurity Impurity Fab. Dur./ Dens Miner
Series Req. Elements Amount. Ther.
B2-1 LLNL CaTiO3-CeTi206-HfTi04N None N/A t
ANL X?B2-2 CaTiO 3_ThTi206-HfTi04N None N/A
B2-3 LLNL CaTiO3.UTi206-HfliO4N None N/A
ANLB2-4 .LLNL CaTiO 3-P uTi206"Hfli04Y None N/A
ANL N/A N/A N/AB2-5 CaZrTi~O7.Gd2Ti207N None N/A X
B2-6 LLNL CaHfli2OT-Gd2TI207N None N/A Y X P X
ANSTOB2-7 LLNL CaHffi2OT-CaCeT{207-
ANSTO Gd2Ti207 N None N/A t
B2-8 CaHfli20/-CaThTi2Oz-Gd2Ti207 N None N/A X?
B2-9 LLNL CaHf-[i207-CaUTi207-
ANSTO Gd~Ti207 N None N/A !
B2-10 LLNL CaHfTi207_CaPuTi207_y None N/A !
ANSTO 6d2Ti201 N/AB2-11 CaO_Z-rO2.TiO2 N None N/A X N/A N/A
B2-12 ANSTO CaO-HfO2Ti02 N None N/A t
LLNL 1B2-13 ANSTO CaO-OeO2-Ti02 N None N/A .
LLNL X?B2-14 CaO.ThO2-TiO2 N None N/A
B2-15 ANSTO CaO-U O)-TiO,,2 N None N/A !
B2-16 ANSTO CaO-PuO-2-Tiu2 Y None N/A !
y = Yes, N = No, S =SotTte, P = Partial Completion or In Progress, ! = Needed, X = Not Needed or Do Later
Addnl.Smpls.
N/AY
N/A
52

UCRL-ID-133089pIP-99-O 12
Table A-5 Series B3 Samples (Process and Compositional Extremes).
Site(s) Composition Pu Impurity Impurity Fab.Sub-SeriesB3-IB3-2B3-3 ANL
PNNLSRS
B3-4 -ANLSRS
B3-5 LLNLB3-6 LLNLB3-7 LLNL
ANLSRSPNNL
B3-8 LLNLANLSRS
B3-9 ANLB3-I0 ANL
SRSB3-I I ANLB3-12 ANL
SRSB3-13 LLNL
ANLSRS
B3-14 LLNLANLSRS
B3-15 LLNLB3-16 LLNL
ANLSRS
B3-17 ANLB3-18 ANL
LLNLB3-19 ANLB3-20 ANL
Req. Elements Amount.
-95% Pyrochlore (Pu) Y None N/A X
Low in Gd and Hf (Pu) Y None N/A X
7_irconolite-rich (Pu) Y None N/A Y
Brannerite-rich (Pu) Y None N/A Y
95% Pyrochlore (Ce) N None N/A Y
Low in Gd and Hf (Ce) N None N/A Y
Zirconolite-rich (Ce) N None N/A Y
Brannerite-rich (Ce) N None
~10% Perovskite (Pu) y Excess CaO
~10% Perovskite (Ce) N Excess CaO
~10% Phosphate (Pu) P205
~10% Phosphate (Ce) P205Average impurity (Pu) All
N/A Y
-2%-2%
-3.5%
~3.5%~6.6 %
Average Impurity (Ce) All ~6.7 % !
Am Enriched (Pu/Am) Y Am203 ~0.6% X
Am Enriched (Ce/Nd) N Nd203 ~0.4% i
Avg. Impure Oxide (Pu) Y AllAvg. Impure Oxide (Ce) N All
Maximum Impurity (Pu) All
Maximum Impurity (Ce) All
~10.6 %~10.9 %
~25.0 %~25] % I
Dens Miner Dur./ Addnl.Ther. Smpls.
y p y X
y p y X
y y X Xy ¥ X Xy y P X
y y X X
LLNLy = Yes, N = No, S = Some, P = Partial Completion or In Progress, ! = Needed, X = Not Needed or Do Later
53

UCRL-ID-133089PIP-99-012
"FableSub- Site(s)Series
B4-S1 LLNLB4-$2 LLNLB4-$3 LLNLB4-$4 LLNLB4-$5 LLNLB4-$6 LLNLB4-$7 LLNLB4-$8 LLNLB4-$9 LLNLB4-$10 LLNLB4-$11 LLNLB4-$12 LLNLB4-$13 LLNLB4-$14 LLNLB4-$15 LLNLB4-$16 LLNLB4-$17 LLNLB4-$18 LLNLB4-$19 LLNLB4-$20 LLNLB4-$21 LLNLB4-$22 LLNLB4-$23 LLNLB4-$24 LLNLB4-$25 LLNLB4-$26 LLNLB4-$27 LLNLB4-$28 LLNLB4-$29 LLNLB4-$30 LLNLB4-$31 LLNLB4-$32 LLNLB4-$33 LLNLB4-$34 LLNL
ANLB4-$35 LLNL
Y =Yes, N
A-6 Series B4-S Samples (Impurity Saturation).Composition Pu Impurity Impurity Fab. Dens Mine Dur./
Req. Elements Amount Ther.A-O S AIO1.5 Saturated Y y Y XA-O Y AmO1.5 Saturated X N/A N/A N/AA-O N B01.5 Saturated Y y pA-O N BaO Saturated Y y pA-O S CaO Saturated Y X Y XA-O N CeO2 Saturated X N/A N/A N/AA-O N CrO1.5 Saturated Y y pA-O N CuO0.5 Saturated Y XA-O N FeO1.5 Saturated Y X Y XA-O S GaOl.5 Saturated Y y pA-O N GdO1.5 Saturated X N/A N/A N/AA-O N HfO2 Saturated X N/A N/A N/AA-O N KO0.5 Satu rated !A-O N LaO1.5 Saturated X N/A N/A N/AA-O S MgO Saturated Y X Y XA-O N MnO1.5 Saturated Y XA-O N
MOO2+xSaturated Y y p
A-O N NaO0.5 Saturated Y y pA-O N Nb02.5 Saturated Y y pA-O N NiO Saturated Y XA-O N NdO1.5 Saturated X N/A N/A N/AA-O Y NpO2 Saturated X N/A N/A N/AA-O S P02.5 Saturated Y X Y XA-O N PbO Saturated !A-O S SiO2 Saturated Y y pA-O N SnO2 Saturated iA-O N Ta02.5 Satu rated Y y pA-O N ThO2 Saturated X N/A N/A N/AA-O N TiO2 Saturated X N/A N/A N/AA-O N V01.5 Saturated Y y Y XA-O N
W02+xSaturated Y y p
A-O N ZnO Saturated Y XA-O N ZrO2 Saturated X N/A N/A N/A
A-O N C Satu rated Y y y XA-O N CaF2 Satu rated Y y Y X
= No, S = Some, P = Partial Completion or In Progress, ! = Needed, X = Not Needed or Do Later
AddnlSmpls.
Y w/PuN/A
Y w/PuN/A
X
N/AN/A
N/AY w/Pu
N/AN/A
Y w/Pu
N/AN/AX
N/A
XX
54

UCRL-ID-133089PIP-99-012
Table A-7. Series B4-E Samples (Impurity Equivalence).
Sub- Site(s) Composition Pu Impurity Impurity Fab,Series Req. Elements Amount.B4-E1 ANSTO A-0 S +2 As Needed YB4-E2 ANSTO A-0 S +3 As Needed YB4-E3 ANSTO A-0 S +4 As Needed YB4-E4 ANSTO A-0 S +6 As Needed YB4-E5 ANSTO A-0 S +5 As Needed YB4-E6 ANSTO A-0 S +4 Actinde As Needed YB4-E7 ANST0 A-0 S Variable As Needed PB4-E8 ANSTO A-0 S +3/+4=
+2/+5 As Needed XB4-E9 ANSTO A-0 S +2/+4=
+3/+3 As Needed XB4-E10 ANSTO A-0 S +3/+4=
+2/+5 As Needed XB4-E11 ANSTO A-0 S +2/+2=
+1/+3 As Needed XB4-E12 ANSTO A-0 S +2/+4=
+4/+2 As Needed X
Dens Miner Dur./Ther.
Y YY YY YY YY Y
Y = Yes, N = No, S = Some, P = Partial Completion or In Progress, ! = Needed, X = Not Needed or Do Later
Addnl.Smpls.
Table A-8 Series B4-V Samples (Impurity Volatility).
Sub- Site(s) Composition Pu ImpuritySeries Req. ElementsB4-VI SRS A-0 N CommonB4-V2 SRS B3-3/7 N CommonB4-V3 SRS B3-4/8 N CommonB4-V4 SRS A-0 S AllB4-V5 SRS B3-3/7 S AllB4-V6 SRS B3-4/8 S All
Impurity Fab. Dens Miner Dur./ Addnl.Amount. Ther. Smpls.
Fixed (0.600) Y Y Y X YFixed (0.600) Y Y Y X YFixed (0,600) Y Y Y X Y
Variable XVariable XVariable X
Y = Yes, N = No, S = Some, P = Partial Completion or In Progress, ! = Needed, XCommon Volatiles = B203, CaCI2, CaF2’ KC1, PbO, MgC12, MgF2, MOO3, NaCI,All Volatiles = Common Volatiles + K20, Na20’ P205, PbO, and ZnCI2
= Not Needed or Do Later
WO3, ZnO
55

UCRL-ID-133089PIP-99-012
A.3. Detailed Compositional Descriptions
Tables A-9 through A-14 give the detailed compositions of the various samplesreferred to in the A and B test series matrices.
Table A-9 Series B5 Samples (Sintering Aids).
Sub- Site(s) Composition Impurity Impurity Fab. Dens Miner Dur./Addnl.Series Req. Elements Amount. Ther. Smpls.
B5-1 ELNLSRS A-O N NaOH <3% Y Y P
B5-2 LLNLSRS A-O N NaF <3% Y Y Y X X
B5-3 LLNLSRS A-O N Na2SO4 <3% Y Y P
B5-4 LLNLSRS A-O N i3aO <3% Y Y P
B5-5 LLNLSRS A-O N CaF2 <3% X?
B5-6 LLNLSRS A-O N AI203 <3% Y Y Y X X
B5-7 LLNLSRS A-0 N B203 <3% Y Y Y X X
B5-8 LLNLSRS A-0 N P205 <3% Y Y Y X X
B5-.9 LLNLSRS A-0 N SiO2 <3% Y Y Y X X
B5-10 LLNLSRS A-0 S Mix <3% X N/A N/A N/A N/A
B5-11 LLNLSRS A-0 N Na2CO3 <3% Y Y P
Y = Yes, N = No, S = Some, P = Partial Completion or In Progress, ! = Needed, X = Not Needed orDo Later
56

UCRL-ID-133089PIP-99-O 12
Table A-10 Detailed Compositions for A Series Samples.
A-0 A-1 A-2 A-3 A-4(wt%) (wt%) (wt%) (wt%) (wt%)
Base Feed Materials
A-5 A-6 A-7 A-8 A-9(wt%) (wt%) (wt%) (wt%)
CaO 9.95 9.67 9.89 9.73 9.92 9.85 9.83 9.80TiO2 35.87 34.88 35.64 35.08 35.77 35.50 35.43 35.34HfO2 10.65 10.35 10.58 10.41 10.62 10.54 10.52 10.49Gd203 7.95 7.73 7.90 7.77 7.93 7.87 7.85 7.83UO2 23.69 23.03 23.54 23.17 23.63 23.45 23.4 23.34PuO2 11.89 11.56 11.81 11.63 11.86 11.77 11.75 11.71Impurities
AI203 0.63 0.20 0.22 0.11 1.04 0.32MgO 0.19 0.23 0.02 0.46 0.18 0.13CaCI2 0.37 0.16Ga203 1.27 0.14 0.14Fe203 0.17 0.14 0.16 0.08Cr203 0.04 0.02 0.02NiO 0.08 0.09 0.04CaF2 0.21 0.12K20 0.15 0.04 0.07Na20 0.16 0.06MoO2 0.05 0.44 0.30 0.11SiO2 0.51 0.19Ta205 0.05 0.15 0.06B203 0.04WO2 0.14 0.06ZnO 0.11 0.01Total 100,0 100.0 100.0 100.0 100.0 100.0 100.0 100.0
8.65 9.4431.20 34.049.26 10.116.91 7.54
20.60 22.4810.34 11.28
1.59 0.500.87 0.442.19 0.66
0.570.50 0.150.13 0.080.33 0.131.30 0.441.05 0.320.47 0.140.47 0.281.50 0.460.64 0.190.34 0.171.64 0.49
0.07100.0 100.0
57

UCRL-ID-133089PIP-99-012r
Table A-11 Detailed Compositions for B0 Series Samples (B0-19 to B0-23).
B0-11 B0-12 B0-13 B0-14 B0-15 B0-16 B0-17(wt %) (wt %) (wt %) (wt %) (wt %) (wt %) (wt %)
zircon01ite pyrochl0re brannerite glass zirconolite pyrochlore branneritess (Ce) ss (Ce) ss (Ce) (Ce) ss (Pu) ss (Pu) ss (Pu)
Base Feed Materials
CaO 10.481 10.393 13.20 10.198 9.942TiO2 34.533 38.495 42.197 8.15 33.601 36.825 37.758HfO2 44.259 10.080 2.779 1.38 43.064 9.643 2.487Gd203 2.117 8.303 2.393 1.07 2.060 7.943 2.141UO2 1.892 24.739 32.084 2.69 1.841 23.666 28.709PuO2 7.396 11.880 28.815ThO2CeO2 4.826 7.885 20.445 1.56Impurities
AI203 1.786 19.67 1.738MgO 1.32Ga203 2.57Fe203 0.45K20 0.66Na20 3.37MOO.2 0.105 0.105 0.102 0.44 0.102 0.100 0.091P205 2.69SiO2 35.30B203 5.47Total 100.00 100.00 100,00 99.99 100,00 100.00 100.00
B0-18(wt %)glass(P.)
13.088.081.371.062.672.43
19.491.312.550.450.653.340.442.6734.995.42
100.00
Table A-12 Detailed Compositions for B0 Series Samples (B0-19 to B0-23).
B0-19(wt%)
branneritess (Th)
Base Feed Materials
CaOTiO2 38.043Hf02 2.506Gd203 2.157U02 28.926Pu02Th02 28.276Ce02Impuri~,ies
MoO2 0.092P205
B0-20 B0-21 B0-22 B0-23(wt%) (wt%) (wt%) (wt%)
perovskite perovskite Ca-phosphate Ca-phosphatess (Pu) ss (Ce) (Pu) (Ce)
30.693 31.819 26.515 28.97351.129 53.004 2.072 2.2641.442 1.495 1.004 1.0976.873 7.125 13.465 14.7130.173 0.179 0.332 0.3629.690 23.227
6.378
33.386
16.112
36.480
Total 100.00 100.00 100.00 100.00 100.00
58

UCRL-ID-133089PIP-99-012
Table A-13 Detailed Compositions for B3 Series Samples (B3-1 to B3-8).
B3-1 B3-2 B3-3 B3-4 B3-5 B3-6 B3-7 B3-8(wt%) (wt%) (wt%) (wt%) (wt%) (wt%) (wt%) (wt%)
95% (Pu) Low in Gd Zirconolite Brannerite 95% (Co) Low in Gd Zirconolite Braoneritepyrochlore & Hf (Pu) rich (Pu) rich (Pu) pyrochlore & Hf (Co) rich (Co) rich (Co)Base Feed Materials
Ca0 9.999 9.654 9.236 5.837 10.484 10.267 9.570 6.127TiO2 34.530 33.472 33.846 36.989 36.204 35.596 35.072 38.829HfO2 11.933 6.268 24.209 9.920 12.511 6.666 25.086 10.413Gd203 7.749 3.758 6.600 6.320 8.125 3.996 6.839 6.634UO2 23.129 30.502 15.404 27.956 24.250 32.438 15.962 29.346PuO2 12.659 16.347 9.573 12.978Ce02 8.427 11.038 6.298 8.650Impurities
AI203 1.132 1.173Total 100.00 100.00 100.00 100.00 100.00 100.00 100.00 100.00
Table A-14 Detailed Compositions for B3 Series Samples (B3-9 to B3-12, B3-15, & B3-16).
B3-9(wt%)
10% (Pu)perovskite
Base Feed Materials
CaOTiO2HfO2Gd203UO2PuO2CeO2Am203Nd203Impurities
P205Total 100.00
B3-10 B3-11 B3-12 B3-15 B3-10(wt%) (wt%) (wt%) (wt%) (wt%)
10% (Co) 10% (Pu) 10% (Pu) Am enrich. Am enrich.perovskite phosphate phosphate (Pu/Am) (Ce/Nd)
12.068 12.639 11.608 12.188 9.952 10.42736.19 37.901 32.483 34.105 35.862 37.57310.884 11.399 9.688 10.172 10.653 11.1617.661 8.023 8.502 8.927 7.951 8.33020.833 21.818 21.354 22.420 23.113 24.21612.362 13.026 11.892
8.22 8.683 7.9100.577
3.339 3.506100.00 100.00 100.00 100.00
0.383
100.00
59

UCRL-ID-133089PIP-99-012
r
Table A-15 Detailed Compositions for B3 Series Samples (B3-13, B3-14, & B3-17 to B3-20).
B3-13 B3-14 B3-17 B3-18 B3-19 B3-20(wt%) (wt%) (wt%) (wt%) (wt%) (wt%)Average Average Avg. Imp. Avg. Imp. Maximum MaximumImp. (Pu) Imp. (Ce) Oxide (Pu) Oxide (Ce) Oxide (Pu) Oxide (Ce)Base Feed MaterialsCaO 8.300 8.654 7.920 8.244 3.185 3.298TiO2 33.804 35.246 32.461 33.789 28.725 29.749HfO2 10.270 10.708 9.643 10.037 8.508 8.812Gd203 7.519 7.840 7.197 7.491 6.361 6.588UO2 22.312 23.263 21.443 22.320 18.777 19.446PuO2 11.200 10.764 9.426CeO2 0.184 7.606 0.144 7.264 0.231 6.437Impurities
AI203 0.723 0.753 2.437 2.537 1.307 1.354B203 0.101 0.106 0.176 0.183 0.216 0.224BaO 0.143. 0.149 0.122 0.127 0.436 0.451
CaCI2 0.667 0.695 1.114 1.159 .1.687 1.747Cr203 0.050 0.052 0.151 0.157 0.174 0.181Cu20 0.117 0.122 0.000 0.000 0.262 0.271CaF2 1.025 1.068 0.731 0.761 5.361 5.552FeO 0.187 0.195 0.513 0.534 0.635 0.657Ga203 0.387 0.404 0.000 0.000 1.119 1.159K20 0.225 0.234 0.962 1.002 0.834 0.864La203 0.017 0.018 0.024 0.025 0.175 0.181MgO 0.433 0.452 0.979 1.019 3.249 3.365MnO 0.000 0.000 0.000 0.000 0.008 0.008MoO2 0.161 0.168 0.175 0.183 0.278 0.288Na20 0.232 0.242 0.388 0.403 0.277 0.287NiO 0.086 0.090 0.292 0.304 0.296 0.307Nd203 0.291 0.303 0.000 0.000 1.278 1.323P205 0.006 0.006 0.000 0.000 0.138 O. 143PbO 0.516 0.538 0.000 0.000 1.000 1.035SiO2 0.880 0.918 2.139 2.227 4.918 5.093SnO2 0.006 0.006 0.000 0.000 0.025 0.026Ta205 0.080 0.083 0.224 0.233 0.646 0.669WO2 0.017 0.018 0.000 0.000 0.221 0.229ZnO 0.060 0.063 0.000 0.000 0.244 0.253ZrO2 0.000 0.000 0.000 0.000 0.002 0.002Total 100.00 100.00 100.00 100.00 100.00 100.00
6o

UCRL-ID-133089PIP-99-012
Appendix BList of AcronymsANL
ANSTO
BEI
BNFL
DOE
DOE-DP
DOE-EM
DOE-MD
DOE-NE
DWPFEDS
EPA
FY
HIP
HLWHUP
LLNL
MC&AMOX
NDE
NRC
OCRWM
PIPPNNL
R&D
RCRA
RD&T
REE
SEI
SEM
SPFT
SRS
SYNROC
TEM
Argonne National Laboratory
the Australian Nuclear Science Technology Organization
backscatter electron image
British Nuclear Fuels Limited
Department of Energy
Department of Energy Offices of Defense Programs
Department of Energy Environmental Management
Department of Energy Materials Disposition Program
Department of Energy Nuclear Energy
Defense Waste Processing Facility
energy dispersive spectrometryEnvironmental Protection Act
Fiscal Year
hot isostatic pressing
high level wastehot uniaxial pressing
Lawrence Livermore National Laboratorymaterial control and accountability
mixed oxide (fuel)nondestructive evaluation
Nuclear Regulatory CommissionOffice of Civilian Radioactive Waste Management
Plutonium Immobilization Plant
Pacific Northwest National Laboratory
research and development
Resource Conservation and Recovery Act
research, development, and testing
rare earth element
secondary electron image
scanning electron microscopy
single-pass flow-through
Savannah River Site
synthetic rock
transmission electron microscopy
61